0025
0050
0075
0100
0125
0525*
0575*
0135
0145
0155
0165
0160
0260
0267
0280
0286
0288
0287
0289
0291
0293
0292
0294
0311
0313
0312
0314
0316
0318
0317
0319
0336
0338
0337
0339
0341
0343
0342
0344
0361
0363
0362
0364 037
0
0356
0358
0357
0359
0351
0353
0352
0354
0331
0333
0332
0334
0306
0308
0307
0309 033
00301
0303028
5 0302
0304
0191
0193
0192
0194
0216
0218
0217
0219
0230
0236
0238
0237
0239
0235
0241
0243
0242
0244
0415*
0445*
0431
0433
0432
0434
0470*
0465*
0451
0453 046
0*
0420*
0406
0408*040
5 0407
0409*
0440*
0426
0427
0170 018
7
0189
0180 018
2
0184
0215
0202
0204 021
0
0190
0185
0205
0430
0530*
0540*
0535*
0545*
0455
0500*
0380*
0385
0395*
Sprin
g Bran
ch
STAT
ELIN
ERD
ZONE X
ZONE A
ZONE X
ZONE A
ZONE X
ZONE X
JACK
SON
COUN
TY
Jackson CountyUnincorporated Areas
285256
36 31 32
25 30 29
24 19 20
13 18
17
12 7 8
R. 5
W.R.
4 W.
ZONE A
ZONE A
ESCAWTAWPA RIVER
ESCAWTAWPA RIVER
MOBI
LECO
UNTY
ZONE A
ZONE X
ZONE X
ZONE A
JACK
SON
COUN
TY
MOBI
LECO
UNTY
MISS
ISSI
PPI
ALAB
AMA
FLOOD HAZARD INFORMATION IS NOT SHOWN ON
TOWNSHIP 5 SOUTH, RANGE 4 WEST.WITHIN TOWNSHIP 5 SOUTH, RANGE 5 WEST ANDNOTE: MAP AREA SHOWN ON THIS PANEL IS LOCATED
BIG CREEK
ZONE A
BIG CREEK
THIS MAP IN AREAS OUTSIDE OF JACKSON COUNTY
1110000 FT 1115000 FT 1120000 FT 1125000 FT
390000 FT
395000 FT
400000 FT
405000 FT
363000mE 364000mE 365000mE 366000mE 367000mE 368000mE
3382000mN
3383000mN
3384000mN
3385000mN
3386000mN
3387000mN
3388000mN
88°26'15"30°37'30"
88°22'30"30°37'30"
88°26'15"30°33'45" 88°22'30"
30°33'45"
JOINS PANEL 0125
JOINS PANEL 0241 JOINS PANEL 0242
JOIN
S PA
NEL 0
230
JACKSON COUNTY,MISSISSIPPIAND INCORPORATED AREAS
JACKSON COUNTY 285256 0235 G
PANEL 0235G
FIRMFLOOD INSURANCE RATE MAP
PANEL 235 OF 575(SEE MAP INDEX FOR FIRM PANEL LAYOUT)CONTAINS:COMMUNITY NUMBER PANEL SUFFIX
Notice to User: The Map Number shown below should be usedwhen placing map orders; the Community Number shown aboveshould be used on insurance applications for the subjectcommunity. MAP NUMBER28059C0235G
EFFECTIVE DATEFederal Emergency Management Agency
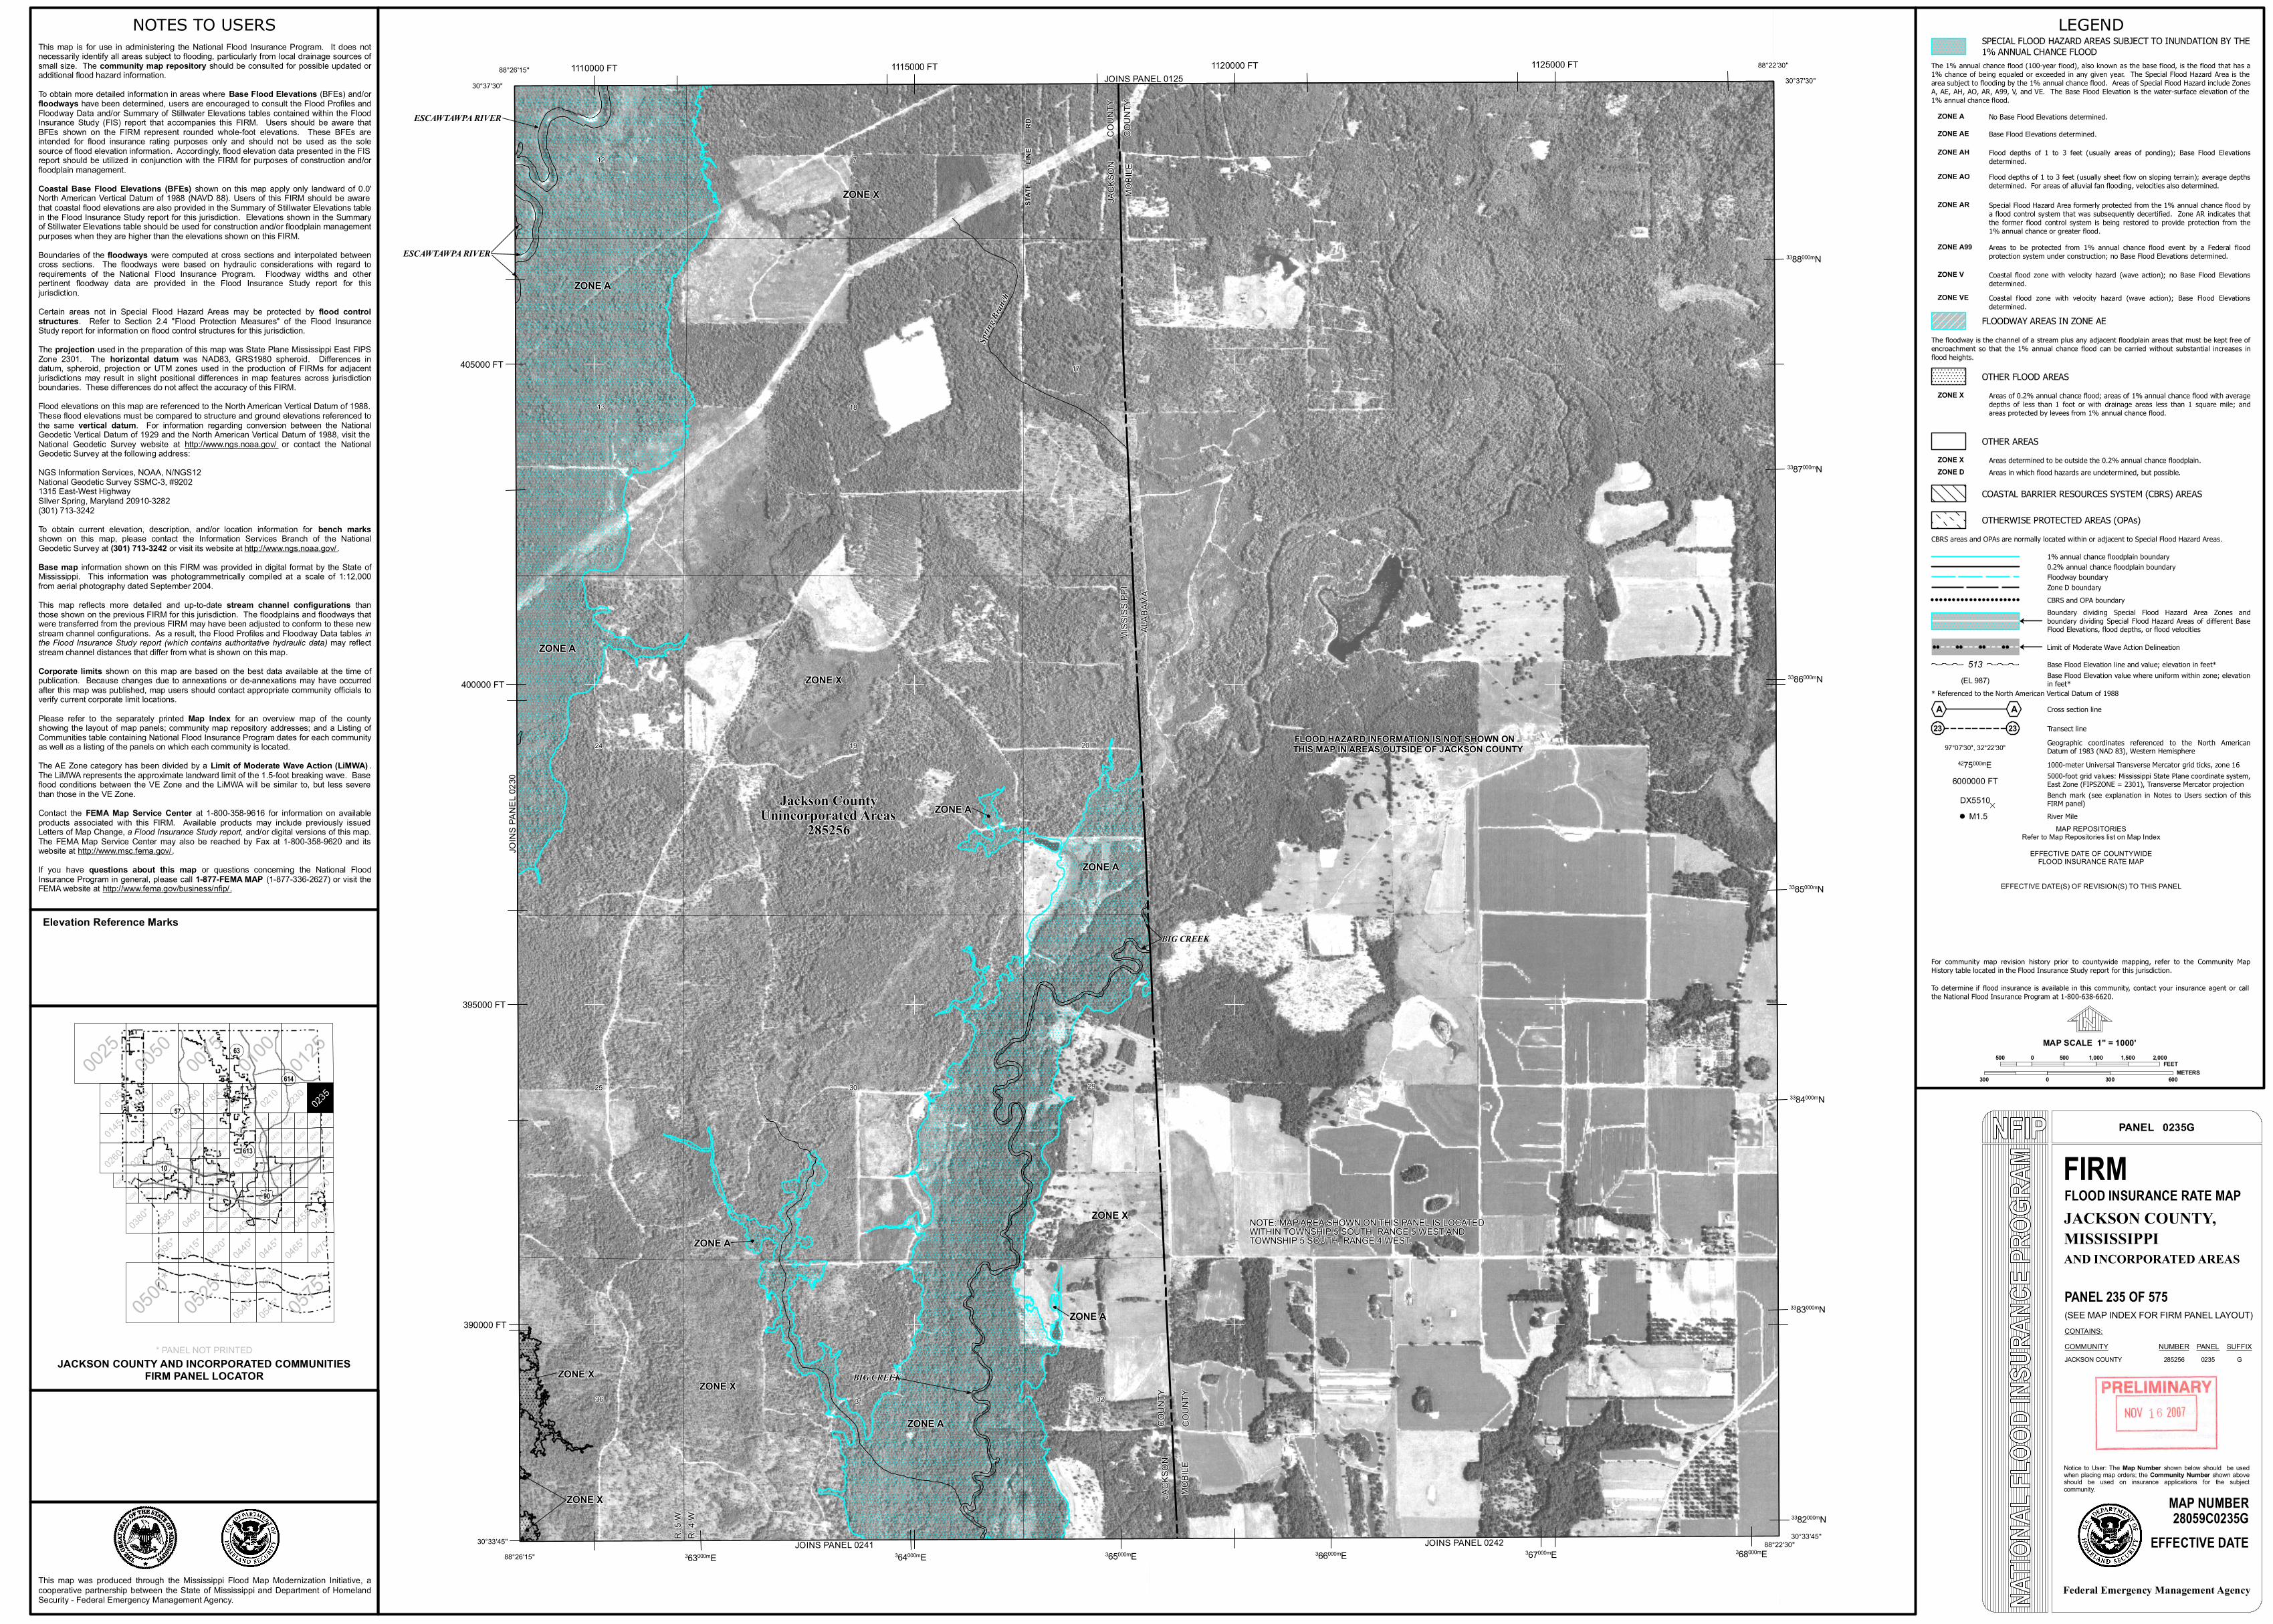
LEGENDSPECIAL FLOOD HAZARD AREAS SUBJECT TO INUNDATION BY THE1% ANNUAL CHANCE FLOOD
The 1% annual chance flood (100-year flood), also known as the base flood, is the flood that has a1% chance of being equaled or exceeded in any given year. The Special Flood Hazard Area is thearea subject to flooding by the 1% annual chance flood. Areas of Special Flood Hazard include ZonesA, AE, AH, AO, AR, A99, V, and VE. The Base Flood Elevation is the water-surface elevation of the1% annual chance flood.
ZONE A No Base Flood Elevations determined.ZONE AE Base Flood Elevations determined.
ZONE AH Flood depths of 1 to 3 feet (usually areas of ponding); Base Flood Elevationsdetermined.
ZONE AO Flood depths of 1 to 3 feet (usually sheet flow on sloping terrain); average depthsdetermined. For areas of alluvial fan flooding, velocities also determined.
ZONE AR Special Flood Hazard Area formerly protected from the 1% annual chance flood bya flood control system that was subsequently decertified. Zone AR indicates thatthe former flood control system is being restored to provide protection from the1% annual chance or greater flood.
ZONE A99 Areas to be protected from 1% annual chance flood event by a Federal floodprotection system under construction; no Base Flood Elevations determined.
ZONE V Coastal flood zone with velocity hazard (wave action); no Base Flood Elevationsdetermined.
ZONE VE Coastal flood zone with velocity hazard (wave action); Base Flood Elevationsdetermined.
FLOODWAY AREAS IN ZONE AEThe floodway is the channel of a stream plus any adjacent floodplain areas that must be kept free ofencroachment so that the 1% annual chance flood can be carried without substantial increases inflood heights.
OTHER FLOOD AREASZONE X Areas of 0.2% annual chance flood; areas of 1% annual chance flood with average
depths of less than 1 foot or with drainage areas less than 1 square mile; andareas protected by levees from 1% annual chance flood.
OTHER AREASZONE X Areas determined to be outside the 0.2% annual chance floodplain.ZONE D Areas in which flood hazards are undetermined, but possible.
COASTAL BARRIER RESOURCES SYSTEM (CBRS) AREAS
OTHERWISE PROTECTED AREAS (OPAs)CBRS areas and OPAs are normally located within or adjacent to Special Flood Hazard Areas.
1% annual chance floodplain boundary0.2% annual chance floodplain boundaryFloodway boundaryZone D boundaryCBRS and OPA boundaryBoundary dividing Special Flood Hazard Area Zones andboundary dividing Special Flood Hazard Areas of different BaseFlood Elevations, flood depths, or flood velocities
For community map revision history prior to countywide mapping, refer to the Community MapHistory table located in the Flood Insurance Study report for this jurisdiction.
To determine if flood insurance is available in this community, contact your insurance agent or callthe National Flood Insurance Program at 1-800-638-6620.
NOTES TO USERS
500 0 500 1,000 1,500 2,000FEET
300 0 300 600METERS
MAP SCALE 1" = 1000'
JACKSON COUNTY AND INCORPORATED COMMUNITIESFIRM PANEL LOCATOR
10
90
57
613
63
614
Elevation Reference Marks
This map is for use in administering the National Flood Insurance Program. It does notnecessarily identify all areas subject to flooding, particularly from local drainage sources ofsmall size. The community map repository should be consulted for possible updated oradditional flood hazard information.To obtain more detailed information in areas where Base Flood Elevations (BFEs) and/orfloodways have been determined, users are encouraged to consult the Flood Profiles andFloodway Data and/or Summary of Stillwater Elevations tables contained within the FloodInsurance Study (FIS) report that accompanies this FIRM. Users should be aware thatBFEs shown on the FIRM represent rounded whole-foot elevations. These BFEs areintended for flood insurance rating purposes only and should not be used as the solesource of flood elevation information. Accordingly, flood elevation data presented in the FISreport should be utilized in conjunction with the FIRM for purposes of construction and/orfloodplain management.Coastal Base Flood Elevations (BFEs) shown on this map apply only landward of 0.0'North American Vertical Datum of 1988 (NAVD 88). Users of this FIRM should be awarethat coastal flood elevations are also provided in the Summary of Stillwater Elevations tablein the Flood Insurance Study report for this jurisdiction. Elevations shown in the Summaryof Stillwater Elevations table should be used for construction and/or floodplain managementpurposes when they are higher than the elevations shown on this FIRM.Boundaries of the floodways were computed at cross sections and interpolated betweencross sections. The floodways were based on hydraulic considerations with regard torequirements of the National Flood Insurance Program. Floodway widths and otherpertinent floodway data are provided in the Flood Insurance Study report for thisjurisdiction.Certain areas not in Special Flood Hazard Areas may be protected by flood controlstructures. Refer to Section 2.4 "Flood Protection Measures" of the Flood InsuranceStudy report for information on flood control structures for this jurisdiction.The projection used in the preparation of this map was State Plane Mississippi East FIPSZone 2301. The horizontal datum was NAD83, GRS1980 spheroid. Differences indatum, spheroid, projection or UTM zones used in the production of FIRMs for adjacentjurisdictions may result in slight positional differences in map features across jurisdictionboundaries. These differences do not affect the accuracy of this FIRM.Flood elevations on this map are referenced to the North American Vertical Datum of 1988.These flood elevations must be compared to structure and ground elevations referenced tothe same vertical datum. For information regarding conversion between the NationalGeodetic Vertical Datum of 1929 and the North American Vertical Datum of 1988, visit theNational Geodetic Survey website at http://www.ngs.noaa.gov/ or contact the NationalGeodetic Survey at the following address:NGS Information Services, NOAA, N/NGS12National Geodetic Survey SSMC-3, #92021315 East-West HighwaySIlver Spring, Maryland 20910-3282(301) 713-3242To obtain current elevation, description, and/or location information for bench marksshown on this map, please contact the Information Services Branch of the NationalGeodetic Survey at (301) 713-3242 or visit its website at http://www.ngs.noaa.gov/ .Base map information shown on this FIRM was provided in digital format by the State ofMississippi. This information was photogrammetrically compiled at a scale of 1:12,000from aerial photography dated September 2004.This map reflects more detailed and up-to-date stream channel configurations thanthose shown on the previous FIRM for this jurisdiction. The floodplains and floodways thatwere transferred from the previous FIRM may have been adjusted to conform to these newstream channel configurations. As a result, the Flood Profiles and Floodway Data tables inthe Flood Insurance Study report (which contains authoritative hydraulic data) may reflectstream channel distances that differ from what is shown on this map.Corporate limits shown on this map are based on the best data available at the time ofpublication. Because changes due to annexations or de-annexations may have occurredafter this map was published, map users should contact appropriate community officials toverify current corporate limit locations.Please refer to the separately printed Map Index for an overview map of the countyshowing the layout of map panels; community map repository addresses; and a Listing ofCommunities table containing National Flood Insurance Program dates for each communityas well as a listing of the panels on which each community is located.The AE Zone category has been divided by a Limit of Moderate Wave Action (LiMWA) .The LiMWA represents the approximate landward limit of the 1.5-foot breaking wave. Baseflood conditions between the VE Zone and the LiMWA will be similar to, but less severethan those in the VE Zone.Contact the FEMA Map Service Center at 1-800-358-9616 for information on availableproducts associated with this FIRM. Available products may include previously issuedLetters of Map Change, a Flood Insurance Study report, and/or digital versions of this map.The FEMA Map Service Center may also be reached by Fax at 1-800-358-9620 and itswebsite at http://www.msc.fema.gov/.If you have questions about this map or questions concerning the National FloodInsurance Program in general, please call 1-877-FEMA MAP (1-877-336-2627) or visit theFEMA website at http://www.fema.gov/business/nfip/.
MAP REPOSITORIESRefer to Map Repositories list on Map Index
EFFECTIVE DATE OF COUNTYWIDEFLOOD INSURANCE RATE MAP
EFFECTIVE DATE(S) OF REVISION(S) TO THIS PANEL
River MileM1.5
Bench mark (see explanation in Notes to Users section of thisFIRM panel)DX5510
6000000 FT 5000-foot grid values: Mississippi State Plane coordinate system,East Zone (FIPSZONE = 2301), Transverse Mercator projection
23 Transect line
A A Cross section line* Referenced to the North American Vertical Datum of 1988
Limit of Moderate Wave Action Delineation
513 Base Flood Elevation line and value; elevation in feet*(EL 987) Base Flood Elevation value where uniform within zone; elevation
in feet*
2397°07'30", 32°22'30" Geographic coordinates referenced to the North American
Datum of 1983 (NAD 83), Western Hemisphere4275000mE 1000-meter Universal Transverse Mercator grid ticks, zone 16
This map was produced through the Mississippi Flood Map Modernization Initiative, acooperative partnership between the State of Mississippi and Department of HomelandSecurity - Federal Emergency Management Agency.
* PANEL NOT PRINTED
Recommended