
Esquizofrenia, cerebro y neuroimagen, lo que todavía no sabemos
Edith Pomarol-Clotet
What has brain imaging contributed to schizophrenia research?
‘Since the advent of modern neuroimaging techniques, the number of studies of the pathophysiological changes of schizophrenia has dramatically increased, with more than 1000 reports published in the past 10 years.
Structural brain imaging studies have shown a subtle, almost universal, decrease in grey matter, enlargement of ventricles, and focal alteration of white matter tracts.’
fMRI studies show abnormalities in the brain response to cognitive tasks, with an abnormal network response characterised by both hyperactivity and hypoactivity in different brain regions.’
(van Os & Kapur, the Lancet, 2009)
Imaging approaches to schizophrenia
Structural brain abnormality– CT and MRI brain imaging– Voxel-based morphometry (VBM)– Diffusion tensor imaging (DTI)
Functional brain abnormality– Functional imaging at rest– Functional imaging during task performance– Connectivity analysis
Biochemical abnormality– Imaging of dopamine neuronal function– Imaging of glutamate neuronal function (not yet
performed in schizophrenia)
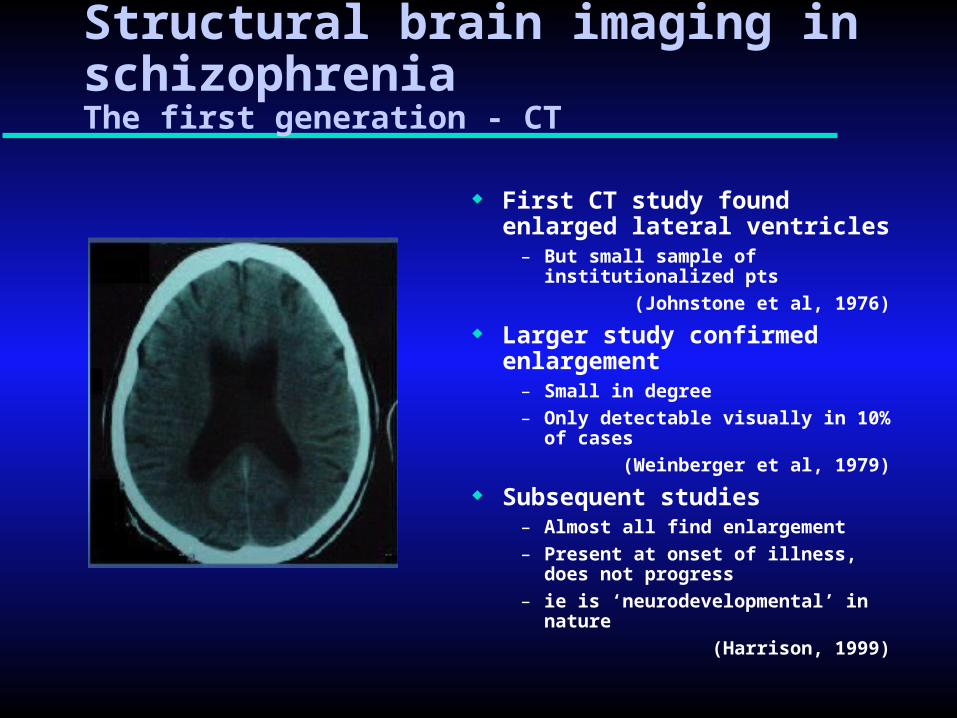
Structural brain imaging in schizophreniaThe first generation - CT
First CT study found enlarged lateral ventricles
– But small sample of institutionalized pts
(Johnstone et al, 1976)
Larger study confirmed enlargement
– Small in degree
– Only detectable visually in 10% of cases
(Weinberger et al, 1979)
Subsequent studies – Almost all find enlargement
– Present at onset of illness, does not progress
– ie is ‘neurodevelopmental’ in nature
(Harrison, 1999)
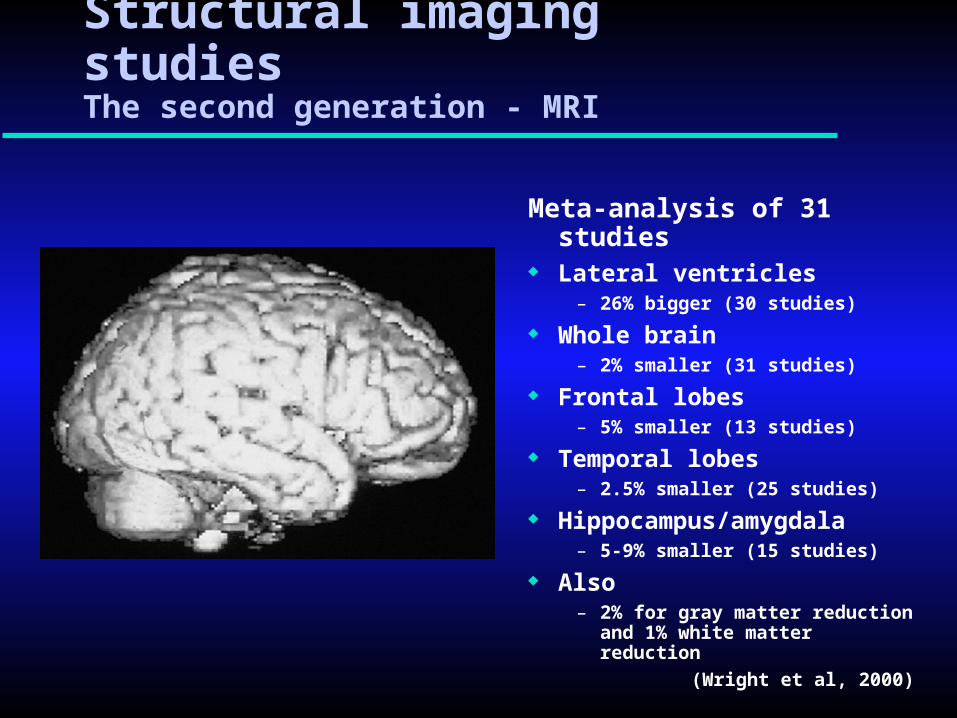
Structural imaging studiesThe second generation - MRI
Meta-analysis of 31 studies Lateral ventricles
– 26% bigger (30 studies)
Whole brain– 2% smaller (31 studies)
Frontal lobes– 5% smaller (13 studies)
Temporal lobes– 2.5% smaller (25 studies)
Hippocampus/amygdala– 5-9% smaller (15 studies)
Also– 2% for gray matter reduction and
1% white matter reduction
(Wright et al, 2000)
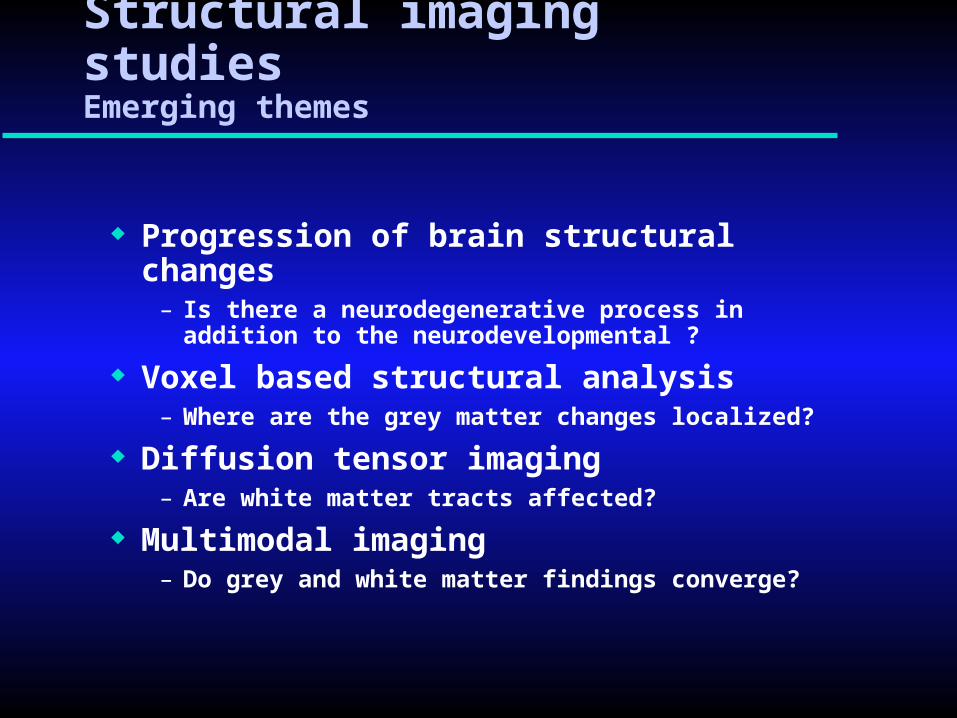
Structural imaging studiesEmerging themes
Progression of brain structural changes– Is there a neurodegenerative process in addition to the
neurodevelopmental ?
Voxel based structural analysis– Where are the grey matter changes localized?
Diffusion tensor imaging– Are white matter tracts affected?
Multimodal imaging– Do grey and white matter findings converge?
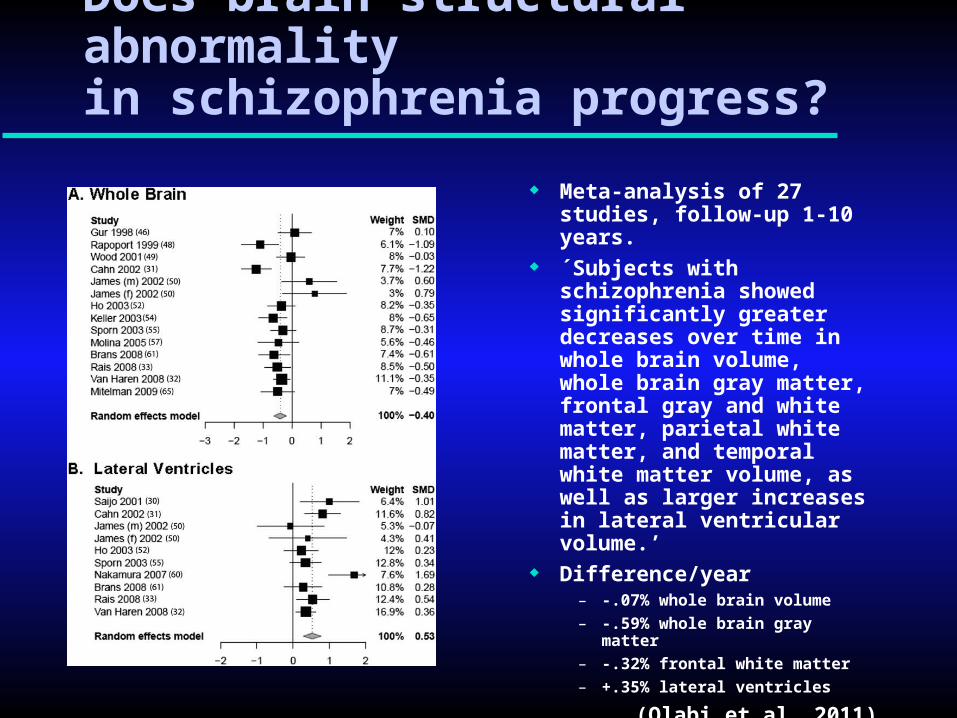
Does brain structural abnormality in schizophrenia progress?
Meta-analysis of 27 studies, follow-up 1-10 years.
´Subjects with schizophrenia showed significantly greater decreases over time in whole brain volume, whole brain gray matter, frontal gray and white matter, parietal white matter, and temporal white matter volume, as well as larger increases in lateral ventricular volume.’
Difference/year – -.07% whole brain volume
– -.59% whole brain gray matter
– -.32% frontal white matter
– +.35% lateral ventricles
(Olabi et al, 2011)
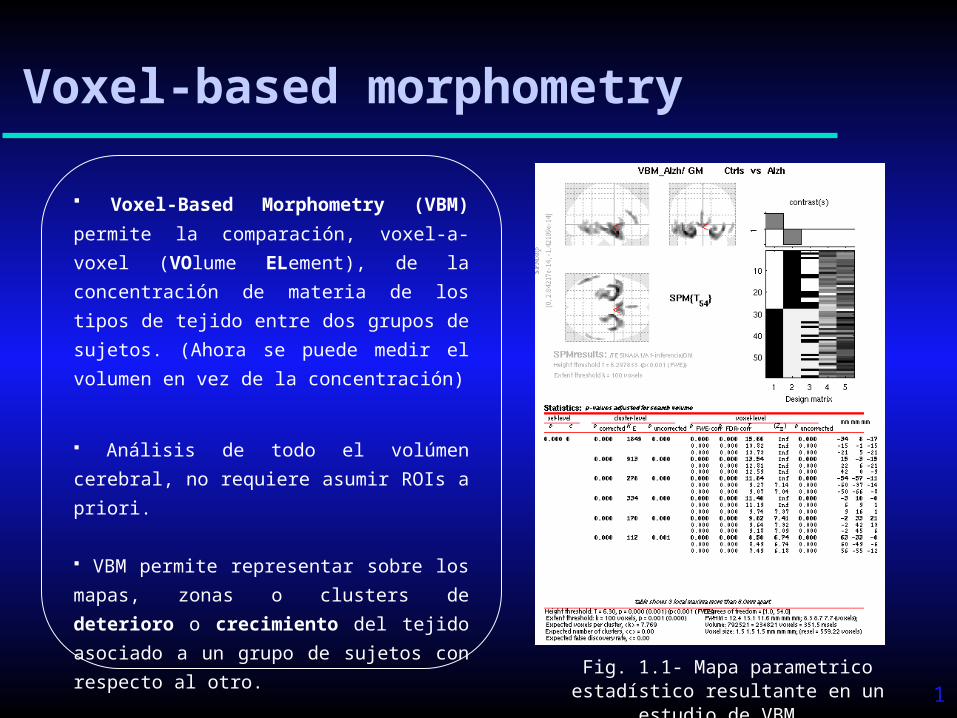
Fig. 1.1- Mapa parametrico estadístico resultante en un estudio de VBM. 1
Voxel-Based Morphometry (VBM) permite la
comparación, voxel-a-voxel (VOlume
ELement), de la concentración de materia de
los tipos de tejido entre dos grupos de sujetos.
(Ahora se puede medir el volumen en vez de la
concentración)
Análisis de todo el volúmen cerebral, no
requiere asumir ROIs a priori.
VBM permite representar sobre los mapas,
zonas o clusters de deterioro o crecimiento
del tejido asociado a un grupo de sujetos con
respecto al otro.
Voxel-based morphometry
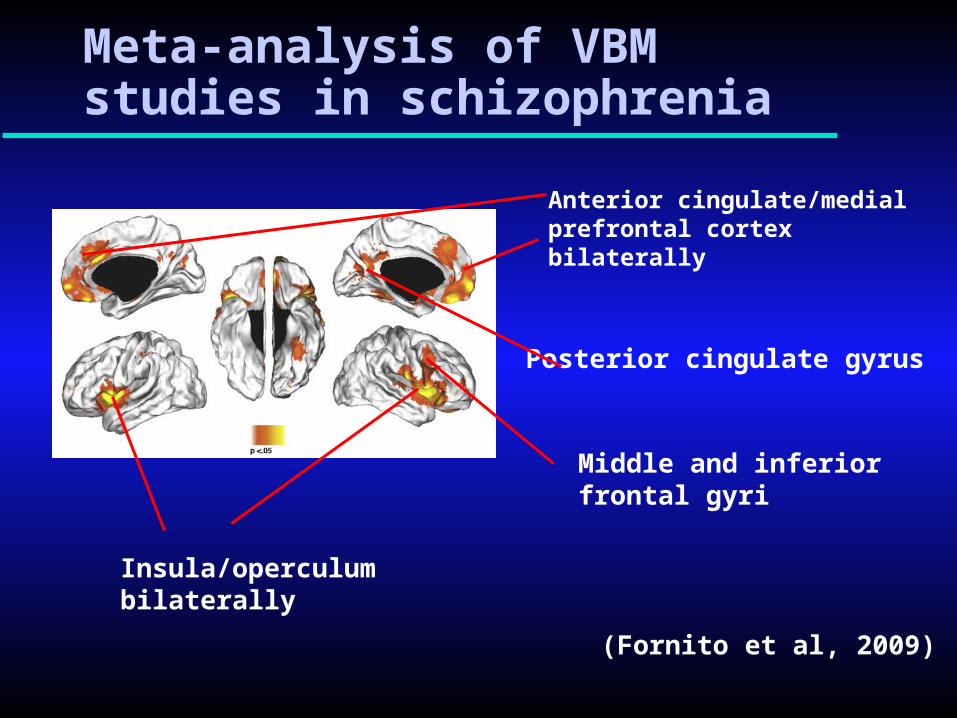
Meta-analysis of VBM studies in schizophrenia
(Fornito et al, 2009)
Anterior cingulate/medial prefrontal cortex bilaterally
Insula/operculumbilaterally
Middle and inferior frontal gyri
Posterior cingulate gyrus
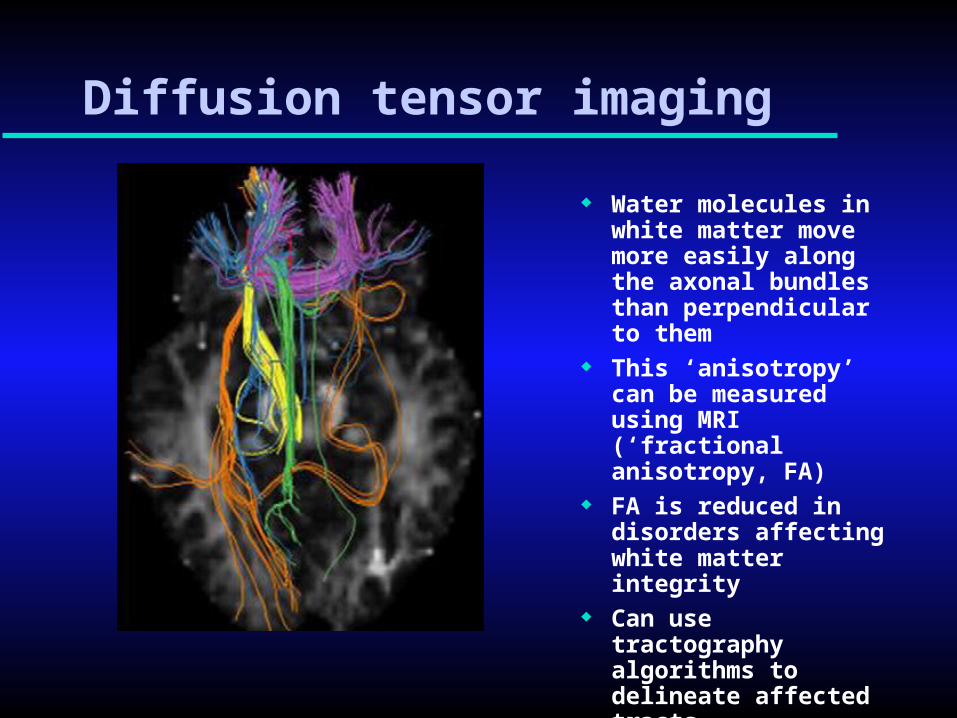
Diffusion tensor imaging
Water molecules in white matter move more easily along the axonal bundles than perpendicular to them
This ‘anisotropy’ can be measured using MRI (‘fractional anisotropy, FA)
FA is reduced in disorders affecting white matter integrity
Can use tractography algorithms to delineate affected tracts
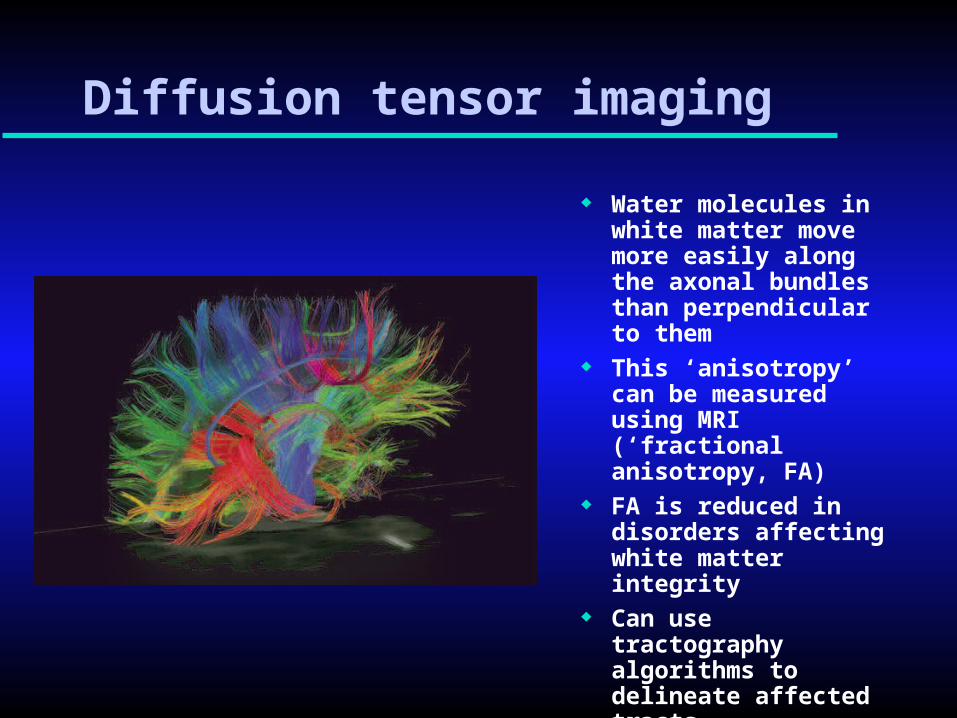
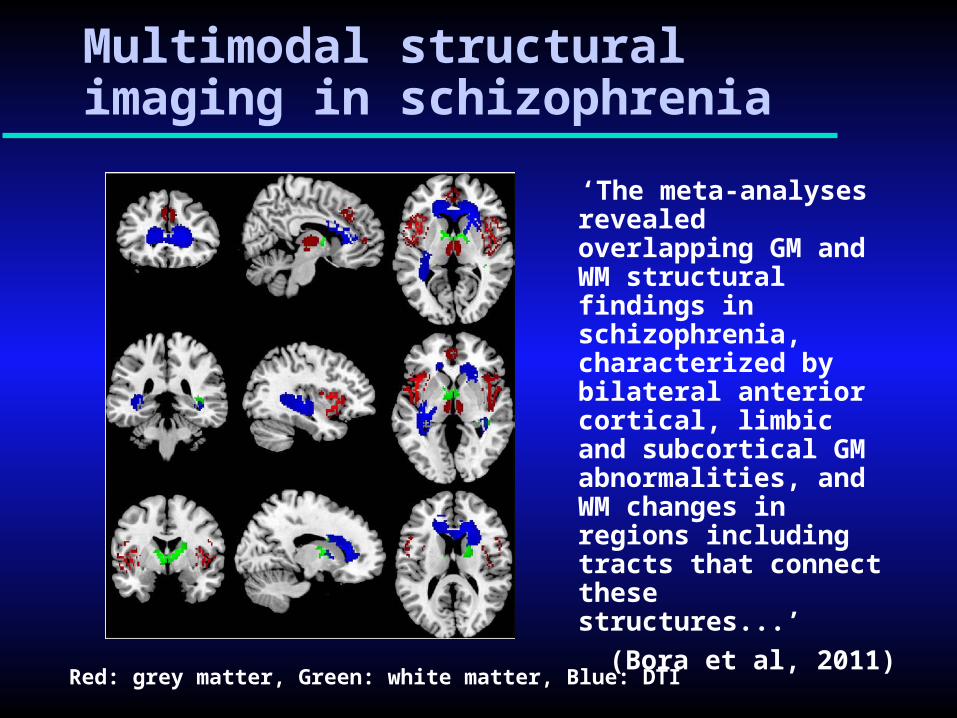
Multimodal structural imaging in schizophrenia
Red: grey matter, Green: white matter, Blue: DTI
‘The meta-analyses revealed overlapping GM and WM structural findings in schizophrenia, characterized by bilateral anterior cortical, limbic and subcortical GM abnormalities, and WM changes in regions including tracts that connect these structures...’
(Bora et al, 2011)
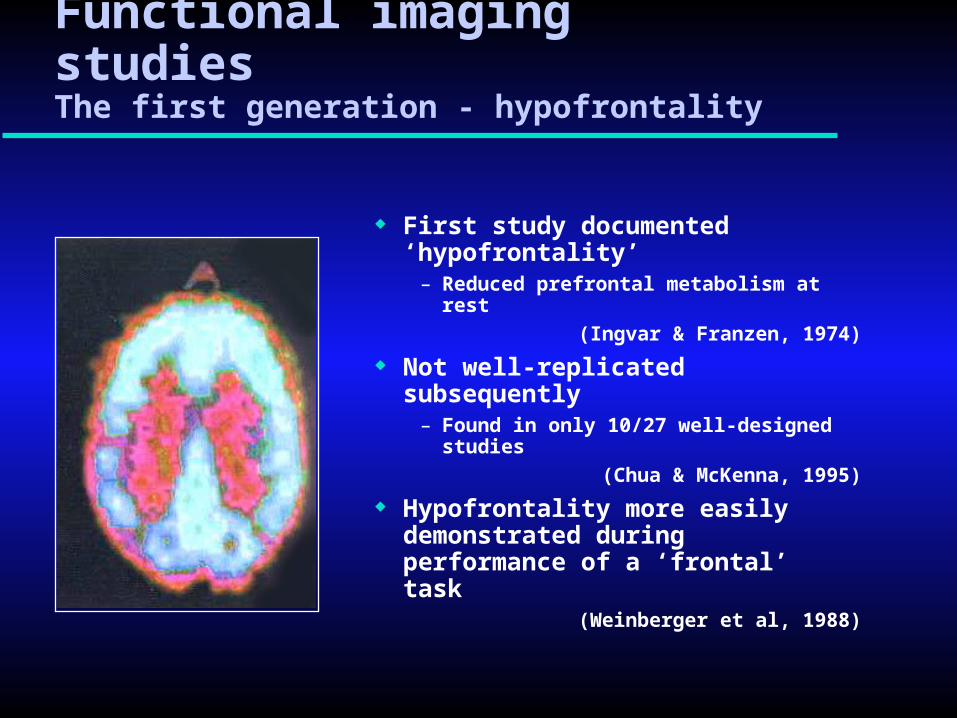
Functional imaging studiesThe first generation - hypofrontality
First study documented ‘hypofrontality’
– Reduced prefrontal metabolism at rest
(Ingvar & Franzen, 1974)
Not well-replicated subsequently– Found in only 10/27 well-designed
studies
(Chua & McKenna, 1995)
Hypofrontality more easily demonstrated during performance of a ‘frontal’ task
(Weinberger et al, 1988)
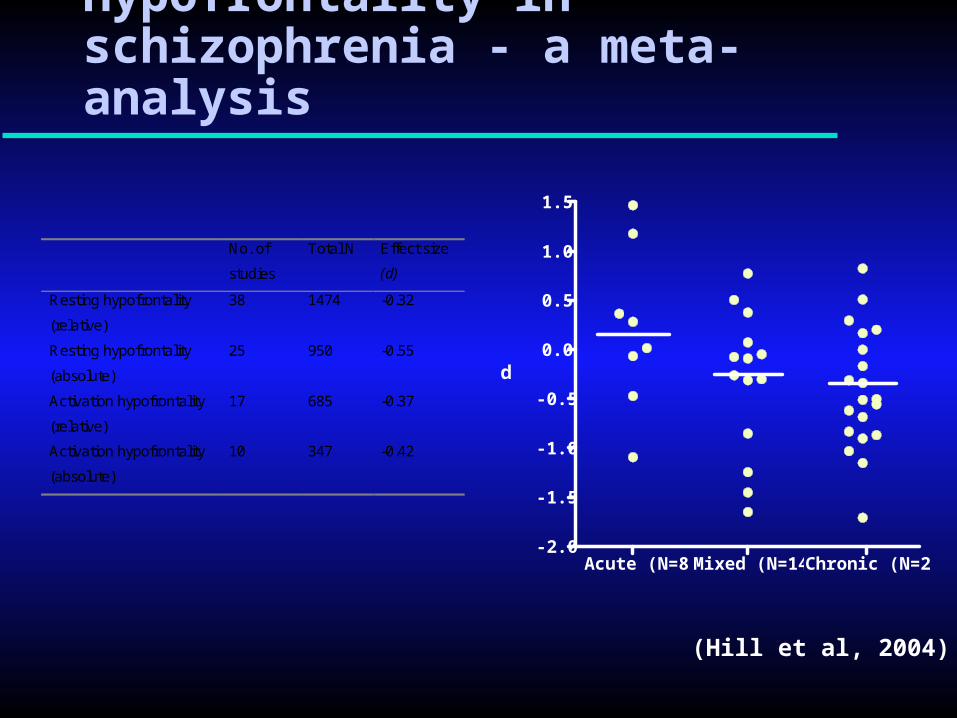
Hypofrontality in schizophrenia - a meta-analysis
No. of
studies
Total N Effect size
(d)
Resting hypofrontality
(relative)
38 1474 -0.32
Resting hypofrontality
(absolute)
25 950 -0.55
Activation hypofrontality
(relative)
17 685 -0.37
Activation hypofrontality
(absolute)
10 347 -0.42
Acute (N=8) Mixed (N=14)Chronic (N=20)-2.0
-1.5
-1.0
-0.5
0.0
0.5
1.0
1.5
d
(Hill et al, 2004)
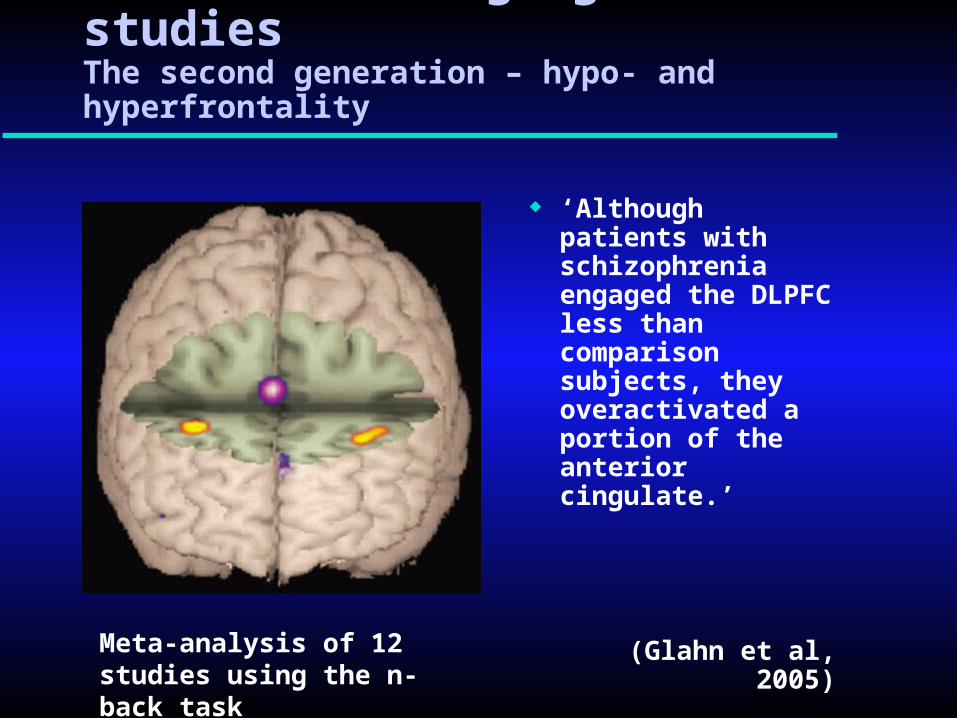
Functional imaging studiesThe second generation – hypo- and hyperfrontality
‘Although patients with schizophrenia engaged the DLPFC less than comparison subjects, they overactivated a portion of the anterior cingulate.’
(Glahn et al, 2005)
Meta-analysis of 12 studies using the n-back task
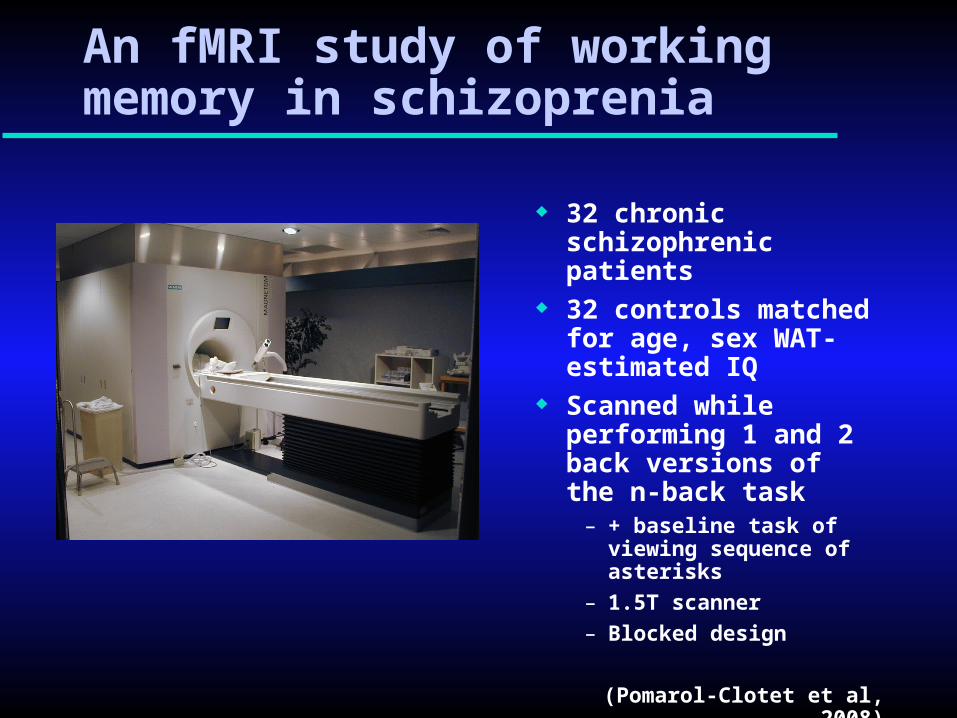
32 chronic schizophrenic patients
32 controls matched for age, sex WAT-estimated IQ
Scanned while performing 1 and 2 back versions of the n-back task
– + baseline task of viewing sequence of asterisks
– 1.5T scanner
– Blocked design
(Pomarol-Clotet et al, 2008)
An fMRI study of working memory in schizoprenia
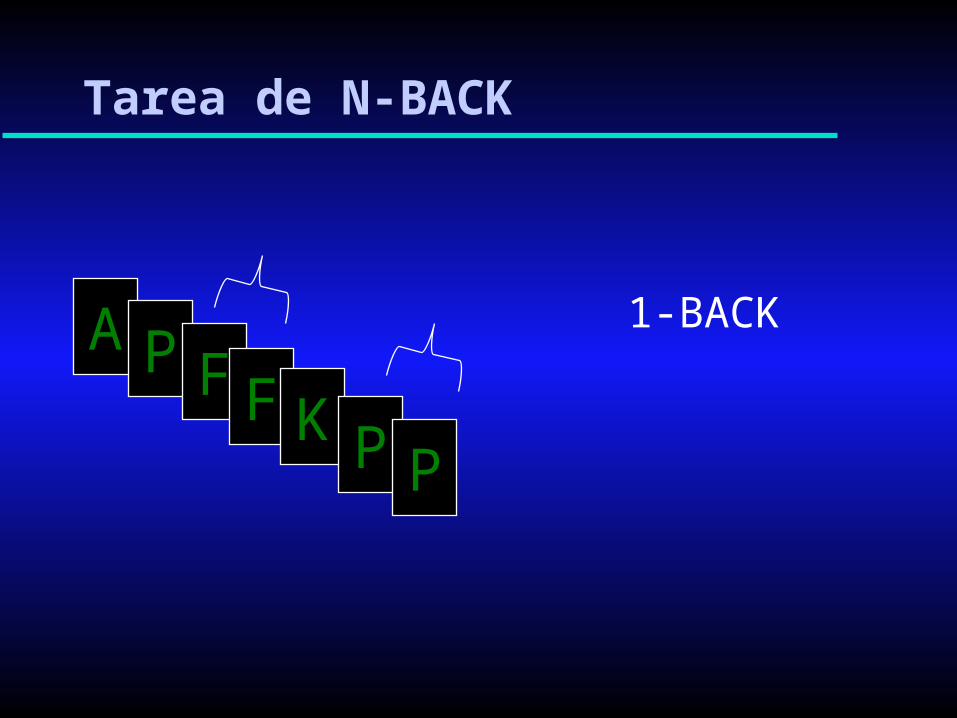
Tarea de N-BACK
A P1-BACK
F F K P P
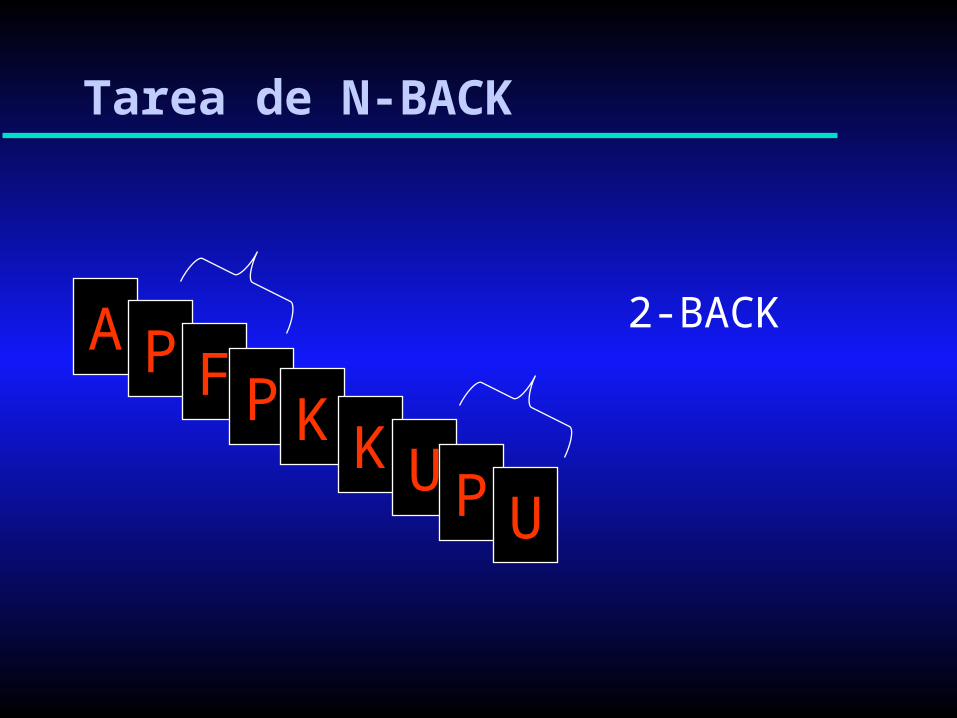
Tarea de N-BACK
A P2-BACK
F P K K UP U
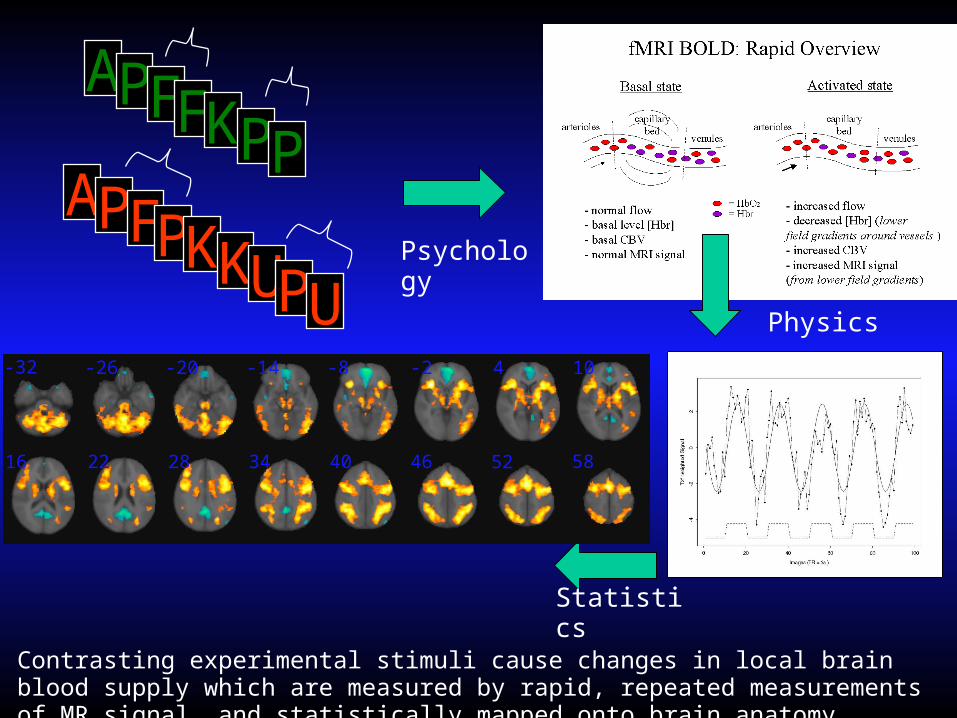
Contrasting experimental stimuli cause changes in local brain blood supply which are measured by rapid, repeated measurements of MR signal, and statistically mapped onto brain anatomy
Psychology
Physics
Statistics
APFFKPPAPFPKKUPU
-32 -26 -20 -14 -8 -2 4 10
16 22 28 34 40 46 52 58
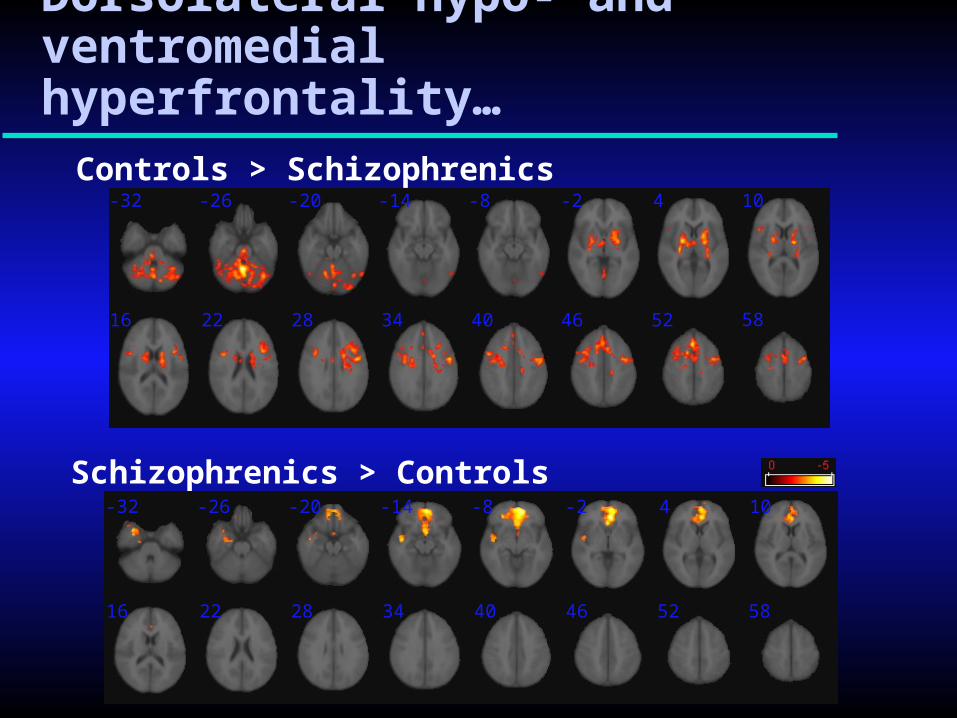
Schizophrenics > Controls-32 -26 -20 -14 -8 -2 4 10
16 22 28 34 40 46 52 58
16 22 28 34 40 46 52 58
-32 -26 -20 -14 -8 -2 4 10
16 22 28 34 40 46 52 58
Controls > Schizophrenics
Dorsolateral hypo- and ventromedial hyperfrontality…
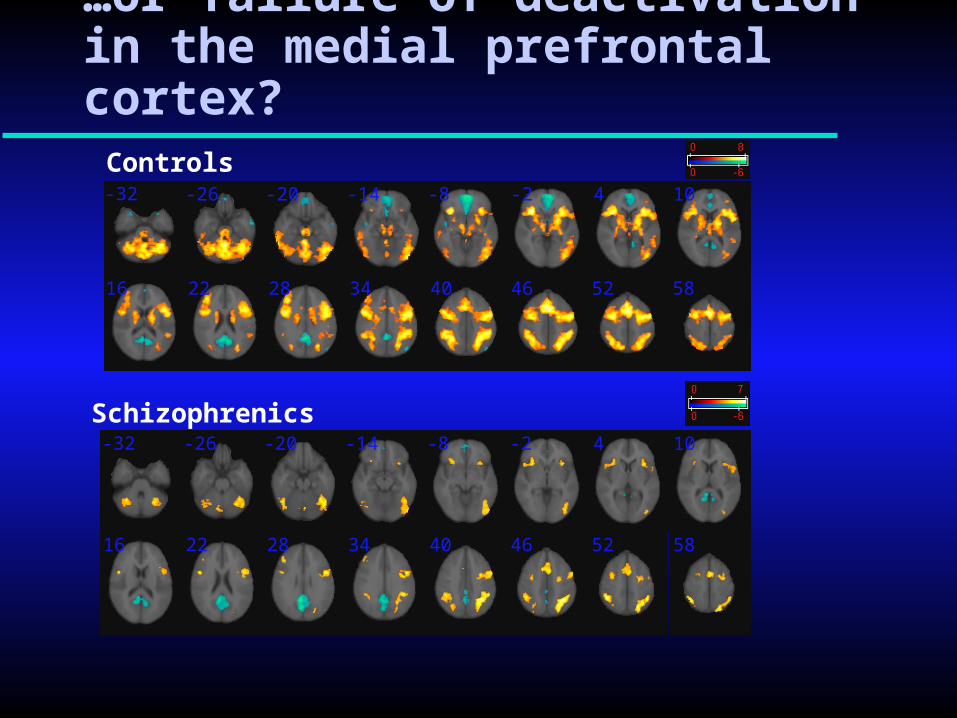
…or failure of deactivation in the medial prefrontal cortex?
Controls-32 -26 -20 -14 -8 -2 4 10
16 22 28 34 40 46 52 58
-32 -26 -20 -14 -8 -2 4 10
16 22 28 34 40 46 52 58
Schizophrenics
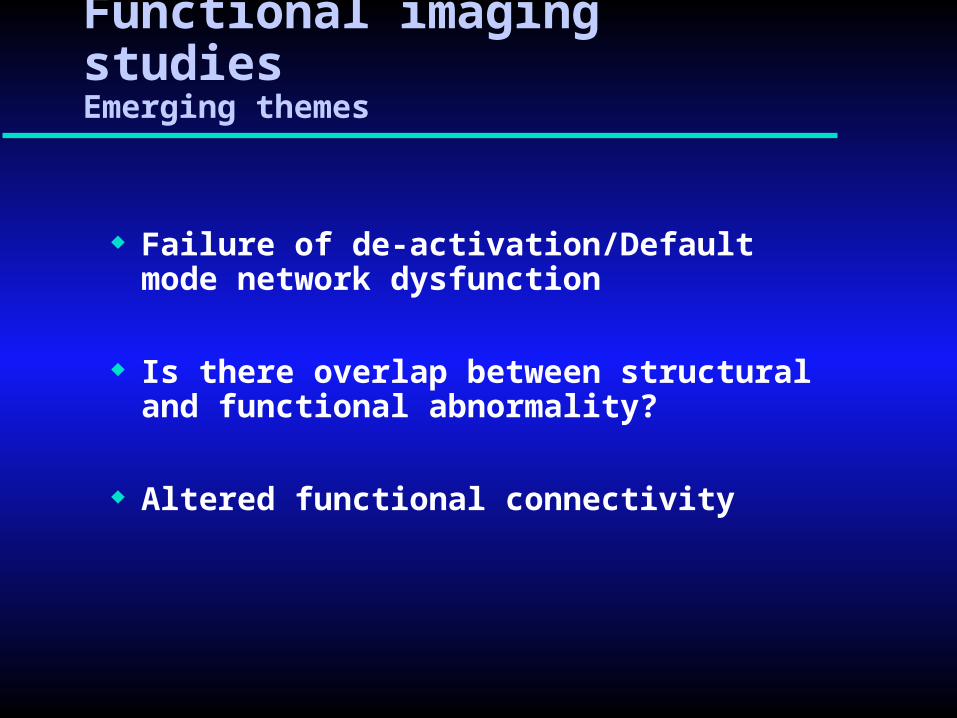
Functional imaging studiesEmerging themes
Failure of de-activation/Default mode network dysfunction
Is there overlap between structural and functional abnormality?
Altered functional connectivity
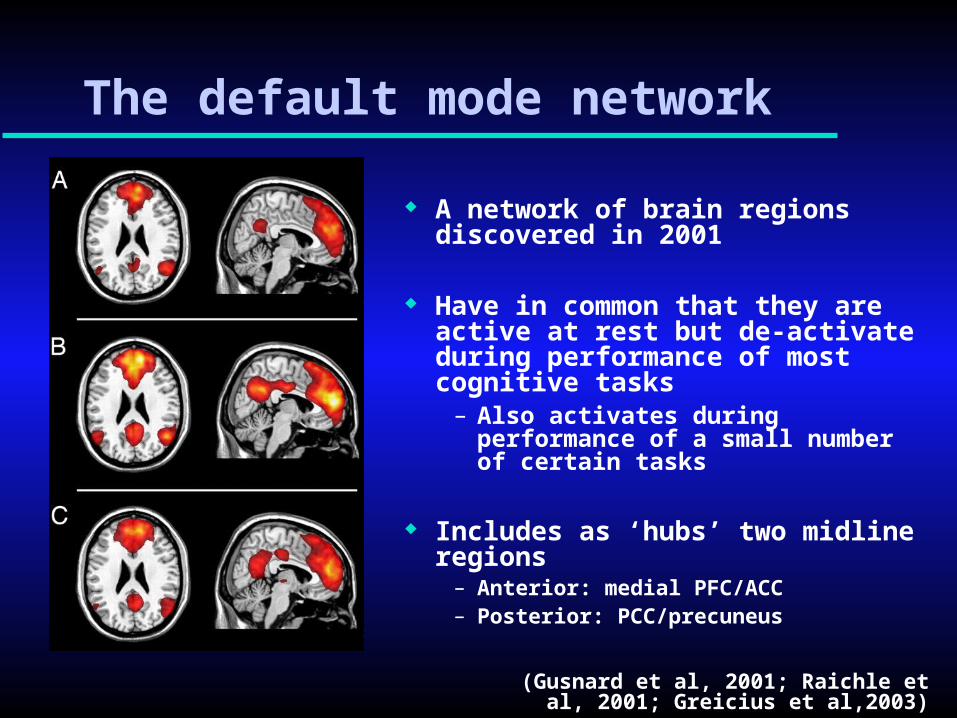
The default mode network
A network of brain regions discovered in 2001
Have in common that they are active at rest but de-activate during performance of most cognitive tasks
– Also activates during performance of a small number of certain tasks
Includes as ‘hubs’ two midline regions – Anterior: medial PFC/ACC– Posterior: PCC/precuneus
(Gusnard et al, 2001; Raichle et al, 2001; Greicius et al,2003)
What does the default mode network do?
The default network is active when individuals are engaged in internally focused tasks including autobiographical memory retrieval, envisioning the future, and conceiving the perspectives of others.
May also have a role in low-level monitoring of the external world for unexpected events, ie an exploratory state or ‘watchfulness’.
(Buckner et al, 2008)
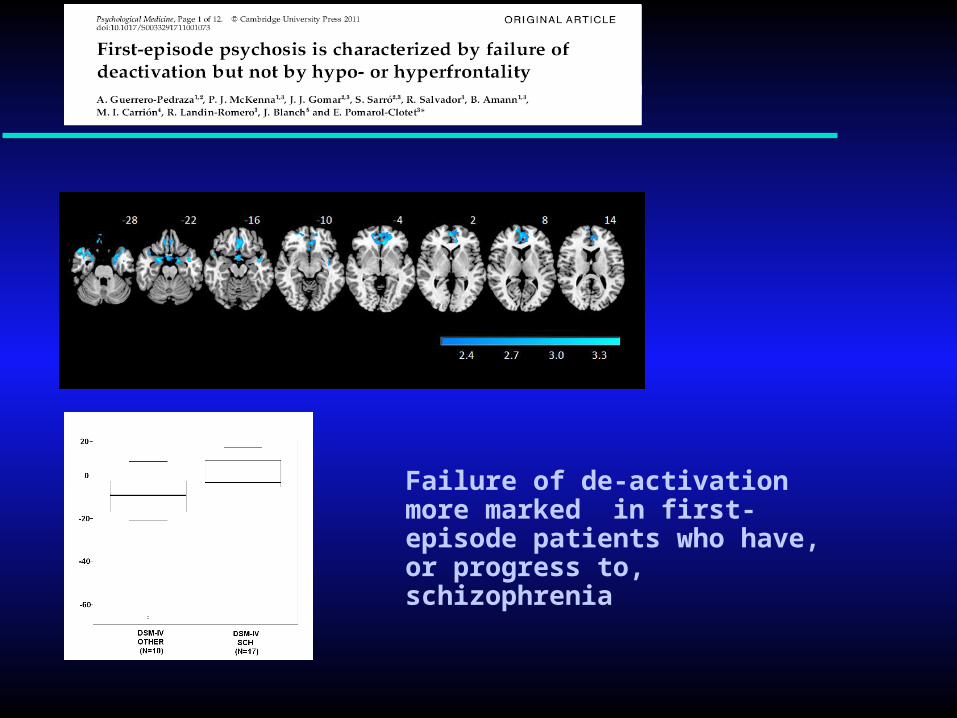
Failure of de-activation more marked in first-episode patients who have, or progress to, schizophrenia
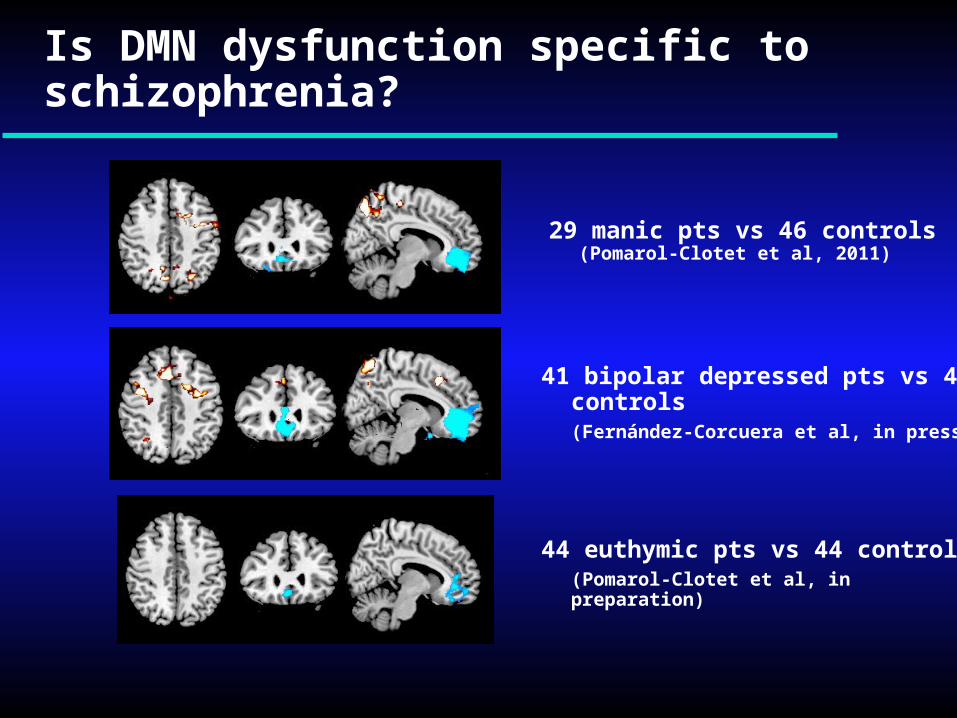
29 manic pts vs 46 controls(Pomarol-Clotet et al, 2011)
41 bipolar depressed pts vs 41 controls(Fernández-Corcuera et al, in press)
44 euthymic pts vs 44 controls(Pomarol-Clotet et al, in preparation)
Is DMN dysfunction specific to schizophrenia?
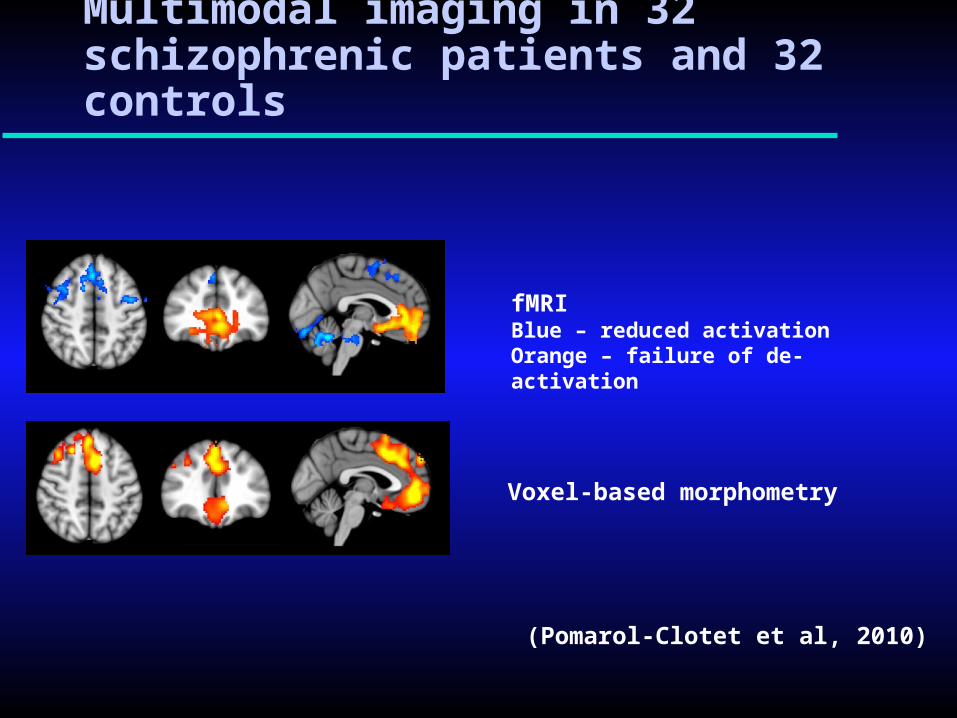
Multimodal imaging in 32 schizophrenic patients and 32 controls
Voxel-based morphometry
fMRI Blue – reduced activationOrange – failure of de-activation
(Pomarol-Clotet et al, 2010)
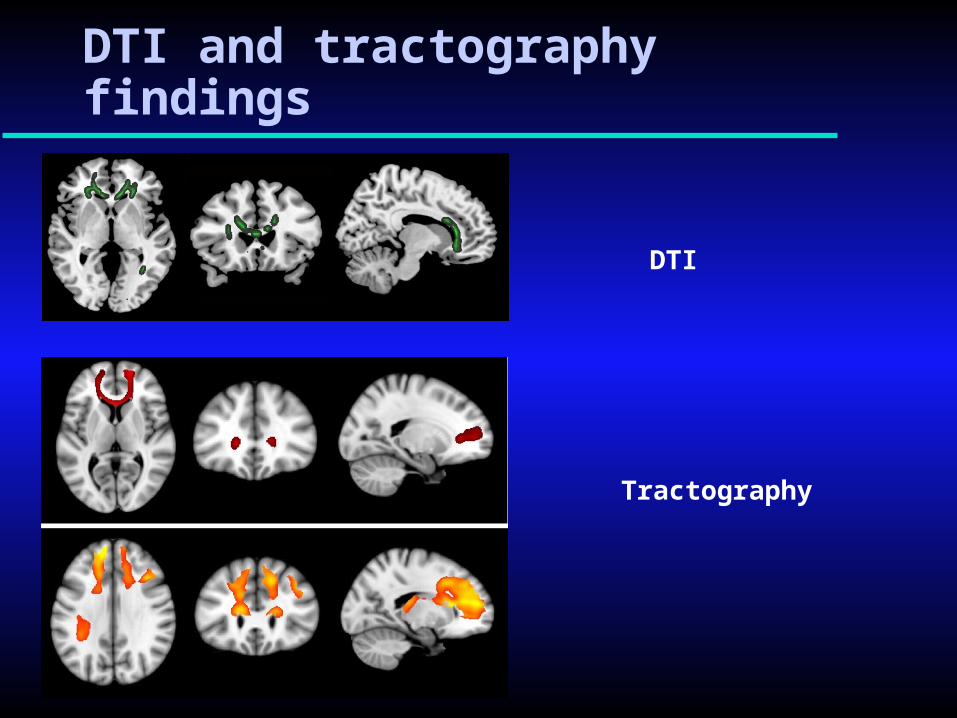
DTI and tractography findings
DTI
Tractography
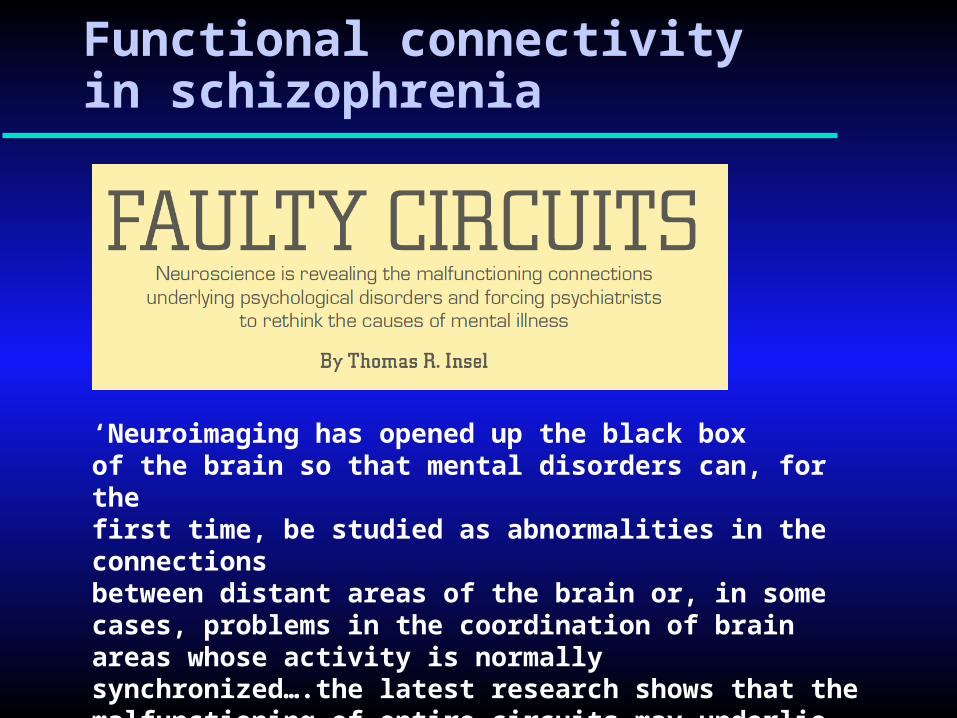
‘Neuroimaging has opened up the black boxof the brain so that mental disorders can, for thefirst time, be studied as abnormalities in the connectionsbetween distant areas of the brain or, in some cases, problems in the coordination of brain areas whose activity is normally synchronized….the latest research shows that the malfunctioning of entire circuits may underlie manymental disorders.’
Functional connectivity in schizophrenia
Connectivity in schizophrenia
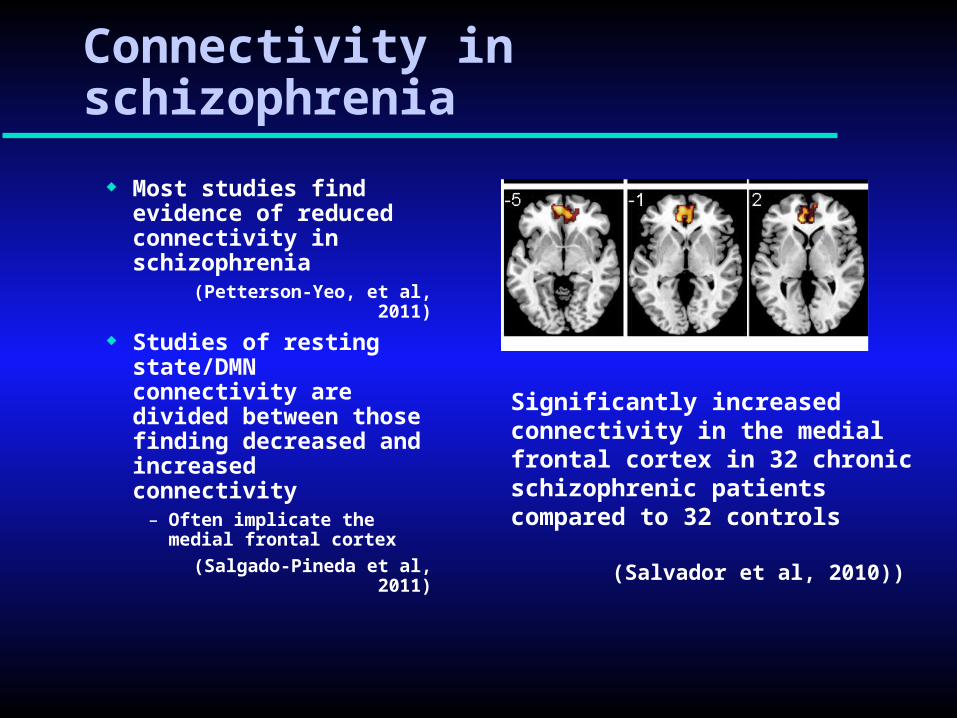
Most studies find evidence of reduced connectivity in schizophrenia
(Petterson-Yeo, et al, 2011)
Studies of resting state/DMN connectivity are divided between those finding decreased and increased connectivity
– Often implicate the medial frontal cortex
(Salgado-Pineda et al, 2011)
Significantly increased connectivity in the medial frontal cortex in 32 chronic schizophrenic patients compared to 32 controls
(Salvador et al, 2010))
Conclusions
The anterior cingulate cortex/medial frontal cortex is a region of topical interest in schizophrenia
– As well as the dorsolateral prefrontal cortex
DMN dysfunction is an increasingly well-established finding
– Not specific to schizophrenia, also seen in other major psychiatric disorders
Emerging theme is overlap between structural and functional brain abnormality in schizophrenia
– And perhaps other disorders
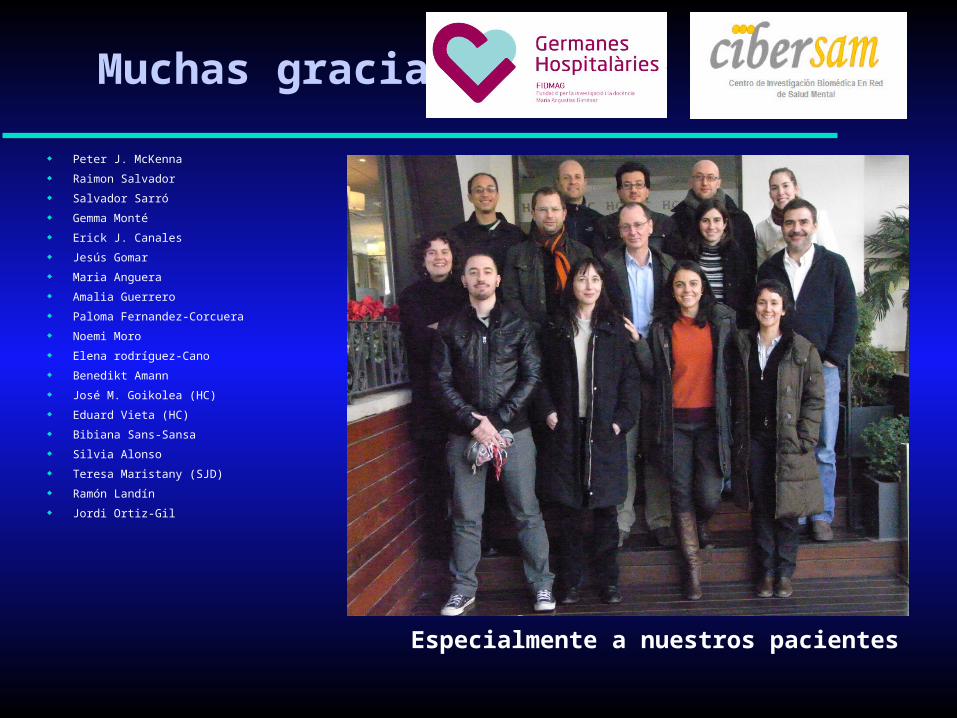
Muchas gracias
Peter J. McKenna
Raimon Salvador
Salvador Sarró
Gemma Monté
Erick J. Canales
Jesús Gomar
Maria Anguera
Amalia Guerrero
Paloma Fernandez-Corcuera
Noemi Moro
Elena rodríguez-Cano
Benedikt Amann
José M. Goikolea (HC)
Eduard Vieta (HC)
Bibiana Sans-Sansa
Silvia Alonso
Teresa Maristany (SJD)
Ramón Landín
Jordi Ortiz-Gil
Especialmente a nuestros pacientes
Is DMN dysfunction also found in other psychiatric disorders?
Major affective disorder– Yes both phases of bipolar disorder, and euthymia
(Pomarol-Clotet 2010), Fernández-Corcuera, under review)
– Yes unipolar major depression (Sheline et al, 2009, Rodríguez-Cano, unpub)
Delusional disorder– Present in similar area to schizophrenia
(Vicens et al, submitted)
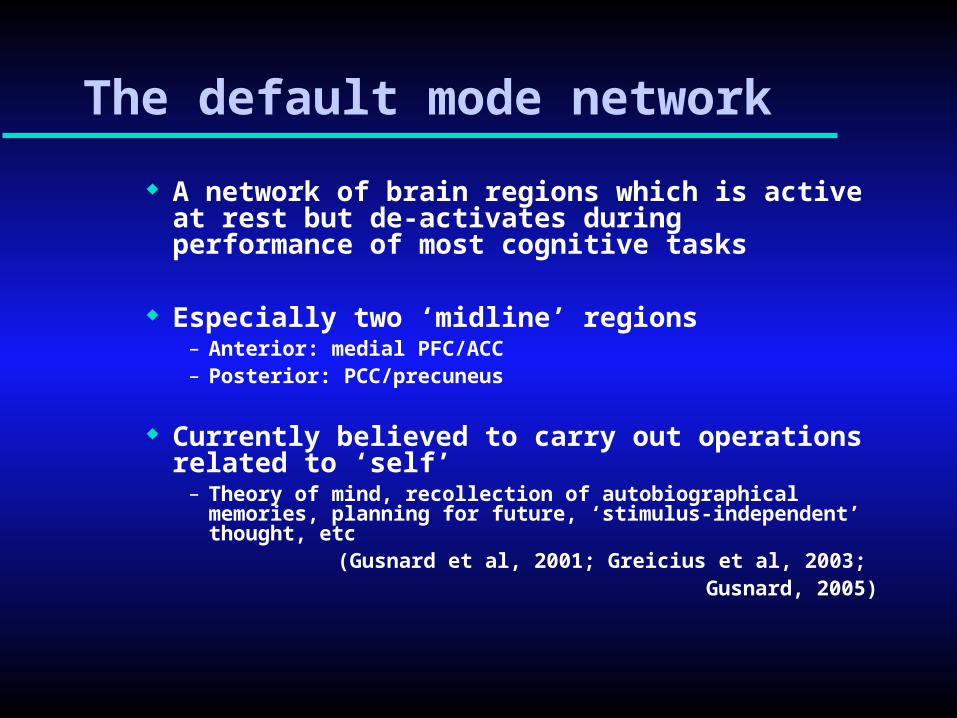
The default mode network
A network of brain regions which is active at rest but de-activates during performance of most cognitive tasks
Especially two ‘midline’ regions– Anterior: medial PFC/ACC– Posterior: PCC/precuneus
Currently believed to carry out operations related to ‘self’
– Theory of mind, recollection of autobiographical memories, planning for future, ‘stimulus-independent’ thought, etc
(Gusnard et al, 2001; Greicius et al, 2003; Gusnard, 2005)
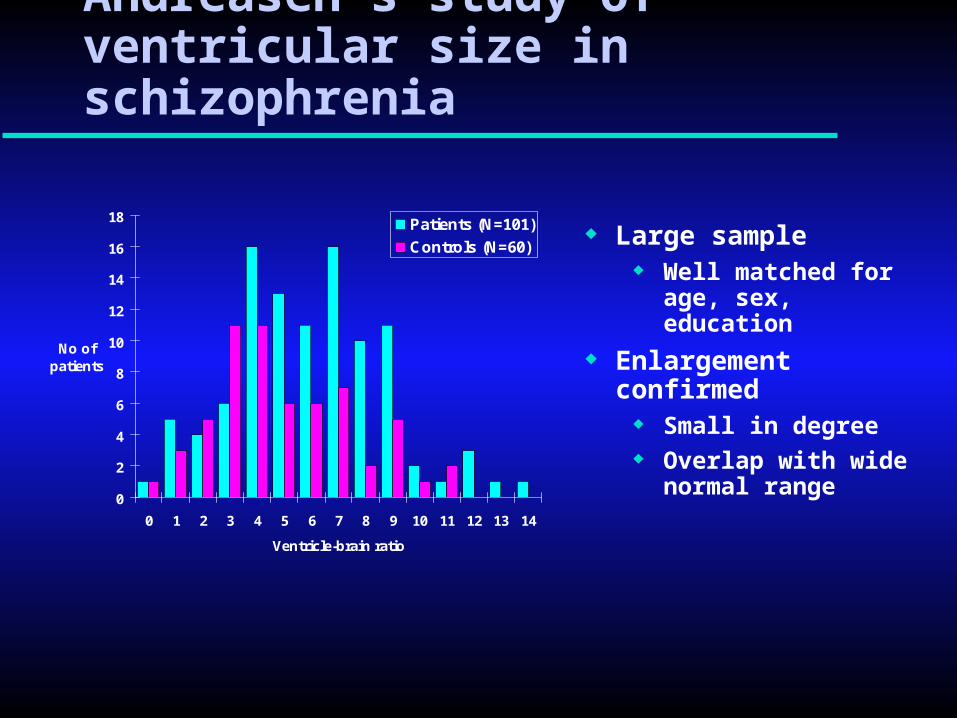
Andreasen’s study of ventricular size in schizophrenia
0
2
4
6
8
10
12
14
16
18
0 1 2 3 4 5 6 7 8 9 10 11 12 13 14
Ventricle-brain ratio
No ofpatients
Patients (N=101)
Controls (N=60) Large sample
Well matched for age, sex, education
Enlargement confirmed Small in degree Overlap with wide
normal range
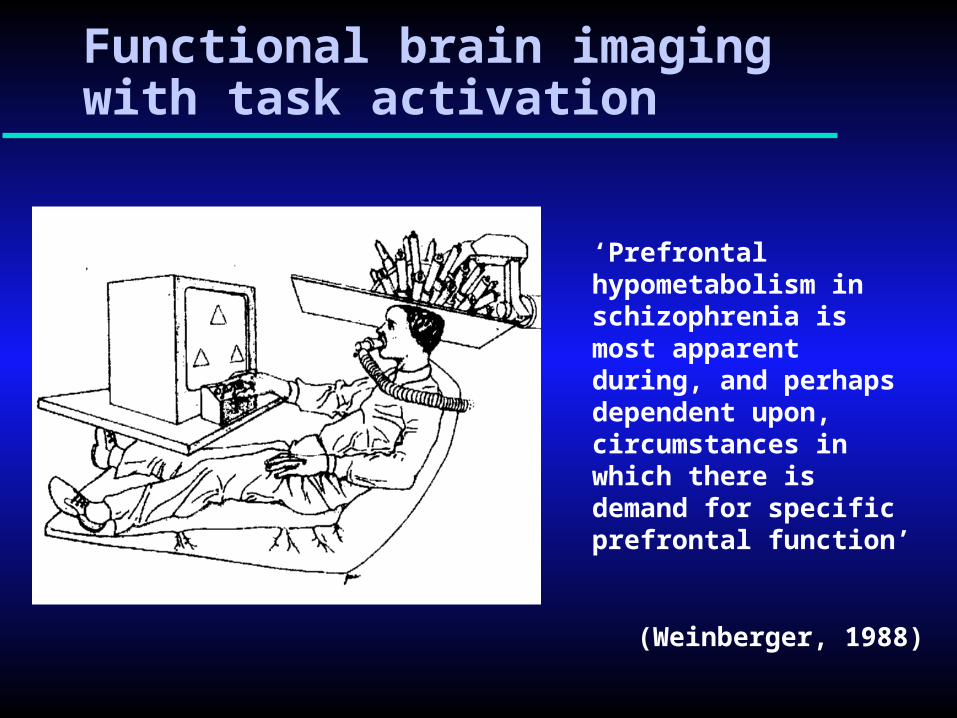
Functional brain imaging with task activation
‘Prefrontal hypometabolism in schizophrenia is most apparent during, and perhaps dependent upon, circumstances in which there is demand for specific prefrontal function’
(Weinberger, 1988)
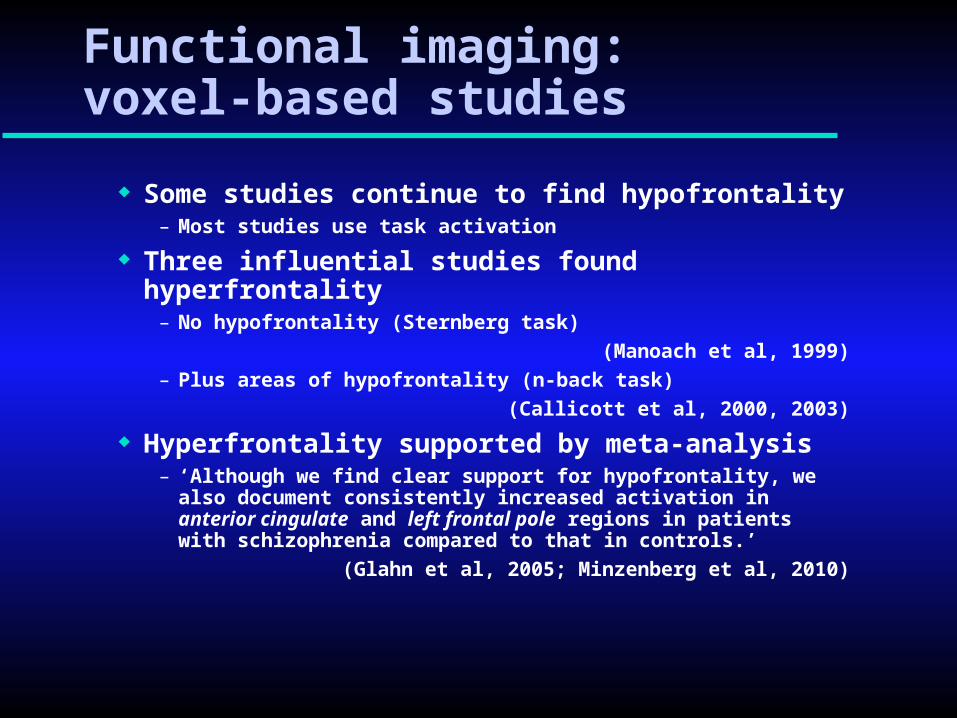
Functional imaging:voxel-based studies
Some studies continue to find hypofrontality– Most studies use task activation
Three influential studies found hyperfrontality– No hypofrontality (Sternberg task)
(Manoach et al, 1999)
– Plus areas of hypofrontality (n-back task)
(Callicott et al, 2000, 2003)
Hyperfrontality supported by meta-analysis– ‘Although we find clear support for hypofrontality, we also
document consistently increased activation in anterior cingulate and left frontal pole regions in patients with schizophrenia compared to that in controls.’
(Glahn et al, 2005; Minzenberg et al, 2010)
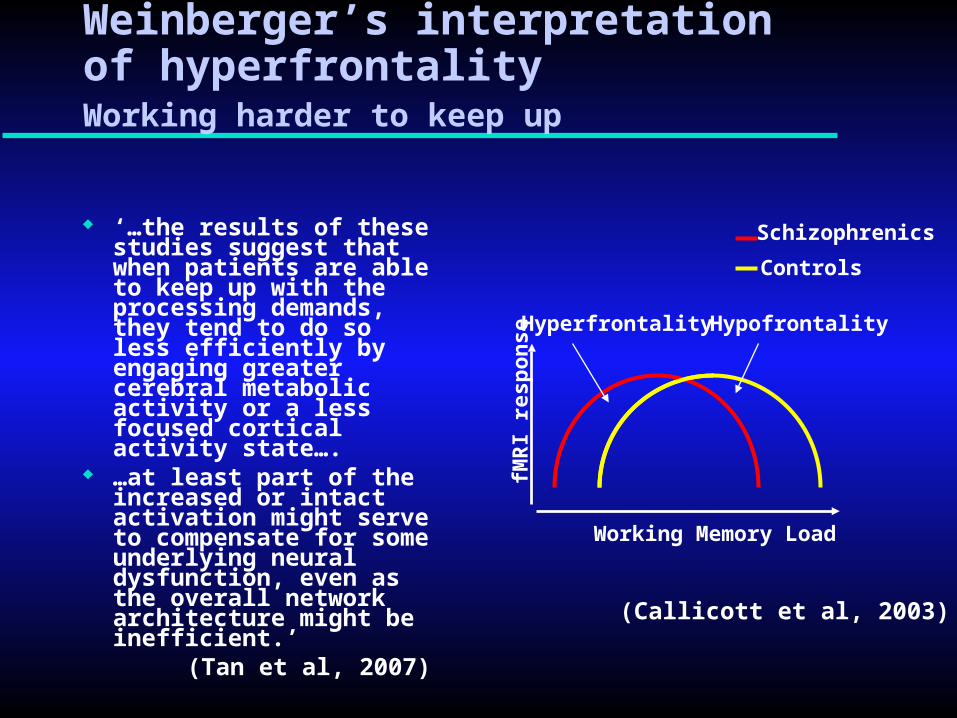
Weinberger’s interpretation of hyperfrontalityWorking harder to keep up
Hyperfrontality Hypofrontality
fMR
I res
po
nse
Working Memory Load
Schizophrenics
Controls
‘…the results of these studies suggest that when patients are able to keep up with the processing demands, they tend to do so less efficiently by engaging greater cerebral metabolic activity or a less focused cortical activity state….
…at least part of the increased or intact activation might serve to compensate for some underlying neural dysfunction, even as the overall network architecture might be inefficient.’
(Tan et al, 2007)(Callicott et al, 2003)
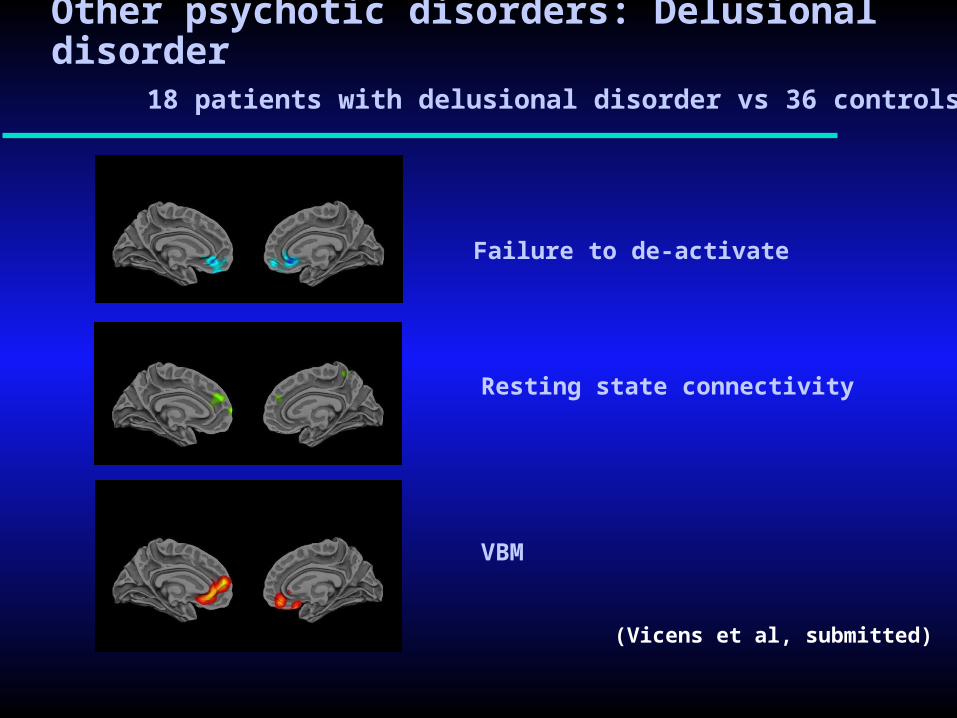
Other psychotic disorders: Delusional disorder 18 patients with delusional disorder vs 36 controls
(Vicens et al, submitted)
Resting state connectivity
Failure to de-activate
VBM
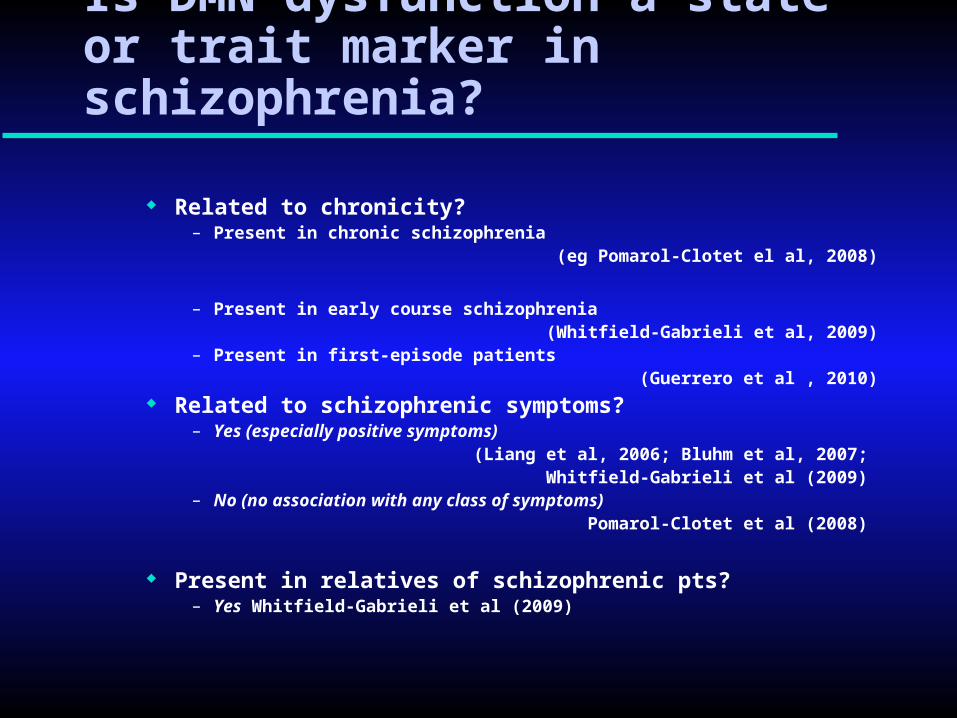
Is DMN dysfunction a state or trait marker in schizophrenia?
Related to chronicity?– Present in chronic schizophrenia
(eg Pomarol-Clotet el al, 2008)
– Present in early course schizophrenia(Whitfield-Gabrieli et al, 2009)
– Present in first-episode patients(Guerrero et al , 2010)
Related to schizophrenic symptoms?– Yes (especially positive symptoms)
(Liang et al, 2006; Bluhm et al, 2007; Whitfield-Gabrieli et al (2009)
– No (no association with any class of symptoms)Pomarol-Clotet et al (2008)
Present in relatives of schizophrenic pts?– Yes Whitfield-Gabrieli et al (2009)
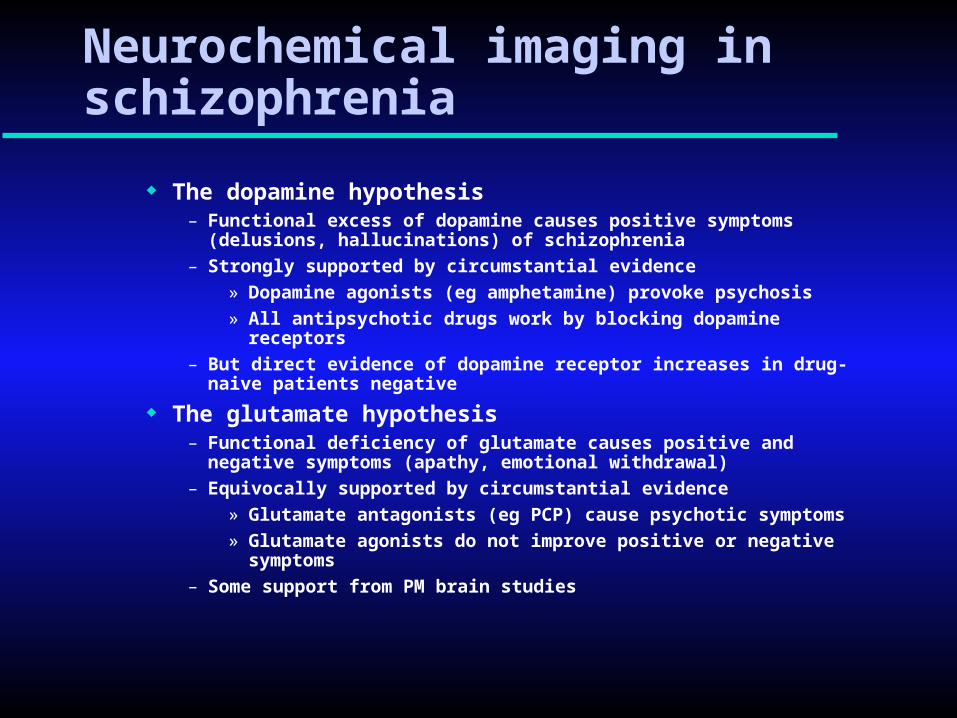
Neurochemical imaging in schizophrenia
The dopamine hypothesis– Functional excess of dopamine causes positive symptoms (delusions,
hallucinations) of schizophrenia
– Strongly supported by circumstantial evidence
» Dopamine agonists (eg amphetamine) provoke psychosis
» All antipsychotic drugs work by blocking dopamine receptors
– But direct evidence of dopamine receptor increases in drug-naive patients negative
The glutamate hypothesis– Functional deficiency of glutamate causes positive and negative
symptoms (apathy, emotional withdrawal)
– Equivocally supported by circumstantial evidence
» Glutamate antagonists (eg PCP) cause psychotic symptoms
» Glutamate agonists do not improve positive or negative symptoms
– Some support from PM brain studies
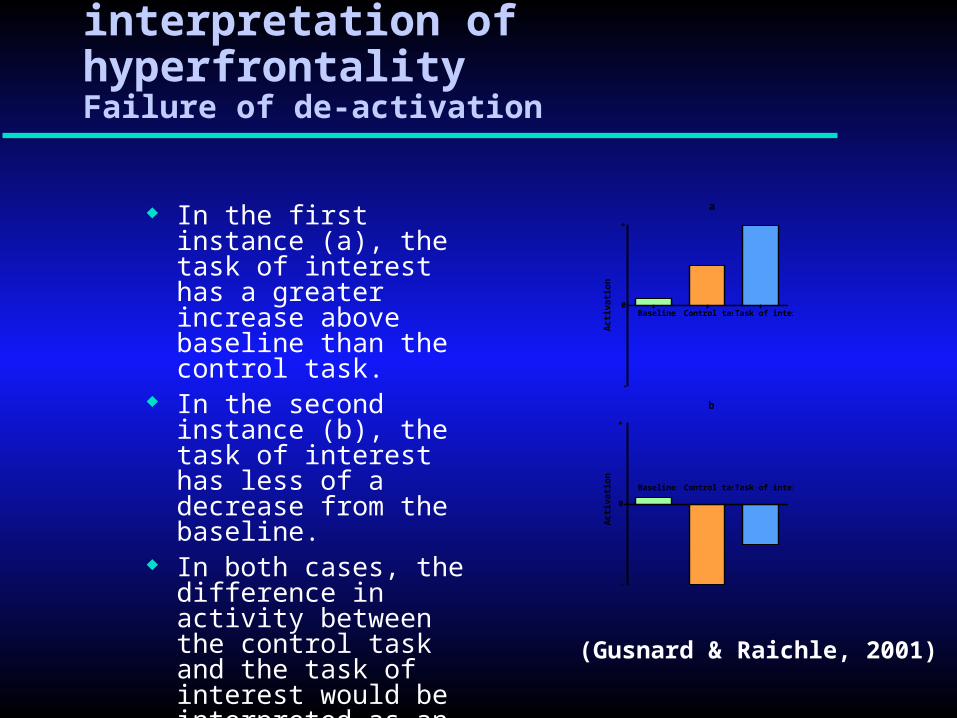
An alternative interpretation of hyperfrontality Failure of de-activation
In the first instance (a), the task of interest has a greater increase above baseline than the control task.
In the second instance (b), the task of interest has less of a decrease from the baseline.
In both cases, the difference in activity between the control task and the task of interest would be interpreted as an increase.
(Gusnard & Raichle, 2001)
Baseline Control task Task of interest0
-
+
a
Ac
tiv
ati
on
Baseline Control task Task of interest
0
-
+
b
Ac
tiv
ati
on
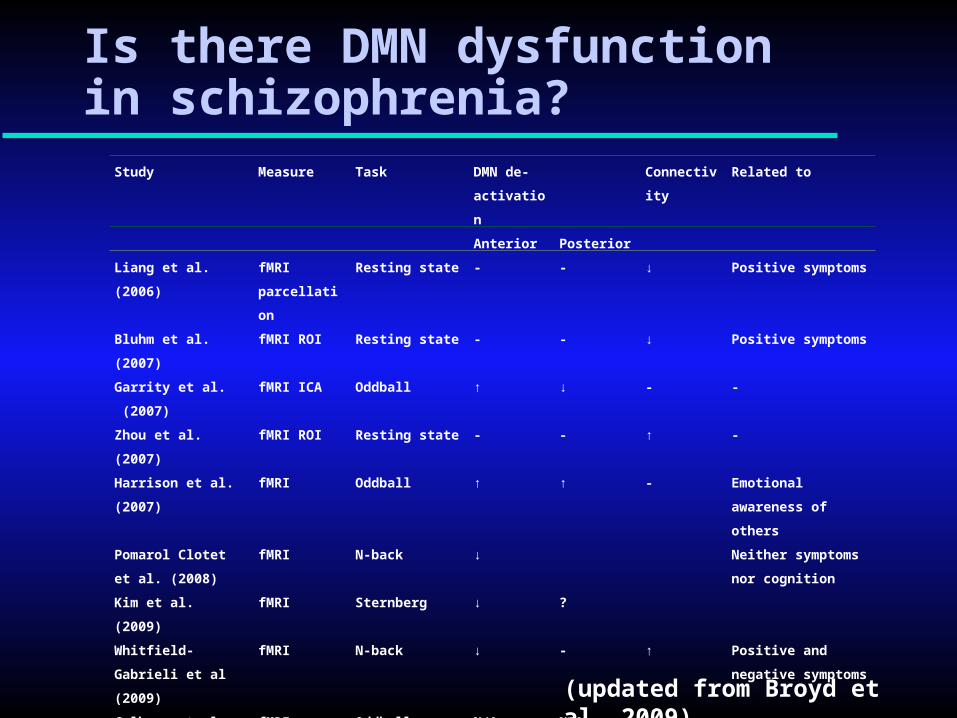
Study Measure Task DMN de-
activation
Connectivit
y
Related to
Anterior Posterior
Liang et al.
(2006)
fMRI
parcellation
Resting state - - ↓ Positive symptoms
Bluhm et al.
(2007)
fMRI ROI Resting state - - ↓ Positive symptoms
Garrity et al.
(2007)
fMRI ICA Oddball ↑ ↓ - -
Zhou et al.
(2007)
fMRI ROI Resting state - - ↑ -
Harrison et al.
(2007)
fMRI Oddball ↑ ↑ - Emotional awareness
of others
Pomarol Clotet et al.
(2008)
fMRI N-back ↓ Neither symptoms
nor cognition
Kim et al.
(2009)
fMRI Sternberg ↓ ?
Whitfield-Gabrieli et
al (2009)
fMRI N-back ↓ - ↑ Positive and negative
symptoms
Calhoun et al.
(2008)
fMRI Oddball N/A N/A - -
Is there DMN dysfunction in schizophrenia?
(updated from Broyd et al, 2009)
‘Many illnesses previously defined as “mental” are now recognized to have a biological cause….schizophrenia is now viewed and treated as a developmental brain disorder.’
(Insel, 2010)
Recommended