Foreign Ownership and Firm Performance: EmergingMarket Acquisitions in the United States
ANUSHA CHARI, WENJIE CHEN, and KATHRYN M.E. DOMINGUEZn
This paper examines the recent upsurge in foreign direct investment byemerging market firms into the United States. Traditionally, direct investmentflowed from developed to developing countries, bringing with it superiortechnology, organizational capital, and access to international capital markets,yet increasingly there is a trend toward “capital flowing uphill” with emergingmarket investors acquiring a broad range of assets in developed countries. Usingtransaction-specific information and firm-level accounting data, the paperevaluates the operating performance of publicly traded U.S. firms that havebeen acquired by firms from emerging markets over the period 1980–2006. Theempirical methodology uses a difference-in-differences approach combinedwith propensity score matching to create an appropriate control group ofnonacquired firms. The results suggest that emerging country acquirers tend tochoose U.S. targets that are larger in size (measured as sales, total assets, andemployment) relative to matched nonacquired firms. In the years following theacquisition target firm sales and employment decline while profitability rises
nAnusha Chari is an Associate Professor of Economics at the University of NorthCarolina at Chapel Hill and a Faculty Research Fellow at the NBER. Wenjie Chen is anAssistant Professor of International Business at George Washington University. Kathryn M.E. Dominguez is a Professor of Public Policy and Economics at the University of Michiganand a Research Associate at the NBER. The authors thank the Editor, Pierre-OlivierGourinchas, two anonymous referees, Patricia Dechow, Jeff Smith, Jim Levinsohn, JamesHines, Matias Busso, Taryn Dinkelman, Dean Yang, Nirvikar Singh, Aart Kraay andparticipants in the UM Development seminar, the UM IPC lunch group, the NIPFPconference at the Indian Ministry of Finance, the Australian Treasury, the Reserve Bank ofAustralia, FRBSF, UC Berkeley, the Bank of Canada, the World Bank, and North CarolinaState University for helpful comments and advice. They are grateful to the InternationalPolicy Center at the Ford School of Public Policy for financial support.
IMF Economic ReviewVol. 60, No. 1
& 2012 International Monetary Fund
compared with matched nonacquired firms, suggesting significant restructuringof the target firms. [JEL F21, F37, G34]
IMF Economic Review (2012) 60, 1–42. doi:10.1057/imfer.2012.1
This paper examines the recent upsurge in foreign direct investment (FDI)by emerging market firms into the United States. Traditionally, foreign
investment flowed from developed to developing countries, bringing withit superior technology, organizational capital, and access to internationalcapital markets, yet increasingly there is a trend toward “capital flowinguphill” with emerging market investors acquiring a wide variety of assets inthe developed world.1 In particular, the recent spate of cross-borderacquisitions by Indian and Chinese companies are the subject of heateddebate in policy circles. For example, the acquisition bid by CNOOC,the Chinese state-owned oil company, to take over Unocal met withconsiderable resistance in Washington and was ultimately thwarted. Anotherexample of a high profile emerging market acquisition was the Indian TataMotors 2008 purchase of Ford’s Jaguar and Land Rover divisions. Usingtransaction-specific acquisition data and firm-level accounting data, thispaper studies how U.S. firms that are acquired by firms from emergingmarkets fare relative to their nonacquired counterparts.
The first hypothesis we examine, based on evidence from developed-market FDI flows to emerging markets, is whether foreign ownership isassociated with improvements in firm-profitability or plant-productivity(Caves, 1996; Aitken and Harrison, 1999; Perez-Gonzales, 2004; Arnoldand Javorcik, 2005; Petkova, 2008).2,3,4 In the case of recent emerging market
1According to estimates by the United Nations Conference on Trade and Development(UNCTAD), the outward foreign direct investment (FDI) flow from the developing economiesas a group was $226.7 billion in 2006, an increase of 85 percent from the year before. Netdeveloping country FDI flows, inward minus outward, decreased from 2005 to 2006 by 3.5percent.
2Previous studies have focused on the effects of FDI on plant-level productivity measuressuch as total factor productivity (TFP) or labor productivity (output per worker). Using firm-level financial data, the focus of our paper is on an accounting measure of profitability (ROA)in line with operating performance studies that attempt to identify the sources of gains fromacquisitions. The rationale in these studies is that if there are gains from acquisitions theyshould be eventually reflected in firms’ cash flows.
3FDI includes “Greenfield” investment in new assets in a foreign country, and acquisitionof pre-existing foreign assets (also termed “Brownfield” investment).
4Antras, Desai, and Foley (2009) document the productivity-improving role of U.S.multinational firms. They find that U.S. multinationals are able to exploit technologies abroadthrough FDI, especially in countries where monitoring is nonverifiable and financial frictionsexist. Fukao and others (2006) compare domestic to foreign M&A in Japan and find thatJapanese target firms that receive foreign investment experience more rapid improvements inproductivity and profitability than those that were acquired by domestic firms. Akben-Selcuk(2008) studies a similar issue using data on Turkish firms.
Anusha Chari, Wenjie Chen, and Kathryn M.E. Dominguez
2
acquisitions, while the role of sovereign wealth funds and the buildup ofU.S. dollar reserves in emerging markets are seen as motivations foracquisitions in developed-markets, the productivity-improving role oftechnology transfers from emerging to developed markets is not obvious,especially in light of the vast differences in capital-labor and output-laborratios between these two sets of markets.5
Wells (1983) and reports by Citigroup (2005) and Hemerling and others(2006) suggest three potential motivations for overseas expansions that arespecific to emerging market firms, these include: (1) entering new markets,(2) obtaining natural resources, and (3) acquiring advanced technology andrelated brand equity. Lenovo’s 2004 purchase of IBM’s personal computerbusiness is a case-in-point. It involved entry into the U.S. market, acquisitionof technology, and of an established brand. CNOOC’s bid for Unocal pointsto emerging market demand for natural resources. Antkiewicz and Whalley(2006) highlight several case studies of recent completed and failed attempts byChinese companies to acquire firms in the OECD. They suggest that the recentwave of Chinese outbound M&A is driven by the necessity to acquire access toresources, new technology, and distribution networks in the target country.
The second hypothesis from traditional theories of FDI that we examinerelies on comparative input costs as the motivating rationale for investmentflows from developed to emerging markets. Whereas industrial countryacquirers often seek lower labor costs in emerging markets, we hypothesizethat emerging market acquirers may relocate (or in-source) manufacturingactivity while keeping existing distribution networks in the host country of theacquired business. The idea here is that emerging market firms come fromenvironments where labor costs are low and they may be in the position to in-source jobs by exploiting the low wages in their home countries by downsizinglabor-intensive activities in the United States following the acquisition.
The transaction-specific data on cross-border Mergers and Acquisitions(M&As) used in this paper come from the Thomson Financial SDC Platinumdatabase that records all M&As involving U.S. firms that were announcedbetween January 1, 1980 and July 1, 2007. We focus on publicly traded U.S.targets both because open financial markets in the United States have led to asubstantial number of cross-border M&As, and because public U.S. firms arerequired to disclose detailed accounting data. The work that followscomplements the existing literature on postacquisition firm performance, withour analysis specifically focused on acquisitions made by emerging country firms.
To evaluate the impact of emerging country acquisitions on U.S. firmperformance and restructuring we examine stock market and accountingmeasures as well as employment outcomes. Abnormal announcementreturns provide a forward-looking estimate of expected shareholder value
5In this context it is worth noting that Forbes (2008) finds evidence that foreigners holdgreater shares of their investment portfolios in the United States if they have less developedfinancial markets, suggesting that our focus on FDI by emerging market firms may alsoprovide insights into the implications of broader investment trends into the United States.
FOREIGN OWNERSHIP AND FIRM PERFORMANCE
3
creation. Postacquisition we evaluate the changes in accounting measuresof performance (profitability, investment, and sales) and firm-levelemployment data in the target U.S. firms.
The first empirical challenge we face in estimating postacquisitionoutcomes is one of causality versus selection. Are emerging market firmssimply picking certain types of acquisition targets or do foreign acquisitionschange target-firm performance? There is some evidence in the literature onhow acquirers select targets.6,7 In this paper, we find evidence of selection inthat emerging country firms tend to acquire public U.S. targets with relativelyhigh levels of sales, employment, and total assets. Crucial to any comparisonbetween pre- and postacquisition operating performance of target firms istherefore the issue of selecting an appropriate expected performancebenchmark in the absence of the acquisition (Andrade, Mitchell, andStafford, 2001). Ideally, one would like to compare the performance of a firmthat receives foreign investment to the performance of the firm’s identicaltwin with no foreign investment.
In this paper we ask the counterfactual question: what would havehappened to those firms that did, in fact, receive foreign ownership, if theyhad not received it? While this exact counterfactual is not typicallyobservable, propensity score matching, which involves selecting a “control”group of nonacquired firms closely matched to the “treatment” group ofacquired firms, is one way to create sets of such twins artificially. Propensityscore matching can then be combined with difference-in-differences estimatesto eliminate time-invariant and unobservable differences between theacquired and nonacquired firms.
In order to measure the profitability of U.S. target firms after they areacquired, we focus on the accounting measure of operating income beforedepreciation, amortization and taxes (OIBD). In order to control for therelative size of the target firm, we scale OIBD by total assets, thus focusing onreturn on assets (ROA). We also track changes in other aspects of target-firmoperations, such as property, plant and equipment, employment, and salesfollowing the acquisition.
6In particular, Froot and Stein (1991) show that asymmetric information could leadforeign firms to buy U.S. firms in times when the value of the U.S. dollar is low relative to theforeign currency. They provide empirical evidence of a negative relationship between the valueof the dollar and FDI flows into the United States using aggregate FDI data, and thisrelationship is also explored in Chen (2008) using more detailed firm-level data. Harris andRavenscraft (1990) find evidence that foreign firms prefer technology-intensive industries,Rossi and Volpin (2004) find that targets are typically from countries with poorer investorprotection than their acquirers’ countries.
7Haskel, Pereira, and Slaughter (2007) describe how U.S. states differ in their incentivepackages and taxes with regards to foreign acquirers. At the Federal level there were few legalrestrictions on FDI into the United States during the time period studied here, although morestringent laws were recently put into place in order to restrict FDI that threatens U.S.“national security”; these restrictions came into effect in 2007. See: www.ustreas.gov/offices/international-affairs/cfius/
Anusha Chari, Wenjie Chen, and Kathryn M.E. Dominguez
4
We find that the stock price response of target firms is positive andsignificant around the time of acquisition announcement. Averagecumulative returns on the target stock price within a three-day windowaround the announcement date of the acquisition increase by 8 percent.This return remains significant and positive when we extend the window to10 and 21 business days. Correspondingly, we find that after the acquisitionthe profitability of acquired targets improves. The target firm’s ROAincreases by 7 percent in the five years following acquisition.
We also find strong evidence that acquiring firms undertake significantrestructuring of target firms. Relative measures of employment, sales and plant,property and equipment (PP&E) in the target firms decrease in the years afteracquisition. In addition, the pattern of increasing profitability (income/assets)and declining sales is consistent with improvements in firm-efficiency followingacquisition. For instance if firms shut down or get rid of unprofitable divisions,sales would go down but profits as a percent of assets would increase. Also,declining employment and net PP&E suggest downsizing of divisions toimprove overall profitability as a percent of assets.
The downsizing of employment is consistent with the comparative inputcost hypothesis where acquirers from emerging markets may be in a positionto exploit the low wages in their home countries by downsizing labor-intensive activities in the United States following the acquisition. The U.S.target experiences declining sales accompanied by improvements inprofitability, suggesting more streamlined but efficient operations followingrestructuring by the emerging market acquirer.
Methodologically, an alternative design of the control group couldinvolve the comparison of the postacquisition performance of firms acquiredby emerging markets with those acquired by either other U.S. firms or otherdeveloped-market firms. For instance, Chen (2011) explores the question ofwhether, given that a firm is acquired, the country of origin of the acquirermatters (so that the control group is other acquired firms rather thannonacquired firms). Chen finds that compared with domestic acquisitions,U.S. target firms acquired by foreign firms (either from emerging markets orfrom industrialized countries) experience higher returns on assets. However,these performance improvements stem from channels that differ dependingon the type of foreign acquirer. Emerging market acquisitions lead toreductions in sales and employment, whereas acquisitions by industrialcountry firms increase sales and employment in U.S. targets. The results ofthis study reflect similar patterns in performance improvements andrestructuring processes within the U.S. targets that are acquired byemerging market firms.
The paper is also related to a number of studies that investigate thecausal link between foreign ownership and firm or plant performance. Forinstance, Doms and Jensen (1998) find that foreign-owned companies in theU.S. are more productive than domestic-owned ones. Studies of industrialcountry firm acquisitions of developing country targets indicate that bothparties experience valuation improvements following the transactions
FOREIGN OWNERSHIP AND FIRM PERFORMANCE
5
(Chari, Ouimet and Tesar, 2010). Aitken and Harrison (1999) conclude froma sample of Venezuelan firms that foreign ownership is correlated withproductivity improvements. Arnold and Javorcik (2005) use plant-level datafrom Indonesia and find that foreign ownership leads to significantimprovements in productivity in the year of acquisition as well as insubsequent years. Petkova (2008) conducts a similar study using Indian plantlevel data and concludes that foreign-owned plants experience improvementsin productivity three years following foreign investment. Moreover, it is alsorelated to the literature concerned with spillovers from FDI. While Aitkenand Harrison (1999) find negative effects on domestic firm productivity fromFDI, Javorcik (2004) identifies positive FDI spillovers effects on domesticfirms through backward linkages. In the developed-market context, a seriesof papers concentrating on acquisition targets in the United Kingdom,Girma and Goerg (Girma, 2005; Girma and Goerg, 2007; Girma, Kneller,and Oisu, 2007) document improvements in growth rates of firm performancefollowing foreign acquisitions. These studies, however, do not specificallydifferentiate between emerging and developed country acquirers.
The remainder of the paper is structured as follows. Section I introducesthe data sets employed in the empirical analysis. The details of thedifference-in-differences propensity score matching estimator are explainedin Section II. Section III presents the empirical results, Section IV presentsrobustness checks and Section V concludes.
I. Data Description
Our data sample contains all M&As involving U.S. firms initiated by firms inemerging markets that were announced between January 1, 1980 and July 1,2007 reported by SDC Platinum, a database from Thomson Financial.The data include all public and private M&A transactions involving at least5 percent ownership8 of a target firm in the United States.9 The SDC data arebased on information from over 200 English and foreign language newssources, SEC filings and the filings from its international counterparts, tradepublications, news wire reports, and proprietary surveys of investment banks,law firms, and other advisory firms.
For each transaction, the SDC database provides the date on which thetransaction was first announced as well as the date on which the transactionbecame effective. The database provides characteristics of the target andacquiring firms including: name, nation, industry sector, and primary NorthAmerican Industry Classification System (NAICS). The database alsoincludes transaction-specific information on percent of shares acquired, the
8The IMF and the OECD define FDI using a 10 percent threshold, though a broaderdefinition of FDI is ownership of an amount of shares or voting power that allowsparticipation in the management or control of the target firm.
9See Appendix I for a full list of the markets included in the database.
Anusha Chari, Wenjie Chen, and Kathryn M.E. Dominguez
6
percent of shares owned before and after the transaction is completed, thepercent of shares sought by the acquiring firm, and the method of payment.
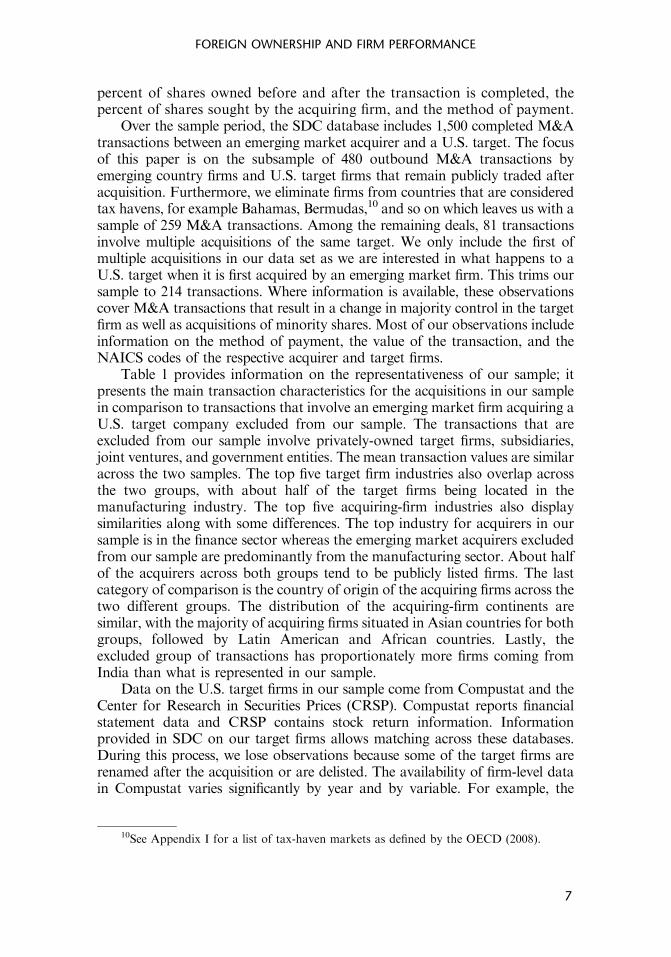
Over the sample period, the SDC database includes 1,500 completed M&Atransactions between an emerging market acquirer and a U.S. target. The focusof this paper is on the subsample of 480 outbound M&A transactions byemerging country firms and U.S. target firms that remain publicly traded afteracquisition. Furthermore, we eliminate firms from countries that are consideredtax havens, for example Bahamas, Bermudas,10 and so on which leaves us with asample of 259 M&A transactions. Among the remaining deals, 81 transactionsinvolve multiple acquisitions of the same target. We only include the first ofmultiple acquisitions in our data set as we are interested in what happens to aU.S. target when it is first acquired by an emerging market firm. This trims oursample to 214 transactions. Where information is available, these observationscover M&A transactions that result in a change in majority control in the targetfirm as well as acquisitions of minority shares. Most of our observations includeinformation on the method of payment, the value of the transaction, and theNAICS codes of the respective acquirer and target firms.
Table 1 provides information on the representativeness of our sample; itpresents the main transaction characteristics for the acquisitions in our samplein comparison to transactions that involve an emerging market firm acquiring aU.S. target company excluded from our sample. The transactions that areexcluded from our sample involve privately-owned target firms, subsidiaries,joint ventures, and government entities. The mean transaction values are similaracross the two samples. The top five target firm industries also overlap acrossthe two groups, with about half of the target firms being located in themanufacturing industry. The top five acquiring-firm industries also displaysimilarities along with some differences. The top industry for acquirers in oursample is in the finance sector whereas the emerging market acquirers excludedfrom our sample are predominantly from the manufacturing sector. About halfof the acquirers across both groups tend to be publicly listed firms. The lastcategory of comparison is the country of origin of the acquiring firms across thetwo different groups. The distribution of the acquiring-firm continents aresimilar, with the majority of acquiring firms situated in Asian countries for bothgroups, followed by Latin American and African countries. Lastly, theexcluded group of transactions has proportionately more firms coming fromIndia than what is represented in our sample.
Data on the U.S. target firms in our sample come from Compustat and theCenter for Research in Securities Prices (CRSP). Compustat reports financialstatement data and CRSP contains stock return information. Informationprovided in SDC on our target firms allows matching across these databases.During this process, we lose observations because some of the target firms arerenamed after the acquisition or are delisted. The availability of firm-level datain Compustat varies significantly by year and by variable. For example, the
10See Appendix I for a list of tax-haven markets as defined by the OECD (2008).
FOREIGN OWNERSHIP AND FIRM PERFORMANCE
7
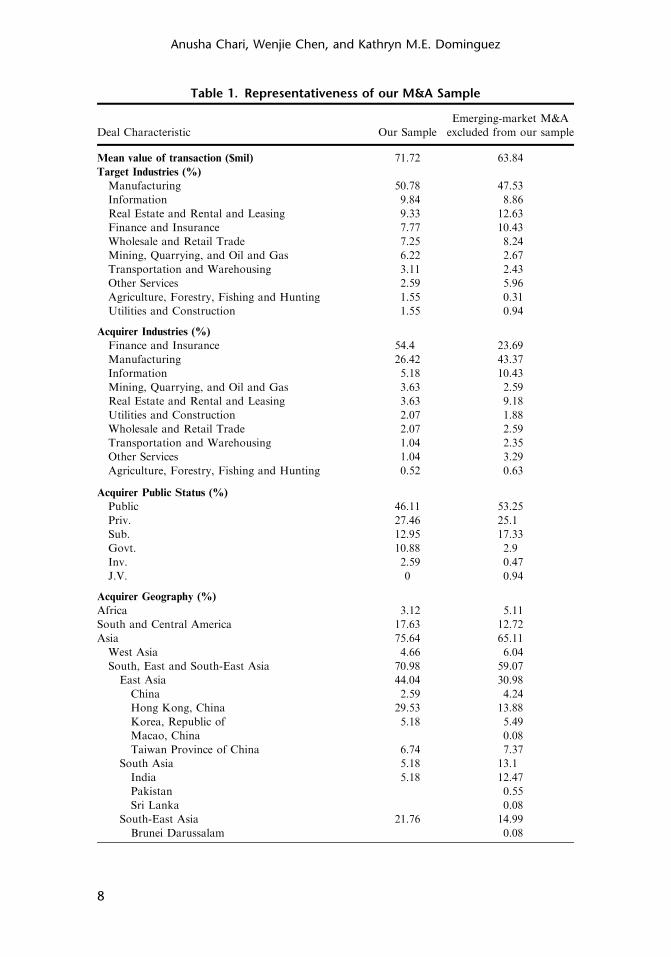
Table 1. Representativeness of our M&A Sample
Deal Characteristic Our Sample
Emerging-market M&A
excluded from our sample
Mean value of transaction ($mil) 71.72 63.84
Target Industries (%)
Manufacturing 50.78 47.53
Information 9.84 8.86
Real Estate and Rental and Leasing 9.33 12.63
Finance and Insurance 7.77 10.43
Wholesale and Retail Trade 7.25 8.24
Mining, Quarrying, and Oil and Gas 6.22 2.67
Transportation and Warehousing 3.11 2.43
Other Services 2.59 5.96
Agriculture, Forestry, Fishing and Hunting 1.55 0.31
Utilities and Construction 1.55 0.94
Acquirer Industries (%)
Finance and Insurance 54.4 23.69
Manufacturing 26.42 43.37
Information 5.18 10.43
Mining, Quarrying, and Oil and Gas 3.63 2.59
Real Estate and Rental and Leasing 3.63 9.18
Utilities and Construction 2.07 1.88
Wholesale and Retail Trade 2.07 2.59
Transportation and Warehousing 1.04 2.35
Other Services 1.04 3.29
Agriculture, Forestry, Fishing and Hunting 0.52 0.63
Acquirer Public Status (%)
Public 46.11 53.25
Priv. 27.46 25.1
Sub. 12.95 17.33
Govt. 10.88 2.9
Inv. 2.59 0.47
J.V. 0 0.94
Acquirer Geography (%)
Africa 3.12 5.11
South and Central America 17.63 12.72
Asia 75.64 65.11
West Asia 4.66 6.04
South, East and South-East Asia 70.98 59.07
East Asia 44.04 30.98
China 2.59 4.24
Hong Kong, China 29.53 13.88
Korea, Republic of 5.18 5.49
Macao, China 0.08
Taiwan Province of China 6.74 7.37
South Asia 5.18 13.1
India 5.18 12.47
Pakistan 0.55
Sri Lanka 0.08
South-East Asia 21.76 14.99
Brunei Darussalam 0.08
Anusha Chari, Wenjie Chen, and Kathryn M.E. Dominguez
8
employment variable is only reported on a voluntary basis in Compustat. Out ofthe original 214 transactions between emerging country acquirers and publicU.S. targets in the SDC data set, roughly 120 firms (56 percent) have accountingperformance variables reported in Compustat over the five years postacquisitionand 175 firms (81 percent) have usable stock returns data in CRSP.
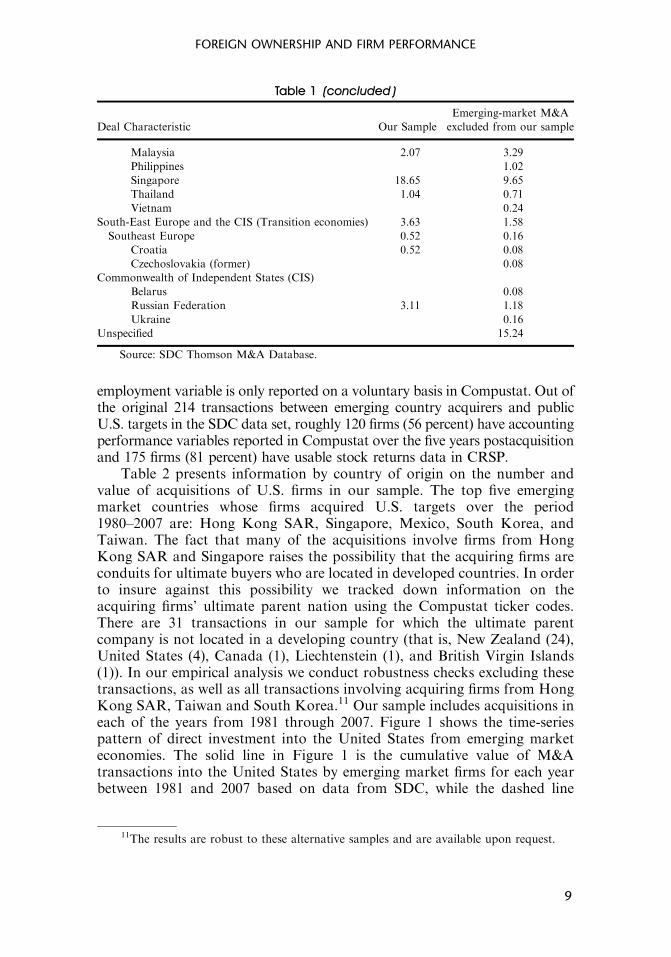
Table 2 presents information by country of origin on the number andvalue of acquisitions of U.S. firms in our sample. The top five emergingmarket countries whose firms acquired U.S. targets over the period1980–2007 are: Hong Kong SAR, Singapore, Mexico, South Korea, andTaiwan. The fact that many of the acquisitions involve firms from HongKong SAR and Singapore raises the possibility that the acquiring firms areconduits for ultimate buyers who are located in developed countries. In orderto insure against this possibility we tracked down information on theacquiring firms’ ultimate parent nation using the Compustat ticker codes.There are 31 transactions in our sample for which the ultimate parentcompany is not located in a developing country (that is, New Zealand (24),United States (4), Canada (1), Liechtenstein (1), and British Virgin Islands(1)). In our empirical analysis we conduct robustness checks excluding thesetransactions, as well as all transactions involving acquiring firms from HongKong SAR, Taiwan and South Korea.11 Our sample includes acquisitions ineach of the years from 1981 through 2007. Figure 1 shows the time-seriespattern of direct investment into the United States from emerging marketeconomies. The solid line in Figure 1 is the cumulative value of M&Atransactions into the United States by emerging market firms for each yearbetween 1981 and 2007 based on data from SDC, while the dashed line
Table 1 (concluded )
Deal Characteristic Our Sample
Emerging-market M&A
excluded from our sample
Malaysia 2.07 3.29
Philippines 1.02
Singapore 18.65 9.65
Thailand 1.04 0.71
Vietnam 0.24
South-East Europe and the CIS (Transition economies) 3.63 1.58
Southeast Europe 0.52 0.16
Croatia 0.52 0.08
Czechoslovakia (former) 0.08
Commonwealth of Independent States (CIS)
Belarus 0.08
Russian Federation 3.11 1.18
Ukraine 0.16
Unspecified 15.24
Source: SDC Thomson M&A Database.
11The results are robust to these alternative samples and are available upon request.
FOREIGN OWNERSHIP AND FIRM PERFORMANCE
9
depicts U.S. investment outlays undertaken by emerging market investorsbased on BEA data. The SDC and BEA data show a dramatic increase inemerging market cross-border M&A in the latter half of the 2000s. Theinvestment outlays into the United States made by emerging market firmsmimic the net purchase data from UNCTAD with a small surge in 2000, anda more pronounced surge in the latter half of the decade beginning in 2004.
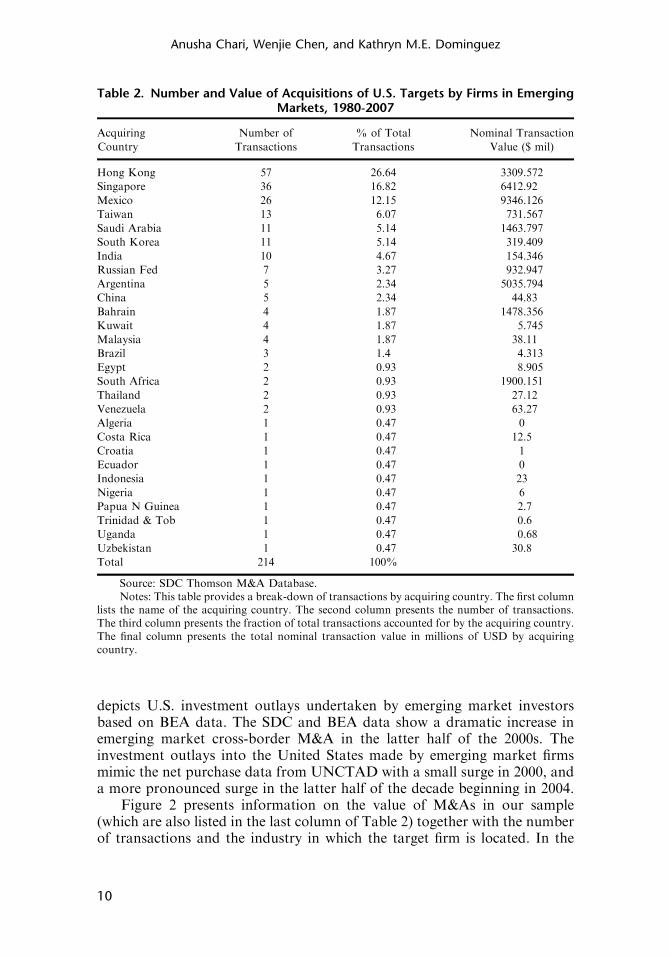
Figure 2 presents information on the value of M&As in our sample(which are also listed in the last column of Table 2) together with the numberof transactions and the industry in which the target firm is located. In the
Table 2. Number and Value of Acquisitions of U.S. Targets by Firms in EmergingMarkets, 1980-2007
Acquiring
Country
Number of
Transactions
% of Total
Transactions
Nominal Transaction
Value ($ mil)
Hong Kong 57 26.64 3309.572
Singapore 36 16.82 6412.92
Mexico 26 12.15 9346.126
Taiwan 13 6.07 731.567
Saudi Arabia 11 5.14 1463.797
South Korea 11 5.14 319.409
India 10 4.67 154.346
Russian Fed 7 3.27 932.947
Argentina 5 2.34 5035.794
China 5 2.34 44.83
Bahrain 4 1.87 1478.356
Kuwait 4 1.87 5.745
Malaysia 4 1.87 38.11
Brazil 3 1.4 4.313
Egypt 2 0.93 8.905
South Africa 2 0.93 1900.151
Thailand 2 0.93 27.12
Venezuela 2 0.93 63.27
Algeria 1 0.47 0
Costa Rica 1 0.47 12.5
Croatia 1 0.47 1
Ecuador 1 0.47 0
Indonesia 1 0.47 23
Nigeria 1 0.47 6
Papua N Guinea 1 0.47 2.7
Trinidad & Tob 1 0.47 0.6
Uganda 1 0.47 0.68
Uzbekistan 1 0.47 30.8
Total 214 100%
Source: SDC Thomson M&A Database.Notes: This table provides a break-down of transactions by acquiring country. The first column
lists the name of the acquiring country. The second column presents the number of transactions.The third column presents the fraction of total transactions accounted for by the acquiring country.The final column presents the total nominal transaction value in millions of USD by acquiringcountry.
Anusha Chari, Wenjie Chen, and Kathryn M.E. Dominguez
10
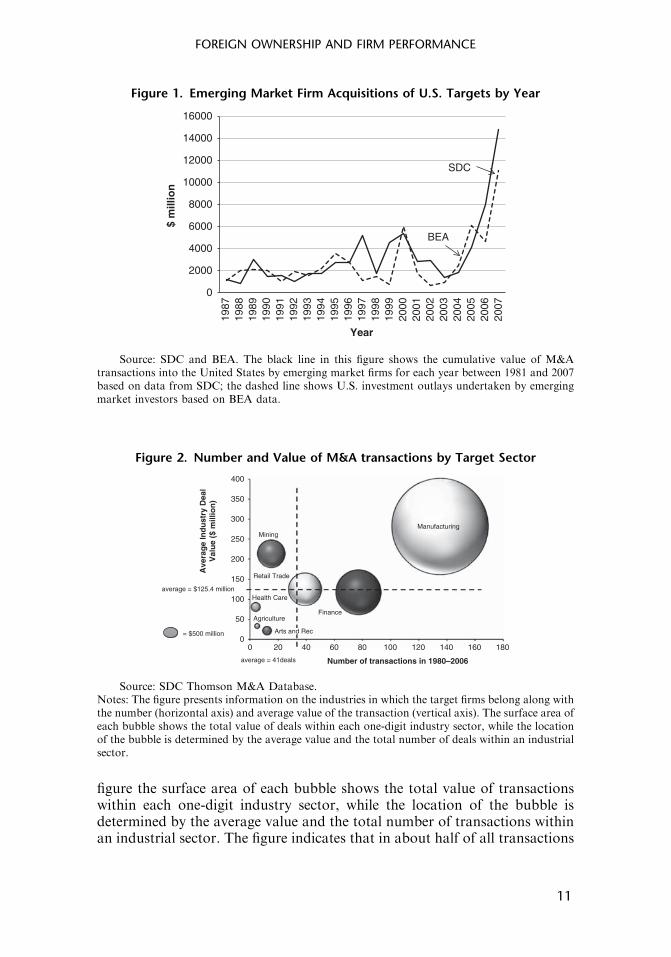
figure the surface area of each bubble shows the total value of transactionswithin each one-digit industry sector, while the location of the bubble isdetermined by the average value and the total number of transactions withinan industrial sector. The figure indicates that in about half of all transactions
Figure 1. Emerging Market Firm Acquisitions of U.S. Targets by Year
0
2000
4000
6000
8000
10000
12000
14000
16000
1987
1988
1989
1990
1991
1992
1993
1994
1995
1996
1997
1998
1999
2000
2001
2002
2003
2004
2005
2006
2007
$ m
illio
n
Year
SDC
BEA
Source: SDC and BEA. The black line in this figure shows the cumulative value of M&Atransactions into the United States by emerging market firms for each year between 1981 and 2007based on data from SDC; the dashed line shows U.S. investment outlays undertaken by emergingmarket investors based on BEA data.
Figure 2. Number and Value of M&A transactions by Target Sector
0
50
100
150
200
250
300
350
400
0 20 40 60 80 100 120 140 160 180
Ave
rag
e In
du
stry
Dea
lV
alu
e ($
mill
ion
)
Manufacturing
= $500 million
average = $125.4 million
average = 41deals
Mining
Finance
Retail Trade
Health Care
Agriculture
Arts and Rec
Number of transactions in 1980–2006
Source: SDC Thomson M&A Database.Notes: The figure presents information on the industries in which the target firms belong along withthe number (horizontal axis) and average value of the transaction (vertical axis). The surface area ofeach bubble shows the total value of deals within each one-digit industry sector, while the locationof the bubble is determined by the average value and the total number of deals within an industrialsector.
FOREIGN OWNERSHIP AND FIRM PERFORMANCE
11
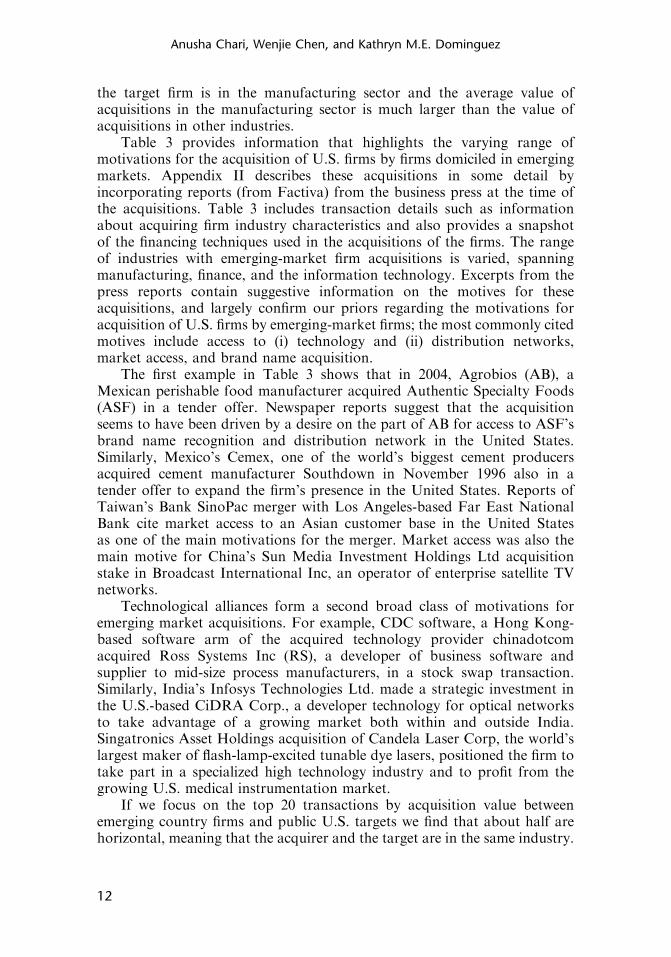
the target firm is in the manufacturing sector and the average value ofacquisitions in the manufacturing sector is much larger than the value ofacquisitions in other industries.
Table 3 provides information that highlights the varying range ofmotivations for the acquisition of U.S. firms by firms domiciled in emergingmarkets. Appendix II describes these acquisitions in some detail byincorporating reports (from Factiva) from the business press at the time ofthe acquisitions. Table 3 includes transaction details such as informationabout acquiring firm industry characteristics and also provides a snapshotof the financing techniques used in the acquisitions of the firms. The rangeof industries with emerging-market firm acquisitions is varied, spanningmanufacturing, finance, and the information technology. Excerpts from thepress reports contain suggestive information on the motives for theseacquisitions, and largely confirm our priors regarding the motivations foracquisition of U.S. firms by emerging-market firms; the most commonly citedmotives include access to (i) technology and (ii) distribution networks,market access, and brand name acquisition.
The first example in Table 3 shows that in 2004, Agrobios (AB), aMexican perishable food manufacturer acquired Authentic Specialty Foods(ASF) in a tender offer. Newspaper reports suggest that the acquisitionseems to have been driven by a desire on the part of AB for access to ASF’sbrand name recognition and distribution network in the United States.Similarly, Mexico’s Cemex, one of the world’s biggest cement producersacquired cement manufacturer Southdown in November 1996 also in atender offer to expand the firm’s presence in the United States. Reports ofTaiwan’s Bank SinoPac merger with Los Angeles-based Far East NationalBank cite market access to an Asian customer base in the United Statesas one of the main motivations for the merger. Market access was also themain motive for China’s Sun Media Investment Holdings Ltd acquisitionstake in Broadcast International Inc, an operator of enterprise satellite TVnetworks.
Technological alliances form a second broad class of motivations foremerging market acquisitions. For example, CDC software, a Hong Kong-based software arm of the acquired technology provider chinadotcomacquired Ross Systems Inc (RS), a developer of business software andsupplier to mid-size process manufacturers, in a stock swap transaction.Similarly, India’s Infosys Technologies Ltd. made a strategic investment inthe U.S.-based CiDRA Corp., a developer technology for optical networksto take advantage of a growing market both within and outside India.Singatronics Asset Holdings acquisition of Candela Laser Corp, the world’slargest maker of flash-lamp-excited tunable dye lasers, positioned the firm totake part in a specialized high technology industry and to profit from thegrowing U.S. medical instrumentation market.
If we focus on the top 20 transactions by acquisition value betweenemerging country firms and public U.S. targets we find that about half arehorizontal, meaning that the acquirer and the target are in the same industry.
Anusha Chari, Wenjie Chen, and Kathryn M.E. Dominguez
12
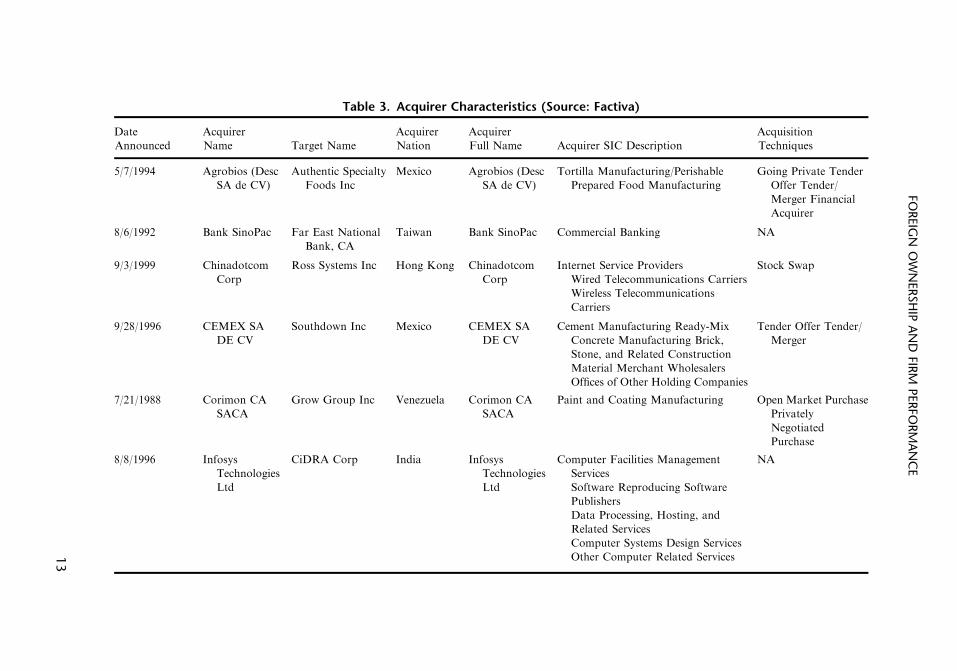
Table 3. Acquirer Characteristics (Source: Factiva)
Date
Announced
Acquirer
Name Target Name
Acquirer
Nation
Acquirer
Full Name Acquirer SIC Description
Acquisition
Techniques
5/7/1994 Agrobios (Desc
SA de CV)
Authentic Specialty
Foods Inc
Mexico Agrobios (Desc
SA de CV)
Tortilla Manufacturing/Perishable
Prepared Food Manufacturing
Going Private Tender
Offer Tender/
Merger Financial
Acquirer
8/6/1992 Bank SinoPac Far East National
Bank, CA
Taiwan Bank SinoPac Commercial Banking NA
9/3/1999 Chinadotcom
Corp
Ross Systems Inc Hong Kong Chinadotcom
Corp
Internet Service Providers
Wired Telecommunications Carriers
Wireless Telecommunications
Carriers
Stock Swap
9/28/1996 CEMEX SA
DE CV
Southdown Inc Mexico CEMEX SA
DE CV
Cement Manufacturing Ready-Mix
Concrete Manufacturing Brick,
Stone, and Related Construction
Material Merchant Wholesalers
Offices of Other Holding Companies
Tender Offer Tender/
Merger
7/21/1988 Corimon CA
SACA
Grow Group Inc Venezuela Corimon CA
SACA
Paint and Coating Manufacturing Open Market Purchase
Privately
Negotiated
Purchase
8/8/1996 Infosys
Technologies
Ltd
CiDRA Corp India Infosys
Technologies
Ltd
Computer Facilities Management
Services
Software Reproducing Software
Publishers
Data Processing, Hosting, and
Related Services
Computer Systems Design Services
Other Computer Related Services
NA
FOREIG
NO
WN
ERSH
IPA
ND
FIRM
PERFO
RM
AN
CE
13
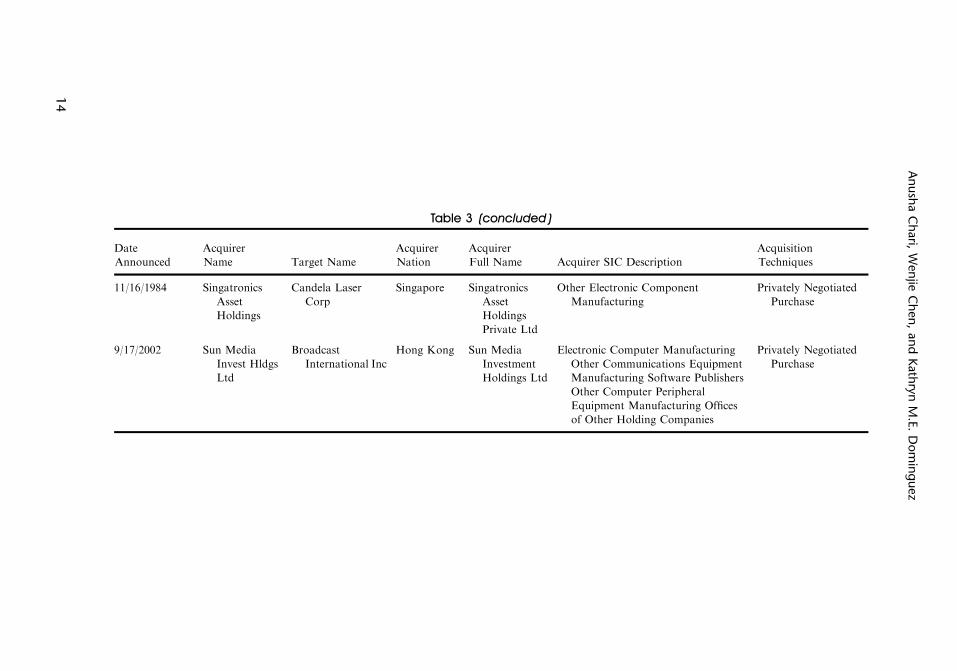
Table 3 (concluded )
Date
Announced
Acquirer
Name Target Name
Acquirer
Nation
Acquirer
Full Name Acquirer SIC Description
Acquisition
Techniques
11/16/1984 Singatronics
Asset
Holdings
Candela Laser
Corp
Singapore Singatronics
Asset
Holdings
Private Ltd
Other Electronic Component
Manufacturing
Privately Negotiated
Purchase
9/17/2002 Sun Media
Invest Hldgs
Ltd
Broadcast
International Inc
Hong Kong Sun Media
Investment
Holdings Ltd
Electronic Computer Manufacturing
Other Communications Equipment
Manufacturing Software Publishers
Other Computer Peripheral
Equipment Manufacturing Offices
of Other Holding Companies
Privately Negotiated
Purchase
An
ush
aC
hari,
Wen
jieC
hen
,an
dK
ath
ryn
M.E
.D
om
ing
uez
14
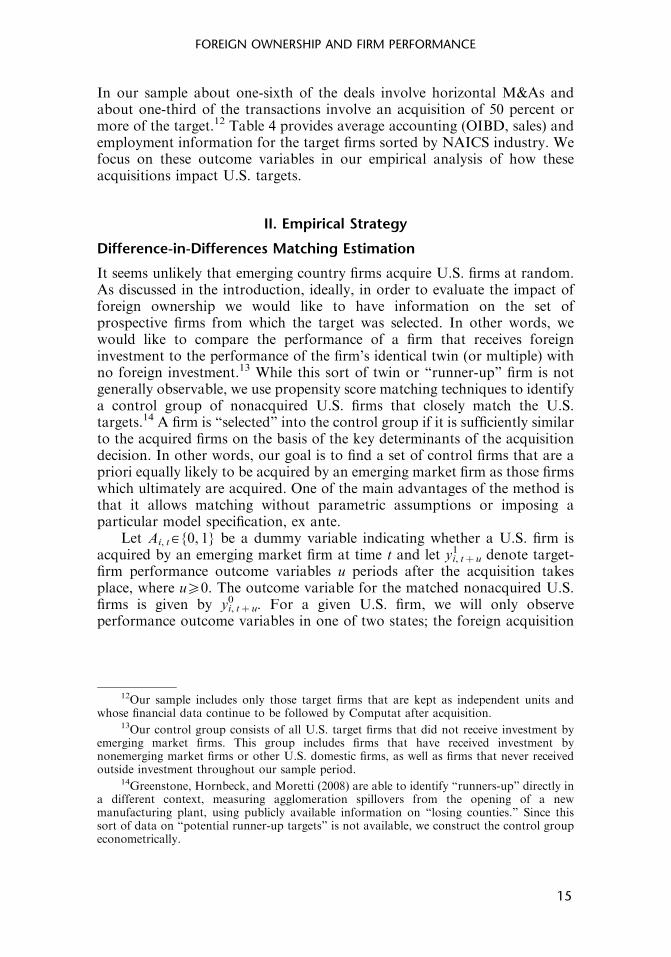
In our sample about one-sixth of the deals involve horizontal M&As andabout one-third of the transactions involve an acquisition of 50 percent ormore of the target.12 Table 4 provides average accounting (OIBD, sales) andemployment information for the target firms sorted by NAICS industry. Wefocus on these outcome variables in our empirical analysis of how theseacquisitions impact U.S. targets.
II. Empirical Strategy
Difference-in-Differences Matching Estimation
It seems unlikely that emerging country firms acquire U.S. firms at random.As discussed in the introduction, ideally, in order to evaluate the impact offoreign ownership we would like to have information on the set ofprospective firms from which the target was selected. In other words, wewould like to compare the performance of a firm that receives foreigninvestment to the performance of the firm’s identical twin (or multiple) withno foreign investment.13 While this sort of twin or “runner-up” firm is notgenerally observable, we use propensity score matching techniques to identifya control group of nonacquired U.S. firms that closely match the U.S.targets.14 A firm is “selected” into the control group if it is sufficiently similarto the acquired firms on the basis of the key determinants of the acquisitiondecision. In other words, our goal is to find a set of control firms that are apriori equally likely to be acquired by an emerging market firm as those firmswhich ultimately are acquired. One of the main advantages of the method isthat it allows matching without parametric assumptions or imposing aparticular model specification, ex ante.
Let Ai, tA{0, 1} be a dummy variable indicating whether a U.S. firm isacquired by an emerging market firm at time t and let yi, tþ u
1 denote target-firm performance outcome variables u periods after the acquisition takesplace, where uX0. The outcome variable for the matched nonacquired U.S.firms is given by yi, tþ u
0 . For a given U.S. firm, we will only observeperformance outcome variables in one of two states; the foreign acquisition
12Our sample includes only those target firms that are kept as independent units andwhose financial data continue to be followed by Computat after acquisition.
13Our control group consists of all U.S. target firms that did not receive investment byemerging market firms. This group includes firms that have received investment bynonemerging market firms or other U.S. domestic firms, as well as firms that never receivedoutside investment throughout our sample period.
14Greenstone, Hornbeck, and Moretti (2008) are able to identify “runners-up” directly ina different context, measuring agglomeration spillovers from the opening of a newmanufacturing plant, using publicly available information on “losing counties.” Since thissort of data on “potential runner-up targets” is not available, we construct the control groupeconometrically.
FOREIGN OWNERSHIP AND FIRM PERFORMANCE
15
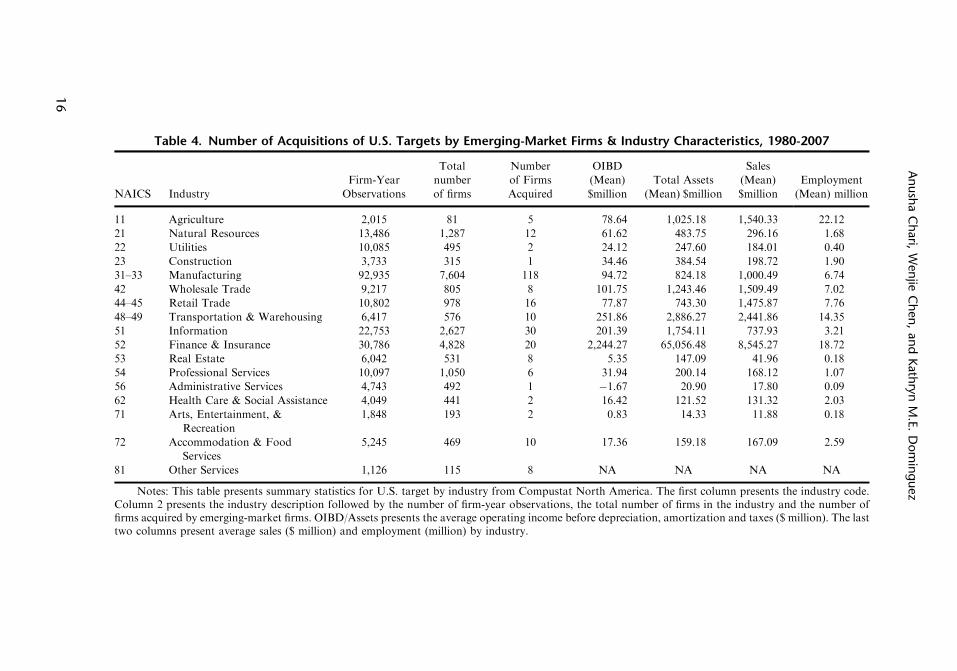
Table 4. Number of Acquisitions of U.S. Targets by Emerging-Market Firms & Industry Characteristics, 1980-2007
NAICS Industry
Firm-Year
Observations
Total
number
of firms
Number
of Firms
Acquired
OIBD
(Mean)
$million
Total Assets
(Mean) $million
Sales
(Mean)
$million
Employment
(Mean) million
11 Agriculture 2,015 81 5 78.64 1,025.18 1,540.33 22.12
21 Natural Resources 13,486 1,287 12 61.62 483.75 296.16 1.68
22 Utilities 10,085 495 2 24.12 247.60 184.01 0.40
23 Construction 3,733 315 1 34.46 384.54 198.72 1.90
31–33 Manufacturing 92,935 7,604 118 94.72 824.18 1,000.49 6.74
42 Wholesale Trade 9,217 805 8 101.75 1,243.46 1,509.49 7.02
44–45 Retail Trade 10,802 978 16 77.87 743.30 1,475.87 7.76
48–49 Transportation & Warehousing 6,417 576 10 251.86 2,886.27 2,441.86 14.35
51 Information 22,753 2,627 30 201.39 1,754.11 737.93 3.21
52 Finance & Insurance 30,786 4,828 20 2,244.27 65,056.48 8,545.27 18.72
53 Real Estate 6,042 531 8 5.35 147.09 41.96 0.18
54 Professional Services 10,097 1,050 6 31.94 200.14 168.12 1.07
56 Administrative Services 4,743 492 1 �1.67 20.90 17.80 0.09
62 Health Care & Social Assistance 4,049 441 2 16.42 121.52 131.32 2.03
71 Arts, Entertainment, &
Recreation
1,848 193 2 0.83 14.33 11.88 0.18
72 Accommodation & Food
Services
5,245 469 10 17.36 159.18 167.09 2.59
81 Other Services 1,126 115 8 NA NA NA NA
Notes: This table presents summary statistics for U.S. target by industry from Compustat North America. The first column presents the industry code.Column 2 presents the industry description followed by the number of firm-year observations, the total number of firms in the industry and the number offirms acquired by emerging-market firms. OIBD/Assets presents the average operating income before depreciation, amortization and taxes ($ million). The lasttwo columns present average sales ($ million) and employment (million) by industry.
An
ush
aC
hari,
Wen
jieC
hen
,an
dK
ath
ryn
M.E
.D
om
ing
uez
16
(yi, tþ u1 ), or not (yi, tþ u
0 ). The average effect of an emerging market firmacquisition takes place of a U.S. target is the following:
E½y1i;tþu � y0i;tþujA ¼ 1� ¼ E½y1i;tþujA ¼ 1� � E½y0i;tþujA ¼ 0�
� E½y0i;tþujA ¼ 1� � E½y0i;tþujA ¼ 0�n o
The term in the first line is the average treatment effect on the treated(ATET), and the term in braces in the second line is a “selection” term, whichis zero if the assignment to the treatment and control groups is random. Ourassumption is that firms have observable characteristics, X, that make themattractive targets. Our approach is to match acquired and nonacquired firmson the basis of these Xs and then calculate the treatment differential (theeffect of being acquired) for each of the outcome variables of interest. Theaverage of the differential over all acquired firms and all Xs measuresthe average effect of foreign acquisition. Formally, Angrist and Krueger(1999) show that effect of the treatment on the treated is given by:
E½y1i;tþu � y0i;tþujA ¼ 1�
¼ E E½y1i;tþujX;A ¼ 1� � E½y0i;tþujX;A ¼ 0�jA ¼ 1n o
¼ E½DxjA ¼ 1�;
where Dx¼E [ yi, tþ u1 |X,A¼ 1]�E [ yi, tþ u
0 |X,A¼ 0]. The underlying assump-tion is that all the firms (whether acquired or not) have the same expectedperformance under domestic ownership. This is referred to as the conditionalindependence assumption (CIA): E [ yi, tþ u
0 |X,A¼ 1]¼E [ yi, tþ u0 |X,A¼ 0]¼
E [ yi, tþ u0 |X ].For the CIA to be satisfied, the vector X should contain all variables that
affect both acquisition and performance outcomes. The choice of variablesincluded in X is described in more detail below. Another assumption requiredfor matching is that it should not be possible to predict the probability of aforeign acquisition perfectly, that is 0oPr(A¼ 1|X )o1.
Matching on a vector of variables is difficult because it requires weightingdifferences in one dimension against another. Rosenbaum and Rubin (1983)provide a solution to this dimensionality problem by matching firms onpropensity scores, which in our context is the conditional probability of beingacquired by an emerging country firm given X:
Pi ¼ PrðAi;t ¼ AðXi;t�1ÞÞ:
This matching technique allows us to take into account differences inobservable characteristics across the firms in our database. We thencombine matching with difference-in-differences to eliminate the differencesbetween the acquired and control firms that are unobservable and timeinvariant.
Rather than treating each of our firms linearly and with the same weight,our difference-in-differences estimator paired with propensity score matching
FOREIGN OWNERSHIP AND FIRM PERFORMANCE
17
allows us to include only acquired firms within the common support andpicks control firms according to the metric function specific to the matchingmethod. The common support refers to treated firms that do not lie abovethe maximum or below the minimum propensity score for the matchedcontrol group.
In our analysis, after we generate the propensity scores using a probitestimation, we apply propensity score reweighting paired with difference-in-differences. The second step of the estimation procedure allows us tocontrol for other covariates that might also impact a firm’s performance aswell as controlling for industry, year and state fixed effects.15 The combinedpropensity score reweighting and difference-in-differences estimator for theaverage treatment effect on the treated is as follows:
1
n
Xni¼1
pðXiÞy1tþu � y1t 0
pðXiÞ�
y0tþu � y0t 0
1� pðXiÞ
� �;
where p (Xi) is the predicted probability of U.S. firm being acquired by anemerging market acquirer and y1t 0 ðy0t 0 Þ is the performance of a U.S. firm inperiod t’ that is acquired at time t (1) or not acquired (0).
Note that the most common form of matching applied in theinternational trade literature has been, thus far, nearest neighbor matching.Yet, Frolich (2004) provides a Monte Carlo analysis comparing alternativematching estimators and suggests that nearest neighbor matching showspoor performance. Our sense is that the choice of matching depends largelyon the availability of data. Although all matching estimators are consistent,in finite samples, the choice of technique can make a difference. If comparisonobservations are few, single nearest neighbor matching performs poorly,since it draws from a diminishing pool of controls that might not be closematches. If comparison observations are plentiful and evenly distributed,nearest neighbor matching makes good use of the rich comparison groupdata.
In our analysis, the ranges in comparison observations are generallywide, but they are asymmetrically distributed because of the nature of ourfirm-level data. Therefore, nearest neighbor matching is not an ideal choice.Kernel matching could provide a plausible alternative approach since it usesthe additional data where it exists, but does not include poor matches. Asignificant drawback of kernel matching, however, is that it requires abandwidth selection and the small sample size of our treatment group canlead to instability in the standard error estimation.
The recent econometric literature finds that propensity score reweightinghas some attractive properties (Hirano, Imbens, and Ridder, 2003; Busso,DiNardo, and McCrary, 2008). In particular, this form of matching does notrequire a bandwidth, and can attain the semiparametric efficiency bound.
15See Ho and others (2007) for an excellent overview of the benefits of combiningpropensity score matching with standard parametric methods.
Anusha Chari, Wenjie Chen, and Kathryn M.E. Dominguez
18
Moreover, unlike nearest neighbor matching, the smoothness in thecontrol group selection lends itself well to bootstrap estimation of thestandard errors.
Evidence of Selection
In order to examine whether our assumption that firms are not randomlyselected for acquisition is justified we check whether firm characteristicsprior to acquisition are correlated with subsequent foreign ownership. Thetest involves a regression of the various firm-level performance measures ontwo dummy variables. The first dummy variable indicates those U.S. firmswith foreign ownership in year t. The second dummy variable is switched onthree years prior to the ownership change, for those U.S. firms that wereeventually foreign acquisition targets. We also control for industry, region,and year fixed effects in the regression. The estimation results, presentedin Table 5, illustrate that future foreign acquisition targets are larger in size,measured by log sales and log total assets, than nonacquired domestic firmsup to three years before acquisition.16 Furthermore, the regression estimatesindicate that acquired firms have more employees and higher debt thannonacquired firms. These systematic differences indicate that foreigninvestors do not choose target firms at random. Our analysis of thepostacquisition performance of U.S. firms takes this selection into account.
Timing Issues
Unlike longitudinal matching studies, where treatment occurs uniformly atone point in time, the firms in our data set are targets of acquisition atvarying times. This variation in treatment timing poses the challenge ofhow to assign counterfactual treatment dates to the firms that are notacquired by emerging-market firms. We follow Petkova’s (2008) approach ofproportional-random acquisition time assignment. We determine the fractionof the total number of acquisitions that occur in each calendar year duringour sample period, and then assign the hypothetical treatment year to thefirms in the control group in the same proportion as their occurrences in theacquisition group. For example, if one-tenth of all acquisitions occurred in1995 in our sample of targets, then one-tenth of all firms in the control groupreceive the hypothetical treatment year 1995. Before assigning the date, wemake sure that the control firm’s year of incorporation precedes thetreatment year and that the firm remains nonacquired throughout the entirespan of our data.
One drawback of the proportional-random acquisition time assignment isthat it does not take into account the timing of failed acquisition attempts
16Karolyi and Liao (2009) examine cross-border acquisitions by government-controlledacquirers and find that they are more likely to pursue larger targets than corporate acquirers.In our sample 22 of our 214 emerging market country acquirers (10 percent) are governmentcontrolled.
FOREIGN OWNERSHIP AND FIRM PERFORMANCE
19
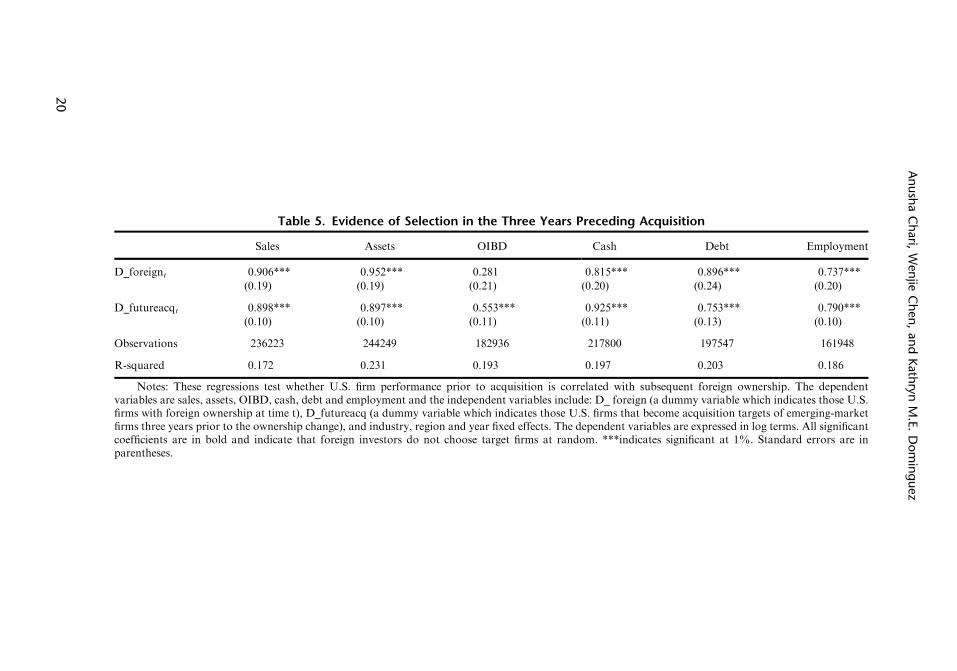
Table 5. Evidence of Selection in the Three Years Preceding Acquisition
Sales Assets OIBD Cash Debt Employment
D_foreignt 0.906*** 0.952*** 0.281 0.815*** 0.896*** 0.737***
(0.19) (0.19) (0.21) (0.20) (0.24) (0.20)
D_futureacqt 0.898*** 0.897*** 0.553*** 0.925*** 0.753*** 0.790***
(0.10) (0.10) (0.11) (0.11) (0.13) (0.10)
Observations 236223 244249 182936 217800 197547 161948
R-squared 0.172 0.231 0.193 0.197 0.203 0.186
Notes: These regressions test whether U.S. firm performance prior to acquisition is correlated with subsequent foreign ownership. The dependentvariables are sales, assets, OIBD, cash, debt and employment and the independent variables include: D_ foreign (a dummy variable which indicates those U.S.firms with foreign ownership at time t), D_futureacq (a dummy variable which indicates those U.S. firms that become acquisition targets of emerging-marketfirms three years prior to the ownership change), and industry, region and year fixed effects. The dependent variables are expressed in log terms. All significantcoefficients are in bold and indicate that foreign investors do not choose target firms at random. ***indicates significant at 1%. Standard errors are inparentheses.
An
ush
aC
hari,
Wen
jieC
hen
,an
dK
ath
ryn
M.E
.D
om
ing
uez
20
that may have occurred in different years than did the successful acquisitions.Unfortunately the limited information we have on failed acquisitions doesnot provide a large enough sample to use for this purpose. As an alternative,we run the analysis without timing constraints on the control groups andinstead allow each control firm to be matched with the treated firms multipletimes as long as their propensity scores are close to each other. Essentially,this is sampling with replacement. The results are robust to this alternativetiming method (and are available from the authors upon request).
Propensity Score Matching Estimation
After assigning the hypothetical foreign acquisition dates to the controlfirms that are not acquired (do not receive treatment) over our sample period,we need to realign the time-series data for each firm. More specifically, in theyear of acquisition (actual or hypothetical), we set t¼ 0, in the year followingthe acquisition t¼ 1, and in the year prior to the acquisition, t¼�1, and soon. The propensity score is the estimated probability of being acquired inperiod t¼ 0 based on firm characteristics in period t¼�1. We estimate thisprobability using a probit model, where the dummy variable Ai, t equals 1 inthe year a firm is the actual target of acquisition and zero otherwise.17
Choice of Covariates
We select our control group of nonacquired firms based on a set ofobservable characteristics that comprise the vector X. It is important to selectcovariates that affect the acquisition decision as well as the operatingperformance of the firm. Theory, institutional details, and earlier work in thisfield guide our choice of covariates. The control variables include factors thatdrive both the acquisition and performance of the firm, such as: age, size(measured by log of total assets, log of sales and log of employment),operating income, debt, cash, net income, and net property, plant, andequipment. In the estimation, the values of each of these variables are fromthe year prior to the actual or hypothetical acquisition year. In choosing theyear preceding the acquisition, there arises a concern of an “AshenfelterDip.” This term is based on the finding in Ashenfelter (1978) that in jobprogram evaluations, participants tend to experience a temporary decline inearnings prior to enrolling in a program. In this dataset of target firms,however, there is no visible decline in target firm accounting performance inthe year prior to acquisition. As a robustness check we also use variables inthree or five years prior to the acquisition and the results remain unchanged.
The age of a firm indicates the maturity of a potential target. Variablessuch as total assets and sales convey information about the market size of thetarget firm as well as its productive capacity. Operating income before
17Alternatively, we could also assign zero to a target firm where there has been anacquisition announcement that eventually fell through. Owing to the limited number of suchcases, however, this analysis was not feasible.
FOREIGN OWNERSHIP AND FIRM PERFORMANCE
21
depreciation (OIBD) and net income describe the profitability of the targetfirm. Debt and cash variables are financing variables. Property, plant andequipment (PP&E) measure the physical capital stock of a firm.
Lastly, year, region and industry dummies are in the vector of controlvariables, where industry dummies are based on 2-digit NAICS codes andregional dummies are based on the U.S. state where the target firm is located.Industry dummies serve as controls for industry-specific performance aswell as predictors of acquisition preferences. Year dummies control forbusiness cycle fluctuations that impact both selection and performance ofthe target firm. State dummies control for the different tax laws where thetarget firm is located that have an impact on selection and performance.These fixed effects are of particular importance because existing papers inthe area of FDI show that foreign firms select their target firms in certainindustries and states (Harris and Ravenscraft, 1990; Haskel, Pereira, andSlaughter, 2007).
We also use a range of alternative covariates in our estimation includinga 4-digit industry market share constructed using all firms in Compustat,and Research and Development (R&D) expenses. The results using thesecovariates are not significantly different from those we obtain without theaddition of these variables, though their inclusion reduces our sample sizeconsiderably.18
III. Results
Preliminary Evidence: Stock Market Reaction toAcquisition Announcements
If capital markets are semistrong form efficient with respect to public infor-mation, stock prices will quickly adjust following an acquisition announcement,incorporating any expected value changes (Andrade, Mitchell, and Stafford,2001). The two commonly used event windows are the three days imme-diately surrounding the acquisition announcement, and a longer windowbeginning several days prior to the announcement and ending at the close ofthe acquisition. As a first step, we examine the abnormal stock return for theacquired targets around various different windows of time surrounding theannouncement of the acquisition.
We calculate the mean cumulative return of the target stock price withina 1, 3, and 20-day window of the announcement date. We assume that stockprices follow a single factor market model. Our estimation period is 280 daysbefore and up until 30 days preceding the event date. Using a standardized
18Other potential candidates for the covariates, such as firm-level imports and exports, thenumber of patents held, variables related to managerial skill, capital expenditure, advertisingexpenses or major brands owned, are unfortunately not available for most of the firms in oursample.
Anusha Chari, Wenjie Chen, and Kathryn M.E. Dominguez
22
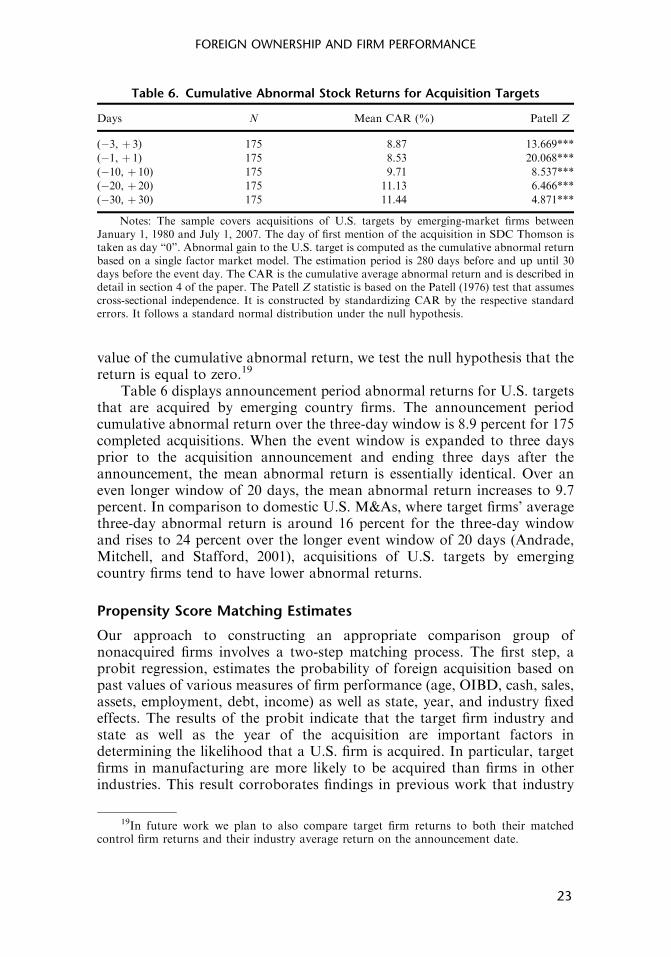
value of the cumulative abnormal return, we test the null hypothesis that thereturn is equal to zero.19
Table 6 displays announcement period abnormal returns for U.S. targetsthat are acquired by emerging country firms. The announcement periodcumulative abnormal return over the three-day window is 8.9 percent for 175completed acquisitions. When the event window is expanded to three daysprior to the acquisition announcement and ending three days after theannouncement, the mean abnormal return is essentially identical. Over aneven longer window of 20 days, the mean abnormal return increases to 9.7percent. In comparison to domestic U.S. M&As, where target firms’ averagethree-day abnormal return is around 16 percent for the three-day windowand rises to 24 percent over the longer event window of 20 days (Andrade,Mitchell, and Stafford, 2001), acquisitions of U.S. targets by emergingcountry firms tend to have lower abnormal returns.
Propensity Score Matching Estimates
Our approach to constructing an appropriate comparison group ofnonacquired firms involves a two-step matching process. The first step, aprobit regression, estimates the probability of foreign acquisition based onpast values of various measures of firm performance (age, OIBD, cash, sales,assets, employment, debt, income) as well as state, year, and industry fixedeffects. The results of the probit indicate that the target firm industry andstate as well as the year of the acquisition are important factors indetermining the likelihood that a U.S. firm is acquired. In particular, targetfirms in manufacturing are more likely to be acquired than firms in otherindustries. This result corroborates findings in previous work that industry
Table 6. Cumulative Abnormal Stock Returns for Acquisition Targets
Days N Mean CAR (%) Patell Z
(�3, þ 3) 175 8.87 13.669***
(�1, þ 1) 175 8.53 20.068***
(�10, þ 10) 175 9.71 8.537***
(�20, þ 20) 175 11.13 6.466***
(�30, þ 30) 175 11.44 4.871***
Notes: The sample covers acquisitions of U.S. targets by emerging-market firms betweenJanuary 1, 1980 and July 1, 2007. The day of first mention of the acquisition in SDC Thomson istaken as day “0”. Abnormal gain to the U.S. target is computed as the cumulative abnormal returnbased on a single factor market model. The estimation period is 280 days before and up until 30days before the event day. The CAR is the cumulative average abnormal return and is described indetail in section 4 of the paper. The Patell Z statistic is based on the Patell (1976) test that assumescross-sectional independence. It is constructed by standardizing CAR by the respective standarderrors. It follows a standard normal distribution under the null hypothesis.
19In future work we plan to also compare target firm returns to both their matchedcontrol firm returns and their industry average return on the announcement date.
FOREIGN OWNERSHIP AND FIRM PERFORMANCE
23
and taxes play major roles in acquisition decisions. In terms of financialcharacteristics, we find that firms with more cash are more likely to beacquired. In our sensitivity checks, we perform tests using subsamples offirms in similar industries to take this heterogeneity into account, and findthat the results are robust.
As mentioned in the methodology section, we impose a common supportby dropping treatment observations (firms that are acquired) whosepropensity score is higher than the maximum or less than the minimumpropensity score of the nonacquired (control) firms. The second step involvesusing the propensity scores as weights to create the control groups andcombining it with a difference-in-differences approach. This second stepinvolves running a weighted difference-in-differences regression, using thepropensity score as weights. Owing to the parametric nature of the secondstep, we can also include other covariates that explain firm performance aswell as control for industry, year, and state fixed effects.
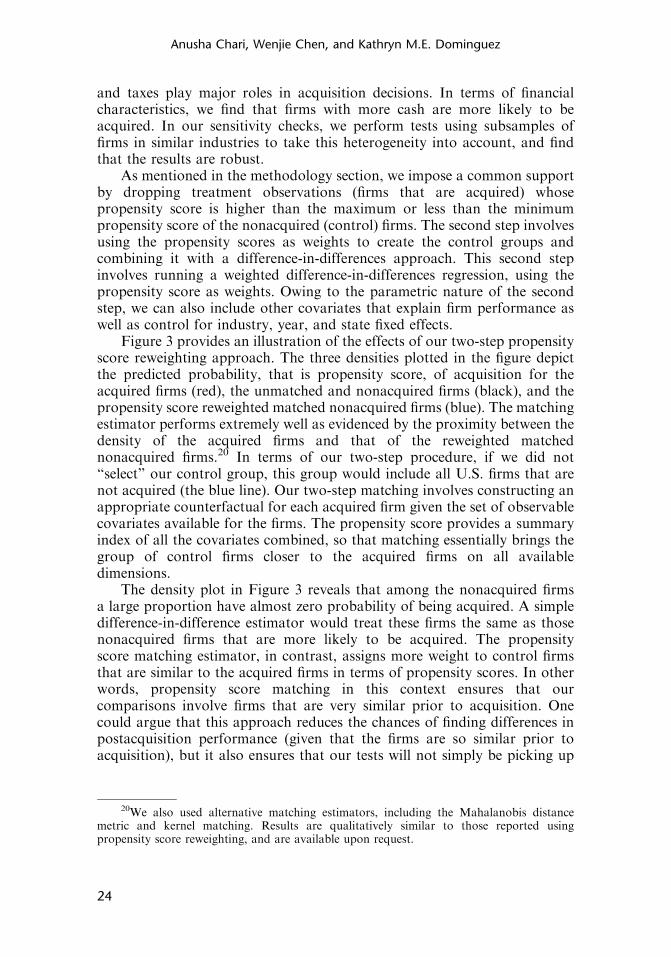
Figure 3 provides an illustration of the effects of our two-step propensityscore reweighting approach. The three densities plotted in the figure depictthe predicted probability, that is propensity score, of acquisition for theacquired firms (red), the unmatched and nonacquired firms (black), and thepropensity score reweighted matched nonacquired firms (blue). The matchingestimator performs extremely well as evidenced by the proximity between thedensity of the acquired firms and that of the reweighted matchednonacquired firms.20 In terms of our two-step procedure, if we did not“select” our control group, this group would include all U.S. firms that arenot acquired (the blue line). Our two-step matching involves constructing anappropriate counterfactual for each acquired firm given the set of observablecovariates available for the firms. The propensity score provides a summaryindex of all the covariates combined, so that matching essentially brings thegroup of control firms closer to the acquired firms on all availabledimensions.
The density plot in Figure 3 reveals that among the nonacquired firmsa large proportion have almost zero probability of being acquired. A simpledifference-in-difference estimator would treat these firms the same as thosenonacquired firms that are more likely to be acquired. The propensityscore matching estimator, in contrast, assigns more weight to control firmsthat are similar to the acquired firms in terms of propensity scores. In otherwords, propensity score matching in this context ensures that ourcomparisons involve firms that are very similar prior to acquisition. Onecould argue that this approach reduces the chances of finding differences inpostacquisition performance (given that the firms are so similar prior toacquisition), but it also ensures that our tests will not simply be picking up
20We also used alternative matching estimators, including the Mahalanobis distancemetric and kernel matching. Results are qualitatively similar to those reported usingpropensity score reweighting, and are available upon request.
Anusha Chari, Wenjie Chen, and Kathryn M.E. Dominguez
24
differences in acquired and nonacquired firm performance that are unrelatedto acquisition.
Balancing Tests
One way to assess the performance of our propensity score matching is tocalculate the standardized differences for the covariates in our probitregression. Specifically, for each covariate, we take the average differencebetween the acquired firms and the matched control firms and normalize it bythe pooled standard deviation of the covariate in the acquired and controlgroup samples. Based on Rosenbaum and Rubin (1985), we calculate thefollowing measure:
SDiffðXkÞ ¼ 100
1n1
Pi2fAi¼1g
½Xki �P
j2fAj¼0gWðPi;PjÞXkj�
ffiffiffiffiffiffiffiffiffiffiffiffiffiffiffiffiffiffiffiffiffiffiffiffiffiffiffiffiffiffiffiffiffiffiffiffiffiffiffiffiffiffiffiffiffiffiffiffivari2fAi¼1gðXkiÞþvarj2fAj¼0gðXkjÞ
2
q ;
where n1 is the number of acquired firms and n0 is the number of nonacquiredfirms in the control group.
Table 7 shows that our propensity score method does a good job ofmatching a set of control group firms that were not acquired to the set of
Figure 3. Propensity Scores for Acquired (Treated), Control(Matched Nontreated), and Nontreated Nonweighted Firms
Non-Matched Control
Matched (reweighted) Control
Treated
0
10
20
30
dens
ity
0 0.1 0.2 0.3 0.4 0.5prop score
Propensity Score
Source: Authors’ calculations based on SDC Thomson M&A Database and Compustat NorthAmerica 1980–2006.Notes: This figure provides an illustration of the effects of our two-step propensity score matchingapproach. The three densities plotted in the figure depict the predicted probability, that is propensityscore, of acquisition for the acquired firms (red, dashed), the nonweighted and nonacquired firms(black), and the reweighted propensity score matched nonacquired firms (blue, dotted).
FOREIGN OWNERSHIP AND FIRM PERFORMANCE
25
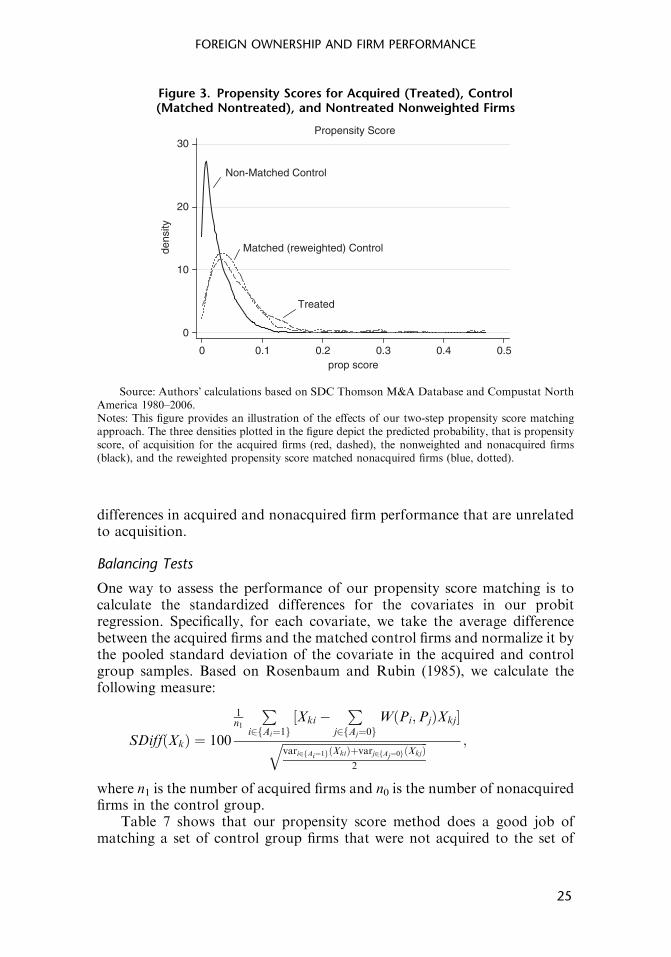
firms that were acquired by emerging market firms along the dimensions ofthe observable covariates. The balancing test results indicate that thedifferences in our matched parameters are all well below 20 indicating thatour approach is capable of grouping together relatively similar firms.21 Inparticular, the covariates log cash, log sales, log employment, and log of netproperty, plant and equipment before matching show significant differencesin means between acquired and nonacquired firms. After matching, however,the means of the covariates between the two groups are not significantlydifferent.
Consider the firm-size characteristic as measured by log sales in Table 7.The first row of coefficients for log sales compares the acquired (treated)firms with the nonacquired (control, unmatched) firms. In other words, the
Table 7. Balancing Tests
Mean% Reduction
t-test
Variable Sample Treated Control % Bias in Bias t p4|t|
Age Unmatched 24.640 23.915 5.8 0.6 0.548
Matched 24.717 24.333 3 47.1 0 0.996
OIBD Unmatched 216.690 292.840 �6.9 �0.66 0.507
Matched 217.930 230.040 �1.1 84.1 �0.43 0.668
Log Cash Unmatched 2.378 1.884 19.7 1.99 0.047
Matched 2.367 2.345 0.9 95.6 0.48 0.632
Log Sales Unmatched 5.367 4.883 21.4 2.09 0.037
Matched 5.360 5.368 �0.4 98.3 0.34 0.733
Log Assets Unmatched 5.558 5.261 12.9 1.27 0.205
Matched 5.548 5.549 �0.1 99.5 0.39 0.698
Log Unmatched 0.484 0.140 16 1.66 0.097
Employment Matched 0.463 0.527 �3 81.3 0.25 0.799
Log Debt Unmatched 3.280 3.041 7.7 0.8 0.424
Matched 3.261 3.353 �3 61.4 0.27 0.789
Net Income Unmatched 4.240 7.981 �20 �1.83 0.068
Matched 4.135 4.177 �9.9 50.2 �0.44 0.66
Log Net PPE Unmatched 3.961 3.601 14 1.41 0.16
Matched 3.950 4.052 �4 71.8 0.41 0.684
Notes: These tests check whether our matching approach is capable of grouping togetherrelatively similar firms. The table presents the average difference in each of the covariates betweenthe: (1) acquired firms and the unmatched non-acquired firms, and (2) the acquired firms and thematched (reweighted) non-acquired firms. Differences are normalized by the pooled standarddeviation of the covariate in the two samples. Bold values indicate statistical significance.
21A value for the standardized difference between treated and matched control meanvalues suggested by Rosenbaum and Rubin (1983).
Anusha Chari, Wenjie Chen, and Kathryn M.E. Dominguez
26
“unmatched control” refers to the set of firms that would have otherwisecomprised the control group had we not undertaken propensity scorematching. The coefficients for log sales in the first row suggest that theacquired firms are significantly larger, on average, than the unmatched set ofcontrol firms. The difference in size is statistically significant as evidenced bythe t-statistic and p-values in the final two columns. The second row presentsmean log sales numbers for the acquired firms along with the “matchedcontrol” firms that were not acquired. In stark contrast, the variation in logsize is not significantly different across the treated and control groups whenmatching takes place. The reduction in bias as a result of propensity scorematching along the dimension of log sales is about 98 percent. The reductionin bias for other observable covariates ranges from 47 percent for the firm-age variable to 99 percent for the log assets variable.
Postacquisition Performance and Restructuring
Table 8 (Panels A-F) presents our difference-in-differences propensity scorereweighting results for various measures of postacquisition firm performance.t¼ {0, 5} denotes the postacquisition year. The second column presents thematched coefficient estimate. Estimates in bold indicate statistical differencesin measured postacquisition performance for acquired and matchednonacquired firms. Common support refers to the set of firms for whomthe propensity score range overlaps across control (nonacquired) and treated(acquired) firms. Off support refers to the number of treated (acquired)firms whose propensity score lay above the maximum value or below theminimum value for the control (nonacquired) firms. Note that changes inpostacquisition performance are calculated relative to year t¼�1, prior tothe acquisition.
Panel A presents results for OIBD scaled by total assets, or ROA. Theseestimates indicate that the ROA for acquired firms declines significantlycompared with the firms in the “propensity score matched” control sample inthe year of acquisition. It appears that profits start to increase in years 1-4following the acquisition but the increase is not statistically significant. In thefifth year postacquisition the ROA increases significantly for acquired firms(relative to the nonacquired firms in our control group). In particular, theROA increases by 7 percent in year five for the acquired firms relative to thecontrol sample and also relative to the year prior to the acquisition. The time-series pattern in the ROA numbers is consistent with restructuring in theearly years following the acquisition leading to improved profitability in lateryears. We also conducted an F-test of joint significance that shows that thepostacquisition increase in profitability is jointly significant across the fiveyears following acquisition.
The advantage of our methodology is that we can identify the timing ofthe profitability improvements. Propensity score matching also requires largesamples with substantial overlap between groups of the treated (acquired)and control (matched nonacquired) firms. From Table 8 (Panel A), we see
FOREIGN OWNERSHIP AND FIRM PERFORMANCE
27
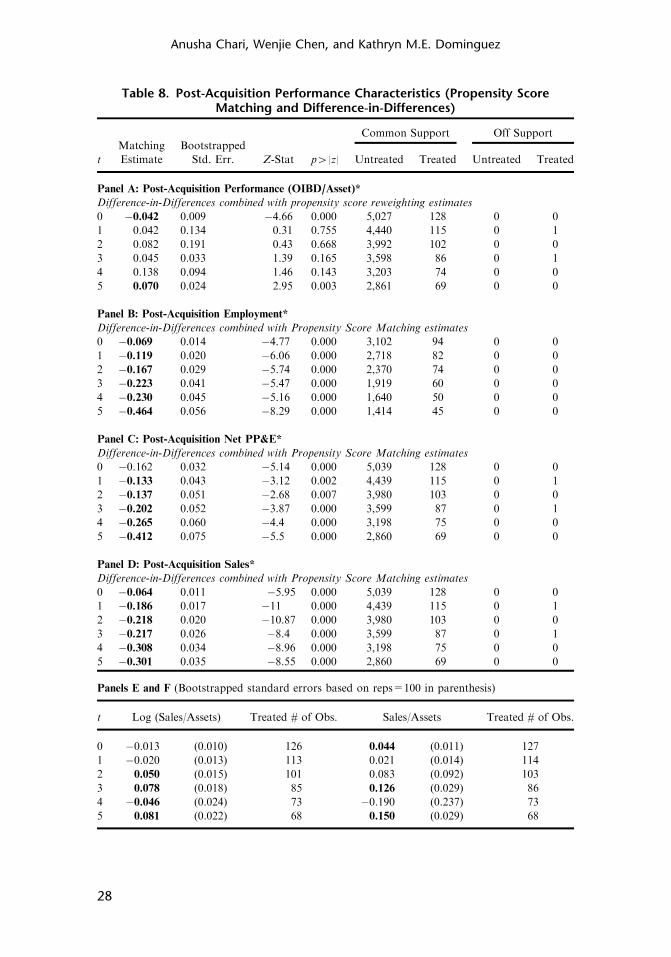
Table 8. Post-Acquisition Performance Characteristics (Propensity ScoreMatching and Difference-in-Differences)
Matching BootstrappedCommon Support Off Support
t Estimate Std. Err. Z-Stat p4|z| Untreated Treated Untreated Treated
Panel A: Post-Acquisition Performance (OIBD/Asset)*
Difference-in-Differences combined with propensity score reweighting estimates
0 �0.042 0.009 �4.66 0.000 5,027 128 0 0
1 0.042 0.134 0.31 0.755 4,440 115 0 1
2 0.082 0.191 0.43 0.668 3,992 102 0 0
3 0.045 0.033 1.39 0.165 3,598 86 0 1
4 0.138 0.094 1.46 0.143 3,203 74 0 0
5 0.070 0.024 2.95 0.003 2,861 69 0 0
Panel B: Post-Acquisition Employment*
Difference-in-Differences combined with Propensity Score Matching estimates
0 �0.069 0.014 �4.77 0.000 3,102 94 0 0
1 �0.119 0.020 �6.06 0.000 2,718 82 0 0
2 �0.167 0.029 �5.74 0.000 2,370 74 0 0
3 �0.223 0.041 �5.47 0.000 1,919 60 0 0
4 �0.230 0.045 �5.16 0.000 1,640 50 0 0
5 �0.464 0.056 �8.29 0.000 1,414 45 0 0
Panel C: Post-Acquisition Net PP&E*
Difference-in-Differences combined with Propensity Score Matching estimates
0 �0.162 0.032 �5.14 0.000 5,039 128 0 0
1 �0.133 0.043 �3.12 0.002 4,439 115 0 1
2 �0.137 0.051 �2.68 0.007 3,980 103 0 0
3 �0.202 0.052 �3.87 0.000 3,599 87 0 1
4 �0.265 0.060 �4.4 0.000 3,198 75 0 0
5 �0.412 0.075 �5.5 0.000 2,860 69 0 0
Panel D: Post-Acquisition Sales*
Difference-in-Differences combined with Propensity Score Matching estimates
0 �0.064 0.011 �5.95 0.000 5,039 128 0 0
1 �0.186 0.017 �11 0.000 4,439 115 0 1
2 �0.218 0.020 �10.87 0.000 3,980 103 0 0
3 �0.217 0.026 �8.4 0.000 3,599 87 0 1
4 �0.308 0.034 �8.96 0.000 3,198 75 0 0
5 �0.301 0.035 �8.55 0.000 2,860 69 0 0
Panels E and F (Bootstrapped standard errors based on reps=100 in parenthesis)
t Log (Sales/Assets) Treated # of Obs. Sales/Assets Treated # of Obs.
0 �0.013 (0.010) 126 0.044 (0.011) 127
1 �0.020 (0.013) 113 0.021 (0.014) 114
2 0.050 (0.015) 101 0.083 (0.092) 103
3 0.078 (0.018) 85 0.126 (0.029) 86
4 �0.046 (0.024) 73 �0.190 (0.237) 73
5 0.081 (0.022) 68 0.150 (0.029) 68
Anusha Chari, Wenjie Chen, and Kathryn M.E. Dominguez
28
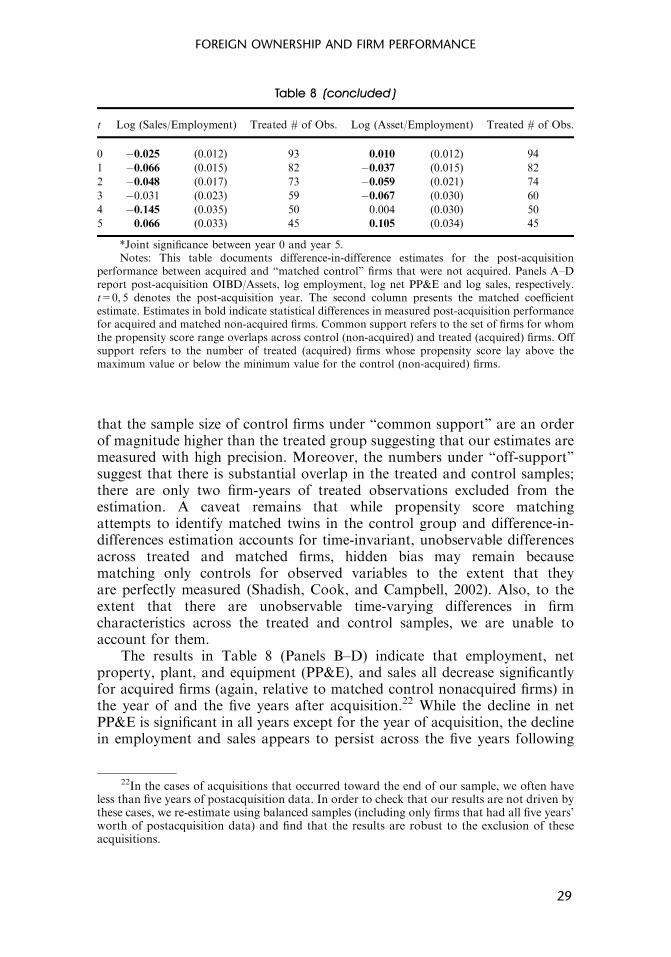
that the sample size of control firms under “common support” are an orderof magnitude higher than the treated group suggesting that our estimates aremeasured with high precision. Moreover, the numbers under “off-support”suggest that there is substantial overlap in the treated and control samples;there are only two firm-years of treated observations excluded from theestimation. A caveat remains that while propensity score matchingattempts to identify matched twins in the control group and difference-in-differences estimation accounts for time-invariant, unobservable differencesacross treated and matched firms, hidden bias may remain becausematching only controls for observed variables to the extent that theyare perfectly measured (Shadish, Cook, and Campbell, 2002). Also, to theextent that there are unobservable time-varying differences in firmcharacteristics across the treated and control samples, we are unable toaccount for them.
The results in Table 8 (Panels B–D) indicate that employment, netproperty, plant, and equipment (PP&E), and sales all decrease significantlyfor acquired firms (again, relative to matched control nonacquired firms) inthe year of and the five years after acquisition.22 While the decline in netPP&E is significant in all years except for the year of acquisition, the declinein employment and sales appears to persist across the five years following
Table 8 (concluded )
t Log (Sales/Employment) Treated # of Obs. Log (Asset/Employment) Treated # of Obs.
0 �0.025 (0.012) 93 0.010 (0.012) 94
1 �0.066 (0.015) 82 �0.037 (0.015) 82
2 �0.048 (0.017) 73 �0.059 (0.021) 74
3 �0.031 (0.023) 59 �0.067 (0.030) 60
4 �0.145 (0.035) 50 0.004 (0.030) 50
5 0.066 (0.033) 45 0.105 (0.034) 45
*Joint significance between year 0 and year 5.Notes: This table documents difference-in-difference estimates for the post-acquisition
performance between acquired and “matched control” firms that were not acquired. Panels A–Dreport post-acquisition OIBD/Assets, log employment, log net PP&E and log sales, respectively.t=0, 5 denotes the post-acquisition year. The second column presents the matched coefficientestimate. Estimates in bold indicate statistical differences in measured post-acquisition performancefor acquired and matched non-acquired firms. Common support refers to the set of firms for whomthe propensity score range overlaps across control (non-acquired) and treated (acquired) firms. Offsupport refers to the number of treated (acquired) firms whose propensity score lay above themaximum value or below the minimum value for the control (non-acquired) firms.
22In the cases of acquisitions that occurred toward the end of our sample, we often haveless than five years of postacquisition data. In order to check that our results are not driven bythese cases, we re-estimate using balanced samples (including only firms that had all five years’worth of postacquisition data) and find that the results are robust to the exclusion of theseacquisitions.
FOREIGN OWNERSHIP AND FIRM PERFORMANCE
29
acquisition. Moreover, for all our outcome variables, the results are jointlystatistically significant over the entire sample period.
The pattern of increasing profitability (income/assets) and declining salesis consistent with improvements in firm-efficiency following acquisition.23
For instance, if firms shut down or get rid of unprofitable divisions, saleswould go down but profits as a percent of assets would increase. Also,declining employment and net PP&E suggest downsizing of divisions toimprove overall profitability as a percent of assets. While data constraintsdo not allow us to directly test whether targets are downsized or restructured,we would expect capital efficiency and productivity to rise as a result ofrestructuring.
Estimates for three alternative outcome variables that measure changes inthe scale of the firm and productivity improvements are shown in Panels Eand F in Table 8. Sales-to-Assets, a measure of capital efficiency, show aninitial decline followed by improvements in later years. This finding isconsistent with the hypothesis that the restructuring process takes timeto be implemented so that efficiency improvements are realized a few yearsfollowing the acquisition. Consistent with this pattern, Sales-to-Employment,a measure of labor productivity, decreases in the years following acquisitionbut shows an increase in year 5 after the acquisition. Assets-to-Employment,a proxy of capital intensity, also shows a decline in the initial yearsfollowing the acquisition and rises in later years. While these numbersshould be interpreted with caution because the coverage in the employmentdata is limited, the pattern is consistent with the time-to-build nature ofinvestment in physical capital. The initial decline in the assets/employmentratio is also consistent with plant shutdowns following the acquisitionevent.
The productivity results in Table 8 need to be interpreted with particularcaution. Conyon and others (2002) emphasize that overall efficiencyevaluations are hard to make based on employment and output alone.Consistent with the results in our paper, their paper suggests that thedownsizing of merged firms through divestment could have different effectson the efficiency of the retained parts of the business depending on what partsof the existing company the new parent has divested. If inefficient operationswere divested, overall efficiency should improve. However, in some cases, it isalso possible that more successful units might have been divested in order tosatisfy the needs of the new parent company. Capron (1999) echoes this
23Another factor that might impact firm performance is business cycle fluctuations. Wedevised several ways to control for these effects. The first way is to use the proportional timeassignment for the untreated group of firms. Secondly, the year dummies in the probitspecification also control for time-specific selection that is related to business cyclefluctuations. In addition, we ran separate tests for particular years in the sample. Forexample, for all target firms that were acquired in 1995 we only assigned control firms that didnot receive acquisition up until 1995 and followed their respective performances. This setup iscalled dynamic matching, and it focuses on one particular year at a time. The downside to thismethod is that for several years, there are not enough treated firms for the analysis.
Anusha Chari, Wenjie Chen, and Kathryn M.E. Dominguez
30
explanation and suggests that asset divestiture and resource redeployment areways for the merged firm to exploit economies of scale and scope and findsthat although they might improve overall acquisition performance, resultsabout target firm efficiency can be mixed. Unfortunately, from our data it isnot possible to discern whether the acquirer firm chose to cut moreproductive or less productive units.
In sum, we find evidence in support of the two hypotheses we set out totest. First, increasing profitability is consistent with the hypothesis thatforeign ownership is associated with improvements in plant productivity.Second, declining sales in the target firms along with the downsizing ofemployment are consistent with the comparative input cost hypothesis.Acquirers from emerging markets come from countries where laborcosts are low and they may be in the position to in-source jobs byexploiting the low wages in their home countries by downsizing labor-intensive activities in the United States following the acquisition. The U.S.target experiences improvements in profitability with more streamlinedbut efficient operations following restructuring by the emerging marketacquirer.
IV. Robustness Checks
Simple Difference-in-Differences Estimation
To highlight the importance of constructing an appropriate benchmark forcomparison to evaluate postacquisition performance, we report simpledifference-in-difference estimates without applying propensity scorematching. The simple difference-in-differences estimates compare thepostacquisition performance of targets to the performance of all non-acquired U.S. firms. We include the same covariates as in our probitestimation as control variables in the difference-in-differences estimation.Table 9 (Panels A-D) presents the results. Since simple difference-in-difference estimation does not correct for selection effects, the coefficientestimates for our four performance measures (OIBD/assets, employment,sales, and net property, plant and equipment) are often larger in magnitudeand always of the same sign and similarly statistically significant, ascompared with the corresponding, more conservative, propensity scorematching estimates. It is however reassuring that the sign and statisticalsignificance of the estimates from simple difference-in-differences are in thesame direction as the propensity score matching estimates and provide across-check on characterizing the impact of emerging market acquisitions onvarious outcome measures of target performance.
Quite apart from the selection issue, we would expect these estimates todiffer from those produced using propensity score matching for two reasons:(1) the underlying functional form is restricted to be linear in the simpledifference-in-differences approach, whereas the propensity score method issemiparametric, and (2) the difference-in-differences approach does not take
FOREIGN OWNERSHIP AND FIRM PERFORMANCE
31
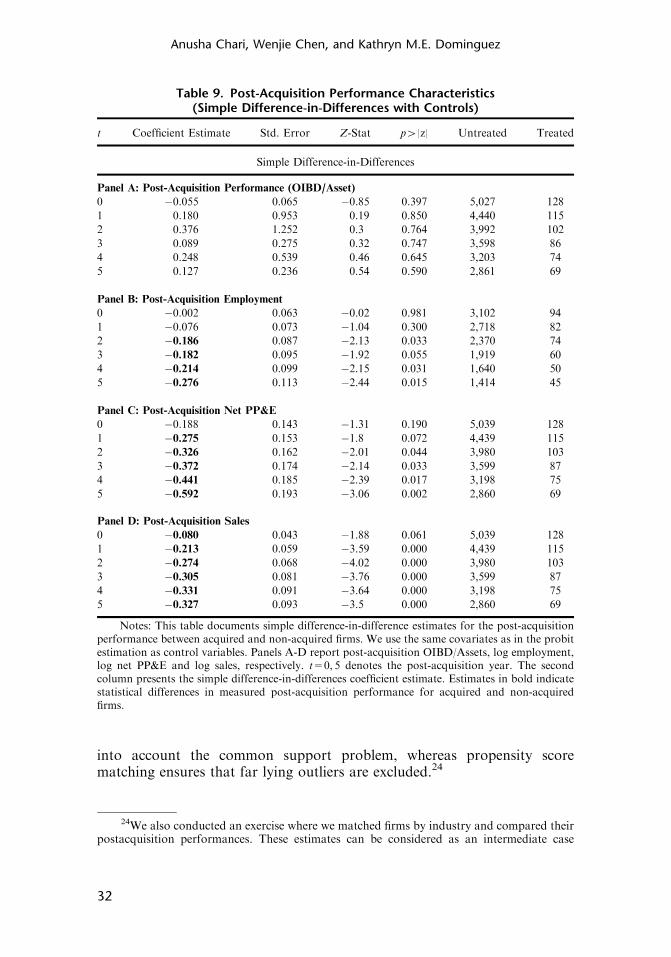
into account the common support problem, whereas propensity scorematching ensures that far lying outliers are excluded.24
Table 9. Post-Acquisition Performance Characteristics(Simple Difference-in-Differences with Controls)
t Coefficient Estimate Std. Error Z-Stat p4|z| Untreated Treated
Simple Difference-in-Differences
Panel A: Post-Acquisition Performance (OIBD/Asset)
0 �0.055 0.065 �0.85 0.397 5,027 128
1 0.180 0.953 0.19 0.850 4,440 115
2 0.376 1.252 0.3 0.764 3,992 102
3 0.089 0.275 0.32 0.747 3,598 86
4 0.248 0.539 0.46 0.645 3,203 74
5 0.127 0.236 0.54 0.590 2,861 69
Panel B: Post-Acquisition Employment
0 �0.002 0.063 �0.02 0.981 3,102 94
1 �0.076 0.073 �1.04 0.300 2,718 82
2 �0.186 0.087 �2.13 0.033 2,370 74
3 �0.182 0.095 �1.92 0.055 1,919 60
4 �0.214 0.099 �2.15 0.031 1,640 50
5 �0.276 0.113 �2.44 0.015 1,414 45
Panel C: Post-Acquisition Net PP&E
0 �0.188 0.143 �1.31 0.190 5,039 128
1 �0.275 0.153 �1.8 0.072 4,439 115
2 �0.326 0.162 �2.01 0.044 3,980 103
3 �0.372 0.174 �2.14 0.033 3,599 87
4 �0.441 0.185 �2.39 0.017 3,198 75
5 �0.592 0.193 �3.06 0.002 2,860 69
Panel D: Post-Acquisition Sales
0 �0.080 0.043 �1.88 0.061 5,039 128
1 �0.213 0.059 �3.59 0.000 4,439 115
2 �0.274 0.068 �4.02 0.000 3,980 103
3 �0.305 0.081 �3.76 0.000 3,599 87
4 �0.331 0.091 �3.64 0.000 3,198 75
5 �0.327 0.093 �3.5 0.000 2,860 69
Notes: This table documents simple difference-in-difference estimates for the post-acquisitionperformance between acquired and non-acquired firms. We use the same covariates as in the probitestimation as control variables. Panels A-D report post-acquisition OIBD/Assets, log employment,log net PP&E and log sales, respectively. t=0, 5 denotes the post-acquisition year. The secondcolumn presents the simple difference-in-differences coefficient estimate. Estimates in bold indicatestatistical differences in measured post-acquisition performance for acquired and non-acquiredfirms.
24We also conducted an exercise where we matched firms by industry and compared theirpostacquisition performances. These estimates can be considered as an intermediate case
Anusha Chari, Wenjie Chen, and Kathryn M.E. Dominguez
32
Additional Tests
SDC Platinum provides information about acquisitions that are announcedbut not completed or withdrawn. Using this sample of failed transactionswe can examine whether the firms that were potential acquisition targetsdiffer from their nonacquired counterparts. If it is foreign ownership thatdrives the postacquisition performance of the acquired firms, we expect thatfollowing propensity score matching, the firms that were “potential” targetsshould perform similarly to the firms that are in the matched control samplebut not the subject of foreign interest, since the foreign acquisition wasnever successfully completed. Although it is not possible to test thishypothesis formally given the limited number of failed acquisitions, Table 10provides suggestive evidence; the 18 potential targets in our sampleexperience declines in employment and increases in sales in the year theM&A transaction is announced and are similar to a group of matchednonacquired firms in the years after the failed acquisitions, suggesting thatpostacquisition performance of acquired firms is driven by the transferof ownership to foreign hands. However, given the small number offailed acquisitions in our sample, more formal statistical analysis is notpossible.
We also perform a number of additional robustness checks that involvedividing our sample of acquired firms into various subgroups consisting of:(1) majority and minority control acquisitions, (2) acquisitions financedsolely by cash, (3) only manufacturing firms, (4) acquiring firms located inEast Asia,25 and lastly, (5) firms not in the same industry as the acquiringfirm. The estimates are shown in Table 11 (Panels A-G). The statisticalsignificance of the results varies because of sample sizes. For example, for thegroup of horizontal acquisitions, in which both acquiring and target firmsshare the same industry, the sample size is much smaller than that fordiversifying acquisitions. Thus, although the magnitudes of the estimates aresimilar to those of the whole sample, the statistical significance is not.Overall, the robustness checks confirm the results in the main analysis whenusing the full sample.
between simple difference-in-differences and the full-blown propensity score matchingapproach. The coefficient estimates using this approach are available upon request. Theyare generally smaller than those found using simple difference-in-differences, but once againsince they do not correct for selection effects, larger in magnitude than those reported inTable 8 based on the propensity score matching approach. As we increase the complexities ofthe matching procedure by adding more covariates, we expect the estimated coefficients todecrease in magnitude and significance compared with the simple difference-in-difference.
25We also conduct robustness checks on a sample that excludes all transactions involvingacquiring firms with parent companies based in Hong Kong SAR, Singapore, Taiwan, andSouth Korea. The results are similar in magnitude and statistical significance to those reportedand are available upon request.
FOREIGN OWNERSHIP AND FIRM PERFORMANCE
33
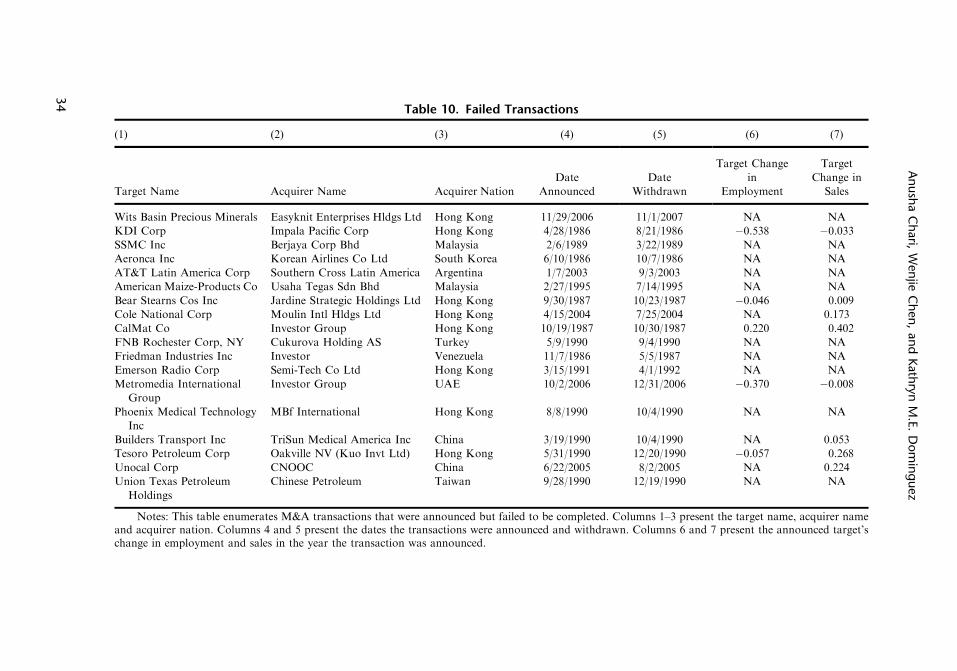
Table 10. Failed Transactions
(1) (2) (3) (4) (5) (6) (7)
Target Name Acquirer Name Acquirer Nation
Date
Announced
Date
Withdrawn
Target Change
in
Employment
Target
Change in
Sales
Wits Basin Precious Minerals Easyknit Enterprises Hldgs Ltd Hong Kong 11/29/2006 11/1/2007 NA NA
KDI Corp Impala Pacific Corp Hong Kong 4/28/1986 8/21/1986 �0.538 �0.033SSMC Inc Berjaya Corp Bhd Malaysia 2/6/1989 3/22/1989 NA NA
Aeronca Inc Korean Airlines Co Ltd South Korea 6/10/1986 10/7/1986 NA NA
AT&T Latin America Corp Southern Cross Latin America Argentina 1/7/2003 9/3/2003 NA NA
American Maize-Products Co Usaha Tegas Sdn Bhd Malaysia 2/27/1995 7/14/1995 NA NA
Bear Stearns Cos Inc Jardine Strategic Holdings Ltd Hong Kong 9/30/1987 10/23/1987 �0.046 0.009
Cole National Corp Moulin Intl Hldgs Ltd Hong Kong 4/15/2004 7/25/2004 NA 0.173
CalMat Co Investor Group Hong Kong 10/19/1987 10/30/1987 0.220 0.402
FNB Rochester Corp, NY Cukurova Holding AS Turkey 5/9/1990 9/4/1990 NA NA
Friedman Industries Inc Investor Venezuela 11/7/1986 5/5/1987 NA NA
Emerson Radio Corp Semi-Tech Co Ltd Hong Kong 3/15/1991 4/1/1992 NA NA
Metromedia International
Group
Investor Group UAE 10/2/2006 12/31/2006 �0.370 �0.008
Phoenix Medical Technology
Inc
MBf International Hong Kong 8/8/1990 10/4/1990 NA NA
Builders Transport Inc TriSun Medical America Inc China 3/19/1990 10/4/1990 NA 0.053
Tesoro Petroleum Corp Oakville NV (Kuo Invt Ltd) Hong Kong 5/31/1990 12/20/1990 �0.057 0.268
Unocal Corp CNOOC China 6/22/2005 8/2/2005 NA 0.224
Union Texas Petroleum
Holdings
Chinese Petroleum Taiwan 9/28/1990 12/19/1990 NA NA
Notes: This table enumerates M&A transactions that were announced but failed to be completed. Columns 1–3 present the target name, acquirer nameand acquirer nation. Columns 4 and 5 present the dates the transactions were announced and withdrawn. Columns 6 and 7 present the announced target’schange in employment and sales in the year the transaction was announced.
An
ush
aC
hari,
Wen
jieC
hen
,an
dK
ath
ryn
M.E
.D
om
ing
uez
34
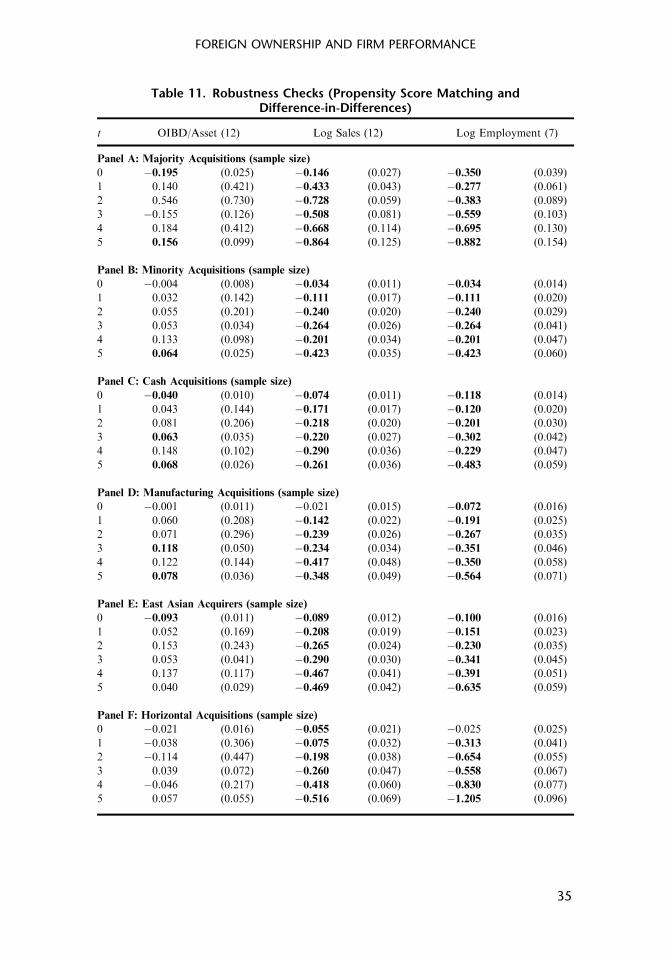
Table 11. Robustness Checks (Propensity Score Matching andDifference-in-Differences)
t OIBD/Asset (12) Log Sales (12) Log Employment (7)
Panel A: Majority Acquisitions (sample size)
0 �0.195 (0.025) �0.146 (0.027) �0.350 (0.039)
1 0.140 (0.421) �0.433 (0.043) �0.277 (0.061)
2 0.546 (0.730) �0.728 (0.059) �0.383 (0.089)
3 �0.155 (0.126) �0.508 (0.081) �0.559 (0.103)
4 0.184 (0.412) �0.668 (0.114) �0.695 (0.130)
5 0.156 (0.099) �0.864 (0.125) �0.882 (0.154)
Panel B: Minority Acquisitions (sample size)
0 �0.004 (0.008) �0.034 (0.011) �0.034 (0.014)
1 0.032 (0.142) �0.111 (0.017) �0.111 (0.020)
2 0.055 (0.201) �0.240 (0.020) �0.240 (0.029)
3 0.053 (0.034) �0.264 (0.026) �0.264 (0.041)
4 0.133 (0.098) �0.201 (0.034) �0.201 (0.047)
5 0.064 (0.025) �0.423 (0.035) �0.423 (0.060)
Panel C: Cash Acquisitions (sample size)
0 �0.040 (0.010) �0.074 (0.011) �0.118 (0.014)
1 0.043 (0.144) �0.171 (0.017) �0.120 (0.020)
2 0.081 (0.206) �0.218 (0.020) �0.201 (0.030)
3 0.063 (0.035) �0.220 (0.027) �0.302 (0.042)
4 0.148 (0.102) �0.290 (0.036) �0.229 (0.047)
5 0.068 (0.026) �0.261 (0.036) �0.483 (0.059)
Panel D: Manufacturing Acquisitions (sample size)
0 �0.001 (0.011) �0.021 (0.015) �0.072 (0.016)
1 0.060 (0.208) �0.142 (0.022) �0.191 (0.025)
2 0.071 (0.296) �0.239 (0.026) �0.267 (0.035)
3 0.118 (0.050) �0.234 (0.034) �0.351 (0.046)
4 0.122 (0.144) �0.417 (0.048) �0.350 (0.058)
5 0.078 (0.036) �0.348 (0.049) �0.564 (0.071)
Panel E: East Asian Acquirers (sample size)
0 �0.093 (0.011) �0.089 (0.012) �0.100 (0.016)
1 0.052 (0.169) �0.208 (0.019) �0.151 (0.023)
2 0.153 (0.243) �0.265 (0.024) �0.230 (0.035)
3 0.053 (0.041) �0.290 (0.030) �0.341 (0.045)
4 0.137 (0.117) �0.467 (0.041) �0.391 (0.051)
5 0.040 (0.029) �0.469 (0.042) �0.635 (0.059)
Panel F: Horizontal Acquisitions (sample size)
0 �0.021 (0.016) �0.055 (0.021) �0.025 (0.025)
1 �0.038 (0.306) �0.075 (0.032) �0.313 (0.041)
2 �0.114 (0.447) �0.198 (0.038) �0.654 (0.055)
3 0.039 (0.072) �0.260 (0.047) �0.558 (0.067)
4 �0.046 (0.217) �0.418 (0.060) �0.830 (0.077)
5 0.057 (0.055) �0.516 (0.069) �1.205 (0.096)
FOREIGN OWNERSHIP AND FIRM PERFORMANCE
35
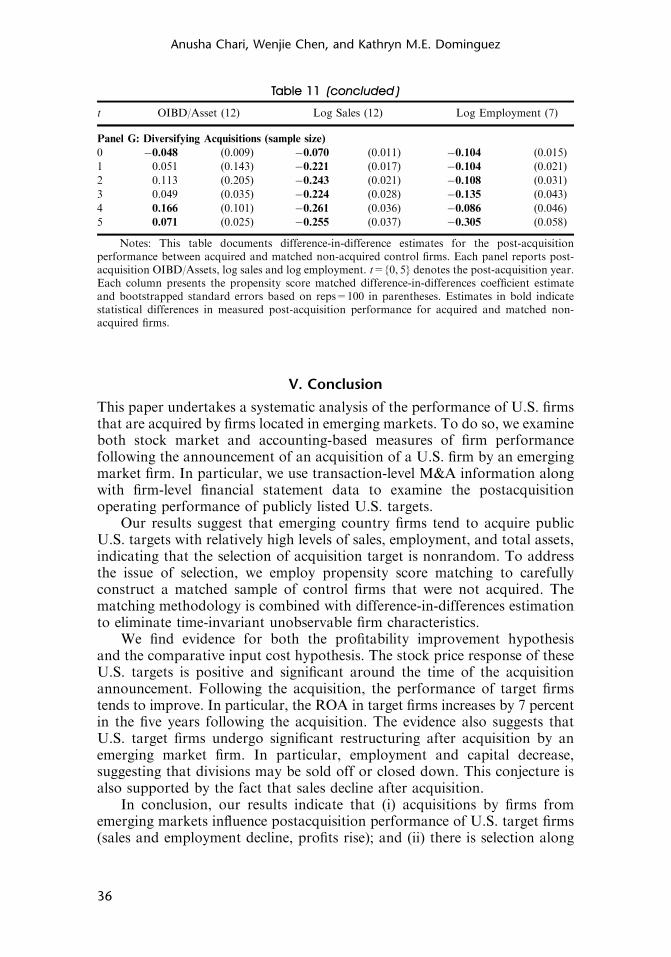
V. Conclusion
This paper undertakes a systematic analysis of the performance of U.S. firmsthat are acquired by firms located in emerging markets. To do so, we examineboth stock market and accounting-based measures of firm performancefollowing the announcement of an acquisition of a U.S. firm by an emergingmarket firm. In particular, we use transaction-level M&A information alongwith firm-level financial statement data to examine the postacquisitionoperating performance of publicly listed U.S. targets.
Our results suggest that emerging country firms tend to acquire publicU.S. targets with relatively high levels of sales, employment, and total assets,indicating that the selection of acquisition target is nonrandom. To addressthe issue of selection, we employ propensity score matching to carefullyconstruct a matched sample of control firms that were not acquired. Thematching methodology is combined with difference-in-differences estimationto eliminate time-invariant unobservable firm characteristics.
We find evidence for both the profitability improvement hypothesisand the comparative input cost hypothesis. The stock price response of theseU.S. targets is positive and significant around the time of the acquisitionannouncement. Following the acquisition, the performance of target firmstends to improve. In particular, the ROA in target firms increases by 7 percentin the five years following the acquisition. The evidence also suggests thatU.S. target firms undergo significant restructuring after acquisition by anemerging market firm. In particular, employment and capital decrease,suggesting that divisions may be sold off or closed down. This conjecture isalso supported by the fact that sales decline after acquisition.
In conclusion, our results indicate that (i) acquisitions by firms fromemerging markets influence postacquisition performance of U.S. target firms(sales and employment decline, profits rise); and (ii) there is selection along
Table 11 (concluded )
t OIBD/Asset (12) Log Sales (12) Log Employment (7)
Panel G: Diversifying Acquisitions (sample size)
0 �0.048 (0.009) �0.070 (0.011) �0.104 (0.015)
1 0.051 (0.143) �0.221 (0.017) �0.104 (0.021)
2 0.113 (0.205) �0.243 (0.021) �0.108 (0.031)
3 0.049 (0.035) �0.224 (0.028) �0.135 (0.043)
4 0.166 (0.101) �0.261 (0.036) �0.086 (0.046)
5 0.071 (0.025) �0.255 (0.037) �0.305 (0.058)
Notes: This table documents difference-in-difference estimates for the post-acquisitionperformance between acquired and matched non-acquired control firms. Each panel reports post-acquisition OIBD/Assets, log sales and log employment. t={0, 5} denotes the post-acquisition year.Each column presents the propensity score matched difference-in-differences coefficient estimateand bootstrapped standard errors based on reps=100 in parentheses. Estimates in bold indicatestatistical differences in measured post-acquisition performance for acquired and matched non-acquired firms.
Anusha Chari, Wenjie Chen, and Kathryn M.E. Dominguez
36
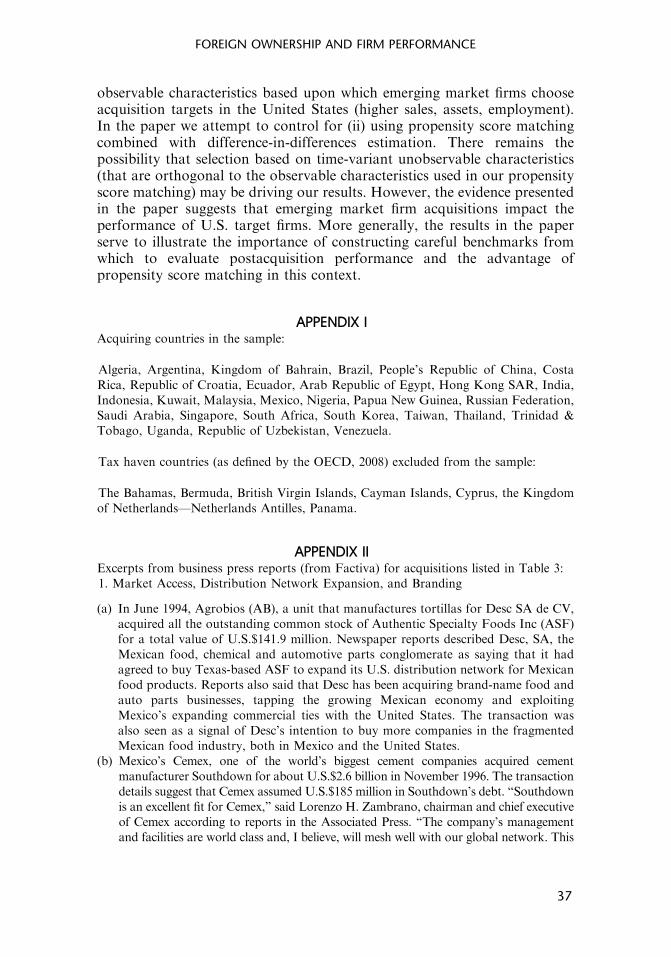
observable characteristics based upon which emerging market firms chooseacquisition targets in the United States (higher sales, assets, employment).In the paper we attempt to control for (ii) using propensity score matchingcombined with difference-in-differences estimation. There remains thepossibility that selection based on time-variant unobservable characteristics(that are orthogonal to the observable characteristics used in our propensityscore matching) may be driving our results. However, the evidence presentedin the paper suggests that emerging market firm acquisitions impact theperformance of U.S. target firms. More generally, the results in the paperserve to illustrate the importance of constructing careful benchmarks fromwhich to evaluate postacquisition performance and the advantage ofpropensity score matching in this context.
APPENDIX IAcquiring countries in the sample:
Algeria, Argentina, Kingdom of Bahrain, Brazil, People’s Republic of China, CostaRica, Republic of Croatia, Ecuador, Arab Republic of Egypt, Hong Kong SAR, India,Indonesia, Kuwait, Malaysia, Mexico, Nigeria, Papua New Guinea, Russian Federation,Saudi Arabia, Singapore, South Africa, South Korea, Taiwan, Thailand, Trinidad &Tobago, Uganda, Republic of Uzbekistan, Venezuela.
Tax haven countries (as defined by the OECD, 2008) excluded from the sample:
The Bahamas, Bermuda, British Virgin Islands, Cayman Islands, Cyprus, the Kingdomof Netherlands—Netherlands Antilles, Panama.
APPENDIX IIExcerpts from business press reports (from Factiva) for acquisitions listed in Table 3:1. Market Access, Distribution Network Expansion, and Branding
(a) In June 1994, Agrobios (AB), a unit that manufactures tortillas for Desc SA de CV,acquired all the outstanding common stock of Authentic Specialty Foods Inc (ASF)for a total value of U.S.$141.9 million. Newspaper reports described Desc, SA, theMexican food, chemical and automotive parts conglomerate as saying that it hadagreed to buy Texas-based ASF to expand its U.S. distribution network for Mexicanfood products. Reports also said that Desc has been acquiring brand-name food andauto parts businesses, tapping the growing Mexican economy and exploitingMexico’s expanding commercial ties with the United States. The transaction wasalso seen as a signal of Desc’s intention to buy more companies in the fragmentedMexican food industry, both in Mexico and the United States.
(b) Mexico’s Cemex, one of the world’s biggest cement companies acquired cementmanufacturer Southdown for about U.S.$2.6 billion in November 1996. The transactiondetails suggest that Cemex assumed U.S.$185 million in Southdown’s debt. “Southdownis an excellent fit for Cemex,” said Lorenzo H. Zambrano, chairman and chief executiveof Cemex according to reports in the Associated Press. “The company’s managementand facilities are world class and, I believe, will mesh well with our global network. This
FOREIGN OWNERSHIP AND FIRM PERFORMANCE
37

combination will not only expand our presence in the United States, but help us competemore effectively in all our markets.”
(c) In 2002, China’s Sun Media Investment Holdings Ltd acquired a 25.7 percent stake inBroadcast International Inc, a provider of satellite uplink and related equipmentservices, for U.S.$16.5 million, in a privately negotiated transaction. InternationalBroadcasting Co., Ltd of America was a two-decade-old operator of enterprisesatellite TV networks, located in the Salt Lake City. Sun Media became the largestshareholder of International Broadcasting Co., Ltd. Along with the right to subscribeto U.S.$15 million of shares of International Broadcasting, Sun Media also obtaineda 45 percent stock option for the company and planned to renew the services ofInternational Broadcasting in an all-round way by internet protocol television (IPTV)and network multimedia publishing technology, to make International Broadcastingthe leading global business-to-business IPTV operator.
(d) In the commercial banking sector, Taiwan’s Bank SinoPac merger with Los Angeles-based Far East National Bank, for U.S.$94 million closed in the mid-1990s. Analystsreported that Chinese banks in the United States were pursuing new Asian business.Details of the strength of Chinese banks suggested for example that the Far EastNational Bank, a subsidiary of Taiwan’s Bank SinoPac serves mainly ethnic-Chinesebusinesses and was now aggressively pursuing other Asians in the United States. Onebanker commented that Chinese and Taiwanese banks were actively pursuing theKorean business in the United States. He added that Koreans felt more comfortablewith Asian banks. Another insider commented that U.S. banks without branches orpartners in Asia often found it hard to serve Asian customers satisfactorily.
2. Technological Alliances, Market Access, and Access to Capital
(a) CDC software, a Hong Kong-based software arm of the acquired technologyprovider Chinadotcom (CC) acquired Ross Systems Inc (RS), a developer of businesssoftware and supplier to mid-size process manufacturers, in a stock swap transactionvalued at U.S.$66.2 million. The transaction was set to provide Ross with access toCDC’s R&D resources as well as the capital it needed to grow organically andthrough acquisitions according to senior sales and marketing staff. The CDCtransaction would also provide Ross with better access to the Asian market. Researchanalysts suggested that Ross would likely get a boost in sales from existing chemicalindustry customers who were looking to expand into the fast-growing Chinesemarket.
(b) Corimon, a paint and coating Venezuelan manufacturer raised its stake in GrowGroup to 26 percent for an indicated value of U.S.$56.27 million and illustrates acase where the acquisition provided access to capital for the U.S. target and access totechnology for the emerging market acquirer. Corimon was interested in Grow’stechnology for high-performance coatings, namely industrial and marine coatings,while Grow was interested in Corimon’s resin manufacturing capability, which Growalso lacked. According to analysts, the Venezuelan company Corimon (Caracas) wasnot only taking a financial stake in Grow Group (New York), but also forging astrategic alliance with Grow. The alliance was seen as a way to open up the SouthAmerican market for Grow. While the company had several distributors in SouthAmerica, it did not have manufacturing facilities or expanded sales staff there.
(c) Yet another example of a technological alliance combined with market access isthat of Infosys Technologies from India which made a strategic investment in theU.S.-based CiDRA Corp., a developer of agile photonic devices for high-precisionwavelength management and control for optical networks. Earlier in the year, the two
Anusha Chari, Wenjie Chen, and Kathryn M.E. Dominguez
38
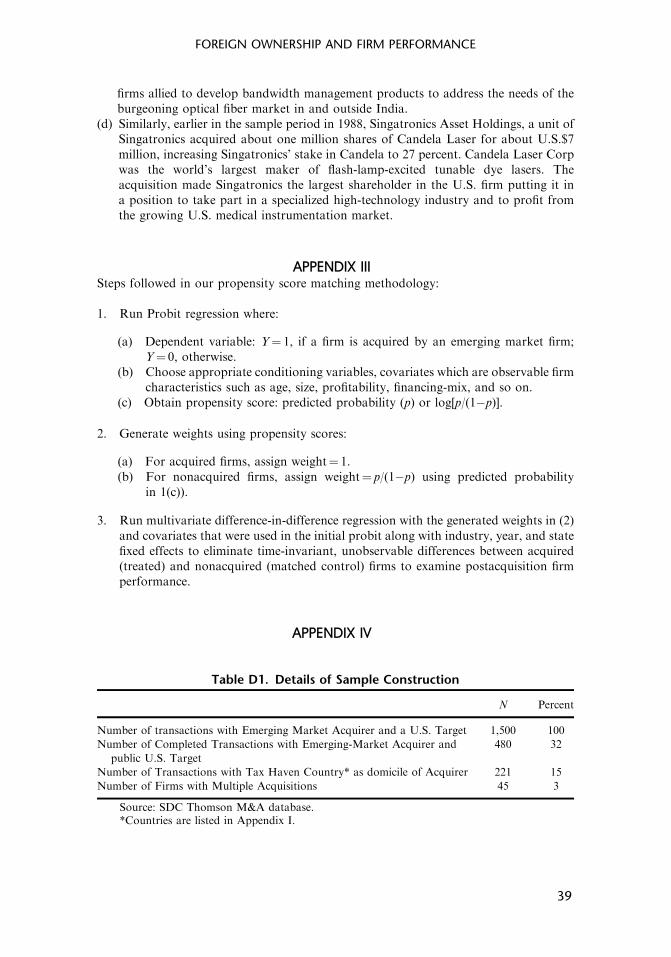
firms allied to develop bandwidth management products to address the needs of theburgeoning optical fiber market in and outside India.
(d) Similarly, earlier in the sample period in 1988, Singatronics Asset Holdings, a unit ofSingatronics acquired about one million shares of Candela Laser for about U.S.$7million, increasing Singatronics’ stake in Candela to 27 percent. Candela Laser Corpwas the world’s largest maker of flash-lamp-excited tunable dye lasers. Theacquisition made Singatronics the largest shareholder in the U.S. firm putting it ina position to take part in a specialized high-technology industry and to profit fromthe growing U.S. medical instrumentation market.
APPENDIX IIISteps followed in our propensity score matching methodology:
1. Run Probit regression where:
(a) Dependent variable: Y¼ 1, if a firm is acquired by an emerging market firm;Y¼ 0, otherwise.
(b) Choose appropriate conditioning variables, covariates which are observable firmcharacteristics such as age, size, profitability, financing-mix, and so on.
(c) Obtain propensity score: predicted probability (p) or log[p/(1�p)].
2. Generate weights using propensity scores:
(a) For acquired firms, assign weight¼ 1.(b) For nonacquired firms, assign weight¼ p/(1�p) using predicted probability
in 1(c)).
3. Run multivariate difference-in-difference regression with the generated weights in (2)and covariates that were used in the initial probit along with industry, year, and statefixed effects to eliminate time-invariant, unobservable differences between acquired(treated) and nonacquired (matched control) firms to examine postacquisition firmperformance.
APPENDIX IV
Table D1. Details of Sample Construction
N Percent
Number of transactions with Emerging Market Acquirer and a U.S. Target 1,500 100
Number of Completed Transactions with Emerging-Market Acquirer and
public U.S. Target
480 32
Number of Transactions with Tax Haven Country* as domicile of Acquirer 221 15
Number of Firms with Multiple Acquisitions 45 3
Source: SDC Thomson M&A database.*Countries are listed in Appendix I.
FOREIGN OWNERSHIP AND FIRM PERFORMANCE
39
REFERENCES
Akben-Selcuk, Elif, 2008, “The Impact of Cross-Border M&A Target CompanyPerformance: Evidence from Turkey,” Economics Bulletin, Vol. 13, No. 5, pp. 1–9.
Aitken, Brian J., and Ann E. Harrison, 1999, “Do Domestic Firms Benefit from DirectForeign Investment? Evidence from Venezuela,” American Economic Review, Vol. 89,pp. 605–18.
Andrade, G., M. Mitchell, and E. Stafford, 2001, “New Evidence and Perspectives onMergers,” The Journal of Economic Perspectives, Vol. 15, No. 2, pp. 103–20.
Antras, Pol, Mihir Desai, and Fritz Foley, 2009, “Multinational Firms, FDI Flowsand Imperfect Capital Markets,” Quarterly Journal of Economics, Vol. 124, No. 3,pp. 1171–219.
Angrist, J.D., and A.B. Krueger, 1999, In Orley Ashenfelter and David Card, editors,Handbook of Labor Economics Volume 3A. Amsterdam: Elsevier, 1999.
Antkiewicz, A., and J. Whalley, 2006, “Recent Chinese Buyout Activity and theImplications for Global Architecture,” NBER Working Paper No. W12072.
Arnold, J.M., and B.S. Javorcik, 2005, “Gifted Kids or Pushy Parents? ForeignAcquisitions and Plant Performance in Indonesia,” Development Studies WorkingPaper No. 197. Centro Studi Luca D’Agliano, March.
Ashenfelter, O., 1978, “Estimating the Effect of Training Programs on Earnings,” Reviewof Economics and Statistics, Vol. 60, No. 1, pp. 47–57.
Busso, M., J. DiNardo, and J. McCrary, 2008, “New Evidence on the Finite SampleProperties of Propensity Score Matching and Reweighting Estimators,” WorkingPaper.
Capron, L., 1999, “The long-term performance of horizontal acquisitions,” StrategicManagement Journal, Vol. 20, pp. 987–1018.
Caves, R., 1996, Multinational Enterprise and Economic Analysis (Cambridge, England:Cambridge University Press).
Chari, A., P. Ouimet, and L. Tesar, 2010, “The Value of Control in Emerging Markets,”Review of Financial Studies, Vol. 23, No. 4, pp. 1741–70.
Chen, Wenjie, 2008, “The Relationship between Exchange Rates and FDI,” mimeo.
_______ , 2011, “Does the Country of Origin of the Acquiring Firm ImpactPerformance?,” Journal of International Economics, Vol. 83, No. 2, pp. 219–28.
Citigroup, 2005 “Cross-Border Acquisitions: A Value Creation Strategy forEmerging Market Multinational Companies” Global Corporate Finance Report,February 14.
Conyon, M., S. Girma, S. Thompson, and P. Wright, 2002, “The impact of mergers andacquisitions on company employment in the United Kingdom,” European EconomicReview, Vol. 46, No. 1, pp. 31–49.
Doms, M.E., and J.B. Jensen, 1998, “Comparing wages, skills, and productivity betweendomestically and foreign-owned manufacturing establishments in the United States,”in Geography and Ownership as Bases for Economic Accounting, ed by Baldwin,R.E. Lipsey and J.D. Richardson Chicago. University of Chicago Press. p. 235–258.NBER Book Series Studies in Income and Wealth. Vol. 59.
Forbes, Kristin, 2008, “Why Do Foreigners Invest in the United States?” NBERWorking Paper, No. 13908.
Frolich, M., 2004, “Finite-sample properties of propensity-score matching and weightingestimators,” The Review of Economics and Statistics, Vol. 86, No. 1, pp. 77–90.
Anusha Chari, Wenjie Chen, and Kathryn M.E. Dominguez
40
Froot, K., and J. Stein, 1991, “Exchange rates and foreign direct investment: Animperfect capital markets approach,” Quarterly Journal of Economics, Vol. 106,No. 4, pp. 1191–217.
Fukao, Kyoji, Ito Keiko, Ug Kwon Hyeog, and Takizawa Miho, 2006, “Cross-BorderAcquisitions and Target Firms’ Performance: Evidence From Japanese Firm-LevelData,” NBER Working Papers, No. 12422.
Girma, S., 2005, “Technology Transfer from Acquisition FDI and the AbsortiveCapacity of Domestic Firms: An Empirical Investigation,” Open Economics Review,Vol. 16, pp. 175–87.
Girma, S., and H. Gorg, 2007, “Evaluating foreign ownership wage premium using adifference-in-differences Matching Approach,” Journal of International Economics,Vol. 72, No. 1, pp. 97–112.
Girma, S., R. Kneller, and M. Oisu, 2007, “Do Exporters Have Anything to Learn fromForeign Multinationals?” European Economics Review, Vol. 51, pp. 981–98.
Greenstone, M., R. Hornbeck, and E. Moretti, 2008, “Identifying AgglomerationSpillovers: Evidence from Million Dollars Plants,” NBER Working Paper No. 13833.
Harris, R., and D. Ravenscraft, 1990, “The Role of Acquisitions in Foreign DirectInvestment: Evidence from the U.S. Stock Market,” The Journal of Finance, Vol. 46,No. 3, pp. 825–44.
Haskel, J., S. Pereira, and M. Slaughter, 2007, “Does Inward Foreign Direct InvestmentBoost the Productivity of Domestic Firms?” Review of Economics and Statistics,Vol. 89, No. 3, pp. 482–96.
Hemerling, J., D. Michael, and H. Michaelis, 2006, “China’s Global Challengers: TheStrategic Implication of Chinese Outbound M&A,” Boston Consulting GroupReport, www.bcg.com.
Hirano, K., G.W. Imbens, and G. Ridder, 2003, “Efficient estimation of averagetreatment effects using the estimated propensity score,” Econometrica, Vol. 71, No. 4,pp. 1161–89.
Ho, D.E., I. Kosuke, G. King, and E.A. Stuart, 2007, “Matching as NonparametricPreprocessing for Reducing Model Dependence in Parametric Causal Inference,”Political Analysis, Vol. 15, pp. 199–236.
Javorcik, B.S., 2004, “Does Foreign Direct Investment Increase the Productivity ofDomestic Firms? In Search of Spillovers through Backward Linkages,” AmericanEconomic Review, Vol. 94, pp. 605–27.
Karolyi, A., and R. Liao, 2009, “What is Different about Government-ControlledAcquirers in Cross-Border Acquisitions?” Available via the Internet:www.business.rutgers.edu/files/karolyi2009.pdf.
OECD, 2008, “Tax Cooperation: Toward a Level Playing Field,” Available via the Internet:www.oecd.org/document/55/0,3343,en_2649_33745_41233143_1_1_1_37427,00.html.
Perez-Gonzales, Francisco, 2004, “The Impact of Acquiring Control on Productivity:Evidence from Mexican Manufacturing Plants,” mimeo.
Petkova, N., 2008, “Does Foreign Ownership Lead to Higher Firm Productivity?” mimeo.
Rosenbaum, P., and D. Rubin, 1983, “The Central Role of the Propensity Score inObservational Studies for Causal Effects,” Biometrika, Vol. 70, pp. 41–55.
_______ , 1985, “Constructing a Control Group using Multivariate Matched SamplingMethods that Incorporate the Propensity Score,” The American Statistician, Vol. 39,No. 1, pp. 33–8.
FOREIGN OWNERSHIP AND FIRM PERFORMANCE
41

Rossi, S., and P. Volpin, 2004, “Cross-Country Determinants of Mergers andAcquisitions,” Journal of Financial Economics, Vol. 74, pp. 277–304.
Shadish, W.R., T.D. Cook, and D.T. Campbell, 2002, Experimental and Quasi-Experimental Designs for Generalized Causal Inference (Boston, MA: Houghton-Mifflin).
Wells, L., 1983, Third World Multinationals: The Rise of Foreign Investment fromEmerging Markets (Cambridge, MA: MIT Press).
Anusha Chari, Wenjie Chen, and Kathryn M.E. Dominguez
42
Recommended