Further Education workforce data for
England
Analysis of the 2012-2013 staff individualised record data
September 2014
2
Contents
Foreword 4
Executive Summary 5
1 Introduction 8
2 Our approach 9
2.1 The data 9
2.2 Dataprocessinganddefinitions 10
3 ProfileoftheFurtherEducationworkforceinEngland 12
3.1 All staff 12
3.2 Teaching staff 20
4 TrendsintheFurtherEducationcollegeworkforce 25
4.1 All FE staff 25
4.2 Trends in the characteristics of teaching staff 26
5 Inferencesonthetotalworkforcepopulation 27
6 Conclusions 31
Annexe 1: Figures and Tables 35
Annexe2:ProfileofEnglishandMathematicsteachersintheFEworkforce,2012/13 36
3
Figures and TablesFigure 1. Illustration of a typical FE college 10
Figure2.ProportionoffemalestaffinFEcollegesinEngland,2012-13 15
Figure3.ProportionofFTEfemalestaffinFEcollegesinEngland,2012-13 15
Figure4.MedianagebygenderandcontracttypeinFEcollegesinEngland,2012-13 16
Figure5.Proportionofpart-timestaffbyagebands,2012-13 16
Figure6.ProportionofstaffbyagebandsinFEcollegesinEngland,2012-13 17
Figure7.SexualorientationofFEstaffinEngland,2012-13 18
Figure8.Medianpaybandsforfull-timestaffbyregion,2012-13 20
Figure9.Teacherspercollegebymainsubjecttaught,2012-13 23
Figure 10. SIR21 process and timelines 35
Table 1. Characteristics of SIR21 data return 9
Table2.StaffnumbersbyoccupationalgroupinFEcollegesinEngland,2012-13 12
Table3.Proportionofpart-timebyoccupationalgroupinFEcollegesinEngland,2012-13 13
Table4.NumberofFTEstaffbyoccupationalgroupinFEcollegesinEngland,2012-13 13
Table 5. Turnover and net employment change rates by occupational group in FE colleges inEngland,2012-13 14
Table6.EthnicityofstaffinFEcollegesinEngland,2012-13 17
Table7.DistributionofFEstaffacrossregionsinEngland,2012-13 19
Table8.Medianpayforfull-timestaffinFEcollegesinEngland,2012-13 19
Table9.SubjectstaughtinFEcollegesreportingSIRdatainEngland,2012-13 22
Table10.Turnoverratesandnetemploymentchangesbysubject,inEngland,2012-13 23
Table11.Annualpayforfull-timeteachingstaffbysubject,inEngland,2012-13 24
Table 12. Colleges reporting SIR in 2012-13 as a proportion of total number of AoC member colleges,byregion 27
Table13.TotalexpenditureandFTEstaffincollegesreportingSIRin2012-13, as a proportion of the total 28
Table14.EstimatedtotalFEstaffinEngland,2012-13 29
Table15.EstimatedtotalFEteachersinEngland,2012-13 30
Table16.Medianannualpaybandsforfull-timeteachingstaffbyregionsinEngland 35
Table17.DistributionofFEworkforcebyagebands,2012-13comparedto2011-12 35
Table 18. Key characteristics of English and Communication and Science and Mathematicsteachers 36
4
ForewordOur most important asset in FE is our staff. It is not buildings and computers that deliver the skills agenda, engage with NEETs or plan and deliver a liberal education - it is people, our staff.
Our most important asset is also the single most expensive line in any college’s budget. During the last four years we have experienced unprecedented pressures on our budgets, and we know, from policy announcements already made, that the public sector faces several more years of similar, if not increased, pressures on resource.
This work, compiled by the Education and Training Foundation, is important for several reasons:
• Forpolicymakersitprovidesanevidencebaseconcerningthechangesinworkforcethatthesectoris experiencing and having to manage. Although decisions by Ministers always have a strong political dimension,thestartingpointfortheirofficials,andtheadvicethatMinistersaregiven,comesfroman evidence base.
• Representativeorganisations,suchastheAssociationofColleges,requireimpartialevidenceinorder to lobby effectively on behalf of the sector. Without evidence, the lobbyist’s position can lack credibility and be dismissed easily.
• Andforcollegegovernorsandmanagers,it’softenusefultobeabletocomparetheirlocalexperiencewith the national picture.
The compilation of the information does place an administrative ‘burden’ on each college, and this willonlybejustifiedbythevaluethattheinformationwillbringtodiscussion,debateandpolicyinformation. The Education and Training Foundation is acutely aware of its responsibility to extract maximum value and ‘purchase’ from the data, if the sector is to be convinced that it is spending its time and resource wisely.
The Education and Training Foundation already provides a method of analysis for colleges to compare themselves to others on a regional or national basis – through the OLAP system where they complete the return. If you’re reading this as a college Principal, I’d urge you to take a look and see just how your college compares – do you have more or fewer female staff than the average, do you pay teachers the sector average, do you have fewer part-time staff as a percentage of the whole? Any college that has made a return is able to make these comparisons, and in future we’d like that to be easier.
ThisreporthasbuiltonpreviousSIRreportsandoffersaclearpicture,basedonthecollegesthatmadefull returns for 2012/13. These colleges are broadly representative of the sector as a whole, and the informationinthereporthasbeenscaledupfromthesample.Thisisthefirsttimethatthedatahasbeen analysed in this way, which means that not only is the data useful for colleges, but policy makers now have data on the whole sector to inform discussion and decisions.
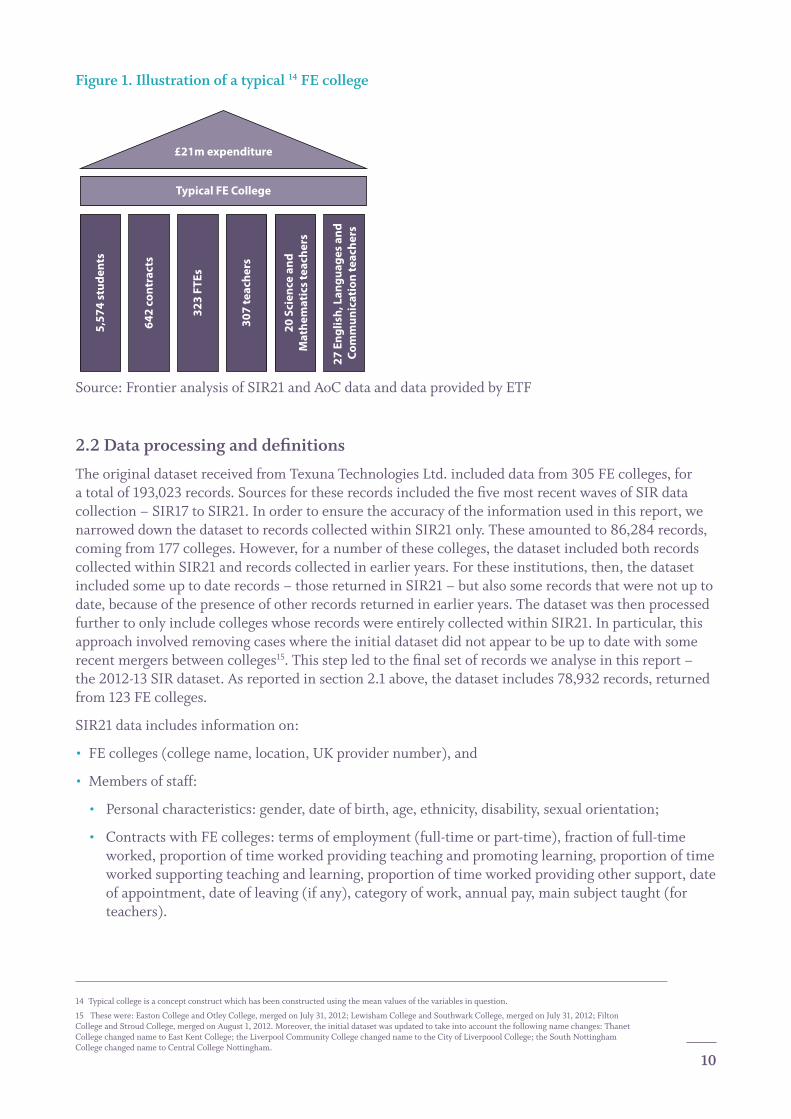
The data allows us to identify an average college, as a point of comparison, but also helps us to explain the sector to others. An average college spends £21m a year, has 5,574 students, and employs 642 people, of whom 307 are teachers. While many colleges are far from average, this helps us to understand and explain how we are both similar and different.
Wehopethisreportwillbeusefultoyou,anddonothesitatetogetintouchwithCharlynnePullen,theResearchManagerattheFoundationonsirenquiries@etfoundation.co.ukifyouhaveanycommentsorqueries.
Mike Hopkins Member of the Education and Training Foundation Expert Panel for Professional Standards and Workforce Development
5
Executive SummaryThe Education and Training Foundation (ETF) commissioned Frontier Economics to carry out an analysisofworkforcedatafromtheStaffIndividualisedRecord(SIR)datasetforFurtherEducation(FE)collegesinEnglandfor2012-2013.Thisreportpresentsthefindingsfromouranalysis,whichcanbeusedbystakeholderstoassesstheFElandscapeandinformfuturepolicy.
The SIR data are supplied by FE colleges for each academic year on a voluntary basis. As the data collectionisnotcompulsory,itreliesonthegoodwillofcollegestocompletethereturn.TheSIRcollectionprocessspansmorethanonecalendaryear,frompublicationofthedataspecificationtodatasubmission by colleges1.
Responserateshavebeendecliningovertime,sothat,in2012-13,onlyaroundathirdofcollegessuppliedup-to-dateinformation.Thistrendisclearlyacauseforconcern,asoneofthechiefaimsoftheSIRdataistoprovidetheFEsectorwitharobustbasisforworkforceplanning.Goingforward,itwill be important to ensure that response rates are maximised.
Thedatausedintheanalysisarebasedonresponsesfrom123FEcollegesinEngland,aroundathirdofall FE colleges in the sector (more information on types of college can be found in section 1 below). The datacomprise78,932records,eachrelatingtoastandardcontractofemploymentbetweenacollegeand an individual. Previous reports analysing the SIR data have used college information submitted uptofiveyearspreviously(backfilled)ifnomorerecentsubmissionwasavailable.The2013reportuseddatafrom266colleges,withapproximatelyonethirdoftherecordsbackfilled2.Forthisreport,onlyuptodateinformationhasbeenusedinordertoensurethatthedataareaccurateandreflectthe current status of the sector. Although this implies using information from a smaller number of collegescomparedtopreviousyears,ourindicativeanalysissuggeststhatthedatausedinthisreportarereasonably representative of the entire FE population.
Thekeyfindingsfromouranalysisaresummarisedbelow.
All staff
• ThegendercompositionoftheFEworkforcehasnotchangedsincelastyear.Theproportionoffemalesin2012-13is63.8%,comparedto63.5%in2011-12.ThisissimilartotheWorkBasedLearning(WBL)workforce(where65%ofstaffarefemale)butislowerthantheAdultandCommunityLearning(ACL)workforce,where74%ofstaffarefemale3.
• Wealsofindthatpatternsinthegendersplitofstafffordifferenttermsofemploymentandfordifferent occupational categories are consistent with 2011-12:
• Theproportionofwomenremainshigheramongpart-timecontracts.Here,wealsofindasmallincrease:72.2%in2012-13comparedto71.2%in2011-12.
• Variation in gender composition by occupational category remains consistent with previous years. TheproportionofwomenremainsespeciallyhighamongAdministrativeandprofessionalstaff,Wordprocessing,clerical,secretarialstaff,andServicestaff,andespeciallylowamongTechnicalstaff.
• ThemedianageoftheFEworkforceis45years.Part-timestafftendtobeolderthanfull-timestaff(46yearsvs.44yearsrespectively).Malestaffareonaverageslightlyolderthanfemalestaffmedianage(46yearsvs.45years).WefindnosignificantdifferencesintheagecompositionofFEstaffbetween 2011-12 and 2012-13.
1 Please see the Annexe 1 for more detail on timelines.
2 Precisely,thedatausedin2013included168,333records,ofwhich66%werefromthe2011-12collection,and34%weresubmittedin2009-10or2010-11(“FurtherEducationCollegeWorkforceDataforEngland:AnanalysisoftheStaffIndividualisedRecordData2011-2012”,June2013,LSIS)
3 “WorkBasedLearningWorkforceSurvey2012-13”,AELPandETFand“AdultandCommunityLearningWorkforceSurvey2012-13”,HOLEXandETF,both published alongside this report in 2014.
6
• TheageprofileoftheFEworkforceissomewhatdifferentfromthatoftheWBLandACLworkforce:
• 23%ofFEstaffareagedunder35comparedwith38%ofWBLand11%ofACLstaff;and
• 24%ofFEstaffareaged55oroldercomparedwith12%ofWBLand32%ofACLstaff.
• ThemajorityofFEstaff(84%)arewhiteBritish,acrossalloccupationalcategories.ThisissimilarinWBL(86%)andACL(83%)providers.TheproportionofwhiteBritishstaffishighestamongseniormanagers (91%). The coverage of information on ethnicity has decreased substantially over time. Inthe2013report,usingdatafrom2008-09upto2011-12,informationonethnicitywasavailablefor94.4%ofcontracts.Usingonlythe2012-13data,thisproportiongoesdownto75.8%.Basedontheinformationavailable,theethniccompositionofFEstaffin2012-13isconsistentwith2011-12.However,giventhelargedifferenceindatacoverage,comparisonsbetweenthetwoyearsshouldbeconsidered tentative.
• Asinpreviousyears,sexualorientationremainsunderreported–67%ofrecordsreturnedweremarkedas‘unknown’4.Thisis,however,animprovementonthelasttwoyearswheretheproportionofanswersmarkedas‘unknown’was92%(2010-2011)and83%(2011-2012)5.Afurther7%ofrecordsaremarkedas‘prefernottosay’.Wheresexualorientationhasbeenindicated,thevastmajority of staff have reported themselves as heterosexual.
• Approximately 4% of FE staff reported having a disability. This is similar to the rate reported in 2011-12andtotheratesreportedintheACL(4.2%)andWBL(3.6%)workforcesurveys.Ofthose,around half provided information on the type of disability. Physical impairment is the most common formofdisability,followedbylearningdifficultyandillmentalhealth.85%ofstaffreportednothavingadisabilityandin11%ofcasesdisabilitystatusisnotknown,eitherbecausenoinformationwasreported(2%ofstaff),orbecauserespondentspreferrednottodisclosetheirstatus(9%).
• Theincidenceofpart-timeworkingin2012-13issimilartopreviousyears:58%ofcontractsin 2012-13werepart-timecomparedto57%inthepreviousyear.Theincidenceofpart-timeworkingishigherintheACL(80%)sector,andlowerintheWBL(14%)sector.
• Medianannualpayforfull-timeemployeesin2012-13isbetween£23,000and£23,999.Thisrangesfrom£16,000-16,999forwordprocessing,clerical,secretarial,andservicestaffto£62,000–62,999forseniormanagers.Annualpayvariessignificantlybyregion.ItishighestinGreaterLondon,at£29,000-29,999,andlowestintheSouthEastandtheNorthEastat£20,000–20,999.Thisisdrivenby variation in pay levels across all occupational categories.
• Averagefull-timepayishigherformales,at£27,522,thanforfemales,at£25,824.Thisgapcouldbeexplainedbygenderdifferencesinoccupationcategories,location,orotherfactors,whoserolecouldbe disentangled through further research.
• The gender pay gap has reduced slightly since last year - the ratio between female and male annual pay has increased from 93.4% in 2011-12 to 93.8% in 2012-13.
• Annualpayforfull-timestaffhaschangedlittleinnominaltermsinthelastyear.Wefindaverysmallincreaseacrossallstaffof0.1%.Thisamountstoafallinrealterms,givenanannualConsumerPriceInflationrateof2.7%inSeptember20136.Relativeto2011-12,payincreasedinnominaltermsforOthermanagers,Technicalstaff,andServicestaffanddecreasedforSeniormanagers,Wordprocessingstaff,andAdministrativeandprofessionalstaff.Payremainedbroadlyconstant(variationunder0.5%)forTeachingstaffandAssessorsandverifiers.
4 AsimilarproportionofrecordsweremarkedasunknownintheWBL(71%)andACL(75%)surveys.
5 “FurtherEducationWorkforceDataforEngland:AnanalysisoftheStaffIndividualisedRecordData2011-2012”,June2013,LSIS
6 Source:OfficeforNationalStatistics,2013.
7
Teaching staff
• ThelargestoccupationalcategoryintheFEworkforceisteachingstaff:thiscategoryaccountsforalmosthalf(48%)ofallcontractsintheSIR21data.However,thishasdecreasedslightlycomparedto2011-12,whenitstoodat49%.
• TeachersinFEcollegesinEnglandarepredominantlyfemale,buttheproportionofwomenamongteachingstaffissmallerthanamongtheoverallFEworkforce(59%comparedto64%acrossallstaff).The gender split of teaching staff between contract types is consistent with 2011-12: the proportion of femalesis65.3%amongpart-timecontracts(66.2%in2011-12),and48%amongfull-timecontracts(stable compared to 2011-12).
• Teachers are slightly younger than the total FE staff (median age 44 years compared to 45). The average7ageofteachershasdecreasedslightly,from46to45years,between2011-12and2012-13.
• Asin2011-12,theproportionofWhiteBritishindividualsisloweramongteachers(80%)thanamongFEstaffoverall(82%).However,thedifferencebetweenthetwogroupshasreduced-in2012-1383%ofteacherswereWhiteBritishcomparedwith84%ofallFEstaff8.
• Averageannualpayforfull-timeteachersis£29,647,comparedto£26,630forallfull-timeFEstaff.Thereisasignificantamountofvariationinpayacrossregions.AsforallFEstaff,teacherpayishighestinGreaterLondonandlowestintheSouthEastandtheNorthEast.Payisstablecomparedto2011-12atca.£29,600peryearforfull-timeteachers(£29,696in2011-12and£29,647in2012-13).
• Asin2011-12,teachersaremorelikelytobepart-timethanotherFEstaff.62%ofteachersareemployedonapart-timebasiscomparedwith58%ofthegeneralFEworkforce.
• Teachingstaffjoiningin2012-13tendtobeolder,andmoreoftenmale,thanstaffjoiningearlier:
• The average age of teachers at contract start date is higher among those joining in 2012-139 (42 years) than among those joining earlier (39 years).
• 57%ofteachersjoiningin2012-13werefemale,comparedto59%inearlieryears.
• Asin2011-12,thesubjectareastaughtbythelargestnumberofstaffare:VisualandPerformingArtsandMedia;Health,SocialCareandPublicServices;andEnglish,Languages,andCommunication.Subjectswiththesmallestnumberofteachingstaffare:Retailing,CustomerServiceandTransportation;andLandBasedProvision.
7 Meanaverage
8 Again we note that there is a considerable difference between the two years in terms of availability of information on ethnicity.
9 Forthepurposeofthiswehavedefined2012-13astheperiodbetweenAugust1,2012andAugust30,2013.
8
1. IntroductionThisreportpresentsthefindingsfromananalysisofworkforcedatafromtheStaffIndividualisedRecord (SIR) data set for further education colleges in England for 2012-2013. This is the tenth publicationintheseriesofannualSIRreportsonthefurthereducationcollegeworkforceinEnglandandthefirsttobeproducedbytheEducationandTrainingFoundation(ETF).
Therearefivetypes10 of colleges supplying SIR data but the vast majority of data relates to general Further Education (FE) colleges (including tertiary education). The data contain information on allstaff–teachingandnotteaching–coveringstaffdemographics(suchasage,gender,ethnicity,disabilityandsexualorientation),staffoccupationandpay,subjectstaughtandgeographicallocation.Since2011-12,informationonstaffqualificationlevelisnolongercollectedwithinSIRdata–thisrequirementwasremovedinabidtostreamlinethecollectionandmakeitlessburdensomeforcollegesto complete.
Thisreportprovidesadescriptiveaccountofthestaffworkingincollegesin2012-2013coveringallaspectsofthedata(demographics,pay,subjectstaught,etc).Thereportalsocommentsontrendsovertimewherepossiblebycomparingthefindingsfromthe2012-13datawiththoseinpreviousreports.
This report is organised as follows:
• Section 2 discussesouroverallapproachtotheworkincludingmethodology,andincludesadetaileddescriptionofthedataprocessingwehavecarriedout,notinganydifferencesfrompreviousreports.
• Section 3 containsthemaindescriptionoftheFEworkforceinEngland.Thesectionisdividedintotwoparts,onefocusingonallstaffandtheotherfocusingonteachingstaffonly.
• Section 4 investigatestrendsinthecharacteristicsoftheFEworkforceovertime,comparing2012-13data with previous years.
• Section 5 containsourestimatesofthetotalworkforcenumbers(derivedbyscalinguptheSIR21data).
• Section 6 containsourconclusionsbasedontheanalysisofthedata,settingoutthelimitationsoftheworkandprovidingasetofrecommendationsforfuturework,touchingonresponseratesandtheinformation collected.
10 Nationalspecialistcolleges,sixthformcolleges,specialcolleges,agricultureandhorticultureandspecialistdesignatedcolleges(in“FurtherEducationCollegeWorkforceDataforEngland:AnanalysisoftheStaffIndividualisedRecordData2011-2012”,June2013,LSIS).CollegesmayalsobeAdultEducationColleges(butnotLocalAuthorities)andCollegesofFurtherandHigherEducation.WehavetakenthebroadestunderstandingofFEcolleges,whileexcludingthosecoveredbyeithertheWork-BasedLearningortheAdultandCommunityLearningSurvey.Thisensureswehavethebroadestcoverageoftheeducationandtrainingsystemacrossalltheworkforcedatareports.
9
2. Our approach2.1 The data
TheSIRdatafor2012-2013arebasedonresponsesfrom123furthereducationcollegesinEngland,whichequatestoapproximatelyonethird11ofthesector.Inpreviousyears,collegedatasubmitteduptofiveyearspreviouslywereincluded(backfilled)ifnomorerecentsubmissionwasavailable.Backfilledrecords made up a third of the data sample used in the SIR 2011-12 report.
Forthisreport,onlyuptodateinformationhasbeenusedinordertoensurethatthedataareaccurateandreflectthecurrentstatusofthesector.Removingoldrecordsfromthedatareducesthesamplesizeusedintheanalysis.However,withalmost80,000currentrecords,weareconfidentthatthesamplesizeislargeenoughtoproducerobustresults.
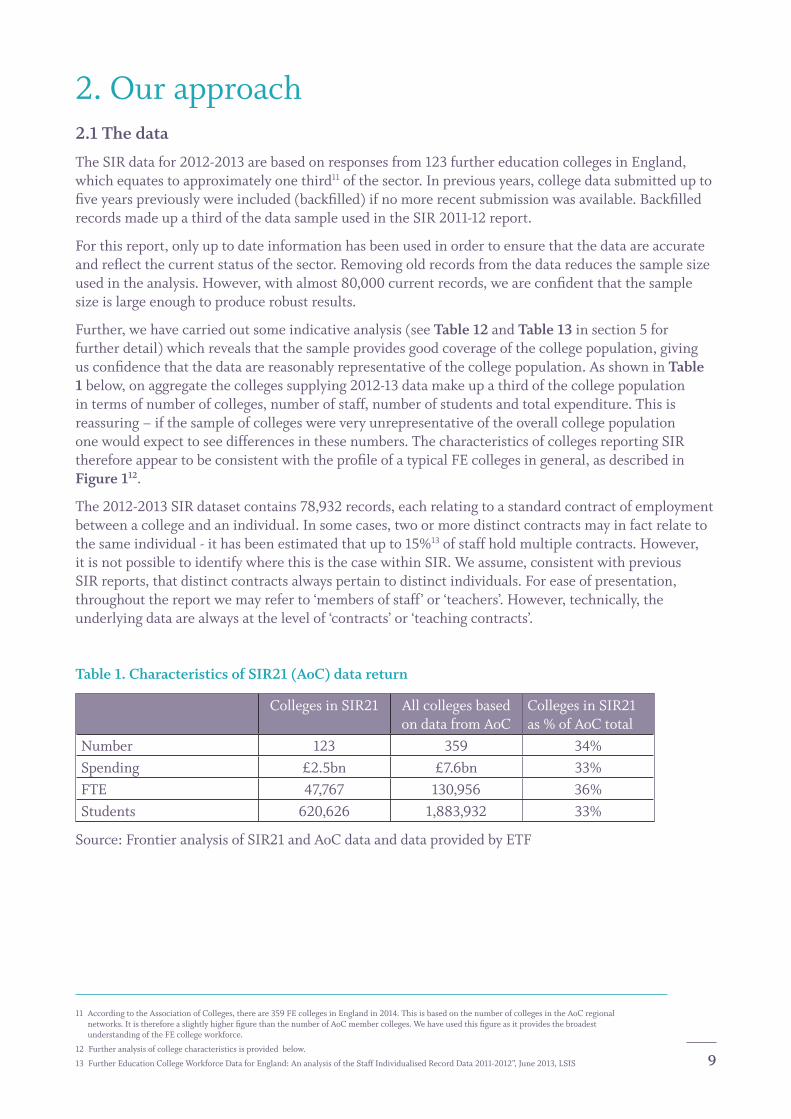
Further,wehavecarriedoutsomeindicativeanalysis(seeTable 12 and Table 13 in section 5 for furtherdetail)whichrevealsthatthesampleprovidesgoodcoverageofthecollegepopulation,givingusconfidencethatthedataarereasonablyrepresentativeofthecollegepopulation.AsshowninTable 1 below,onaggregatethecollegessupplying2012-13datamakeupathirdofthecollegepopulationintermsofnumberofcolleges,numberofstaff,numberofstudentsandtotalexpenditure.Thisisreassuring – if the sample of colleges were very unrepresentative of the overall college population one would expect to see differences in these numbers. The characteristics of colleges reporting SIR thereforeappeartobeconsistentwiththeprofileofatypicalFEcollegesingeneral,asdescribedinFigure 112.
The2012-2013SIRdatasetcontains78,932records,eachrelatingtoastandardcontractofemploymentbetweenacollegeandanindividual.Insomecases,twoormoredistinctcontractsmayinfactrelatetothe same individual - it has been estimated that up to 15%13ofstaffholdmultiplecontracts.However,itisnotpossibletoidentifywherethisisthecasewithinSIR.Weassume,consistentwithpreviousSIRreports,thatdistinctcontractsalwayspertaintodistinctindividuals.Foreaseofpresentation,throughoutthereportwemayreferto‘membersofstaff’or‘teachers’.However,technically,theunderlying data are always at the level of ‘contracts’ or ‘teaching contracts’.
Table 1. Characteristics of SIR21 (AoC) data return
Colleges in SIR21 All colleges based on data from AoC
Colleges in SIR21 as % of AoC total
Number 123 359 34%Spending £2.5bn £7.6bn 33%FTE 47,767 130,956 36%Students 620,626 1,883,932 33%
Source: Frontier analysis of SIR21 and AoC data and data provided by ETF
11 AccordingtotheAssociationofColleges,thereare359FEcollegesinEnglandin2014.ThisisbasedonthenumberofcollegesintheAoCregionalnetworks.ItisthereforeaslightlyhigherfigurethanthenumberofAoCmembercolleges.WehaveusedthisfigureasitprovidesthebroadestunderstandingoftheFEcollegeworkforce.
12 Further analysis of college characteristics is provided below.
13 FurtherEducationCollegeWorkforceDataforEngland:AnanalysisoftheStaffIndividualisedRecordData2011-2012”,June2013,LSIS
10
Figure 1. Illustration of a typical 14 FE college5,
574
stud
ents
642
cont
ract
s
323
FTEs
Typical FE College
£21m expenditure
307
teac
hers
20 S
cien
ce a
ndM
athe
mat
ics
teac
hers
27 E
nglis
h, L
angu
ages
and
Co
mm
unic
atio
n te
ache
rs
Source: Frontier analysis of SIR21 and AoC data and data provided by ETF
2.2 Data processing and definitions
TheoriginaldatasetreceivedfromTexunaTechnologiesLtd.includeddatafrom305FEcolleges,foratotalof193,023records.SourcesfortheserecordsincludedthefivemostrecentwavesofSIRdatacollection–SIR17toSIR21.Inordertoensuretheaccuracyoftheinformationusedinthisreport,wenarroweddownthedatasettorecordscollectedwithinSIR21only.Theseamountedto86,284records,comingfrom177colleges.However,foranumberofthesecolleges,thedatasetincludedbothrecordscollectedwithinSIR21andrecordscollectedinearlieryears.Fortheseinstitutions,then,thedatasetincluded some up to date records – those returned in SIR21 – but also some records that were not up to date,becauseofthepresenceofotherrecordsreturnedinearlieryears.ThedatasetwasthenprocessedfurthertoonlyincludecollegeswhoserecordswereentirelycollectedwithinSIR21.Inparticular,thisapproach involved removing cases where the initial dataset did not appear to be up to date with some recent mergers between colleges15.Thisstepledtothefinalsetofrecordsweanalyseinthisreport–the2012-13SIRdataset.Asreportedinsection2.1above,thedatasetincludes78,932records,returnedfrom 123 FE colleges.
SIR21 data includes information on:
• FEcolleges(collegename,location,UKprovidernumber),and
• Membersofstaff:
• Personalcharacteristics:gender,dateofbirth,age,ethnicity,disability,sexualorientation;
• ContractswithFEcolleges:termsofemployment(full-timeorpart-time),fractionoffull-timeworked,proportionoftimeworkedprovidingteachingandpromotinglearning,proportionoftimeworkedsupportingteachingandlearning,proportionoftimeworkedprovidingothersupport,dateofappointment,dateofleaving(ifany),categoryofwork,annualpay,mainsubjecttaught(forteachers).
14 Typicalcollegeisaconceptconstructwhichhasbeenconstructedusingthemeanvaluesofthevariablesinquestion.
15 Thesewere:EastonCollegeandOtleyCollege,mergedonJuly31,2012;LewishamCollegeandSouthwarkCollege,mergedonJuly31,2012;FiltonCollegeandStroudCollege,mergedonAugust1,2012.Moreover,theinitialdatasetwasupdatedtotakeintoaccountthefollowingnamechanges:ThanetCollegechangednametoEastKentCollege;theLiverpoolCommunityCollegechangednametotheCityofLiverpooolCollege;theSouthNottinghamCollege changed name to Central College Nottingham.
11
Withinthissetofvariables,itisimportanttonotethefollowingdefinitions,outlinedinthedataspecificationandusedthroughoutthisreport:
• ‘Annualpay’isthegrosspayforworkduringthe2012-13taxyear(6April2012to5April2013).
• ‘Dateofleaving’isthedateatwhichacontractterminates,unless,inthecaseoffixed-termandcasualstaff,thelearningproviderdoesnotexpecttorenewthecontractintheperiodimmediatelyfollowing.
• ‘Fractionoffull-time’isdefinedasthehoursthatamemberofstaffiscontractedtoworkoverayear,asaproportionoftheinstitution’sowndefinitionoffull-timeforthatposition.Thisvariablecantakeonvalueslargerthan100.
Anumberofvariablesrequiredsomemanipulationtoobtaincategoriesconsistentwiththe2013report:
• The‘Categoryofwork’variablereportsdetailedcategoriesthatwehaveaggregatedintobroaderoccupationalgroups,consistentwiththe2013report.Specifically,wedefineasateacherorateaching contract a record where the occupational category is recorded as either ‘Trainer’ or ‘Lecturer/Tutor’.
• Similarly,the‘Ethnicity’variablealsorequiredsomeaggregationintocategoriesconsistentwiththe2013report.Moreover,recordspreviouslyreportedas‘White–OtherEuropean’havebeenrecodedto‘White–Anyother’,inlinewiththeSIR21specification.
Havingdefinedthefinaldatasetintermsofrecordsandvariablesincluded,wehaveperformedanumberofcheckstoensureconsistencywiththespecification:
• ForSIRfieldsreportedascategories(e.g.ethnicity,disability),weverifiedthatvaluesreportedwereconsistentwiththelistofadmissiblevaluesfromthedataspecification.
• SIRfields16,17,18,and24shouldallbeproportions-withvaluesbetween0and100.Noadjustmentswerenecessaryasaresultofthischeck.
• Inanumberofcases,the‘Age’variablehadbeenrecordedaslessthan15–often0.Wehavechanged the value to missing in these instances.
12
3.ProfileoftheFurtherEducation workforceinEngland
ThissectionprovidesadescriptionoftheFEworkforceinEnglandbasedontheSIR21datareturnandfocusingongender,age,ethnicity,sexualorientation,disability,location(byregion)andpay.Thesection is divided in two parts:
• Thefirstpartdescribesthecharacteristicsofallstaff;and
• The second part focuses on teaching staff only.
3.1 All staff
3.1.1 Total numbers by occupation
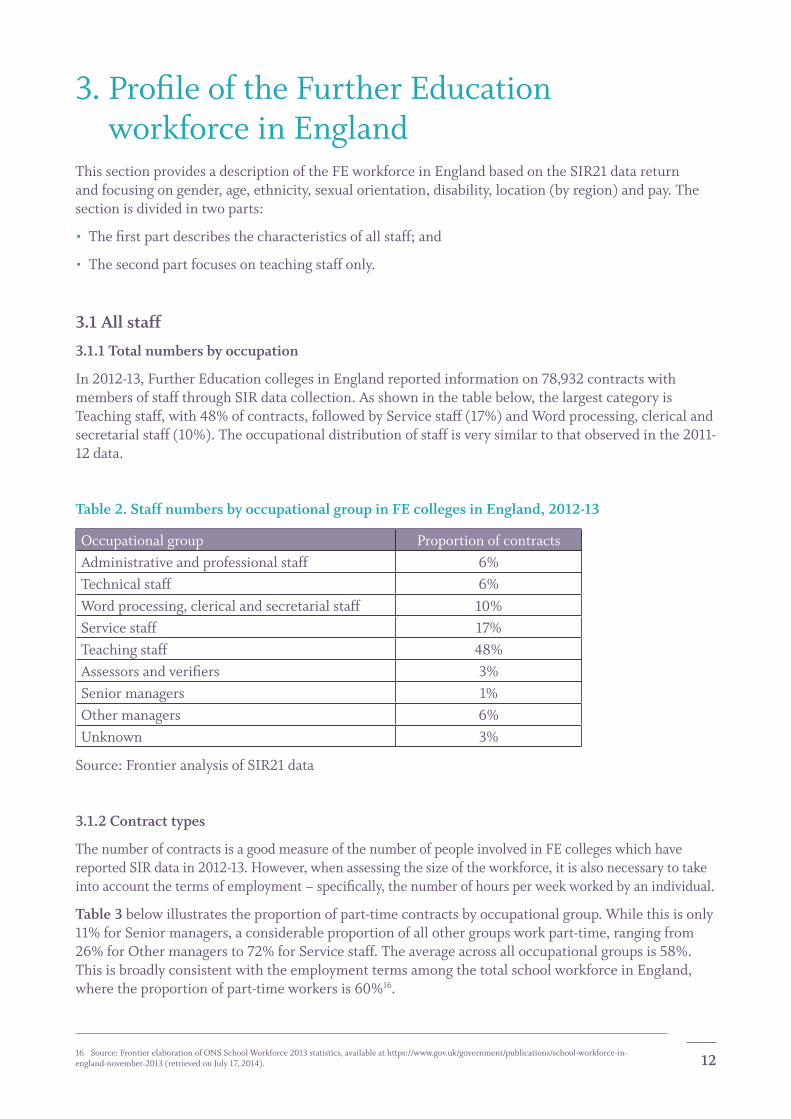
In2012-13,FurtherEducationcollegesinEnglandreportedinformationon78,932contractswithmembersofstaffthroughSIRdatacollection.Asshowninthetablebelow,thelargestcategoryisTeachingstaff,with48%ofcontracts,followedbyServicestaff(17%)andWordprocessing,clericalandsecretarial staff (10%). The occupational distribution of staff is very similar to that observed in the 2011-12 data.
Table 2. Staff numbers by occupational group in FE colleges in England, 2012-13
Occupational group Proportion of contractsAdministrative and professional staff 6%Technical staff 6%Wordprocessing,clericalandsecretarialstaff 10%Service staff 17%Teaching staff 48%Assessorsandverifiers 3%Senior managers 1%Other managers 6%Unknown 3%
Source: Frontier analysis of SIR21 data
3.1.2 Contract types
The number of contracts is a good measure of the number of people involved in FE colleges which have reportedSIRdatain2012-13.However,whenassessingthesizeoftheworkforce,itisalsonecessarytotakeintoaccountthetermsofemployment–specifically,thenumberofhoursperweekworkedbyanindividual.
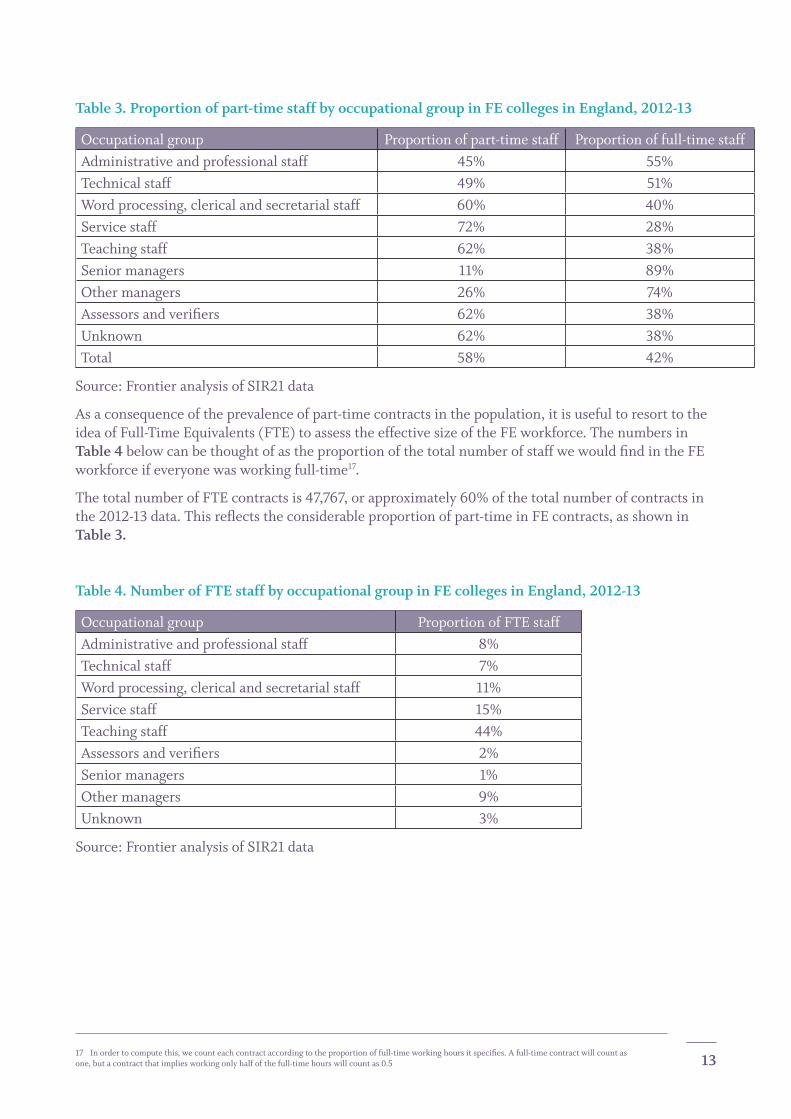
Table 3 below illustrates the proportion of part-time contracts by occupational group. While this is only 11%forSeniormanagers,aconsiderableproportionofallothergroupsworkpart-time,rangingfrom26%forOthermanagersto72%forServicestaff.Theaverageacrossalloccupationalgroupsis58%.ThisisbroadlyconsistentwiththeemploymenttermsamongthetotalschoolworkforceinEngland,wheretheproportionofpart-timeworkersis60%16.
16 Source:FrontierelaborationofONSSchoolWorkforce2013statistics,availableathttps://www.gov.uk/government/publications/school-workforce-in-england-november-2013(retrievedonJuly17,2014).
13
Table 3. Proportion of part-time staff by occupational group in FE colleges in England, 2012-13
Occupational group Proportion of part-time staff Proportion of full-time staffAdministrative and professional staff 45% 55%Technical staff 49% 51%Wordprocessing,clericalandsecretarialstaff 60% 40%Service staff 72% 28%Teaching staff 62% 38%Senior managers 11% 89%Other managers 26% 74%Assessorsandverifiers 62% 38%Unknown 62% 38%Total 58% 42%
Source: Frontier analysis of SIR21 data
Asaconsequenceoftheprevalenceofpart-timecontractsinthepopulation,itisusefultoresorttotheideaofFull-TimeEquivalents(FTE)toassesstheeffectivesizeoftheFEworkforce.ThenumbersinTable 4 belowcanbethoughtofastheproportionofthetotalnumberofstaffwewouldfindintheFEworkforceifeveryonewasworkingfull-time17.
ThetotalnumberofFTEcontractsis47,767,orapproximately60%ofthetotalnumberofcontractsinthe2012-13data.Thisreflectstheconsiderableproportionofpart-timeinFEcontracts,asshowninTable 3.
Table 4. Number of FTE staff by occupational group in FE colleges in England, 2012-13
Occupational group Proportion of FTE staffAdministrative and professional staff 8%Technical staff 7%Wordprocessing,clericalandsecretarialstaff 11%Service staff 15%Teaching staff 44%Assessorsandverifiers 2%Senior managers 1%Other managers 9%Unknown 3%
Source: Frontier analysis of SIR21 data
17 Inordertocomputethis,wecounteachcontractaccordingtotheproportionoffull-timeworkinghoursitspecifies.Afull-timecontractwillcountasone,butacontractthatimpliesworkingonlyhalfofthefull-timehourswillcountas0.5
14
3.1.3 Turnover
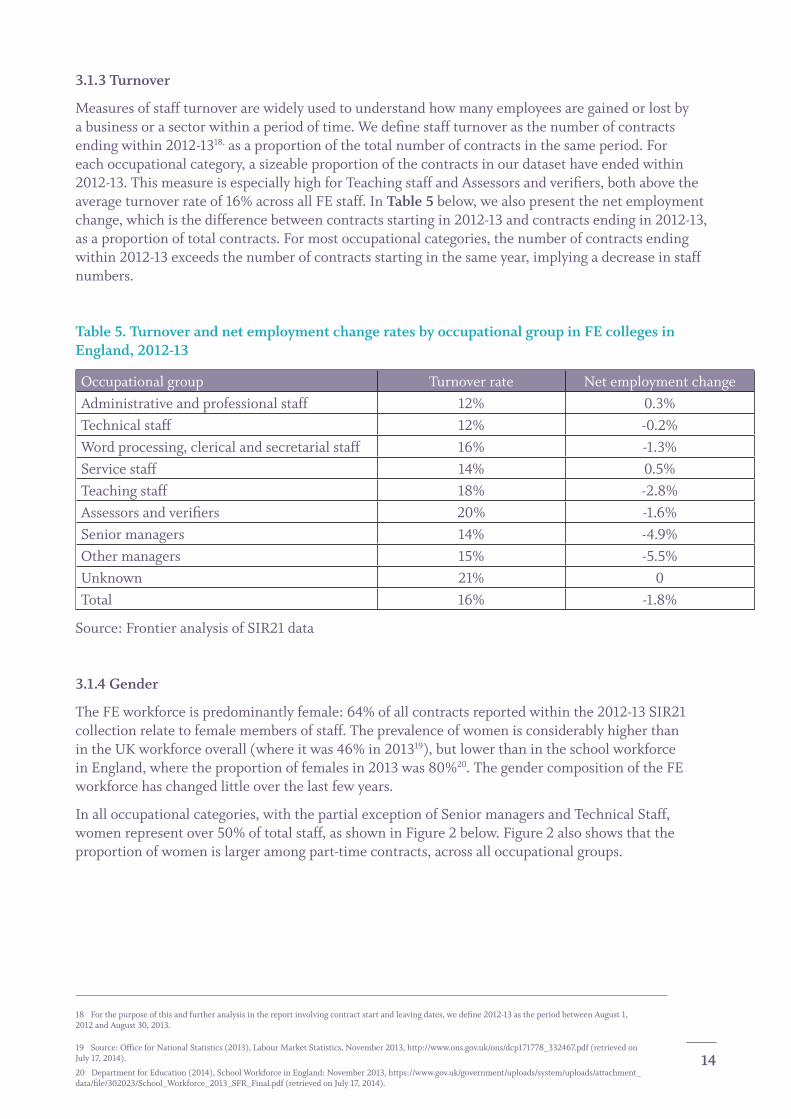
Measuresofstaffturnoverarewidelyusedtounderstandhowmanyemployeesaregainedorlostbyabusinessorasectorwithinaperiodoftime.Wedefinestaffturnoverasthenumberofcontractsending within 2012-1318, as a proportion of the total number of contracts in the same period. For eachoccupationalcategory,asizeableproportionofthecontractsinourdatasethaveendedwithin2012-13.ThismeasureisespeciallyhighforTeachingstaffandAssessorsandverifiers,bothabovetheaverage turnover rate of 16% across all FE staff. In Table 5below,wealsopresentthenetemploymentchange,whichisthedifferencebetweencontractsstartingin2012-13andcontractsendingin2012-13,asaproportionoftotalcontracts.Formostoccupationalcategories,thenumberofcontractsendingwithin2012-13exceedsthenumberofcontractsstartinginthesameyear,implyingadecreaseinstaffnumbers.
Table 5. Turnover and net employment change rates by occupational group in FE colleges in England, 2012-13
Occupational group Turnover rate Net employment changeAdministrative and professional staff 12% 0.3%Technical staff 12% -0.2%Wordprocessing,clericalandsecretarialstaff 16% -1.3%Service staff 14% 0.5%Teaching staff 18% -2.8%Assessorsandverifiers 20% -1.6%Senior managers 14% -4.9%Other managers 15% -5.5%Unknown 21% 0Total 16% -1.8%
Source: Frontier analysis of SIR21 data
3.1.4 Gender
TheFEworkforceispredominantlyfemale:64%ofallcontractsreportedwithinthe2012-13SIR21collection relate to female members of staff. The prevalence of women is considerably higher than intheUKworkforceoverall(whereitwas46%in201319),butlowerthanintheschoolworkforceinEngland,wheretheproportionoffemalesin2013was80%20. The gender composition of the FE workforcehaschangedlittleoverthelastfewyears.
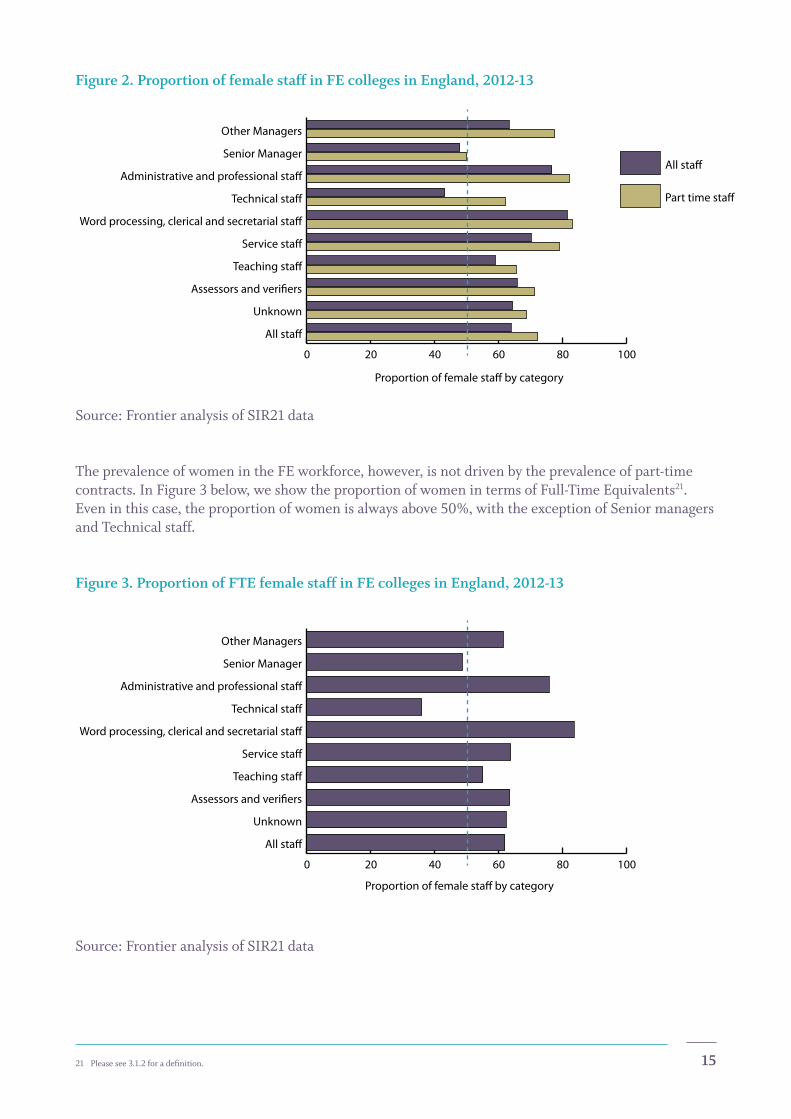
Inalloccupationalcategories,withthepartialexceptionofSeniormanagersandTechnicalStaff,womenrepresentover50%oftotalstaff,asshowninFigure2below.Figure2alsoshowsthattheproportionofwomenislargeramongpart-timecontracts,acrossalloccupationalgroups.
18 Forthepurposeofthisandfurtheranalysisinthereportinvolvingcontractstartandleavingdates,wedefine2012-13astheperiodbetweenAugust1,2012andAugust30,2013.
19 Source:OfficeforNationalStatistics(2013),LabourMarketStatistics,November2013,http://www.ons.gov.uk/ons/dcp171778_332467.pdf (retrieved on July17,2014).
20 DepartmentforEducation(2014),SchoolWorkforceinEngland:November2013,https://www.gov.uk/government/uploads/system/uploads/attachment_data/file/302023/School_Workforce_2013_SFR_Final.pdf(retrievedonJuly17,2014).
15
Figure 2. Proportion of female staff in FE colleges in England, 2012-13
0 20 40 60 80 100
Part time sta�
All sta�
Proportion of female sta� by category
All sta�
Unknown
Assessors and veri�ers
Teaching sta�
Service sta�
Word processing, clerical and secretarial sta�
Technical sta�
Administrative and professional sta�
Senior Manager
Other Managers
Source: Frontier analysis of SIR21 data
TheprevalenceofwomenintheFEworkforce,however,isnotdrivenbytheprevalenceofpart-timecontracts.InFigure3below,weshowtheproportionofwomenintermsofFull-TimeEquivalents21. Eveninthiscase,theproportionofwomenisalwaysabove50%,withtheexceptionofSeniormanagersand Technical staff.
Figure 3. Proportion of FTE female staff in FE colleges in England, 2012-13
0 20 40 60 80 100
Proportion of female sta� by category
All sta�
Unknown
Assessors and veri�ers
Teaching sta�
Service sta�
Word processing, clerical and secretarial sta�
Technical sta�
Administrative and professional sta�
Senior Manager
Other Managers
Source: Frontier analysis of SIR21 data
21 Pleasesee3.1.2foradefinition.
16
3.1.5 Age
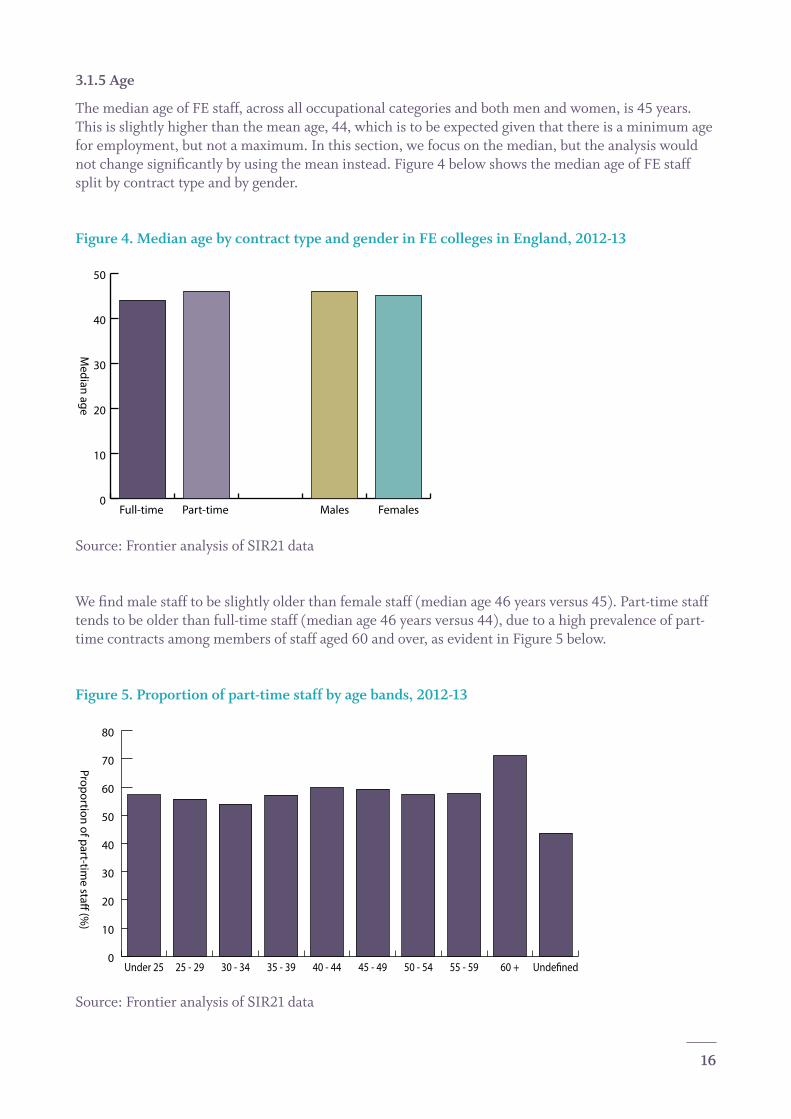
ThemedianageofFEstaff,acrossalloccupationalcategoriesandbothmenandwomen,is45years.Thisisslightlyhigherthanthemeanage,44,whichistobeexpectedgiventhatthereisaminimumageforemployment,butnotamaximum.Inthissection,wefocusonthemedian,buttheanalysiswouldnotchangesignificantlybyusingthemeaninstead.Figure4belowshowsthemedianageofFEstaffsplit by contract type and by gender.
Figure 4. Median age by contract type and gender in FE colleges in England, 2012-13
0
10
20
30
40
50
Median age
FemalesMalesPart-time Full-time
Source: Frontier analysis of SIR21 data
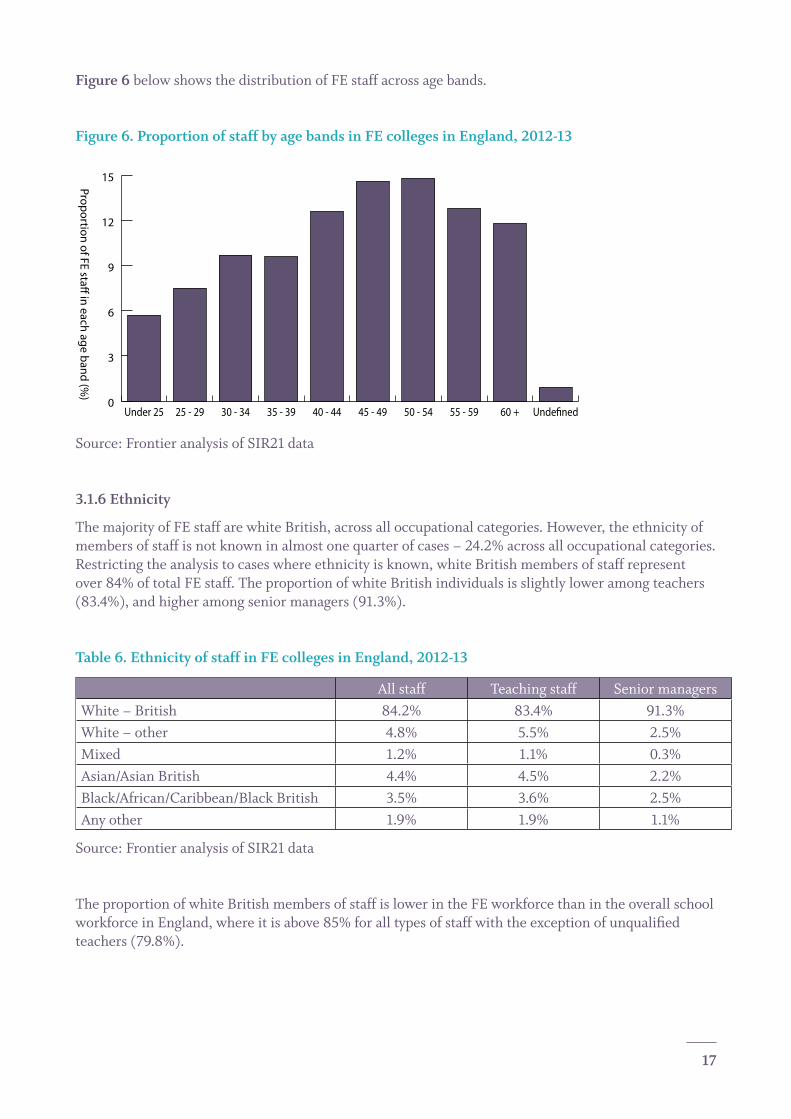
Wefindmalestafftobeslightlyolderthanfemalestaff(medianage46yearsversus45).Part-timestafftendstobeolderthanfull-timestaff(medianage46yearsversus44),duetoahighprevalenceofpart-timecontractsamongmembersofstaffaged60andover,asevidentinFigure5below.
Figure 5. Proportion of part-time staff by age bands, 2012-13
0
10
20
30
40
50
60
70
80
Proportion of part-time sta� (%
)
Unde�ned60 +55 - 5950 - 5445 - 4940 - 4435 - 3930 - 3425 - 29Under 25
Source: Frontier analysis of SIR21 data
17
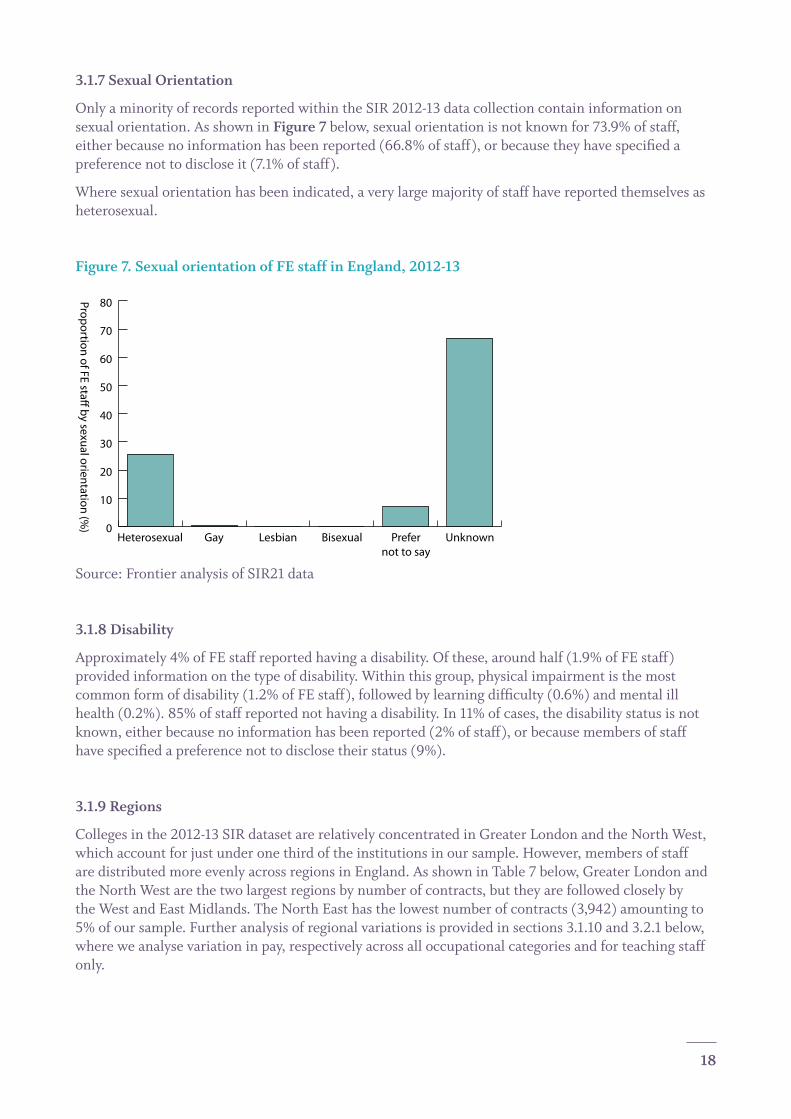
Figure 6 below shows the distribution of FE staff across age bands.
Figure 6. Proportion of staff by age bands in FE colleges in England, 2012-13
0
3
6
9
12
15
Proportion of FE sta� in each age band (%)
Unde�ned60 +55 - 5950 - 5445 - 4940 - 4435 - 3930 - 3425 - 29Under 25
Source: Frontier analysis of SIR21 data
3.1.6 Ethnicity
ThemajorityofFEstaffarewhiteBritish,acrossalloccupationalcategories.However,theethnicityofmembersofstaffisnotknowninalmostonequarterofcases–24.2%acrossalloccupationalcategories.Restrictingtheanalysistocaseswhereethnicityisknown,whiteBritishmembersofstaffrepresentover84%oftotalFEstaff.TheproportionofwhiteBritishindividualsisslightlyloweramongteachers(83.4%),andhigheramongseniormanagers(91.3%).
Table 6. Ethnicity of staff in FE colleges in England, 2012-13
All staff Teaching staff Senior managersWhite–British 84.2% 83.4% 91.3%White – other 4.8% 5.5% 2.5%Mixed 1.2% 1.1% 0.3%Asian/AsianBritish 4.4% 4.5% 2.2%Black/African/Caribbean/BlackBritish 3.5% 3.6% 2.5%Any other 1.9% 1.9% 1.1%
Source: Frontier analysis of SIR21 data
TheproportionofwhiteBritishmembersofstaffislowerintheFEworkforcethanintheoverallschoolworkforceinEngland,whereitisabove85%foralltypesofstaffwiththeexceptionofunqualifiedteachers(79.8%).
18
3.1.7 Sexual Orientation
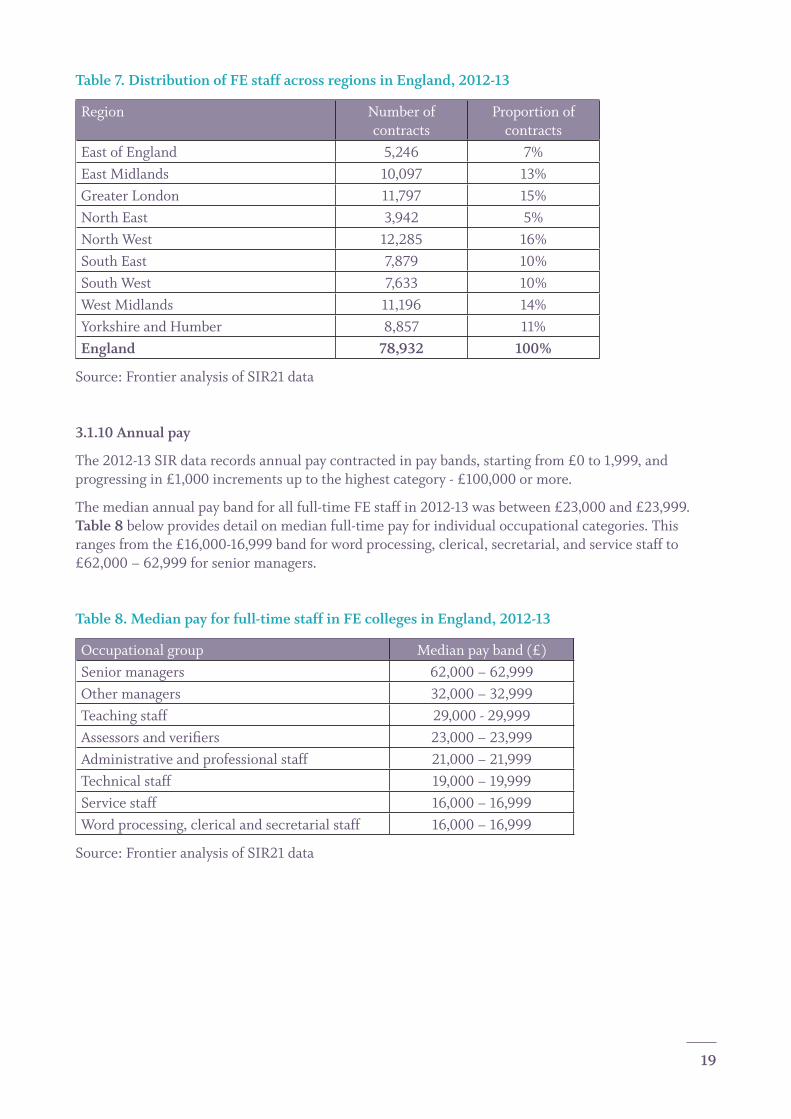
Only a minority of records reported within the SIR 2012-13 data collection contain information on sexual orientation. As shown in Figure 7below,sexualorientationisnotknownfor73.9%ofstaff,eitherbecausenoinformationhasbeenreported(66.8%ofstaff),orbecausetheyhavespecifiedapreferencenottodiscloseit(7.1%ofstaff).
Wheresexualorientationhasbeenindicated,averylargemajorityofstaffhavereportedthemselvesasheterosexual.
Figure 7. Sexual orientation of FE staff in England, 2012-13
0
10
20
30
40
50
60
70
80Proportion of FE sta� by sexual orientation (%)
UnknownPrefernot to say
BisexualLesbianGayHeterosexual
Source: Frontier analysis of SIR21 data
3.1.8 Disability
Approximately4%ofFEstaffreportedhavingadisability.Ofthese,aroundhalf(1.9%ofFEstaff)providedinformationonthetypeofdisability.Withinthisgroup,physicalimpairmentisthemostcommonformofdisability(1.2%ofFEstaff),followedbylearningdifficulty(0.6%)andmentalillhealth(0.2%).85%ofstaffreportednothavingadisability.In11%ofcases,thedisabilitystatusisnotknown,eitherbecausenoinformationhasbeenreported(2%ofstaff),orbecausemembersofstaffhavespecifiedapreferencenottodisclosetheirstatus(9%).
3.1.9 Regions
Collegesinthe2012-13SIRdatasetarerelativelyconcentratedinGreaterLondonandtheNorthWest,whichaccountforjustunderonethirdoftheinstitutionsinoursample.However,membersofstaffaredistributedmoreevenlyacrossregionsinEngland.AsshowninTable7below,GreaterLondonandtheNorthWestarethetwolargestregionsbynumberofcontracts,buttheyarefollowedcloselybytheWestandEastMidlands.TheNorthEasthasthelowestnumberofcontracts(3,942)amountingto5%ofoursample.Furtheranalysisofregionalvariationsisprovidedinsections3.1.10and3.2.1below,whereweanalysevariationinpay,respectivelyacrossalloccupationalcategoriesandforteachingstaffonly.
19
Table 7. Distribution of FE staff across regions in England, 2012-13
Region Number of contracts
Proportion of contracts
East of England 5,246 7%EastMidlands 10,097 13%GreaterLondon 11,797 15%North East 3,942 5%North West 12,285 16%South East 7,879 10%South West 7,633 10%WestMidlands 11,196 14%YorkshireandHumber 8,857 11%England 78,932 100%
Source: Frontier analysis of SIR21 data
3.1.10 Annual pay
The2012-13SIRdatarecordsannualpaycontractedinpaybands,startingfrom£0to1,999,andprogressingin£1,000incrementsuptothehighestcategory-£100,000ormore.
Themedianannualpaybandforallfull-timeFEstaffin2012-13wasbetween£23,000and£23,999.Table 8 below provides detail on median full-time pay for individual occupational categories. This rangesfromthe£16,000-16,999bandforwordprocessing,clerical,secretarial,andservicestaffto£62,000–62,999forseniormanagers.
Table 8. Median pay for full-time staff in FE colleges in England, 2012-13
Occupational group Medianpayband(£)Senior managers 62,000–62,999Other managers 32,000–32,999Teaching staff 29,000-29,999Assessorsandverifiers 23,000–23,999Administrative and professional staff 21,000–21,999Technical staff 19,000–19,999Service staff 16,000–16,999Wordprocessing,clericalandsecretarialstaff 16,000–16,999
Source: Frontier analysis of SIR21 data
20
Figure 8. Median pay bands for full-time staff by region, 2012-13
North West:£24,000 - 24,999
West Midlands:£23,000 - 23,999
South West:£22,000 - 22,999
North East:£20,000 - 20,999
Yorkshire and the Humber:£22,000 - 22,999
East Midlands:£23,000 - 23,999
East of England:£25,000 – 25,999
South East:£20,000 - 20,999
Greater London:£29,000 - 29,999
North West:£24,000 - 24,999
Source:FrontieranalysisofSIR21data
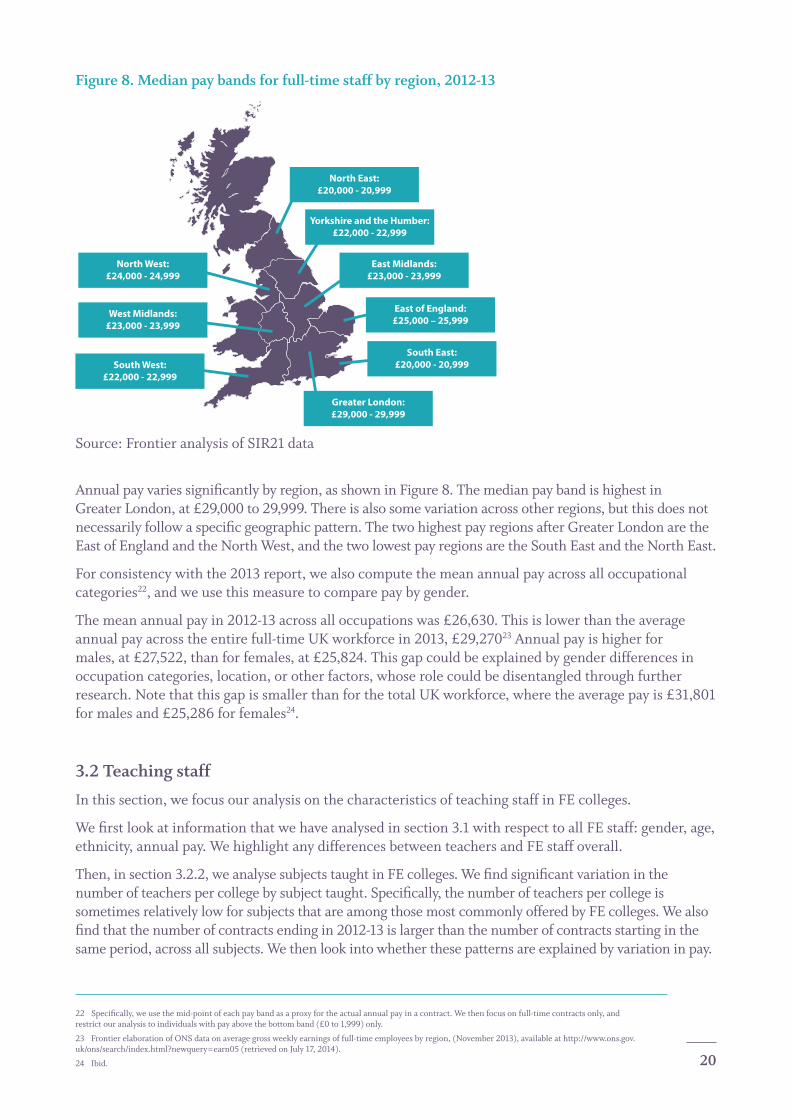
Annualpayvariessignificantlybyregion,asshowninFigure8.ThemedianpaybandishighestinGreater London, at £29,000 to 29,999. There is also some variation across other regions, but this does not necessarilyfollowaspecificgeographicpattern.ThetwohighestpayregionsafterGreaterLondonaretheEast of England and the North West, and the two lowest pay regions are the South East and the North East.
For consistency with the 2013 report, we also compute the mean annual pay across all occupational categories22, and we use this measure to compare pay by gender.
The mean annual pay in 2012-13 across all occupations was £26,630. This is lower than the average annual pay across the entire full-time UK workforce in 2013, £29,27023 Annual pay is higher for males,at£27,522,thanforfemales,at£25,824.Thisgapcouldbeexplainedbygenderdifferencesinoccupation categories, location, or other factors, whose role could be disentangled through further research.NotethatthisgapissmallerthanforthetotalUKworkforce,wheretheaveragepayis£31,801formalesand£25,286forfemales24.
3.2 Teaching staff
In this section, we focus our analysis on the characteristics of teaching staff in FE colleges.
Wefirstlookatinformationthatwehaveanalysedinsection3.1withrespecttoallFEstaff:gender,age,ethnicity, annual pay. We highlight any differences between teachers and FE staff overall.
Then,insection3.2.2,weanalysesubjectstaughtinFEcolleges.Wefindsignificantvariationinthenumberofteacherspercollegebysubjecttaught.Specifically,thenumberofteacherspercollegeissometimes relatively low for subjects that are among those most commonly offered by FE colleges. We also findthatthenumberofcontractsendingin2012-13islargerthanthenumberofcontractsstartinginthesame period, across all subjects. We then look into whether these patterns are explained by variation in pay.
22 Specifically,weusethemid-pointofeachpaybandasaproxyfortheactualannualpayinacontract.Wethenfocusonfull-timecontractsonly,andrestrict our analysis to individuals with pay above the bottom band (£0 to 1,999) only.
23 Frontier elaboration of ONS data on average gross weekly earnings of full-time employees by region, (November 2013), available at http://www.ons.gov.uk/ons/search/index.html?newquery=earn05(retrievedonJuly17,2014).
24 Ibid.
21
3.2.1 Overview of characteristics in comparison to all FE staff
PersonalcharacteristicsofteachersareconsistentwiththebroaderprofileofFEstaff,intermsofgender,age,andethnicity.However,wedofindsmalldifferencesbetweenteachersandFEstaffoverall:
• LikethetotalFEstaff,teachersinFEcollegesinEnglandarepredominantlyfemale,butthereisalower proportion of women among teaching staff (58.9% compared to 63.8% across all staff). This is consistentwiththeoverallschoolworkforce,wheretheproportionoffemalesis74%amongteachersand80%amongtheentireworkforce25.
• Teachers are somewhat younger than the total FE staff (median age 44 years compared to 45).
Themedianannualpaybandforfull-timeteachersis£29,000to£29,999,comparedto£23,000to£23,999forallfull-timeFEstaff.Averagepayacrossteachingstaffis£29,696.Thisislowerthantheaveragesalaryforafull-timequalifiedteacheracrossEnglishschools,£38,10026.
Consistentwiththeoverallpictureprovidedinsection3.1.10,thereisasignificantamountofvariationinpayacrossregions.AsforallFEstaff,averagepayishighestinGreaterLondon,at£35,000to35,999,andlowestintheSouthEast(£19,000to19,999)andtheNorthEast(£23,000to23,999).Furtherdetail is provided in Annexe 1.
StaffturnoveramongteachersisrelativelyhighcomparedtotheentireFEworkforce.Approximately18%oftheteachingstaffcontractsinourdatasetendedin2012-13,comparedtoanaverageacrossallstaff of 16%.
3.2.2 Subjects taught
Some subjects are offered by the majority of FE colleges in England while others are less common. The mostcommoncourses/subjectareas(providedbymorethan90%ofcolleges)are:
• English,Languages,andCommunication;• BusinessAdministration,ManagementandProfessional;• ScienceandMathematics;• VisualandPerformingArtsandMedia;• Hospitality,Sports,LeisureandTravel;• Health,SocialCareandPublicServices,and• ICT.
Other course types which are less common include:
• FoundationProgrammes;• Engineering,TechnologyandManufacturing;• Humanities;• Construction;• HairdressingandBeautyTherapy;• Retailing,CustomerServiceandTransportation,and• LandBasedProvision.
25 DepartmentforEducation(2014),SchoolWorkforceinEngland:November2013,https://www.gov.uk/government/uploads/system/uploads/attachment_data/file/302023/School_Workforce_2013_SFR_Final.pdf(retrievedonJuly17,2014).
26 DepartmentforEducation(2014),SchoolWorkforceinEngland:November2013,https://www.gov.uk/government/uploads/system/uploads/attachment_data/file/302023/School_Workforce_2013_SFR_Final.pdf(retrievedonJuly17,2014).
22
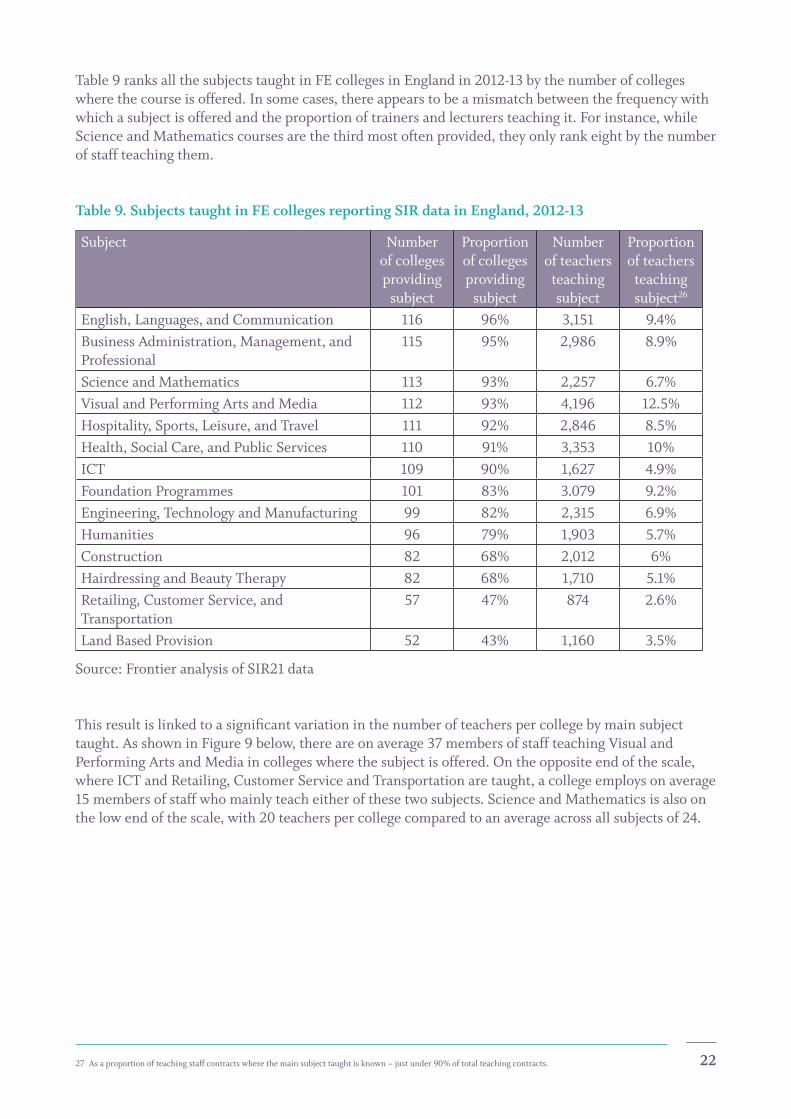
Table9ranksallthesubjectstaughtinFEcollegesinEnglandin2012-13bythenumberofcollegeswherethecourseisoffered.Insomecases,thereappearstobeamismatchbetweenthefrequencywithwhichasubjectisofferedandtheproportionoftrainersandlecturersteachingit.Forinstance,whileScienceandMathematicscoursesarethethirdmostoftenprovided,theyonlyrankeightbythenumberof staff teaching them.
Table 9. Subjects taught in FE colleges reporting SIR data in England, 2012-1327
Subject Number of colleges providing
subject
Proportion of colleges providing
subject
Number of teachers
teaching subject
Proportion of teachers
teaching subject26
English,Languages,andCommunication 116 96% 3,151 9.4%BusinessAdministration,Management,andProfessional
115 95% 2,986 8.9%
ScienceandMathematics 113 93% 2,257 6.7%VisualandPerformingArtsandMedia 112 93% 4,196 12.5%Hospitality,Sports,Leisure,andTravel 111 92% 2,846 8.5%Health,SocialCare,andPublicServices 110 91% 3,353 10%ICT 109 90% 1,627 4.9%Foundation Programmes 101 83% 3.079 9.2%Engineering,TechnologyandManufacturing 99 82% 2,315 6.9%Humanities 96 79% 1,903 5.7%Construction 82 68% 2,012 6%HairdressingandBeautyTherapy 82 68% 1,710 5.1%Retailing,CustomerService,andTransportation
57 47% 874 2.6%
LandBasedProvision 52 43% 1,160 3.5%
Source: Frontier analysis of SIR21 data
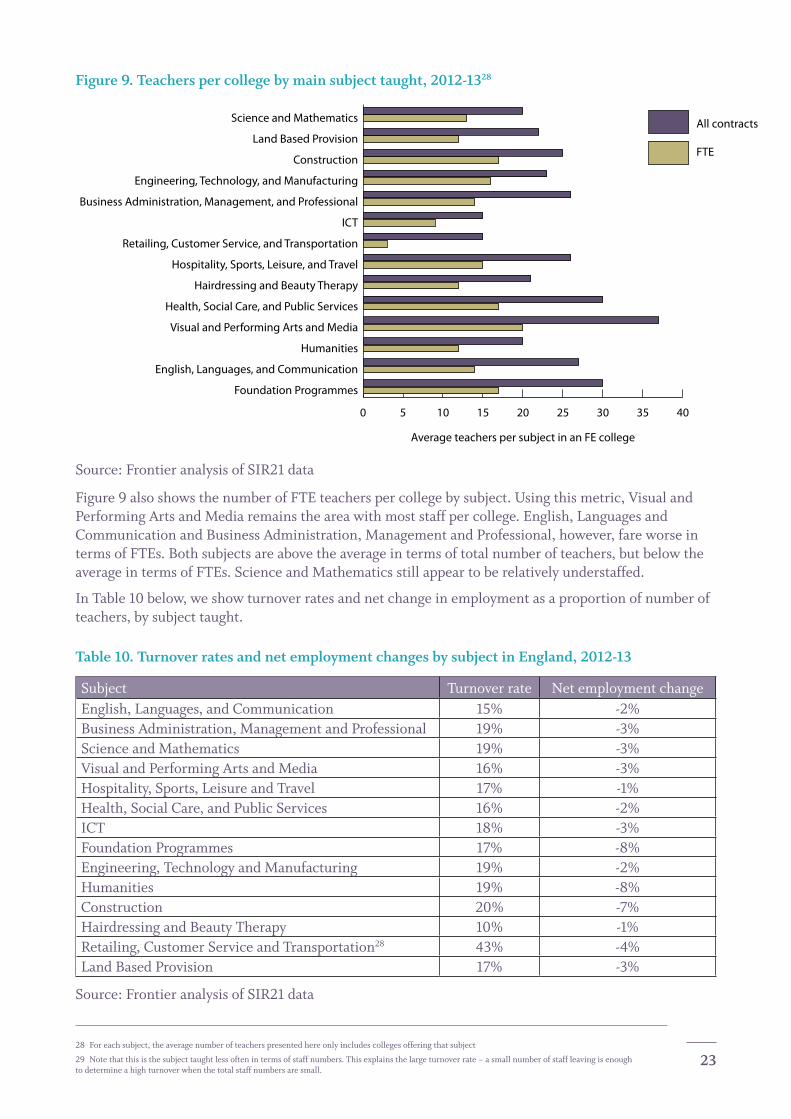
Thisresultislinkedtoasignificantvariationinthenumberofteacherspercollegebymainsubjecttaught.AsshowninFigure9below,thereareonaverage37membersofstaffteachingVisualandPerformingArtsandMediaincollegeswherethesubjectisoffered.Ontheoppositeendofthescale,whereICTandRetailing,CustomerServiceandTransportationaretaught,acollegeemploysonaverage15membersofstaffwhomainlyteacheitherofthesetwosubjects.ScienceandMathematicsisalsoonthelowendofthescale,with20teacherspercollegecomparedtoanaverageacrossallsubjectsof24.
27 Asaproportionofteachingstaffcontractswherethemainsubjecttaughtisknown–justunder90%oftotalteachingcontracts.
23
Figure 9. Teachers per college by main subject taught, 2012-1328
0 5 10 15 20
Average teachers per subject in an FE college
25 30 35 40
FTE
All contracts
Foundation Programmes
English, Languages, and Communication
Humanities
Visual and Performing Arts and Media
Health, Social Care, and Public Services
Hairdressing and Beauty Therapy
Hospitality, Sports, Leisure, and Travel
Retailing, Customer Service, and Transportation
ICT
Business Administration, Management, and Professional
Engineering, Technology, and Manufacturing
Construction
Land Based Provision
Science and Mathematics
Source: Frontier analysis of SIR21 data
Figure9alsoshowsthenumberofFTEteacherspercollegebysubject.Usingthismetric,VisualandPerformingArtsandMediaremainstheareawithmoststaffpercollege.English,LanguagesandCommunicationandBusinessAdministration,ManagementandProfessional,however,fareworseintermsofFTEs.Bothsubjectsareabovetheaverageintermsoftotalnumberofteachers,butbelowtheaverageintermsofFTEs.ScienceandMathematicsstillappeartoberelativelyunderstaffed.
InTable10below,weshowturnoverratesandnetchangeinemploymentasaproportionofnumberofteachers,bysubjecttaught.
Table 10. Turnover rates and net employment changes by subject in England, 2012-13
Subject Turnover rate Net employment changeEnglish,Languages,andCommunication 15% -2%BusinessAdministration,ManagementandProfessional 19% -3%ScienceandMathematics 19% -3%VisualandPerformingArtsandMedia 16% -3%Hospitality,Sports,LeisureandTravel 17% -1%Health,SocialCare,andPublicServices 16% -2%ICT 18% -3%Foundation Programmes 17% -8%Engineering,TechnologyandManufacturing 19% -2%Humanities 19% -8%Construction 20% -7%HairdressingandBeautyTherapy 10% -1%Retailing,CustomerServiceandTransportation28 43% -4%LandBasedProvision 17% -3%
Source: Frontier analysis of SIR21 data29
28 Foreachsubject,theaveragenumberofteacherspresentedhereonlyincludescollegesofferingthatsubject
29 Note that this is the subject taught less often in terms of staff numbers. This explains the large turnover rate – a small number of staff leaving is enough to determine a high turnover when the total staff numbers are small.
24
Asdiscussedinsection3.1.3,turnoverratestendtobehigherthantheaverageacrossallFEstaff.Thenetemploymentchangeisnegativeforallsubjects,althoughthesizeoftheeffectisgenerallylessthan5%ofthetotalnumberofstaffteachingthesubject.Humanities,Construction,andFoundationProgrammes have especially large net changes.
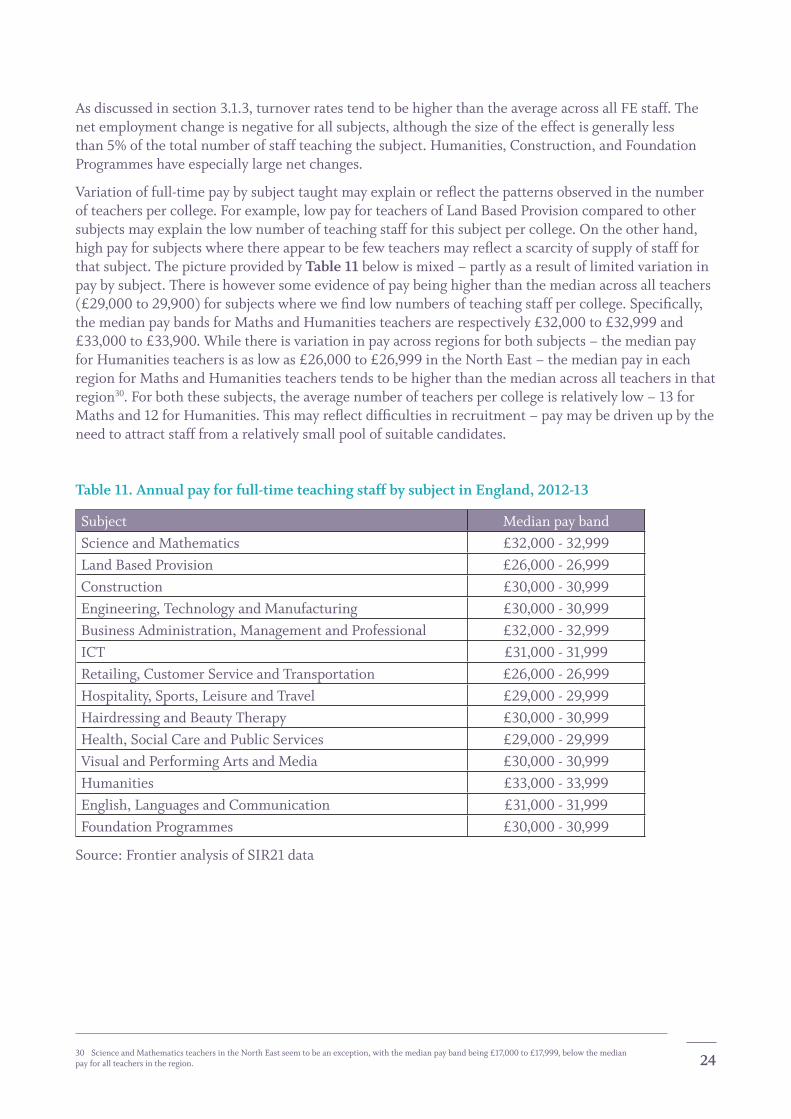
Variationoffull-timepaybysubjecttaughtmayexplainorreflectthepatternsobservedinthenumberofteacherspercollege.Forexample,lowpayforteachersofLandBasedProvisioncomparedtoothersubjectsmayexplainthelownumberofteachingstaffforthissubjectpercollege.Ontheotherhand,highpayforsubjectswherethereappeartobefewteachersmayreflectascarcityofsupplyofstaffforthat subject. The picture provided by Table 11 below is mixed – partly as a result of limited variation in pay by subject. There is however some evidence of pay being higher than the median across all teachers (£29,000to29,900)forsubjectswherewefindlownumbersofteachingstaffpercollege.Specifically,themedianpaybandsforMathsandHumanitiesteachersarerespectively£32,000to£32,999and£33,000to£33,900.Whilethereisvariationinpayacrossregionsforbothsubjects–themedianpayforHumanitiesteachersisaslowas£26,000to£26,999intheNorthEast–themedianpayineachregionforMathsandHumanitiesteacherstendstobehigherthanthemedianacrossallteachersinthatregion30.Forboththesesubjects,theaveragenumberofteacherspercollegeisrelativelylow–13forMathsand12forHumanities.Thismayreflectdifficultiesinrecruitment–paymaybedrivenupbytheneed to attract staff from a relatively small pool of suitable candidates.
Table 11. Annual pay for full-time teaching staff by subject in England, 2012-13
Subject MedianpaybandScienceandMathematics £32,000-32,999LandBasedProvision £26,000-26,999Construction £30,000-30,999Engineering,TechnologyandManufacturing £30,000-30,999BusinessAdministration,ManagementandProfessional £32,000-32,999ICT £31,000-31,999Retailing,CustomerServiceandTransportation £26,000-26,999Hospitality,Sports,LeisureandTravel £29,000-29,999HairdressingandBeautyTherapy £30,000-30,999Health,SocialCareandPublicServices £29,000-29,999VisualandPerformingArtsandMedia £30,000-30,999Humanities £33,000-33,999English,LanguagesandCommunication £31,000-31,999Foundation Programmes £30,000-30,999
Source: Frontier analysis of SIR21 data
30 ScienceandMathematicsteachersintheNorthEastseemtobeanexception,withthemedianpaybandbeing£17,000to£17,999,belowthemedianpay for all teachers in the region.
25
4 Trends in the Further Education collegeworkforce
ThissectioninvestigateshowthecharacteristicsoftheFEworkforcehavechangedovertimebycomparingthefindingsfromtheanalysisof2012-13datawiththosefrompreviousyears.Anykeychanges are highlighted.
We also compare recent recruitment of teaching staff by FE colleges with past recruitment patterns. This is based on comparing the characteristics of staff with recent contract start dates to the characteristics of staff with earlier contract start dates.
4.1 All FE staff
• The gender composition of FE staff overall has remained constant with respect to 2011-12. The proportionoffemalesin2012-13is63.8%,comparedto63.5%in2011-12.Wealsofindthatpatternsin the gender split of staff for different terms of employment and for different occupational categories are consistent with 2011-12:
• Theproportionofwomenremainshigheramongpart-timecontracts.Here,wealsofindasmallincrease:72.2%in2012-13comparedto71.2%in2011-12.
• Variation in gender composition by occupational category remains consistent with previous years. Theproportionofwomenremainsespeciallyhighamongadministrativeandprofessionalstaff,Wordprocessing,clerical,secretarialstaff,andservicestaff,andespeciallylowamongtechnicalstaff.
• WefindnosignificantdifferencesintheagecompositionofFEstaffbetween2011-12and2012-13.AsshowninAnnexe1,thereislittledifferenceintheproportionsofstaffineachagebandbetweenthetwo years.
• Thecoverageofinformationonethnicityhasdecreasedsubstantiallyovertime.Inthepreviousreport,usingdatafrom2008/9upto2011-12,informationonethnicitywasavailablefor94.4%ofcontracts.Usingonlythe2012-13data,thisproportiongoesdownto75.8%.Basedontheinformationavailable,theethniccompositionofFEstaffin2012-13appearstobeconsistentwith2011-12.However,giventhelargedifferenceindatacoverage,comparisonsbetweenthetwoyearsshouldbeconsideredtentative.
• Theproportionofpart-timecontractsisconsistentwith2011-12:58%in2012-13comparedto57%inthe previous year.
• The distribution of FE staff across occupational categories has remained constant for most occupationalcategories,withtheexceptionofteachingstaff,downto48%ofallcontractscomparedto 49% in 2011-1231.
• Annualpayforfull-timestaffhasremainedconstantinnominalterms.Wefindaverysmallincreaseinnominalpayacrossallstaff(0.1%).Thisamountstoafallinrealterms,givenconsumerpriceinflationintheUKof2.7%inSeptember2013comparedtoSeptember2012.
• Breakdownbyoccupationalcategories:nominalpayhasincreasedcomparedto2011-12forServicestaff,OthermanagersandTechnicalstaffbuthasdecreasedforSeniormanagers,Wordprocessingstaff,andAdministrativeandprofessionalstaff.Nominalpayhasremainedessentiallyconstant(annualvariationunder0.5%)forTeachingstaffandAssessorsandverifiers.
• Breakdownbygender:agapremainsbetweenfemaleandmalemembersofstaff,butsmallerthanin2011-12.Theratiobetweenfemaleandmaleannualpaymaintainsa(slowly)increasingtrend,going from 93.4% in 2011-12 to 93.8% in 2012-13.
31 Notethatthenumberofcontractswheretheoccupationisunknownhasincreasedfrom2.1%to2.7%.
26
4.2 Trends in the characteristics of teaching staff
Inordertoassesswhetherthecharacteristicsofteachingstaffhavechangedovertime,weruntwosetsof comparisons:
• First,wecomparethefeaturesoutlinedinsections3.2.1and3.2.2abovetothecharacteristicsofteaching staff in 2011-12 as described in the SIR 20 Report32.
• Second,wecomparestaffhavingacontractstartingwithin2012-13withstaffhavingearliercontract dates. This allows us to investigate whether staff joining FE colleges recently have different characteristics compared to staff who joined earlier.
TeachingstaffasaproportionoftotalFEstaffhasdecreasedcomparedto2011-12–47.9%comparedto49.1%.Wefindachangeintheageprofileofteachingstaff,butlittlevariationinothercharacteristicscomparedtothepreviousreport.Specifically:
• The gender split of teaching staff between contract types is consistent with 2011-12: the proportion offemalesis65.3%amongpart-timecontracts(66.2%in2011-12),and48%amongfull-timecontracts (stable compared to 2011-12).
• Average33agehasdecreasedfrom46to45yearsbetween2011-12and2012-13.Thismaybelinkedto the number of contracts ending in 2012-13 being larger than the number of contracts starting in 2012-13,ashighlightedinsection3.1.3above.
• Ethnicity:asin2011-12,theproportionofWhiteBritishstaffisloweramongteachersthanamongFEstaffoverall.However,thedifferencebetweenthetwogroupsissmallerin2012-13.Againnotethat there is a considerable difference between the two years in terms of availability of information on ethnicity.
• Payisstablecomparedto2011-12at£29,600perannumforfull-timeteachers(£29,696in2011-12,£29,647in2012-13).
• Asin2011-12,teachersareworkingpart-timemoreoftenthantheaveragememberofFEstaff.
Staffjoiningin2012-13tendtobeolder,andmoreoftenmale,thanstaffjoiningearlier:
• The average age of teachers at contract start date is higher among those joining in 2012-1334 (42 years) than among those joining earlier (39 years).
• 57%ofteachersjoiningin2012-13werefemale,comparedto59%inearlieryears.
32Notethattheanalysisinthe2013Reportwasbasedondatafrom2011-12andthetwopreviousyears.Hereweonlyusedthemostrecentinformationavailable – data reported in 2012-13.
33 Meanaverage
34 Asinsection3.1.3,whencomparingstaffwithdifferentcontractstartdateswedefine2012-13astheperiodbetweenAugust1,2012andAugust30,2013
27
5Inferencesonthetotalworkforcepopulation
Insections3and4,weanalysedthecharacteristicsoftheFEworkforceandhowthesehavechangedover time based on those FE colleges which have provided up to date information as part of the SIR data collection.Aspreviouslydiscussed,approximatelyonethirdoftheFEsectorsuppliedcurrentdatafor2012-13.
Inthissection,weconsiderwhetheritispossibletoestimatethetotalsizeoftheFEworkforce,basedon the sample of 123 colleges providing current data. Constructing population estimates based on a sampleisclearlyachallengingtask.Inordertoproducerobustestimatesoneneedstobesatisfiedthatthe sample used is representative of the population. If the colleges in our sample are systematically different from colleges outside the sample this would lead to us over-estimating or under-estimating the sizeoftheworkforce.
Weuseinformationonthelocation,expenditureandstudentnumbersofallFEcollegesinEnglandinorder to compare the colleges in our sample to colleges which have not reported SIR data in 2012-13.
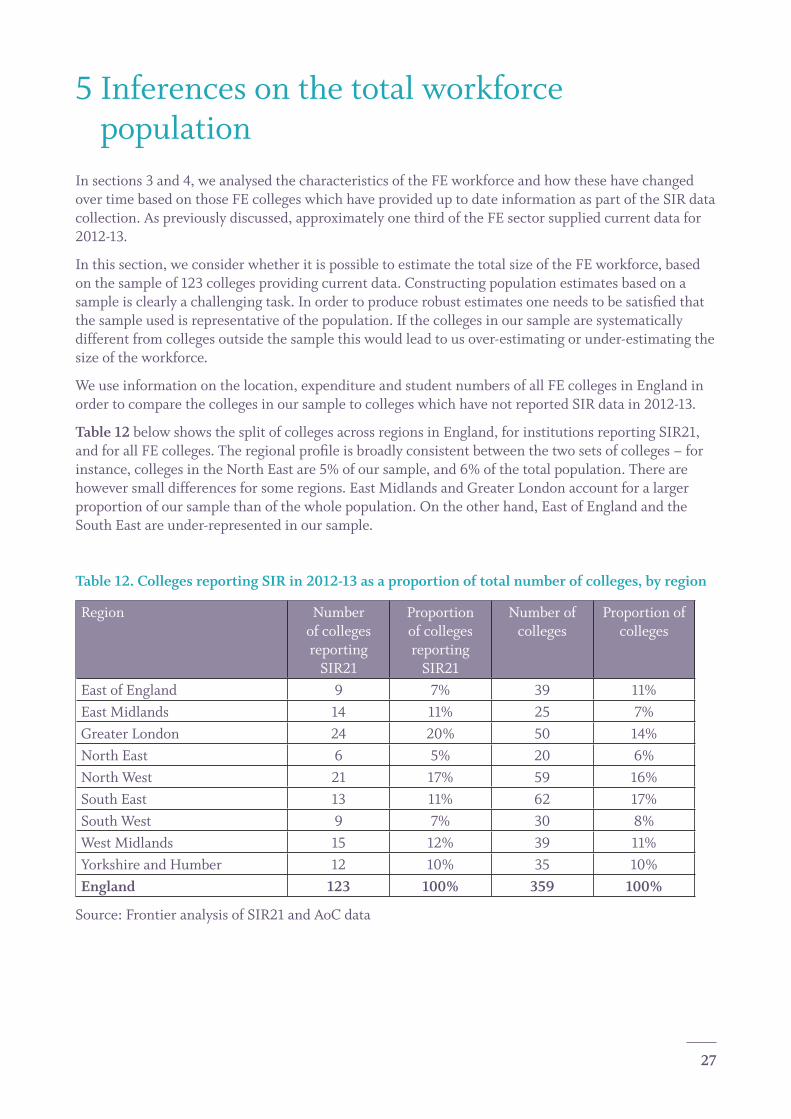
Table 12belowshowsthesplitofcollegesacrossregionsinEngland,forinstitutionsreportingSIR21,andforallFEcolleges.Theregionalprofileisbroadlyconsistentbetweenthetwosetsofcolleges–forinstance,collegesintheNorthEastare5%ofoursample,and6%ofthetotalpopulation.Therearehoweversmalldifferencesforsomeregions.EastMidlandsandGreaterLondonaccountforalargerproportionofoursamplethanofthewholepopulation.Ontheotherhand,EastofEnglandandtheSouth East are under-represented in our sample.
Table 12. Colleges reporting SIR in 2012-13 as a proportion of total number of colleges, by region
Region Number of colleges reporting
SIR21
Proportion of colleges reporting
SIR21
Number of colleges
Proportion of colleges
East of England 9 7% 39 11%EastMidlands 14 11% 25 7%GreaterLondon 24 20% 50 14%North East 6 5% 20 6%North West 21 17% 59 16%South East 13 11% 62 17%South West 9 7% 30 8%WestMidlands 15 12% 39 11%YorkshireandHumber 12 10% 35 10%England 123 100% 359 100%
Source: Frontier analysis of SIR21 and AoC data
28
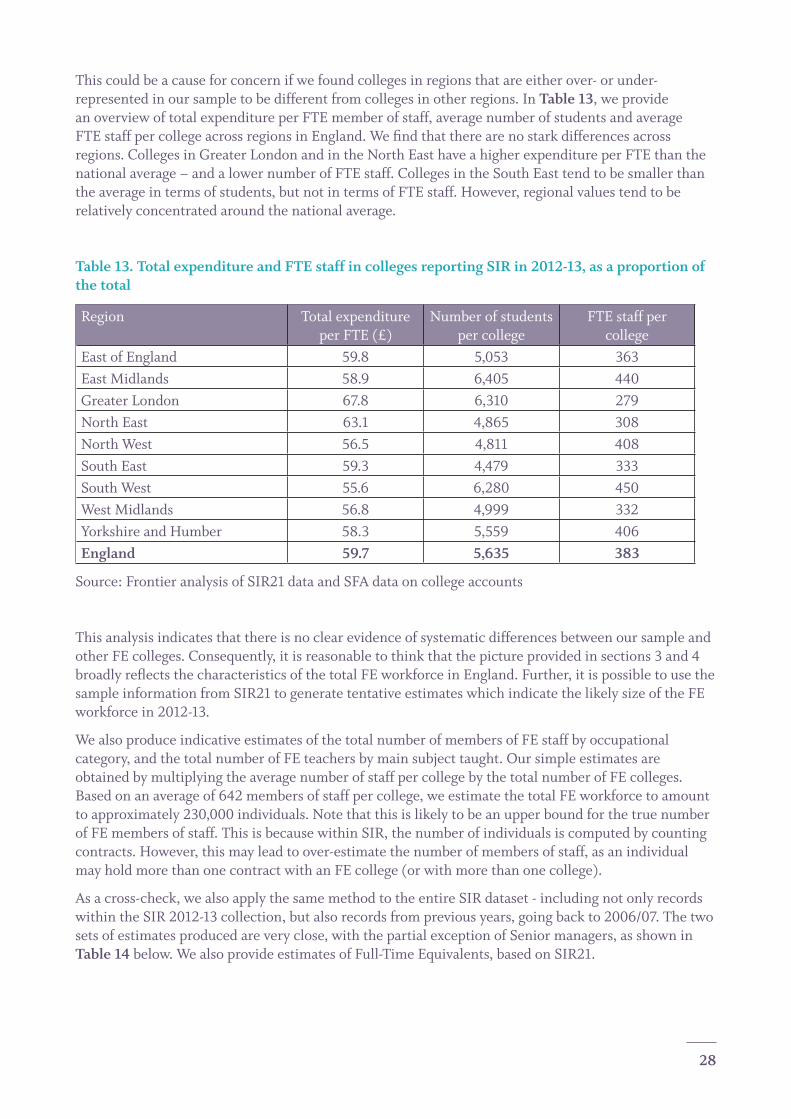
This could be a cause for concern if we found colleges in regions that are either over- or under-represented in our sample to be different from colleges in other regions. In Table 13,weprovideanoverviewoftotalexpenditureperFTEmemberofstaff,averagenumberofstudentsandaverageFTEstaffpercollegeacrossregionsinEngland.Wefindthattherearenostarkdifferencesacrossregions.CollegesinGreaterLondonandintheNorthEasthaveahigherexpenditureperFTEthanthenational average – and a lower number of FTE staff. Colleges in the South East tend to be smaller than theaverageintermsofstudents,butnotintermsofFTEstaff.However,regionalvaluestendtoberelatively concentrated around the national average.
Table 13. Total expenditure and FTE staff in colleges reporting SIR in 2012-13, as a proportion of the total
Region Total expenditure per FTE (£)
Number of students per college
FTE staff per college
East of England 59.8 5,053 363EastMidlands 58.9 6,405 440GreaterLondon 67.8 6,310 279North East 63.1 4,865 308North West 56.5 4,811 408South East 59.3 4,479 333South West 55.6 6,280 450WestMidlands 56.8 4,999 332YorkshireandHumber 58.3 5,559 406England 59.7 5,635 383
Source: Frontier analysis of SIR21 data and SFA data on college accounts
This analysis indicates that there is no clear evidence of systematic differences between our sample and otherFEcolleges.Consequently,itisreasonabletothinkthatthepictureprovidedinsections3and4broadlyreflectsthecharacteristicsofthetotalFEworkforceinEngland.Further,itispossibletousethesampleinformationfromSIR21togeneratetentativeestimateswhichindicatethelikelysizeoftheFEworkforcein2012-13.
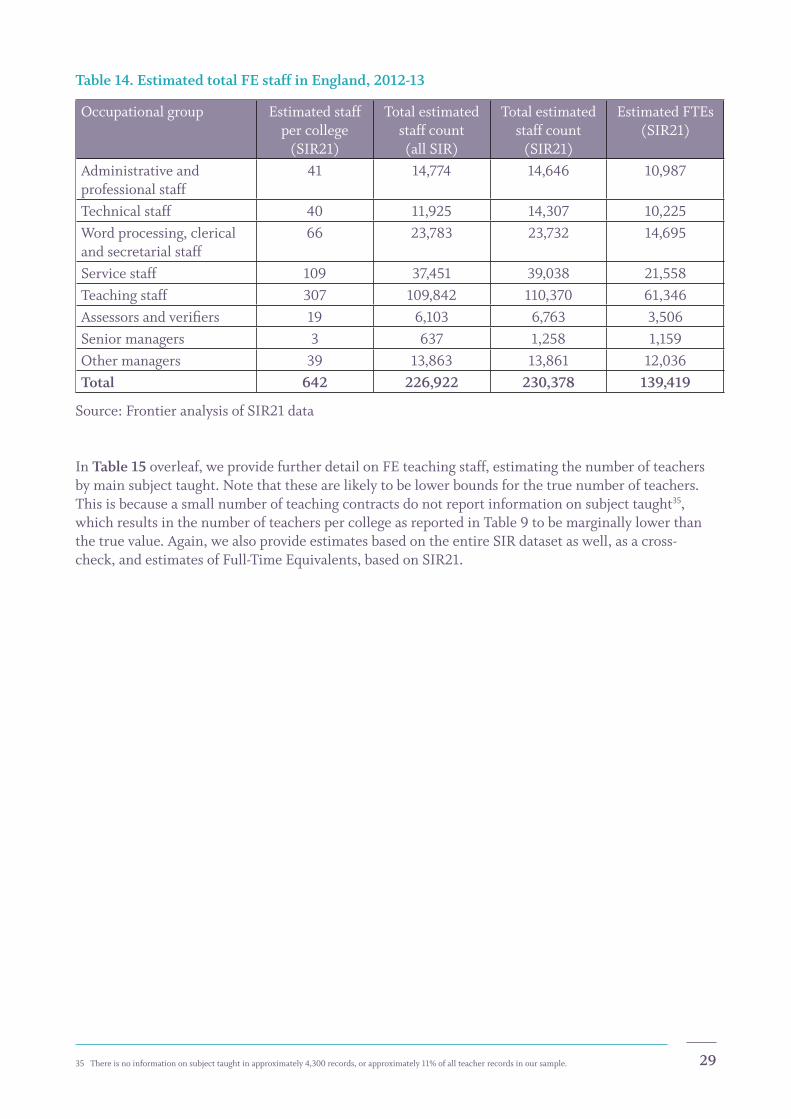
We also produce indicative estimates of the total number of members of FE staff by occupational category,andthetotalnumberofFEteachersbymainsubjecttaught.Oursimpleestimatesareobtained by multiplying the average number of staff per college by the total number of FE colleges. Basedonanaverageof642membersofstaffpercollege,weestimatethetotalFEworkforcetoamounttoapproximately230,000individuals.NotethatthisislikelytobeanupperboundforthetruenumberofFEmembersofstaff.ThisisbecausewithinSIR,thenumberofindividualsiscomputedbycountingcontracts.However,thismayleadtoover-estimatethenumberofmembersofstaff,asanindividualmay hold more than one contract with an FE college (or with more than one college).
Asacross-check,wealsoapplythesamemethodtotheentireSIRdataset-includingnotonlyrecordswithintheSIR2012-13collection,butalsorecordsfrompreviousyears,goingbackto2006/07.Thetwosetsofestimatesproducedareveryclose,withthepartialexceptionofSeniormanagers,asshowninTable 14 below.WealsoprovideestimatesofFull-TimeEquivalents,basedonSIR21.
29
Table 14. Estimated total FE staff in England, 2012-13
Occupational group Estimated staff per college
(SIR21)
Total estimated staff count (all SIR)
Total estimated staff count
(SIR21)
Estimated FTEs (SIR21)
Administrative and professional staff
41 14,774 14,646 10,987
Technical staff 40 11,925 14,307 10,225Wordprocessing,clericaland secretarial staff
66 23,783 23,732 14,695
Service staff 109 37,451 39,038 21,558Teaching staff 307 109,842 110,370 61,346Assessorsandverifiers 19 6,103 6,763 3,506Senior managers 3 637 1,258 1,159Other managers 39 13,863 13,861 12,036Total 642 226,922 230,378 139,419
Source: Frontier analysis of SIR21 data
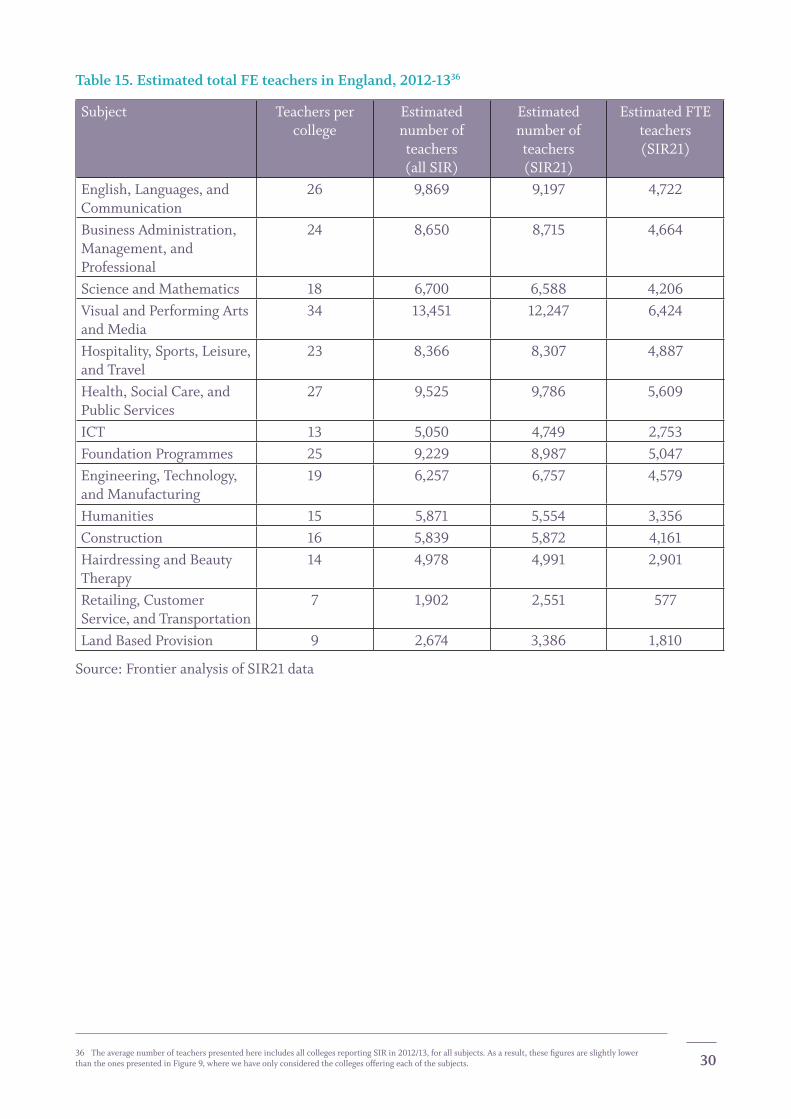
In Table 15overleaf,weprovidefurtherdetailonFEteachingstaff,estimatingthenumberofteachersbymainsubjecttaught.Notethatthesearelikelytobelowerboundsforthetruenumberofteachers.This is because a small number of teaching contracts do not report information on subject taught35,which results in the number of teachers per college as reported in Table 9 to be marginally lower than thetruevalue.Again,wealsoprovideestimatesbasedontheentireSIRdatasetaswell,asacross-check,andestimatesofFull-TimeEquivalents,basedonSIR21.
35Thereisnoinformationonsubjecttaughtinapproximately4,300records,orapproximately11%ofallteacherrecordsinoursample.
30
Table 15. Estimated total FE teachers in England, 2012-1336
Subject Teachers per college
Estimated number of teachers (all SIR)
Estimated number of teachers (SIR21)
Estimated FTE teachers (SIR21)
English,Languages,andCommunication
26 9,869 9,197 4,722
BusinessAdministration,Management,andProfessional
24 8,650 8,715 4,664
ScienceandMathematics 18 6,700 6,588 4,206Visual and Performing Arts andMedia
34 13,451 12,247 6,424
Hospitality,Sports,Leisure,and Travel
23 8,366 8,307 4,887
Health,SocialCare,andPublic Services
27 9,525 9,786 5,609
ICT 13 5,050 4,749 2,753Foundation Programmes 25 9,229 8,987 5,047Engineering,Technology,andManufacturing
19 6,257 6,757 4,579
Humanities 15 5,871 5,554 3,356Construction 16 5,839 5,872 4,161HairdressingandBeautyTherapy
14 4,978 4,991 2,901
Retailing,CustomerService,andTransportation
7 1,902 2,551 577
LandBasedProvision 9 2,674 3,386 1,810
Source: Frontier analysis of SIR21 data
36 TheaveragenumberofteacherspresentedhereincludesallcollegesreportingSIRin2012/13,forallsubjects.Asaresult,thesefiguresareslightlylowerthantheonespresentedinFigure9,wherewehaveonlyconsideredthecollegesofferingeachofthesubjects.
31
6 ConclusionsThe Education and Training Foundation (ETF) commissioned Frontier Economics to carry out an analysisofworkforcedatafromtheStaffIndividualisedRecord(SIR)datasetforfurthereducationcollegesinEnglandfor2012-2013.Thekeyfindingsfromouranalysisaresummarisedbelow.
All staff
• ThegendercompositionoftheFEworkforcehasnotchangedsincelastyear.Theproportionoffemalesin2012-13is63.8%,comparedto63.5%in2011-12.ThisissimilartotheWorkBasedLearning(WBL)workforce(where65%ofstaffarefemale)butislowerthantheAdultandCommunityLearning(ACL)workforce,where74%ofstaffarefemale37.
• Wealsofindthatpatternsinthegendersplitofstafffordifferenttermsofemploymentandfordifferent occupational categories are consistent with 2011-12:
• Theproportionofwomenremainshigheramongpart-timecontracts.Here,wealsofindasmallincrease:72.2%in2012-13comparedto71.2%in2011-12.
• Variation in gender composition by occupational category remains consistent with previous years. TheproportionofwomenremainsespeciallyhighamongAdministrativeandprofessionalstaff,Wordprocessing,clerical,secretarialstaff,andServicestaff,andespeciallylowamongTechnicalstaff.
• ThemedianageoftheFEworkforceis45years.Parttimestafftendtobeolderthanfulltimestaff(46yearsvs.44yearsrespectively).Malestaffareonaverageslightlyolderthanfemalestaffmedianage(46yearsvs.45years).WefindnosignificantdifferencesintheagecompositionofFEstaffbetween 2011-12 and 2012-13.
• TheageprofileoftheFEworkforceissomewhatdifferentfromthatoftheWBLandACLworkforce:
• 23%ofFEstaffareagedunder35comparedwith38%ofWBLand11%ofACLstaff;and
• 24%ofFEstaffareaged55oroldercomparedwith12%ofWBLand32%ofACLstaff.
• ThemajorityofFEstaff(84%)arewhiteBritish,acrossalloccupationalcategories.ThisissimilarinWBL(86%)andACL(83%)providers.TheproportionofwhiteBritishstaffishighestamongseniormanagers (91%). The coverage of information on ethnicity has decreased substantially over time. Inthe2013report,usingdatafrom2008/9upto2011-12,informationonethnicitywasavailablefor94.4%ofcontracts.Usingonlythe2012-13data,thisproportiongoesdownto75.8%.Basedontheinformationavailable,theethniccompositionofFEstaffin2012-13isconsistentwith2011-12.However,giventhelargedifferenceindatacoverage,comparisonsbetweenthetwoyearsshouldbeconsidered tentative.
• Asinpreviousyears,sexualorientationremainsunderreported–67%ofrecordsreturnedweremarkedas‘unknown’38.Thisis,however,animprovementonthelasttwoyearswheretheproportionofrecordsmarkedas‘unknown’was92%(2010-2011)and83%(2011-2012)39.Afurther7%ofresponsesaremarkedas‘prefernottosay’.Wheresexualorientationhasbeenindicated,thevastmajority of staff have reported themselves as heterosexual.
37 “WorkBasedLearningWorkforceSurvey2012-13”,AELPandETFand“AdultandCommunityLearningWorkforceSurvey2012-13”,HOLEXandETF
38 AsimilarproportionofrecordsweremarkedasunknownintheWBL(71%)andACL(75%)surveys.
39 “FurtherEducationWorkforceDataforEngland:AnanalysisoftheStaffIndividualisedRecordData2011-2012”,June2013,LSIS
32
• Approximately 4% of FE staff reported having a disability. This is similar to the rate reported in 2011-12andtotheratesreportedintheACL(4.2%)andWBL(3.6%)workforcesurveys.Ofthose,aroundhalf provided information on the type of disability. Physical impairment is the most common form ofdisability,followedbylearningdifficultyandmentalillhealth.85%ofstaffreportednothavingadisabilityandin11%ofcasesdisabilitystatusisnotknown,eitherbecausenoinformationwasreported(2%ofstaff),orbecauserespondentspreferrednottodisclosetheirstatus(9%).
• Theincidenceofparttimeworkingin2012-13issimilartopreviousyears:58%ofcontractsin2012-13werepart-timecomparedto57%inthepreviousyear.Theincidenceofpart-timeworkingishigherintheACL(80%)sector,andlowerintheWBL(14%)sector.
• Medianannualpayforfull-timeemployeesin2012-13isbetween£23,000and£23,999.Thisrangesfromthe£16,000-16,999bandforwordprocessing,clerical,secretarial,andservicestaffto£62,000–62,999forseniormanagers.Annualpayvariessignificantlybyregion:itishighestinGreaterLondon,at£29,000to29,999,andlowestintheSouthEastandtheNorthEastat£20,000–20,999.
• Averagepayishigherformales,at£27,522,thanforfemales,at£25,824.Thisgapcouldbeexplainedbygenderdifferencesinoccupationcategories,location,orotherfactors,whoserolecouldbedisentangled through further research.
• The gender pay gap has reduced slightly since last year - the ratio between female and male annual pay has increased from 93.4% in 2011-12 to 93.8% in 2012-13.
• Annualpayforfull-timestaffhaschangedlittle.Wefindaverysmallincreaseacrossallstaffof0.1%.Relativeto2011-12,payincreasedforServicestaff,OthermanagersandTechnicalstaff,anddecreased for Senior managers and Word processing staff. Pay remained largely constant for Teaching staff,Assessorsandverifiers,AdministrativeandprofessionalandTechnicalstaff.
Teaching staff
• ThelargestoccupationalcategoryintheFEworkforceisteachingstaff:thiscategoryaccountsforalmosthalf(48%)ofallcontractsintheSIR21data.However,thishasdecreasedslightlycomparedto2011-12 when it stood at 49%.
• TeachersinFEcollegesinEnglandarepredominantlyfemale,butthereisalowerproportionofwomenteachingcomparedtotheoverallFEworkforce(59%comparedto64%acrossallstaff).Thegender split of teaching staff between contract types is consistent with 2011-12: the proportion of femalesis65.3%amongpart-timecontracts(66.2%in2011-12),and48%amongfull-timecontracts(stable compared to 2011-12).
• Teachers are somewhat younger than the total FE staff (median age 44 years compared to 45). The average40ageofteachershasdecreasedslightly,from46to45years,between2011-12and2012-13.
• Asin2011-12,theproportionofWhiteBritishindividualsisloweramongteachers(80%)thanamongFEstaffoverall(82%).However,thedifferencebetweenthetwogroupshasreduced:in2012-1383%ofteacherswereWhiteBritishcomparedwith84%ofallFEstaff41.
• Themedianannualpaybandforfull-timeteachersis£29,000to£29,999,comparedto£23,000to£23,999forallfull-timeFEstaff.Thereisasignificantamountofvariationinpayacrossregions.AsforallFEstaff,teacherpayishighestinGreaterLondonandlowestintheSouthEastandtheNorthEast.Payisstablecomparedto2011-12atca.£29,600annualforfull-timeteachers(£29,696in2011-12and£29,647in2012-13).
• Asin2011-12,teachersareworkingpart-timemoreoftenthantheaveragememberofFEstaff.62%ofteachersareemployedonapart-timebasiscomparedwith58%ofthegeneralFEworkforce.
40 Meanaverage
41 Again we note that there is a considerable difference between the two years in terms of availability of information on ethnicity.
33
• Teachingstaffjoiningin2012-13tendtobeolder,andmoreoftenmale,thanstaffjoiningearlier:
• The average age of teachers at contract start date is higher among those joining in 2012-1342 (42 years) than among those joining earlier (39 years).
• 57%ofteachersjoiningin2012-13werefemale,comparedto59%inearlieryears.
• Asin2011-12,thesubjectareastaughtbythelargestnumberofstaffareVisualandPerformingArtsandMedia,Health,SocialCareandPublicServicesandEnglish,LanguagesandCommunication.SubjectswiththelowestlevelsofteachingstaffareRetailing,CustomerServiceandTransportationandLandBasedProvision.
The results presented in this report are based on a sample of colleges - around a third of the sector - providing up to date information as part of the SIR21 data collection. Response rates in previous years have tended to be higher43 and the decline over time is a cause for concern since these data are importantforunderstandingtheFElandscapeandinformingfuturepolicy.Goingforward,itwillbeimportanttoensurethatresponseratesbycollegesaremaximised.Inordertoachievethis,anumberofoptionscouldbeconsidered,including:
• Streamliningthedatarequirementsandprocessfurthertomakethereturnlessburdensomeforcollegeswithoutcompromisingthecollectionofimportantinformation;
• Collectingaggregatecollegeinformationratherthanindividualleveldataifthismakesthedatacollectionprocesslessonerousforcolleges;
• Providingexplicitincentivesforcollegestomaximisereturns;
• Focusing future data collections on a sample of colleges which is representative of the college population. A new sample could be generated for each wave of data collection. This would reduce theburdenofdatareportingonallcolleges,asaninstitutionwouldonlyhavetoreportwhenselected,ratherthaneveryyear.Theeasiestwaytoobtainarepresentativesampleisapplyingsimple random sampling: selecting randomly colleges from the population until reaching the desiredsamplesize44.Theoptimalsamplesizewoulddependonthekeystatisticstobeestimated,andonthedesiredlevelofstatisticalconfidenceandmarginoferror.
Beyondresponserates,thereareotherfacetsoftheSIRdatathatcouldbeimprovedgoingforward,relatingtothewayinwhichinformationisrecorded,andwhattypeofinformationiscollected.
Thecurrentmethodologydoesnotallowidentificationofindividualmembersofstaff.Thislimitsthepossibilitytoinvestigatereliablyissuessuchasrecruitmentandretentionpatterns,andstaffexperience45.Ananonymisedstaffidentifierwhichcouldbeusedtotrackindividualsacrossthesectorcould be a valuable resource for future analysis.
Moreover,therearepiecesofinformationwhicharecurrentlynotcollectedinthedatabutmaybeimportantforunderstandingthesector.Notably,theSIRdatanolongercollectsinformationonteacherqualificationswhichareclearlyimportantforfutureworkforceplanning.
Otherinformationgapsincludetypeofeducation(e.g.offendereducation,specialeducationneeds)whichcannotcurrentlybeidentifiedinthedata.Moredisaggregationofcertainvariablesmayalsobebeneficialandallowustobetterunderstandteacherroles.Forexample,subjectareasarecurrentlyaggregatedinawaywhichdoesnotallowustoidentifyEnglishandMathematicsteachersexplicitly,asthesearegroupedwithin‘English,LanguagesandCommunication’and‘ScienceandMathematics’
42 Forthepurposeofthiswehavedefined2012-13astheperiodbetweenAugust1,2012andAugust30,2013.
43 Approximatelytwothirdsofrecordsinthe2013reportwerereturnedin2011-12(“FurtherEducationCollegeWorkforceDataforEngland:AnanalysisoftheStaffIndividualisedRecordData2011-2012”,June2013,LSIS),Ifthisimpliesthatapproximatelytwothirdsofthe266collegesincludedinthe2013reportsubmitteddatain2011-12,thiswouldmeanthatSIRinformationwasuptodatefor177collegesin2011-12,comparedto123in2012-13.
44 Analternativemethodmayinvolvesplittingthepopulationofcollegesintosubgroups(forexample,byregionorbycollegetype)anddrawingrandomsamples from each subgroup. This may be preferable if it is important that each of the subgroups is represented in the population.
45 Giventhecurrentdataspecification,itispossibletocomputethelengthofacontract,butthismaynotbeequaltoamemberofstaff’soverallexperiencein the FE sector.

34
respectively.Furthermore,subjectsarenotknownformorethan10%ofteachers,upfrom1.7%in2007/08.Therearealsoproblemswiththecategorisationofstaff,notablythelackof‘teachingassistant’role.
Future collections may wish to consider how to improve this aspect of the data.
35
Annexe 1: Figures and Tables
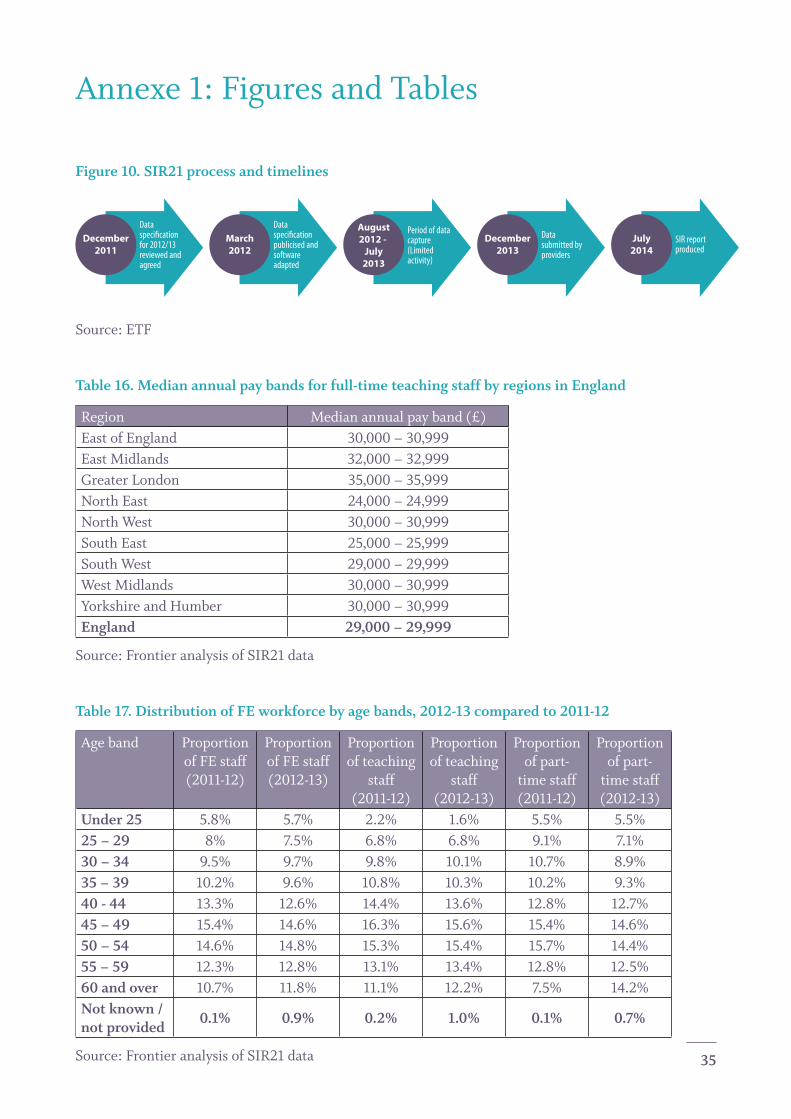
Figure 10. SIR21 process and timelines
December2011
Data speci�cation for 2012/13 reviewed and agreed
March2012
Data speci�cation publicised and software adapted
August2012 -
July2013
Period of data capture (Limited activity)
December2013
Data submitted by providers
July2014
SIR report produced
Source: ETF
Table 16. Median annual pay bands for full-time teaching staff by regions in England
Region Medianannualpayband(£)East of England 30,000–30,999EastMidlands 32,000–32,999GreaterLondon 35,000–35,999North East 24,000–24,999North West 30,000–30,999South East 25,000–25,999South West 29,000–29,999WestMidlands 30,000–30,999YorkshireandHumber 30,000–30,999England 29,000 – 29,999
Source: Frontier analysis of SIR21 data
Table 17. Distribution of FE workforce by age bands, 2012-13 compared to 2011-12
Age band Proportion of FE staff (2011-12)
Proportion of FE staff (2012-13)
Proportion of teaching
staff (2011-12)
Proportion of teaching
staff (2012-13)
Proportion of part-
time staff (2011-12)
Proportion of part-
time staff (2012-13)
Under 25 5.8% 5.7% 2.2% 1.6% 5.5% 5.5%25 – 29 8% 7.5% 6.8% 6.8% 9.1% 7.1%30 – 34 9.5% 9.7% 9.8% 10.1% 10.7% 8.9%35 – 39 10.2% 9.6% 10.8% 10.3% 10.2% 9.3%40 - 44 13.3% 12.6% 14.4% 13.6% 12.8% 12.7%45 – 49 15.4% 14.6% 16.3% 15.6% 15.4% 14.6%50 – 54 14.6% 14.8% 15.3% 15.4% 15.7% 14.4%55 – 59 12.3% 12.8% 13.1% 13.4% 12.8% 12.5%60 and over 10.7% 11.8% 11.1% 12.2% 7.5% 14.2%Not known / not provided
0.1% 0.9% 0.2% 1.0% 0.1% 0.7%
Source: Frontier analysis of SIR21 data
36
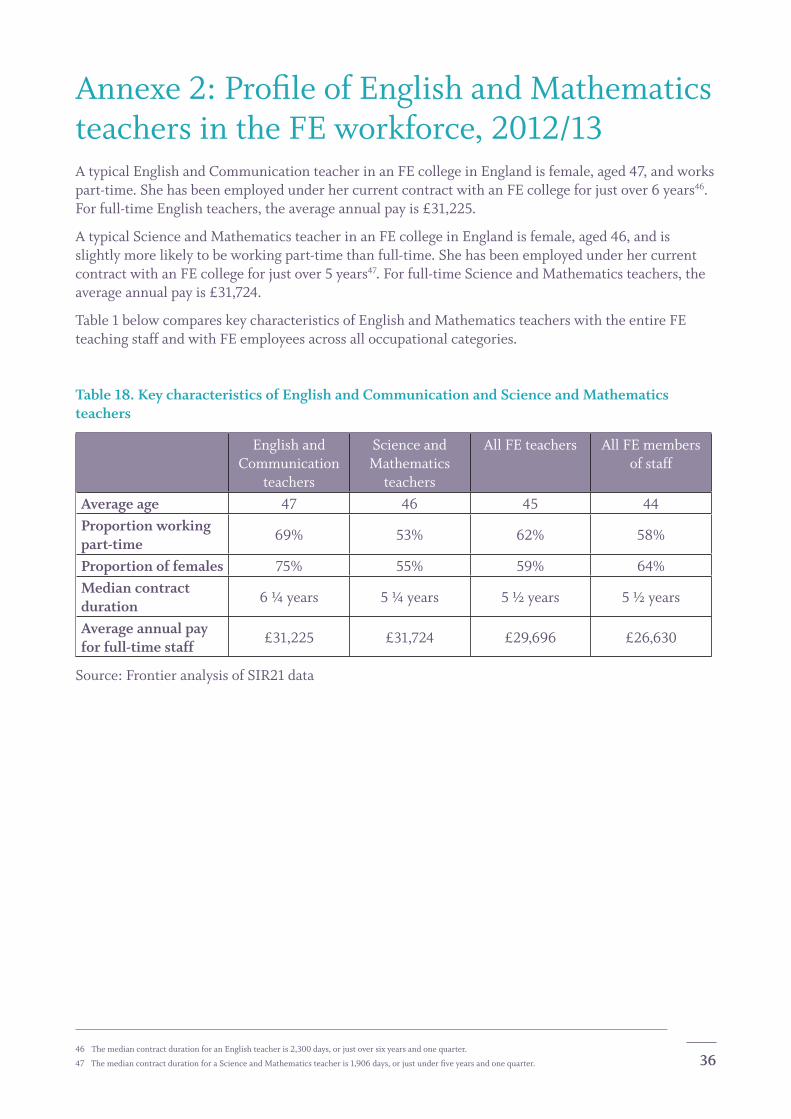
Annexe2:ProfileofEnglishandMathematicsteachersintheFEworkforce,2012/13AtypicalEnglishandCommunicationteacherinanFEcollegeinEnglandisfemale,aged47,andworkspart-time. She has been employed under her current contract with an FE college for just over 6 years46. Forfull-timeEnglishteachers,theaverageannualpayis£31,225.
AtypicalScienceandMathematicsteacherinanFEcollegeinEnglandisfemale,aged46,andisslightlymorelikelytobeworkingpart-timethanfull-time.Shehasbeenemployedunderhercurrentcontract with an FE college for just over 5 years47.Forfull-timeScienceandMathematicsteachers,theaverageannualpayis£31,724.
Table1belowcompareskeycharacteristicsofEnglishandMathematicsteacherswiththeentireFEteaching staff and with FE employees across all occupational categories.
Table 18. Key characteristics of English and Communication and Science and Mathematics teachers
English and Communication
teachers
Science and Mathematics
teachers
All FE teachers All FE members of staff
Average age 47 46 45 44Proportion working part-time
69% 53% 62% 58%
Proportion of females 75% 55% 59% 64%Median contract duration
6 ¼ years 5 ¼ years 5 ½ years 5 ½ years
Average annual pay for full-time staff
£31,225 £31,724 £29,696 £26,630
Source: Frontier analysis of SIR21 data
46 ThemediancontractdurationforanEnglishteacheris2,300days,orjustoversixyearsandonequarter.
47 ThemediancontractdurationforaScienceandMathematicsteacheris1,906days,orjustunderfiveyearsandonequarter.
37
FrontierEconomicsLimitedinEuropeisamemberoftheFrontierEconomicsnetwork,whichconsistsofseparatecompaniesbasedinEurope(Brussels,Cologne,London&Madrid)andAustralia(Melbourne&Sydney).Thecompaniesareindependentlyowned,andlegalcommitmentsenteredintobyanyonecompanydonotimposeanyobligationsonothercompaniesinthenetwork.Allviewsexpressed in this document are the views of Frontier Economics Limited.
FRONTIERECONOMICSEUROPE
BRUSSELS|COLOGNE|LONDON|MADRID
FrontierEconomicsLtd71HighHolbornLondonWC1V6DA
Tel.+44(0)2070317000|Fax.+44(0)2070317001|www.frontier-economics.com
Recommended