Global Marine Insurance Report
Astrid Seltmann Fact and Figures Committee: Analyst/Actuary, Cefor - The Nordic Association of Marine Insurers, Oslo

Warming up
• Find a suitable Shakespeare quote!
• IUMI and Olympics – the link?
• Do you believe in statistics?
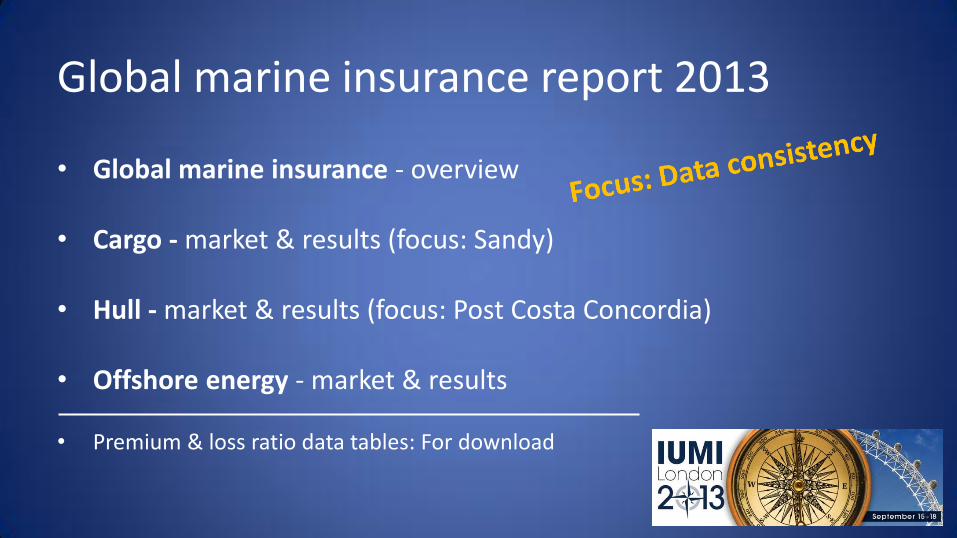
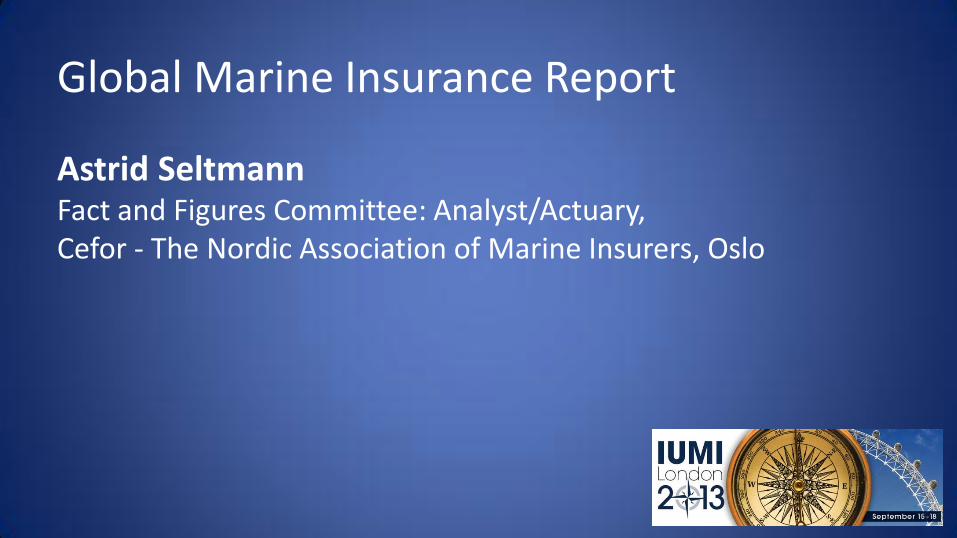
Global marine insurance report 2013
• Global marine insurance - overview
• Cargo - market & results (focus: Sandy)
• Hull - market & results (focus: Post Costa Concordia)
• Offshore energy - market & results
• Premium & loss ratio data tables: For download
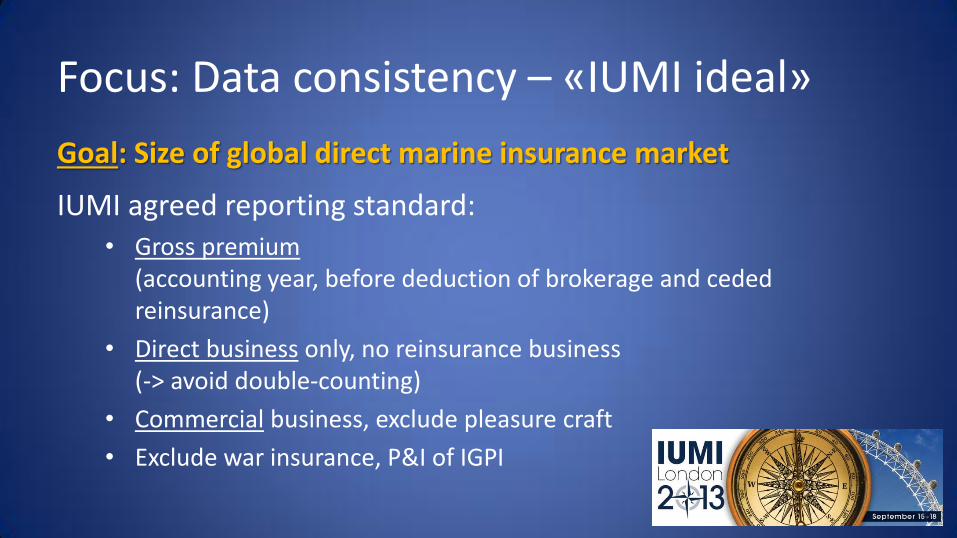
Focus: Data consistency – «IUMI ideal»
Goal: Size of global direct marine insurance market
IUMI agreed reporting standard: • Gross premium
(accounting year, before deduction of brokerage and ceded reinsurance)
• Direct business only, no reinsurance business (-> avoid double-counting)
• Commercial business, exclude pleasure craft
• Exclude war insurance, P&I of IGPI

Focus: Data consistency – real life
Some reported figures • include proportional and/or facultative reinsurance,
pleasure craft, aviation, ... • do not reflect 100% of region’s income (but share increasing)
(Companies outside the scope of local associations)
• change backwards in time (!) • are estimates
Real life will never be perfect, but constant improvement is the key... !
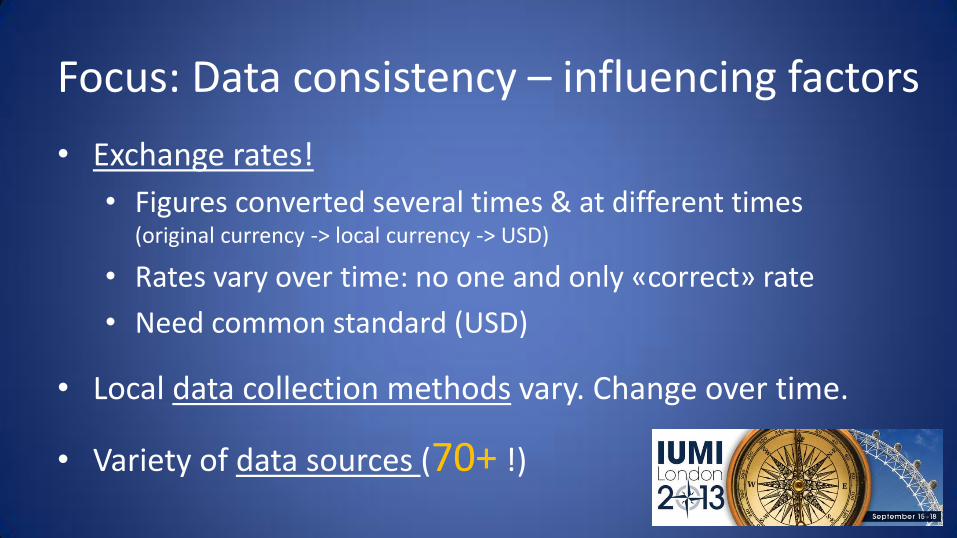
Focus: Data consistency – influencing factors
• Exchange rates!
• Figures converted several times & at different times (original currency -> local currency -> USD)
• Rates vary over time: no one and only «correct» rate
• Need common standard (USD)
• Local data collection methods vary. Change over time.
• Variety of data sources (70+ !)
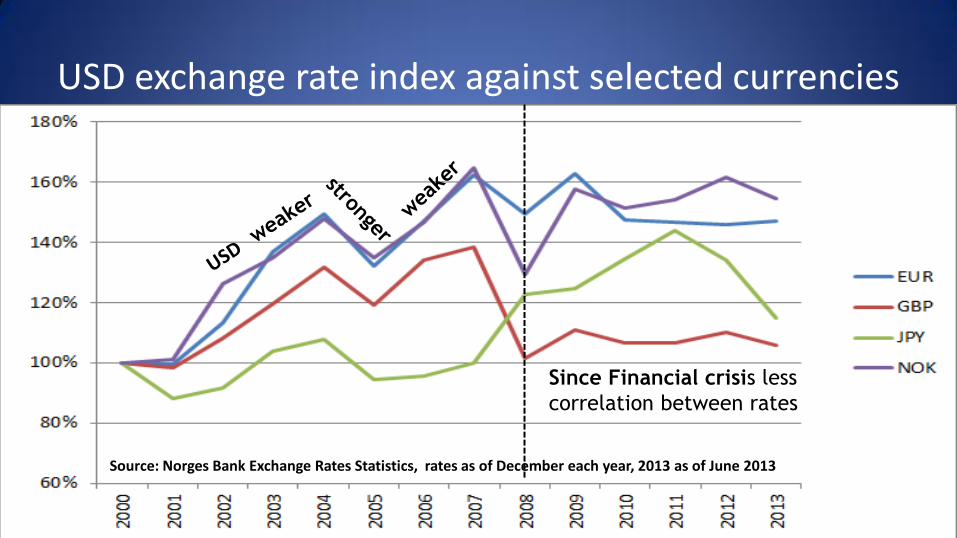
USD exchange rate index against selected currencies
Source: Norges Bank Exchange Rates Statistics, rates as of December each year, 2013 as of June 2013
Since Financial crisis less
correlation between rates
Global marine insurance report 2013
• Global marine insurance - overview
• Cargo - market & results (focus: Sandy)
• Hull - market & results (focus: Post Costa Concordia)
• Offshore energy - market & results
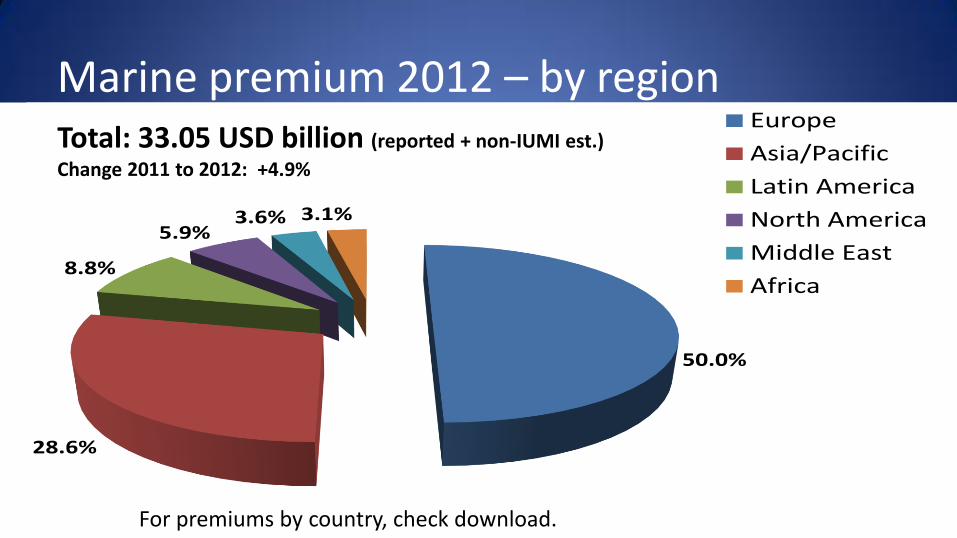
Marine premium 2012 – by region
50.0%
28.6%
8.8%
5.9%3.6% 3.1%
2012Europe
Asia/Pacific
Latin America
North America
Middle East
Africa
For premiums by country, check download.
Total: 33.05 USD billion (reported + non-IUMI est.)
Change 2011 to 2012: +4.9%
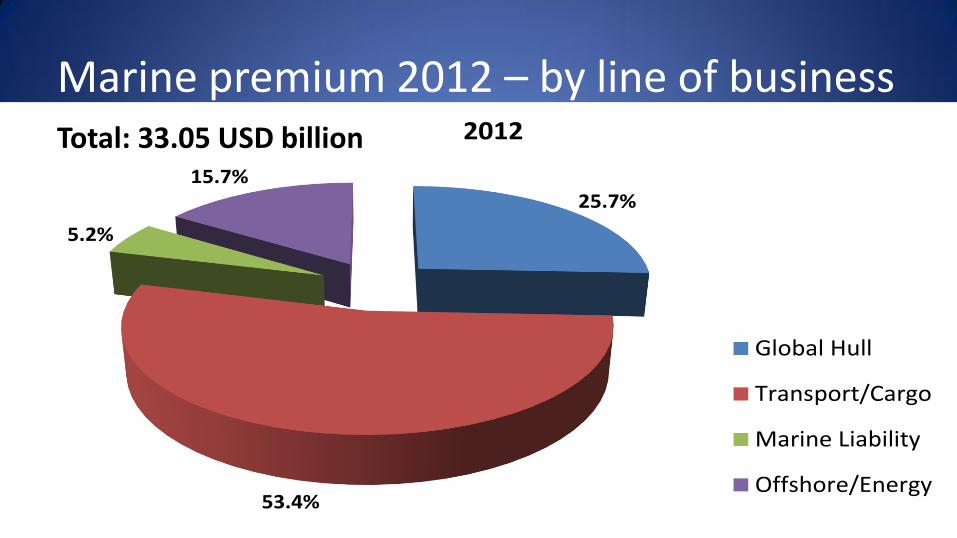
Marine premium 2012 – by line of business
25.7%
53.4%
5.2%
15.7%
2012
Global Hull
Transport/Cargo
Marine Liability
Offshore/Energy
Total: 33.05 USD billion
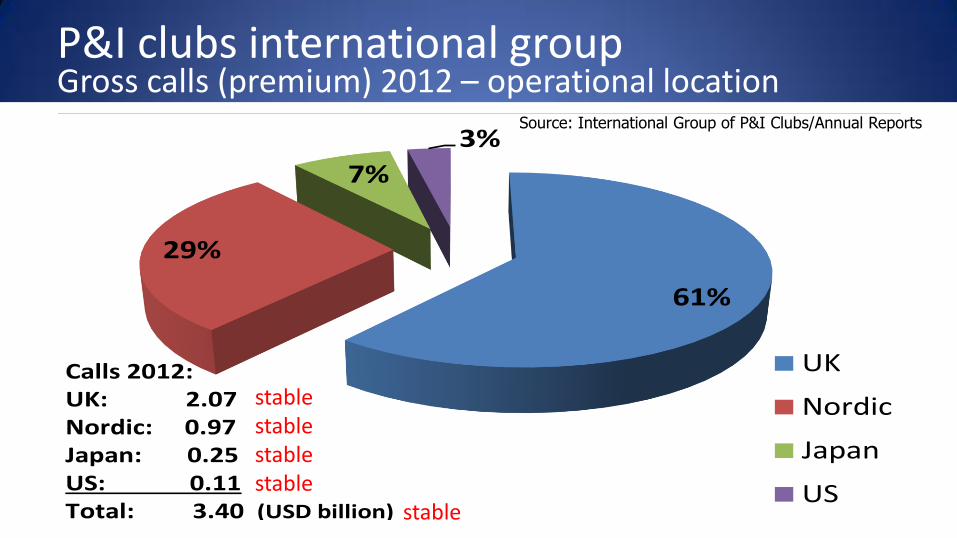
P&I clubs international group Gross calls (premium) 2012 – operational location
61%
29%
7%
3%
UK
Nordic
Japan
US
Calls 2012:UK: 2.07Nordic: 0.97Japan: 0.25US: 0.11Total: 3.40 (USD billion)
Source: International Group of P&I Clubs/Annual Reports
stable stable stable stable stable
Global marine insurance report 2013
• Global marine insurance - overview
• Cargo - market & results (focus: Sandy)
• Hull - market & results (focus: Post Costa Concordia)
• Offshore energy - market & results
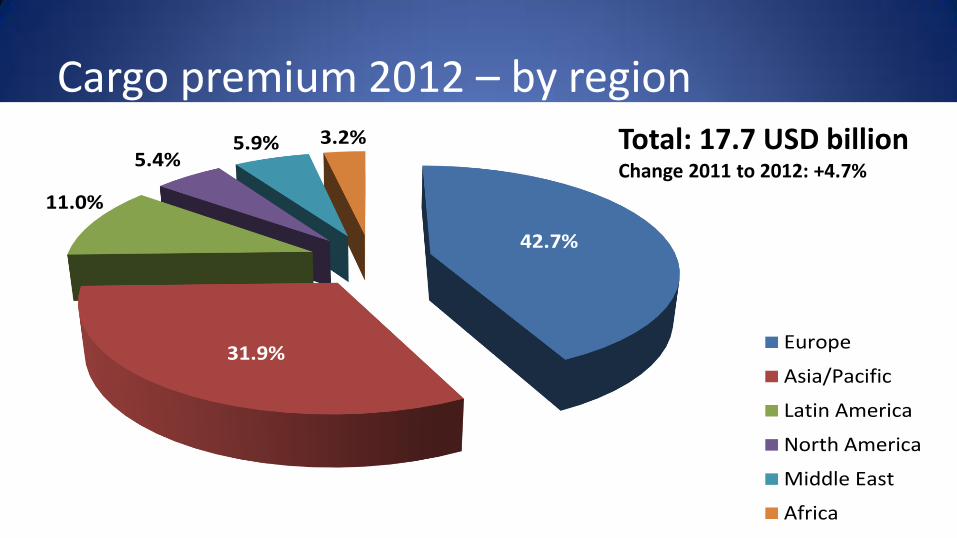
Cargo premium 2012 – by region
42.7%
31.9%
11.0%
5.4%5.9% 3.2%
2012
Europe
Asia/Pacific
Latin America
North America
Middle East
Africa
Total: 17.7 USD billion Change 2011 to 2012: +4.7%
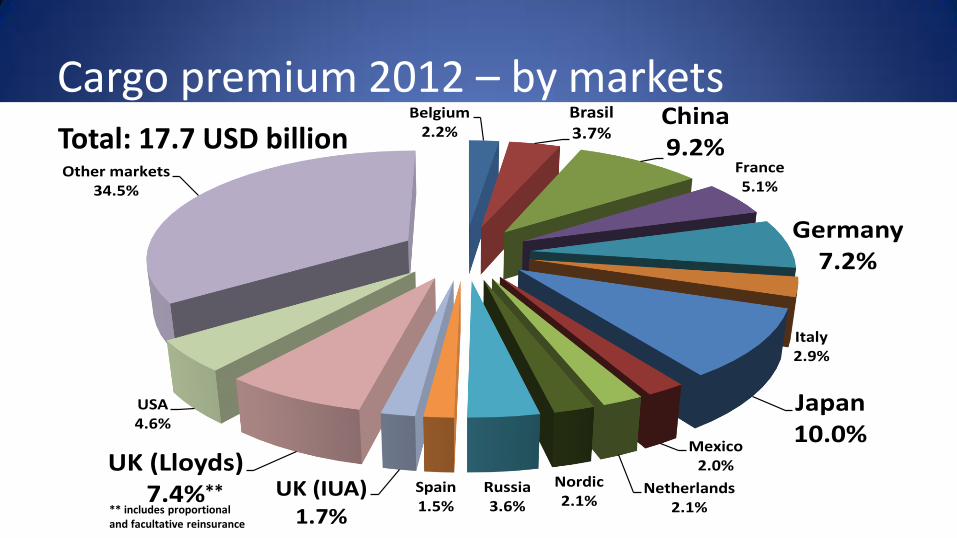
Cargo premium 2012 – by markets Belgium
2.2%Brasil3.7%
China9.2%
France5.1%
Germany7.2%
Italy2.9%
Japan10.0%
Mexico2.0%
Netherlands2.1%
Nordic2.1%
Russia3.6%
Spain1.5%
UK (IUA)1.7%
UK (Lloyds)7.4%
USA4.6%
Other markets34.5%
2012Total: 17.7 USD billion
** ** includes proportional and facultative reinsurance
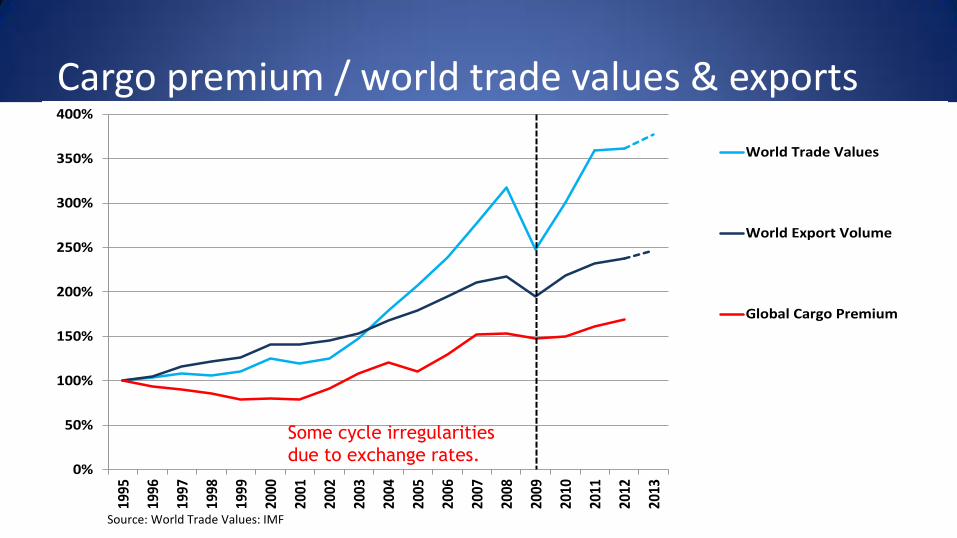
Cargo premium / world trade values & exports
0%
50%
100%
150%
200%
250%
300%
350%
400%19
95
1996
1997
1998
1999
2000
2001
2002
2003
2004
2005
2006
2007
2008
2009
2010
2011
2012
2013
World Trade Values
World Export Volume
Global Cargo Premium
Source: World Trade Values: IMF
Some cycle irregularities
due to exchange rates.
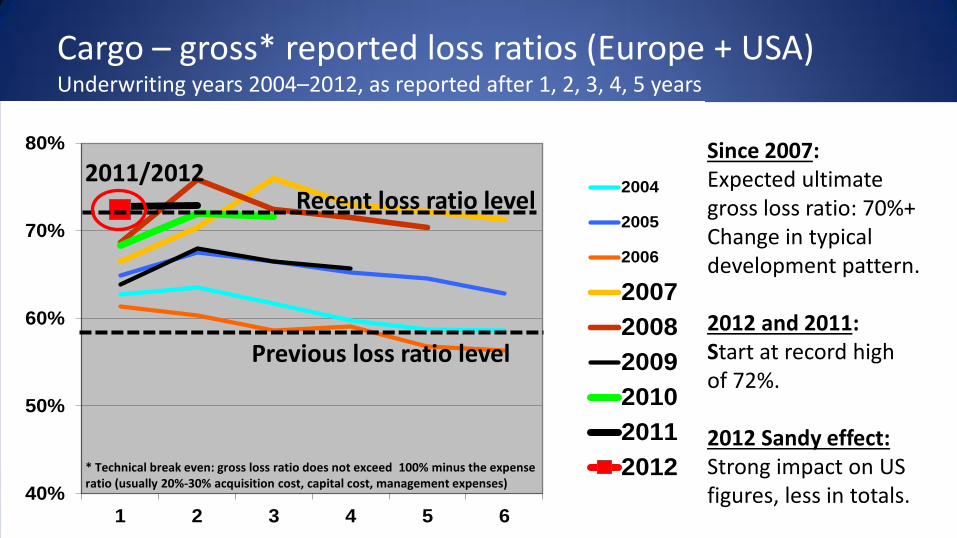
Cargo – gross* reported loss ratios (Europe + USA) Underwriting years 2004–2012, as reported after 1, 2, 3, 4, 5 years
40%
50%
60%
70%
80%
1 2 3 4 5 6
2004
2005
2006
2007
2008
2009
2010
2011
2012
Since 2007: Expected ultimate gross loss ratio: 70%+ Change in typical development pattern. 2012 and 2011: Start at record high of 72%. 2012 Sandy effect: Strong impact on US figures, less in totals.
Previous loss ratio level
Recent loss ratio level 2011/2012
* Technical break even: gross loss ratio does not exceed 100% minus the expense ratio (usually 20%-30% acquisition cost, capital cost, management expenses)
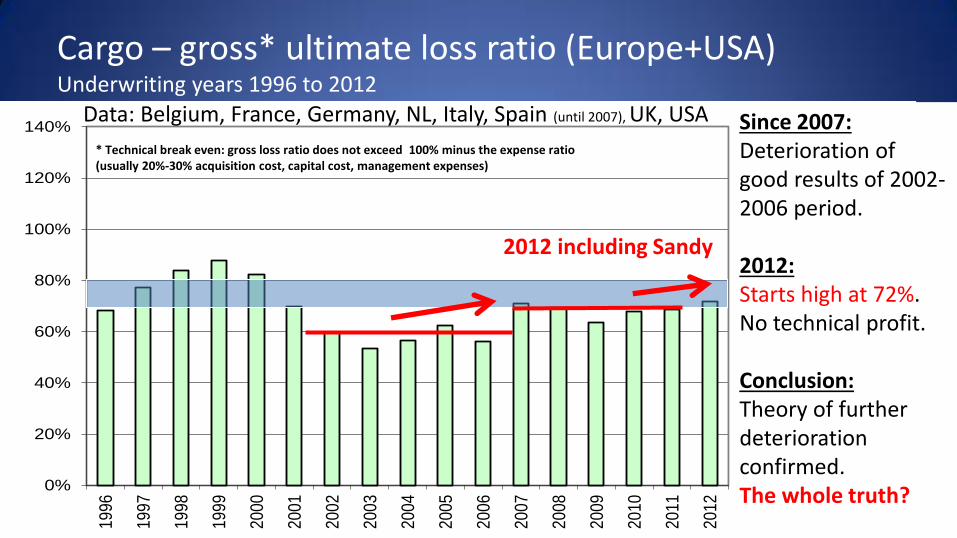
Cargo – gross* ultimate loss ratio (Europe+USA) Underwriting years 1996 to 2012
0%
20%
40%
60%
80%
100%
120%
140%
19
96
19
97
19
98
19
99
20
00
20
01
20
02
20
03
20
04
20
05
20
06
20
07
20
08
20
09
20
10
20
11
20
12
* Technical break even: gross loss ratio does not exceed 100% minus the expense ratio (usually 20%-30% acquisition cost, capital cost, management expenses)
Since 2007: Deterioration of good results of 2002-2006 period. 2012: Starts high at 72%. No technical profit. Conclusion: Theory of further deterioration confirmed. The whole truth?
2012 including Sandy
* Technical break even: gross loss ratio does not exceed 100% minus the expense ratio (usually 20%-30% acquisition cost, capital cost, management expenses)
Data: Belgium, France, Germany, NL, Italy, Spain (until 2007), UK, USA
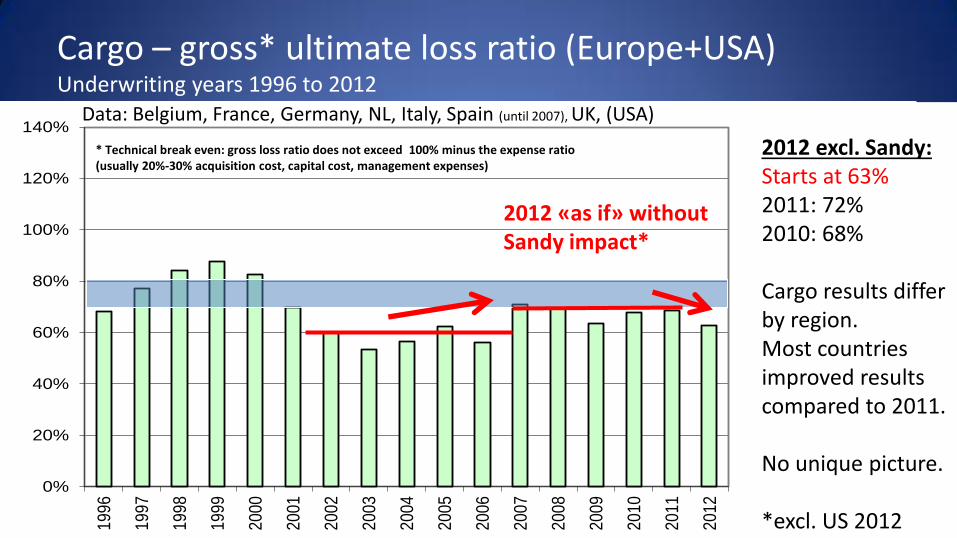
Cargo – gross* ultimate loss ratio (Europe+USA) Underwriting years 1996 to 2012
0%
20%
40%
60%
80%
100%
120%
140%
19
96
19
97
1998
19
99
20
00
20
01
20
02
20
03
20
04
20
05
20
06
20
07
20
08
20
09
20
10
20
11
20
12
2012 «as if» without Sandy impact*
* Technical break even: gross loss ratio does not exceed 100% minus the expense ratio (usually 20%-30% acquisition cost, capital cost, management expenses)
2012 excl. Sandy: Starts at 63% 2011: 72% 2010: 68% Cargo results differ by region. Most countries improved results compared to 2011. No unique picture. *excl. US 2012
* Technical break even: gross loss ratio does not exceed 100% minus the expense ratio (usually 20%-30% acquisition cost, capital cost, management expenses)
Data: Belgium, France, Germany, NL, Italy, Spain (until 2007), UK, (USA)
Summing up cargo
• 2012 Premium growth reflects upswing in trade Commodity prices rising, but economical environment remains unstable
• “Sandy” devastating effect on US cargo results
• Claims pattern changed in recent years Impact of natural catastrophes (Thailand floods, Sandy)
• Claim cost unlikely to decrease Increased accumulation risk, moral hazard, theft, natural catastrophes. Sanctions and piracy still a concern
• But: Many regions improved results compared to 2011
• Future uncertain – difficult market conditions continue
Global marine insurance report 2013
• Global marine insurance - overview
• Cargo - market & results (focus: Sandy)
• Hull - market & results (focus: Post Costa Concordia)
• Offshore energy - market & results
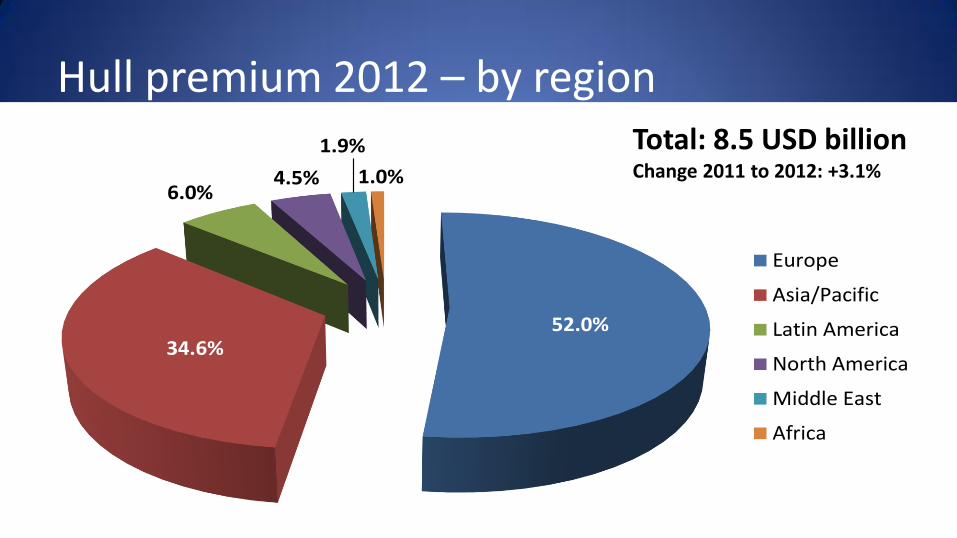
Hull premium 2012 – by region
52.0%34.6%
6.0%4.5%
1.9%
1.0%2012
Europe
Asia/Pacific
Latin America
North America
Middle East
Africa
Total: 8.5 USD billion Change 2011 to 2012: +3.1%
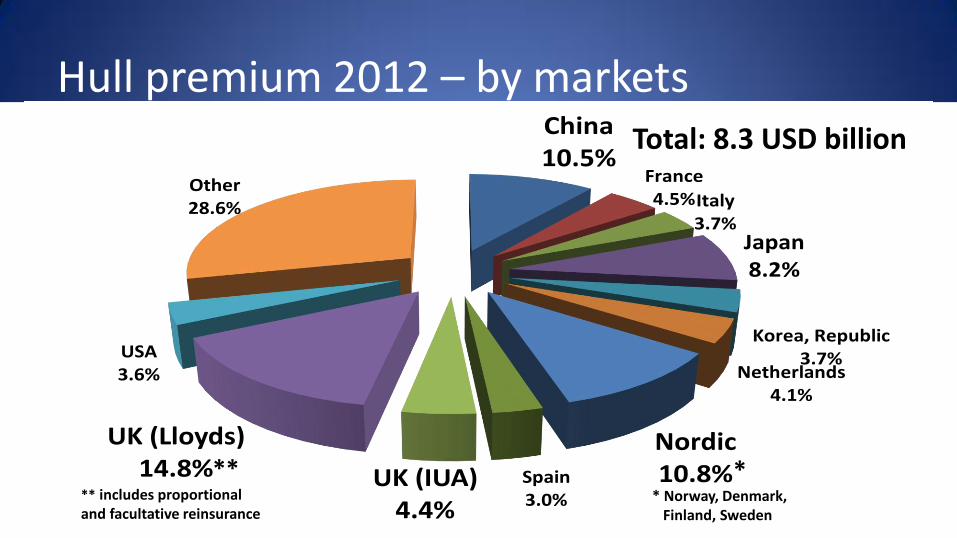
Hull premium 2012 – by markets China10.5%
France4.5%Italy
3.7%Japan8.2%
Korea, Republic3.7%
Netherlands4.1%
Nordic10.8%Spain
3.0%UK (IUA)
4.4%
UK (Lloyds)14.8%
USA3.6%
Other28.6%
2012
**
** includes proportional and facultative reinsurance
Total: 8.3 USD billion
*
* Norway, Denmark, Finland, Sweden
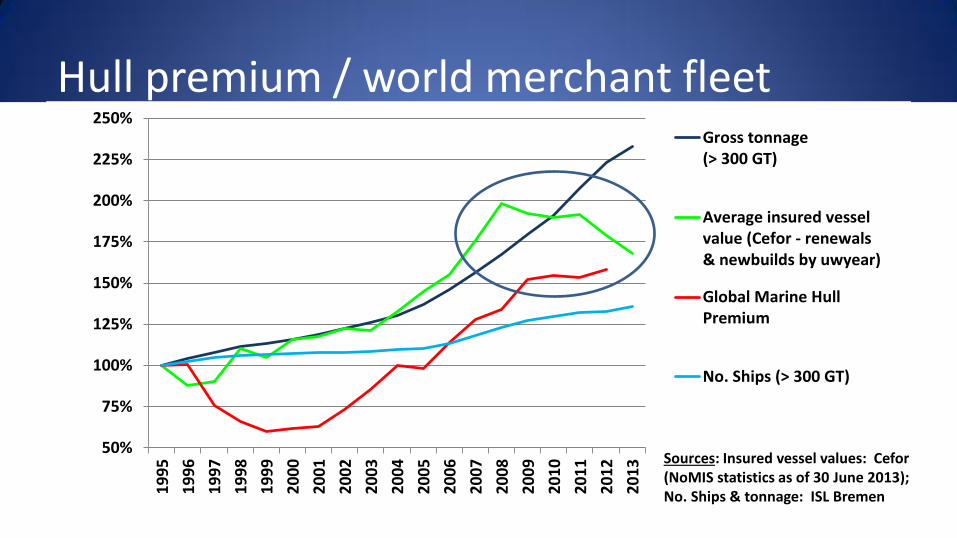
Hull premium / world merchant fleet
50%
75%
100%
125%
150%
175%
200%
225%
250%
1995
1996
1997
1998
1999
2000
2001
2002
2003
2004
2005
2006
2007
2008
2009
2010
2011
2012
2013
Gross tonnage(> 300 GT)
Average insured vesselvalue (Cefor - renewals& newbuilds by uwyear)
Global Marine HullPremium
No. Ships (> 300 GT)
Sources: Insured vessel values: Cefor (NoMIS statistics as of 30 June 2013); No. Ships & tonnage: ISL Bremen
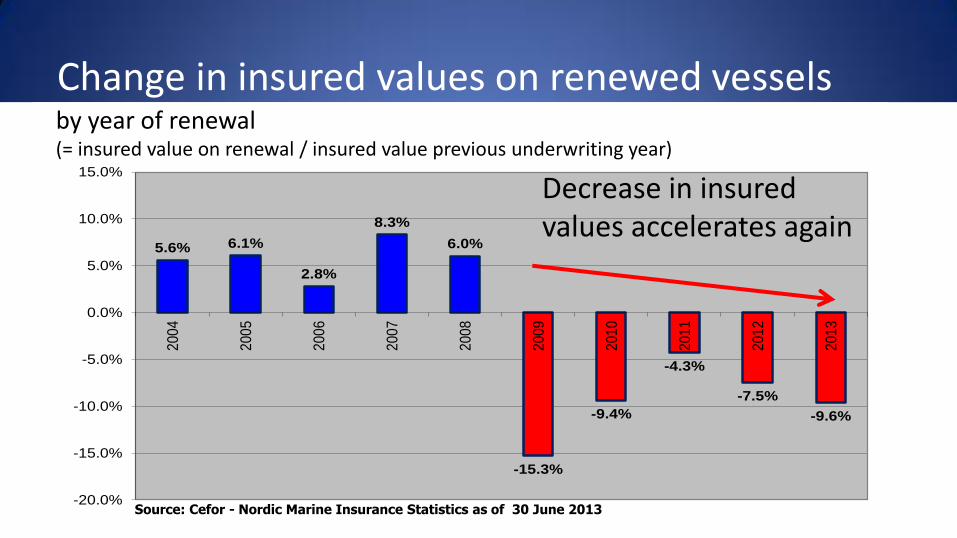
Change in insured values on renewed vessels
5.6% 6.1%
2.8%
8.3%
6.0%
-15.3%
-9.4%
-4.3%
-7.5%
-9.6%
-20.0%
-15.0%
-10.0%
-5.0%
0.0%
5.0%
10.0%
15.0%2
00
4
200
5
200
6
200
7
200
8
200
9
201
0
201
1
201
2
201
3
Average annual change in insured values on renewed vessels
Source: Cefor - Nordic Marine Insurance Statistics as of 30 June 2013
Decrease in insured values accelerates again
by year of renewal (= insured value on renewal / insured value previous underwriting year)
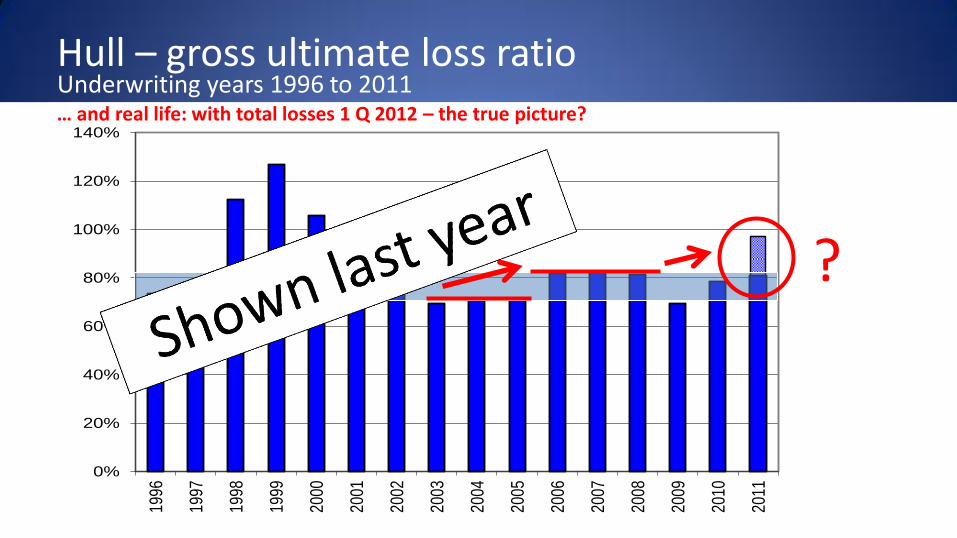
Hull – gross ultimate loss ratio Underwriting years 1996 to 2011
0%
20%
40%
60%
80%
100%
120%
140%
1996
1997
1998
1999
2000
2001
2002
2003
2004
2005
2006
2007
2008
2009
2010
2011
?
… and real life: with total losses 1 Q 2012 – the true picture?
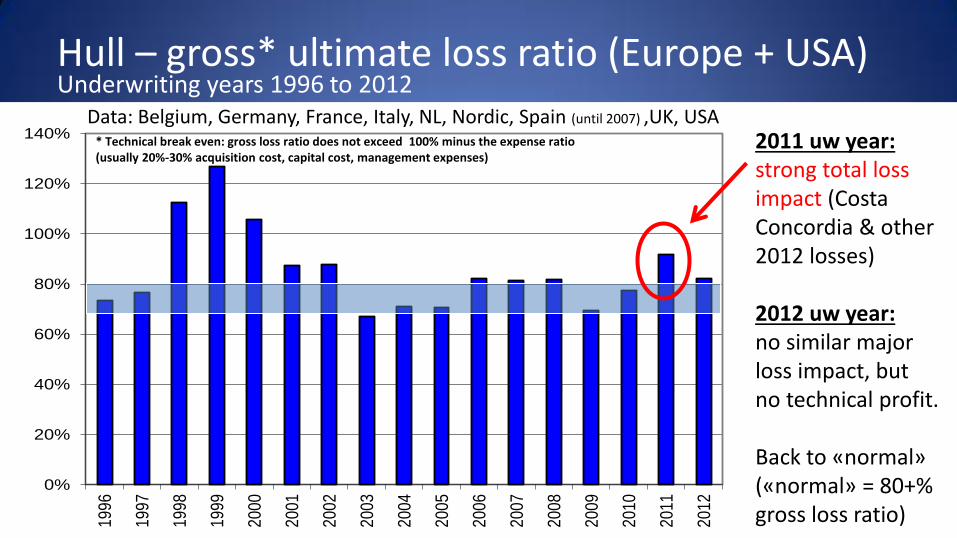
Hull – gross* ultimate loss ratio (Europe + USA) Underwriting years 1996 to 2012
0%
20%
40%
60%
80%
100%
120%
140%
1996
1997
1998
1999
2000
2001
2002
2003
2004
2005
2006
2007
2008
2009
2010
2011
2012
2011 uw year: strong total loss impact (Costa Concordia & other 2012 losses) 2012 uw year: no similar major loss impact, but no technical profit. Back to «normal» («normal» = 80+% gross loss ratio)
* Technical break even: gross loss ratio does not exceed 100% minus the expense ratio (usually 20%-30% acquisition cost, capital cost, management expenses)
Data: Belgium, Germany, France, Italy, NL, Nordic, Spain (until 2007) ,UK, USA
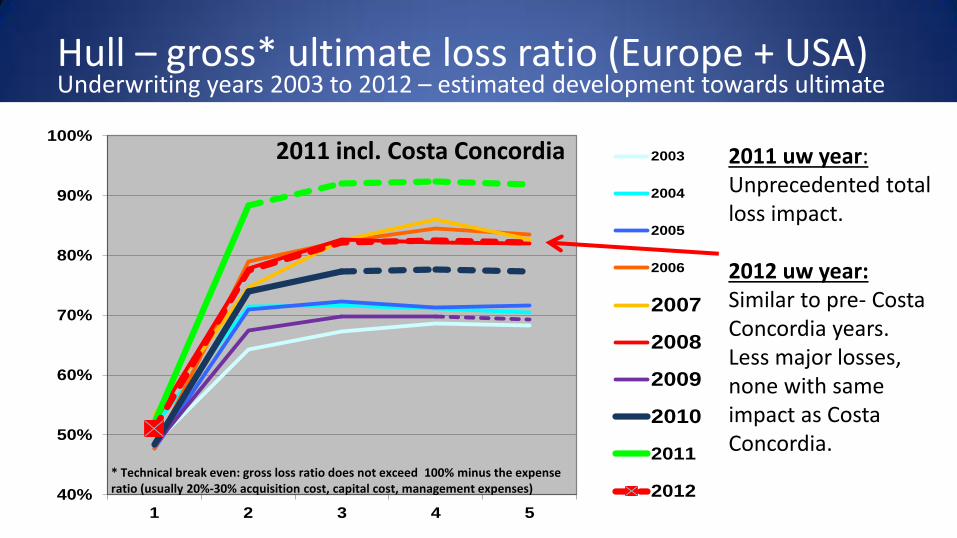
Hull – gross* ultimate loss ratio (Europe + USA) Underwriting years 2003 to 2012 – estimated development towards ultimate
40%
50%
60%
70%
80%
90%
100%
1 2 3 4 5
2003
2004
2005
2006
2007
2008
2009
2010
2011
2012
2011 uw year: Unprecedented total loss impact. 2012 uw year: Similar to pre- Costa Concordia years. Less major losses, none with same impact as Costa Concordia.
2011 incl. Costa Concordia
* Technical break even: gross loss ratio does not exceed 100% minus the expense ratio (usually 20%-30% acquisition cost, capital cost, management expenses)
Global marine insurance report 2013
• Global marine insurance - overview
• Cargo - market & results (focus: Sandy)
• Hull - market & results (focus: Post Costa Concordia)
• Offshore energy - market & results
Hull claims trends as of 2013
• Overall claim frequency: Down after peak in 2008 Long-term positive to stable trend
• Total loss frequency: Long-term positive trend Peak in 2012 possibly exceptional
• Average repair cost: Stable after peak in 2008
=> All-clear signal?
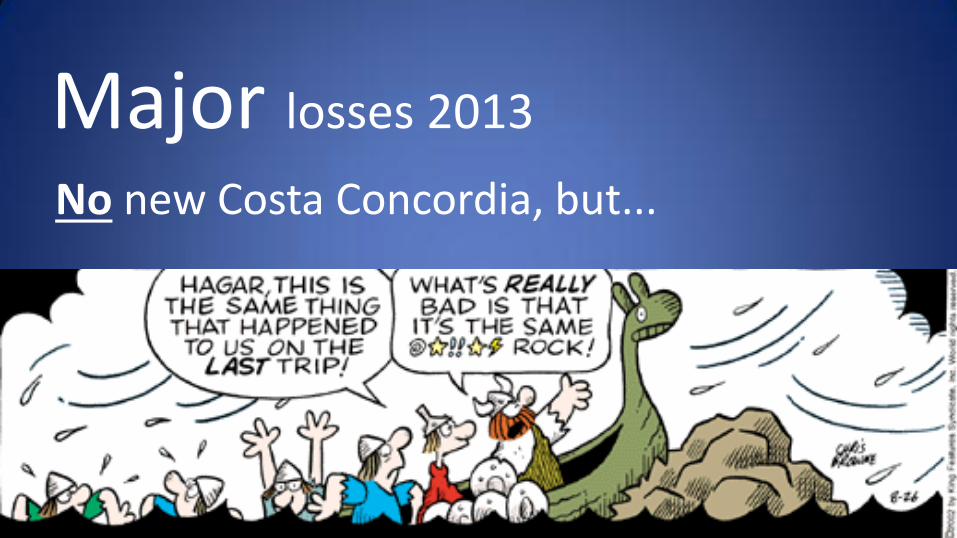
Major losses 2013
No new Costa Concordia, but...
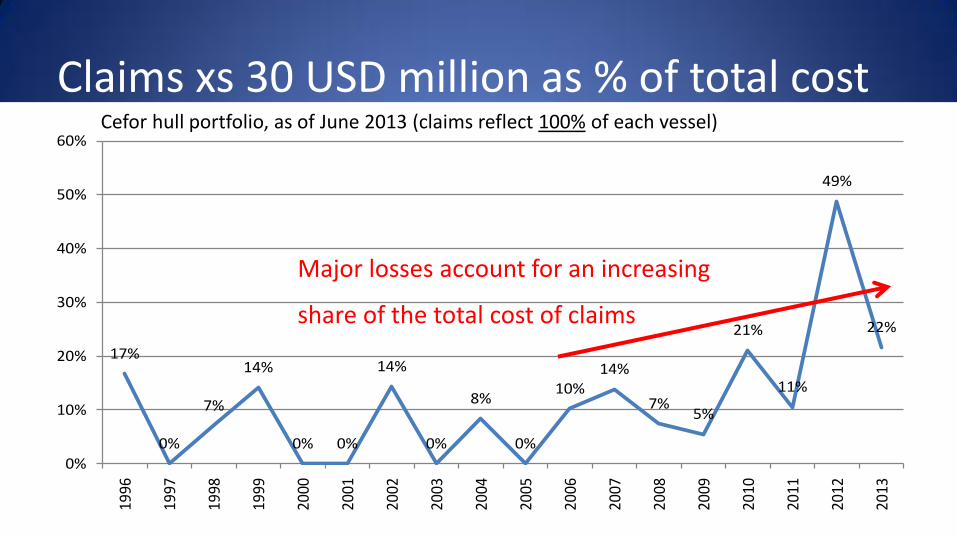
Claims xs 30 USD million as % of total cost
17%
0%
7%
14%
0% 0%
14%
0%
8%
0%
10%14%
7%5%
21%
11%
49%
22%
0%
10%
20%
30%
40%
50%
60%19
96
1997
1998
1999
2000
2001
2002
2003
2004
2005
2006
2007
2008
2009
2010
2011
2012
2013
Cefor hull portfolio, as of June 2013 (claims reflect 100% of each vessel)
Major losses account for an increasing
share of the total cost of claims
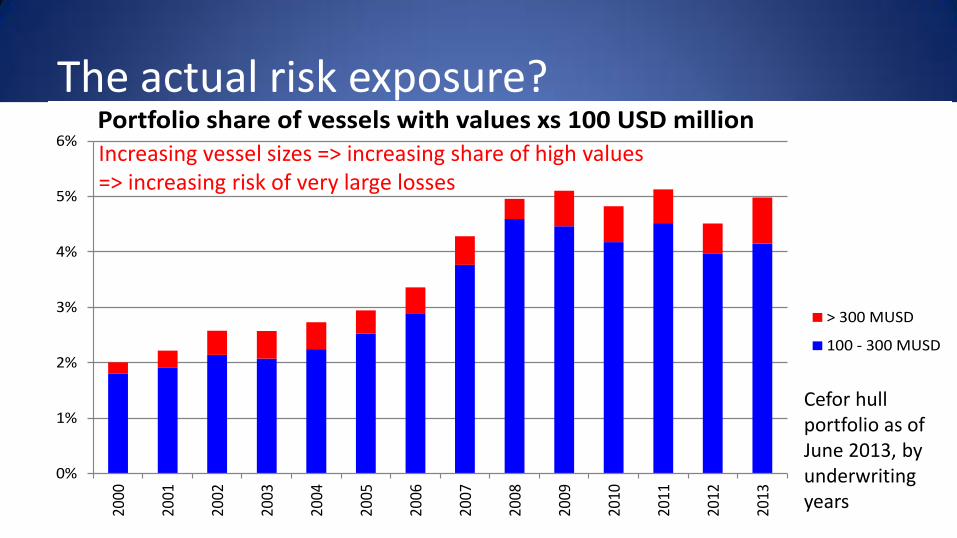
The actual risk exposure?
0%
1%
2%
3%
4%
5%
6%
2000
2001
2002
2003
2004
2005
2006
2007
2008
2009
2010
2011
2012
2013
Portfolio share of vessels with values xs 100 USD million
> 300 MUSD
100 - 300 MUSD
Increasing vessel sizes => increasing share of high values => increasing risk of very large losses
Cefor hull portfolio as of June 2013, by underwriting years
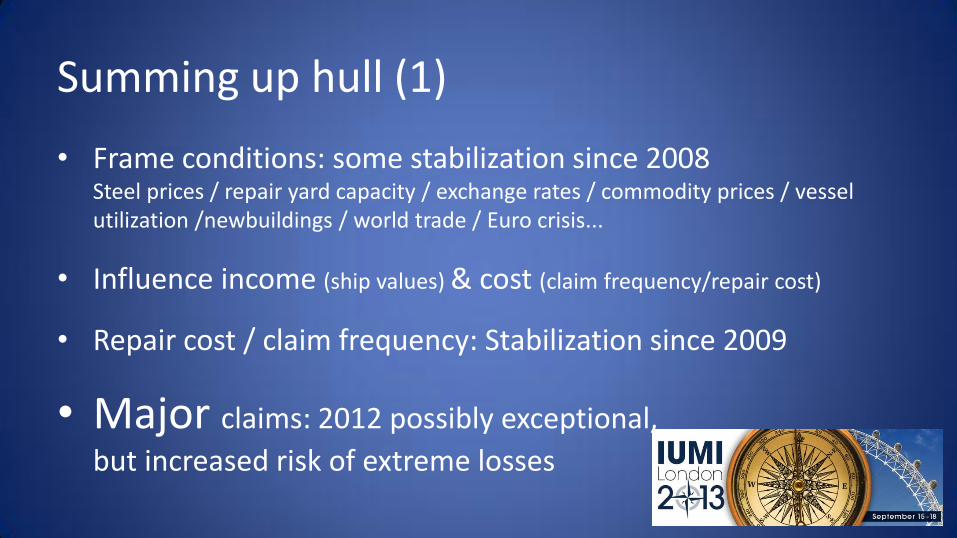
Summing up hull (1)
• Frame conditions: some stabilization since 2008 Steel prices / repair yard capacity / exchange rates / commodity prices / vessel utilization /newbuildings / world trade / Euro crisis...
• Influence income (ship values) & cost (claim frequency/repair cost)
• Repair cost / claim frequency: Stabilization since 2009
• Major claims: 2012 possibly exceptional,
but increased risk of extreme losses
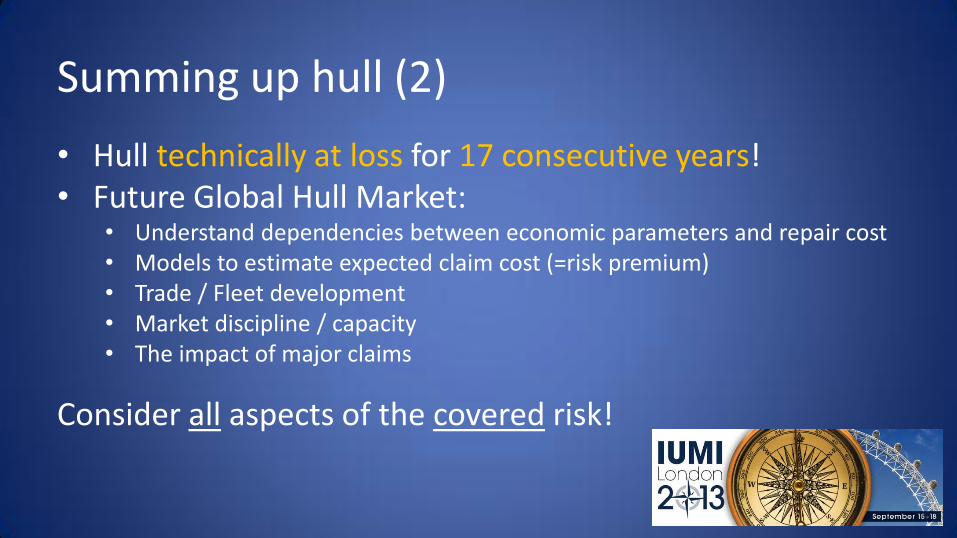
Summing up hull (2)
• Hull technically at loss for 17 consecutive years! • Future Global Hull Market:
• Understand dependencies between economic parameters and repair cost • Models to estimate expected claim cost (=risk premium) • Trade / Fleet development • Market discipline / capacity • The impact of major claims
Consider all aspects of the covered risk!
Global marine insurance report 2013
• Global marine insurance - overview
• Cargo - market & results (focus: Sandy)
• Hull - market & results (focus: Post Costa Concordia)
• Offshore energy - market & results
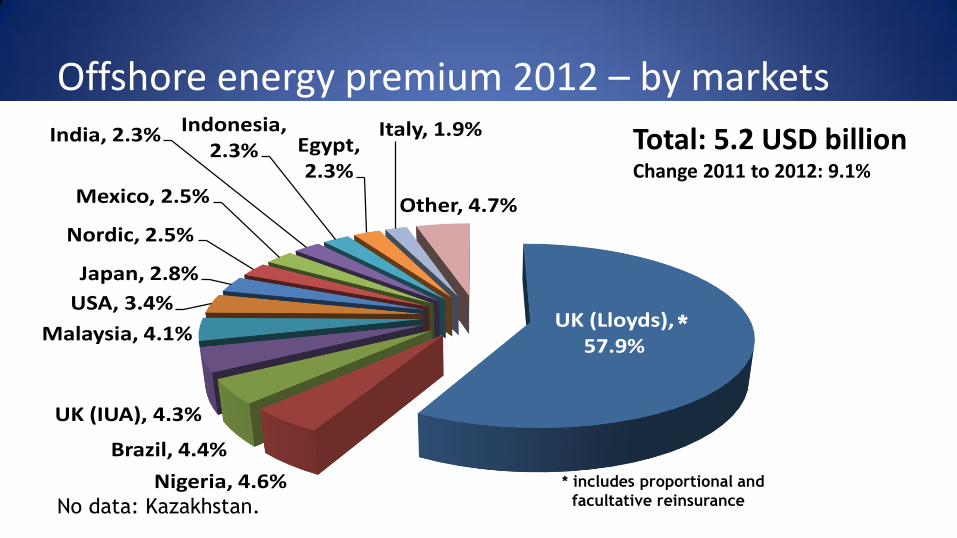
Offshore energy premium 2012 – by markets
UK (Lloyds), 57.9%
Nigeria, 4.6%
Brazil, 4.4%
UK (IUA), 4.3%
Malaysia, 4.1%
USA, 3.4%
Japan, 2.8%
Nordic, 2.5%
Mexico, 2.5%
India, 2.3% Indonesia, 2.3% Egypt,
2.3%
Italy, 1.9%
Other, 4.7%
2012
No data: Kazakhstan.
*
* includes proportional and
facultative reinsurance
Total: 5.2 USD billion Change 2011 to 2012: 9.1%
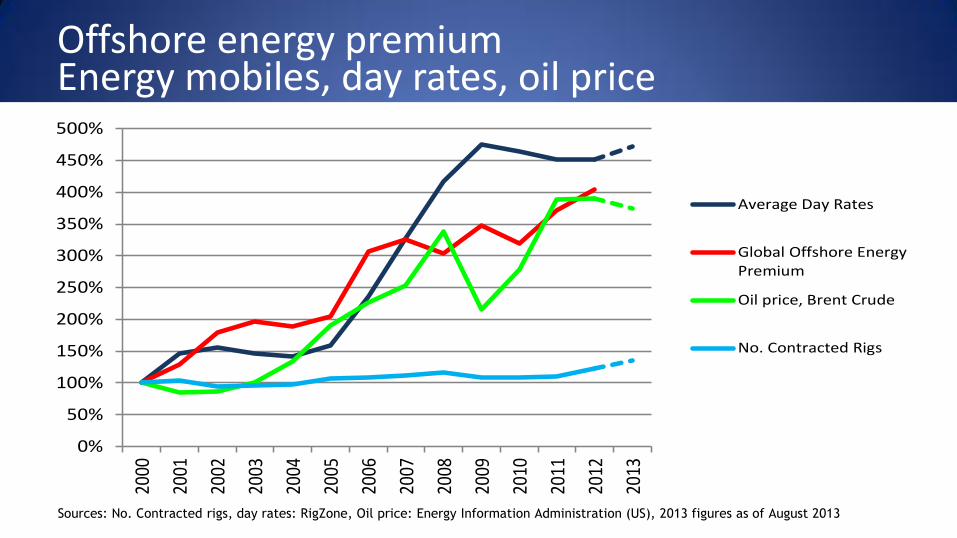
Offshore energy premium Energy mobiles, day rates, oil price
0%
50%
100%
150%
200%
250%
300%
350%
400%
450%
500%20
00
2001
2002
2003
2004
2005
2006
2007
2008
2009
2010
2011
2012
2013
Average Day Rates
Global Offshore EnergyPremium
Oil price, Brent Crude
No. Contracted Rigs
Sources: No. Contracted rigs, day rates: RigZone, Oil price: Energy Information Administration (US), 2013 figures as of August 2013
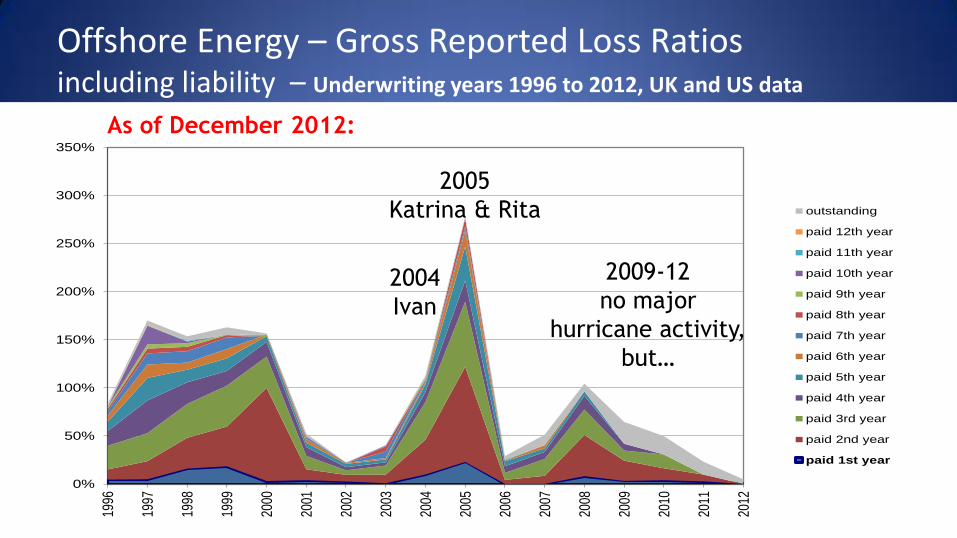
Offshore Energy – Gross Reported Loss Ratios
including liability – Underwriting years 1996 to 2012, UK and US data
0%
50%
100%
150%
200%
250%
300%
350%
1996
1997
1998
1999
2000
2001
2002
2003
2004
2005
2006
2007
2008
2009
2010
2011
2012
outstanding
paid 12th year
paid 11th year
paid 10th year
paid 9th year
paid 8th year
paid 7th year
paid 6th year
paid 5th year
paid 4th year
paid 3rd year
paid 2nd year
paid 1st year
2005
Katrina & Rita
2004
Ivan 2008
Ike
2009-12
no major
hurricane activity,
but…
As of December 2012:
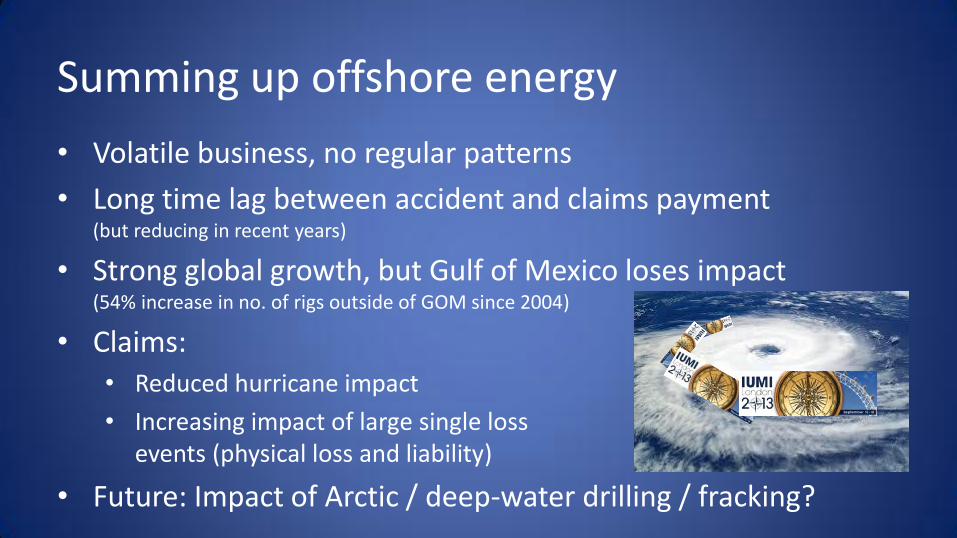
Summing up offshore energy
• Volatile business, no regular patterns
• Long time lag between accident and claims payment (but reducing in recent years)
• Strong global growth, but Gulf of Mexico loses impact (54% increase in no. of rigs outside of GOM since 2004)
• Claims: • Reduced hurricane impact
• Increasing impact of large single loss events (physical loss and liability)
• Future: Impact of Arctic / deep-water drilling / fracking?

Cooling down
• Find a suitable Shakespeare quote!
• IUMI and Olympics – what’s the link?
• Do you believe in statistics?
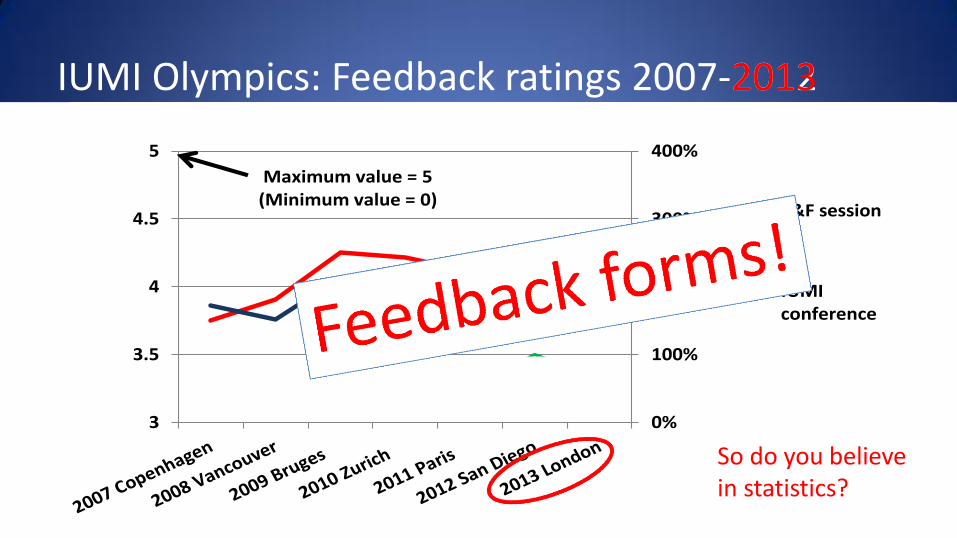
IUMI Olympics: Feedback ratings 2007-2012
0%
100%
200%
300%
400%
3
3.5
4
4.5
5
F&F session
IUMIconference
% of womenF&F speakers(right scale)
Maximum value = 5(Minimum value = 0)
?
2013
So do you believe in statistics?

The end. Thank you!
Visit Oslo «Munch 150» anniversary exhibition!
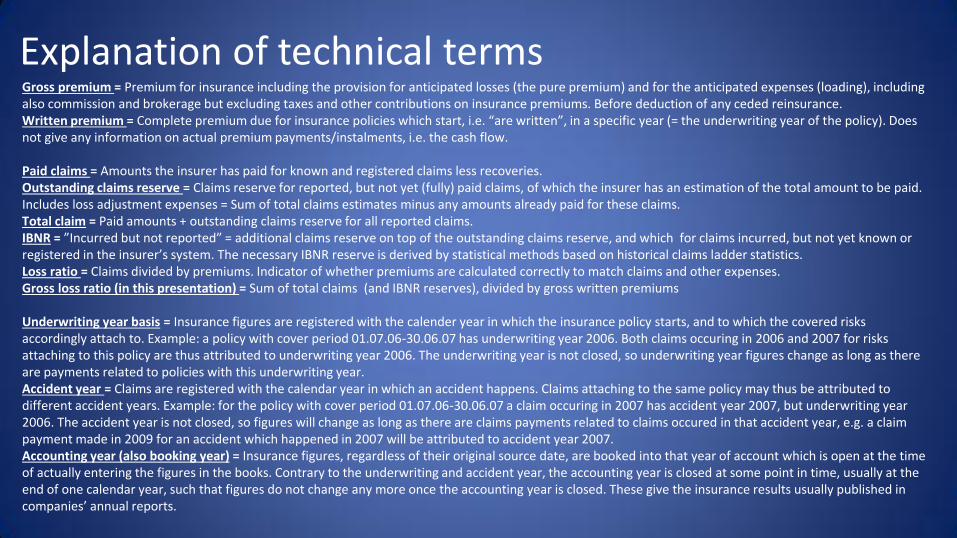
Explanation of technical terms Gross premium = Premium for insurance including the provision for anticipated losses (the pure premium) and for the anticipated expenses (loading), including also commission and brokerage but excluding taxes and other contributions on insurance premiums. Before deduction of any ceded reinsurance. Written premium = Complete premium due for insurance policies which start, i.e. “are written”, in a specific year (= the underwriting year of the policy). Does not give any information on actual premium payments/instalments, i.e. the cash flow. Paid claims = Amounts the insurer has paid for known and registered claims less recoveries. Outstanding claims reserve = Claims reserve for reported, but not yet (fully) paid claims, of which the insurer has an estimation of the total amount to be paid. Includes loss adjustment expenses = Sum of total claims estimates minus any amounts already paid for these claims. Total claim = Paid amounts + outstanding claims reserve for all reported claims. IBNR = ”Incurred but not reported” = additional claims reserve on top of the outstanding claims reserve, and which for claims incurred, but not yet known or registered in the insurer’s system. The necessary IBNR reserve is derived by statistical methods based on historical claims ladder statistics. Loss ratio = Claims divided by premiums. Indicator of whether premiums are calculated correctly to match claims and other expenses. Gross loss ratio (in this presentation) = Sum of total claims (and IBNR reserves), divided by gross written premiums Underwriting year basis = Insurance figures are registered with the calender year in which the insurance policy starts, and to which the covered risks accordingly attach to. Example: a policy with cover period 01.07.06-30.06.07 has underwriting year 2006. Both claims occuring in 2006 and 2007 for risks attaching to this policy are thus attributed to underwriting year 2006. The underwriting year is not closed, so underwriting year figures change as long as there are payments related to policies with this underwriting year. Accident year = Claims are registered with the calendar year in which an accident happens. Claims attaching to the same policy may thus be attributed to different accident years. Example: for the policy with cover period 01.07.06-30.06.07 a claim occuring in 2007 has accident year 2007, but underwriting year 2006. The accident year is not closed, so figures will change as long as there are claims payments related to claims occured in that accident year, e.g. a claim payment made in 2009 for an accident which happened in 2007 will be attributed to accident year 2007. Accounting year (also booking year) = Insurance figures, regardless of their original source date, are booked into that year of account which is open at the time of actually entering the figures in the books. Contrary to the underwriting and accident year, the accounting year is closed at some point in time, usually at the end of one calendar year, such that figures do not change any more once the accounting year is closed. These give the insurance results usually published in companies’ annual reports.

Global Marine Insurance Report
Astrid Seltmann Fact and Figures Committee: Analyst/Actuary, Cefor - The Nordic Association of Marine Insurers, Oslo

Recommended