ORIGINAL PAPER
Growth forms and age estimation of treeline species
Marco Caccianiga • Chiara Compostella
Received: 10 February 2011 / Revised: 27 June 2011 / Accepted: 8 July 2011 / Published online: 24 July 2011
� Springer-Verlag 2011
Abstract The correct evaluation of the age of small tree
individuals is of great importance in ecological studies, and
can be performed if growth units are identifiable even
under strong environmental constraints. We aimed to
assess the reliability of age evaluation of small individuals
of four species commonly occurring at the treeline in the
Alps and the Apennines (N Italy), Picea abies, Pinus
cembra, Larix decidua and Fagus sylvatica. A total of 224
individuals were sampled along an altitudinal gradient up
to the treeline. For each species, we assessed the growth
architecture and the appearance of annual growth units; for
each individual, age and evaluation uncertainty were esti-
mated. To verify the estimation a core or a cross-section
was obtained. The estimated age was compared with the
tree-ring age through linear regression and reduced chi
square test, and the estimation accuracy was evaluated
as function of tree age, dimension and environmental
parameters. A good estimation was possible for all species,
even when loss of vertical growth occurred. The highest
error occurred for Larix, the lowest for Pinus; the error was
generally correlated with tree age and dimension, and was
affected by altitude and geomorphology. Good reduced chi
square values were reached considering only the youngest
individuals for Fagus and Picea and the smallest for Fagus
and Larix; the uncertainty was generally underestimated
for Pinus. Even though reliable age estimation could be
obtained, a realistic and species-specific evaluation of the
estimation uncertainties is necessary to assess estimation
accuracy for ecological studies.
Keywords Age estimation � Alps � Apennines � Fagus
sylvatica � Larix decidua � Picea abies � Pinus cembra �Treeline � Tree architecture
Introduction
The correct evaluation of tree age is of great importance in
demographic studies of tree population. Although the most
accurate ageing method is cutting trees at the stem–root
interface (Peters et al. 2002; Batllori et al. 2009), this
destructive approach cannot be performed for many rea-
sons, particularly for extensive demographic analyses
requiring the ageing of entire populations. The extraction
of cores with an increment borer is a reliable, easily per-
formed and relatively non-destructive method, although
some problem may arise due to the occurrence of off-centre
cores, missing rings and to the difficult evaluation of the
error due to the height above ground of the coring
(McCarthy et al. 1991; Wong and Lertzman 2001; Peters
et al. 2002; Camarero and Gutierrez 2004). However, this
method cannot be used for small trees such as seedlings,
saplings and stunted individuals (krummholz); unfortu-
nately, these categories are of great importance in studies
dealing with the evaluation of present tree population
dynamics at the treeline, which often involve expanding
populations with many young individuals and/or krumm-
holz forming the upper species limit. Furthermore, the
correct assessment of the age of the small tree species
individuals occurring at the treeline is an important topic
Communicated by S. Mayr.
M. Caccianiga (&)
Dipartimento di Biologia, Universita degli studi di Milano,
Via Celoria 26, 20133 Milan, Italy
e-mail: [email protected]
C. Compostella
Dipartimento di Scienze della Terra, Universita degli studi di
Milano, Via Mangiagalli 34, 20133 Milan, Italy
123
Trees (2012) 26:331–342
DOI 10.1007/s00468-011-0595-1
for detecting the treeline type (abrupt, diffuse, krummholz),
which is appearing more and more important for the
assessment of treeline response to climate (Wiegand et al.
2006; Harsch et al. 2009).
The age of a tree individual could be assessed from its
external morphological appearance if its development fol-
lowed a constant, genetically determined model with rec-
ognizable annual growth units. The reconstruction of
growth models is the aim of tree architecture studies (Begin
and Filion 1999). One of the most successful of such
studies is known as the Halle-Oldeman or HO model (Halle
and Oldeman 1970; Halle et al. 1978; Bell 1991; Robinson
1996, 2000; Halle 2004); this model outlined the existence
of 23 main architectural models, which reflect the mor-
phology of actual trees as far as their growth is genetically
determined. If environmental constraints are predominant,
or with damage or old age, trees may deviate from these
models; however, even this deviation from the model can
be predictable as it involves the reiteration processes which
are again genetically determined (Robinson 1996).
The knowledge of the existence of regular growth pat-
terns has been used empirically to assess the age of conifer
seedlings and saplings by counting the number of inter-
nodes (whorls) or of bud scars along the main stem
(Hattenschwiler and Smith 1999; Caccianiga and Payette
2006; Batllori and Gutierrez 2008); Batllori et al. (2009)
evaluated the shift between the age estimated through this
method and the root-collar age for Pinus uncinata. The
developmental stages of Picea mariana from seedling to
maturity were described by Begin and Filion (1999) and
the influence of harsh environmental condition on the
development of the same species was outlined by Pereg
and Payette (1998) and Laberge et al. (2001). However, the
accuracy of age estimation based on the macroscopic
identification of annual growth units has not been sys-
tematically evaluated for species with different growth
patterns and architecture (particularly for broad-leaved
species), for different sapling ages and under different
environmental conditions.
The aim of this work was to assess the reliability of age
evaluation of small individuals (seedlings, saplings and
krummholz) belonging to four species commonly occurring
at the treeline on the Alps and Apennines: Picea abies (L.)
Karst., Pinus cembra L., Larix decidua Mill. and Fagus
sylvatica L. We compared the age assessed through the
observation of the external growth pattern of the tree with
that obtained from tree ring counting performed at the same
height along the stem. We also aimed to assess the influ-
ence of environmental parameters on tree growth patterns
and consequently on age estimation. Finally, we aimed to
find an age and/or dimensional threshold and resolution for
the possibility of a reliable age evaluation to be used in
population studies.
Methods
Studied species
Picea abies (L.) Karst (Pinaceae) (Norway spruce) is the
most important forest conifer in the Alps. Its distribution
includes northern and central Europe, Alps, Carpathians
and a limited area of the northern Apennines. In the Alps it
forms wide forests in the Subalpine and Montane belt in the
inner Alpine valleys and becomes less and less important in
the outer Alpine girdle (Pre-Alps) with oceanic climate.
(Mayer 1974). Its altitudinal distribution ranges between
c. 100 and 2,300 m a.s.l.; this species seldom forms the
treeline, even if stunted individuals could occur at high
altitude. Spruce can reproduce vegetatively by rooting of
lower branches (layering).
Pinus cembra (L.) (Pinaceae) (Swiss stone pine) grows
in the Alps and in the Carpathians. In the Alps, stone pine
is frequent in inner-alpine valleys with high climate con-
tinentality, where it often forms the treeline, reaching
2,500 m a.s.l. (Caccianiga et al. 2008).
Larix decidua Mill. (Pinaceae) (European larch) is
widespread in the Alps, where it forms open forest in the
upper Subalpine belt or behaves as an early successional
species on recently deglaciated terrains, landslides etc.
Larch can reach the treeline in pure stands or mixed with
Pinus cembra and, less frequently, Picea abies. It is the
main treeline species in absence of stone pine, e.g. in areas
with more or less oceanic climate.
Fagus sylvatica L. (Fagaceae) (European beech) is
distributed from southern Sweden, where it is a lowland
tree, to southern Italy, where it occupies an altitudinal belt
between 1,100 and 1,900 m. On the Alps and Northern
Apennines it grows from 900 to 1,800 m in almost pure
stands or mixed with silver fir (Abies alba) and, only on the
Alps, with Picea abies; it grows at the treeline where the
climate is markedly oceanic, as in the pre-Alps and in
the Apennines.
Sampling
Sampling was performed in three different areas in the
Italian Alps and northern Apennines: Valfurva (for Pinus
cembra and Picea abies), Valcamonica (for L. decidua)
and Tuscan-Emilian Apennines (for F. sylvatica); the
sampled species are those forming the treeline in the cor-
responding area.
Valfurva (46�250N–10�340E) is a lateral valley of upper
Valtellina (Rhaethian Alps). It is surrounded by the peaks
of the Ortles-Cevedale group (Gran Zebru 3,859 m; Monte
Cevedale 3,764 m) and comprises many minor valleys (Val
Zebru, Valle dei Forni, Valle del Gavia). Its uppermost part
is occupied by the Forni Glacier, the largest valley glacier
332 Trees (2012) 26:331–342
123
in Italy, and by many minor glaciers. The climate is con-
tinental: precipitations are scarce (855 mm/year at 1,730 m
a.s.l) and concentrated in summer. A closed forest domi-
nated by Picea abies and Pinus cembra is replaced above
2,200 m a.s.l. by open Pinus cembra stands (Caccianiga
et al. 2008).
Valcamonica (46�170N–10�290E) is separated from
Valtellina by the Gavia Pass (2,652 m); its climate is more
humid (1,410 mm/year at 1,820 m a.s.l.) and oceanic than
that of Valfurva because of the north–south orientation of
the main valley. Pinus cembra is very rare and dispersed in
the whole valley and absent in its uppermost part. Conif-
erous forests are represented by closed Picea abies-domi-
nated forests replaced by L. decidua open forests above
c. 1,800 m.
The Tuscan-Emilian Apennines (44�180N–10�230E)
reach their maximum altitude with Mt. Cimone (2,165 m)
and Mt. Cusna (2,120 m). The climate is sub-Mediterra-
nean with abundant and well distributed precipitation
(2,000 mm/year), with a summer minimum. Forest vege-
tation is characterized by closed deciduous forests domi-
nated by F. sylvatica (with subordinate Abies alba) up to
c. 1,700 m (Pezzi et al. 2008).
Sampling was performed along an altitudinal gradient
from below the forest limit to the local treeline, i.e. the
upper limit the tree growth form. Many threshold values for
the definition of tree have been proposed (Holtmeier 2003):
in this work ‘‘trees’’ are individuals with vertical growth
and [3 m tall.
Individuals with diameter \10 cm were chosen; the
sampled individuals were selected in order to have a wide
range of growth forms, substrate morphology and
vegetation.
A total of 224 individuals were sampled (54 Picea abies,
60 Pinus cembra, 55 L. decidua, 55 F. sylvatica) along
altitudinal transects (Table 1). The position of every indi-
vidual was registered through a portable GPS (Garmin
GPSMap 60cx) with an error \6 m; station data, geomor-
phology and vegetation type were reported. Each individ-
ual was described, reporting its dimension and growth
status. The growth model of each species was assessed;
the annual growth unit was visually identified from the
occurrence of whorls and/or of growth scars left by
the terminal bud and from changes in the appearance of the
bark. The value of such evidences was verified cutting
randomly chosen stems and branches at proximal and distal
position of the evidence. The age of each individual was
then estimated counting the annual units from the top to the
basis of the main stem. The kind of evidence chosen was
dependent on the specific growth model outlined for each
species. Two independent estimations were performed, and
the discrepancy was recorded as ‘‘estimation uncertainty’’
for further analysis (see following paragraph); such
uncertainty was increased by 1 year in the case of occur-
rence of dead stems and/or ambiguous evidences, like
possible false scars or intermediate whorls.
To verify age estimation performed as above, wherever
possible a core was extracted from the basis of the stem
with an increment borer; seedlings and saplings too small
to be cored were cut at the ground level. Multi-stemmed
(polycormic) individuals were sampled below lateral shoot
inception, except for few cases where a lateral shot was
sampled (Table 2). When multiple stems emerged from the
ground (Table 2), we sampled the oldest one as close as
possible to the ground level.
Cores or cross sections were obtained at the ground level
for 24 specimens (44.4%) for Picea abies, 36 (60%) for
Pinus cembra, 28 (50.9%) for L. decidua and 36 (65.4%)
for F. sylvatica, respectively. For the remaining samples,
the coring height was always lower than 30 cm (except for
two polycormic samples of Pinus cembra and one of Picea
abies sampled at about 40 cm on a lateral shoot) and lower
than 10 cm for 76.3% of the samples (Table 1). Whenever
the core could not be extracted from the ground level, tree
age was estimated only to the coring height in order to
always have a comparable age from tree ring counting and
visual estimation. The values obtained by ring counting
were referred to as ‘‘real age’’, which did not coincide with
total tree age when the sampling was performed above the
ground level.
Analyses
Cores and cross-sections were air-dried, finely sanded and
growth rings were counted. The number of missing rings
for off-center cores was estimated locating the pith from
the curvature of the inner ring and using the average
growth rate of the contiguous ring (five, if available, or
fewer) (Paulsen et al. 2000; Batllori and Gutierrez 2008).
The uncertainty of such estimation was put equal to the
number of missing rings; an additional uncertainty was
considered in case of extremely narrow rings and/or other
ambiguous evidences and the overall value was recorded as
‘‘ring count uncertainty’’ for further analysis.
The estimated age (x) was compared with the real age
(y) through linear regression; the slope of the regression
line and its r2 values were calculated cutting the dataset at
different age and dimension (height and diameter) thresh-
olds. The goodness of fit between our data and the theo-
retical y = x function was assessed through the reduced chi
square test (Taylor 1982), using estimation and ring count
uncertainties as x and y error, respectively. Values of
reduced chi square lower than 1.5 indicate a good fit;
however, values lower than 1 indicate an ‘‘overfitting’’, due
to error overestimation, meaning that the uncertainties in
the data are too large. Also the values of the reduced chi
Trees (2012) 26:331–342 333
123
square were calculated cutting the dataset at different age
and dimension thresholds.
The difference between the estimated and the real age
(estimation error) was transformed into absolute value and
its correlation with tree age and dimension was assessed by
Pearson’s correlation coefficient. The influence of indi-
vidual characteristics and of environmental data on the
reliability of the age estimation was assessed by ANOVA
and Tukey’s HSD tests. Analyses were performed with the
PASW Statistics 18.0 package (SPSS Inc., Chicago, IL,
USA).
Results
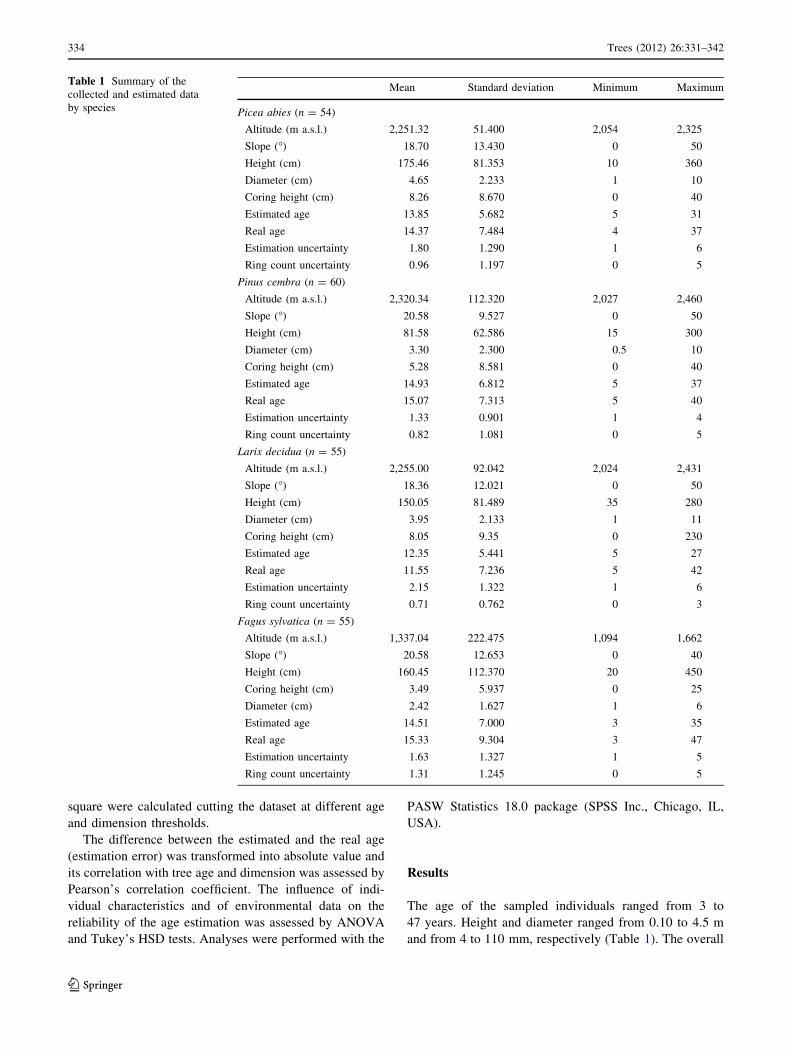
The age of the sampled individuals ranged from 3 to
47 years. Height and diameter ranged from 0.10 to 4.5 m
and from 4 to 110 mm, respectively (Table 1). The overall
Table 1 Summary of the
collected and estimated data
by species
Mean Standard deviation Minimum Maximum
Picea abies (n = 54)
Altitude (m a.s.l.) 2,251.32 51.400 2,054 2,325
Slope (�) 18.70 13.430 0 50
Height (cm) 175.46 81.353 10 360
Diameter (cm) 4.65 2.233 1 10
Coring height (cm) 8.26 8.670 0 40
Estimated age 13.85 5.682 5 31
Real age 14.37 7.484 4 37
Estimation uncertainty 1.80 1.290 1 6
Ring count uncertainty 0.96 1.197 0 5
Pinus cembra (n = 60)
Altitude (m a.s.l.) 2,320.34 112.320 2,027 2,460
Slope (�) 20.58 9.527 0 50
Height (cm) 81.58 62.586 15 300
Diameter (cm) 3.30 2.300 0.5 10
Coring height (cm) 5.28 8.581 0 40
Estimated age 14.93 6.812 5 37
Real age 15.07 7.313 5 40
Estimation uncertainty 1.33 0.901 1 4
Ring count uncertainty 0.82 1.081 0 5
Larix decidua (n = 55)
Altitude (m a.s.l.) 2,255.00 92.042 2,024 2,431
Slope (�) 18.36 12.021 0 50
Height (cm) 150.05 81.489 35 280
Diameter (cm) 3.95 2.133 1 11
Coring height (cm) 8.05 9.35 0 230
Estimated age 12.35 5.441 5 27
Real age 11.55 7.236 5 42
Estimation uncertainty 2.15 1.322 1 6
Ring count uncertainty 0.71 0.762 0 3
Fagus sylvatica (n = 55)
Altitude (m a.s.l.) 1,337.04 222.475 1,094 1,662
Slope (�) 20.58 12.653 0 40
Height (cm) 160.45 112.370 20 450
Coring height (cm) 3.49 5.937 0 25
Diameter (cm) 2.42 1.627 1 6
Estimated age 14.51 7.000 3 35
Real age 15.33 9.304 3 47
Estimation uncertainty 1.63 1.327 1 5
Ring count uncertainty 1.31 1.245 0 5
334 Trees (2012) 26:331–342
123
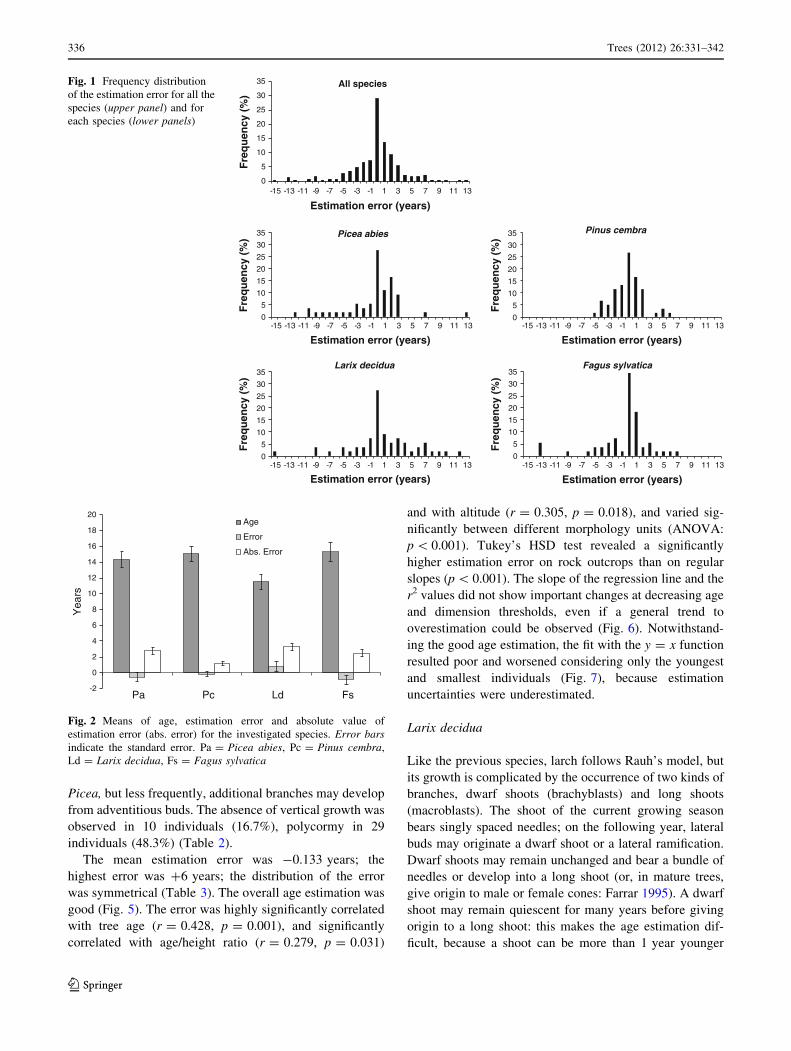
error in the estimation ranged from -15 to 13 years
(mean = -0.165; mode and median = 0, standard devia-
tion = 3.92) (Fig. 1) and its absolute value was signifi-
cantly lower for Pinus cembra than for L. decidua and
Picea abies (ANOVA test: p = 0.002 and p = 0.032,
respectively), while F. sylvatica did not show any signifi-
cant difference from the other species (Fig. 2). For all the
species, the absolute value of the error did not vary sig-
nificantly between monocormic and polycormic individuals
and between individuals with and without vertical growth
(ANOVA test).
Picea abies
All the axes show a monopodial, rhythmic growth (Fig. 3).
The main stem and the main branches are orthotropic, at
least in young trees and in the upper part of older indi-
viduals; afterwards, the main branches become almost
plagiotropic, particularly in their proximal part. The growth
model is thus somewhat intermediate between Rauh’s and
Massart’s models (modified Rauh’s model: Mougin et al.
1993). Within the age and dimension range of the studied
individuals most of the branches showed orthotropic
growth and typical Rauh’s model. The annual units are
well-marked by whorls originating from the subapical buds
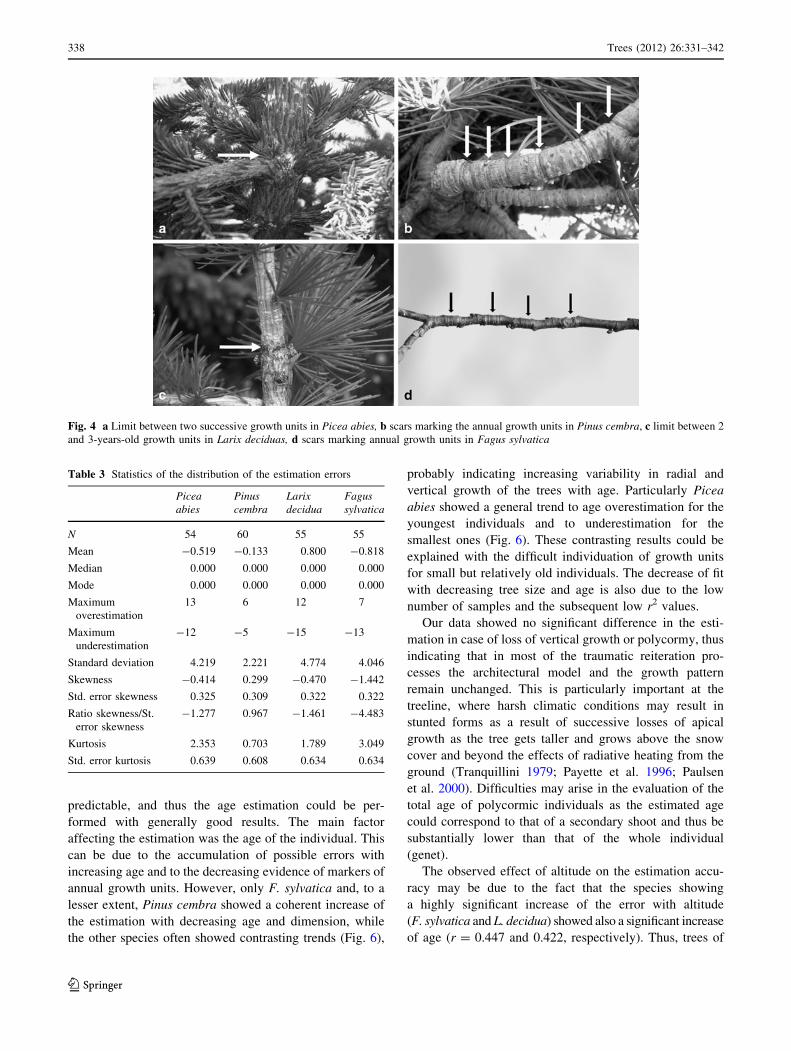
and by a more or less visible scar (Fig. 4). However, some
adventitious buds may originate additional twigs in the
middle of the annual growth (sylleptic growth), which can
be rather easily identified as they do not originate a whorl
and are not associated with a scar. With increasing age,
scars become less visible and whorl branches may die; their
traces tend to be covered by bark as the stem gets thicker.
Individuals growing in harsh environment generally
show loss of apical dominance, traumatic reiteration and
occurrence of more than one main stem (polycormy). The
complete loss of vertical growth was observed in only 3
individuals (5.6%), while polycormy occurred in 31 indi-
viduals (57.4%) (Table 2); traumatic reiteration seemed
thus to maintain the original architecture.
For Picea, the mean age estimation error was
-0.519 years (slight underestimation); the highest error
values were ?13 years and the distribution of the error was
generally symmetrical (Table 3). The correspondence
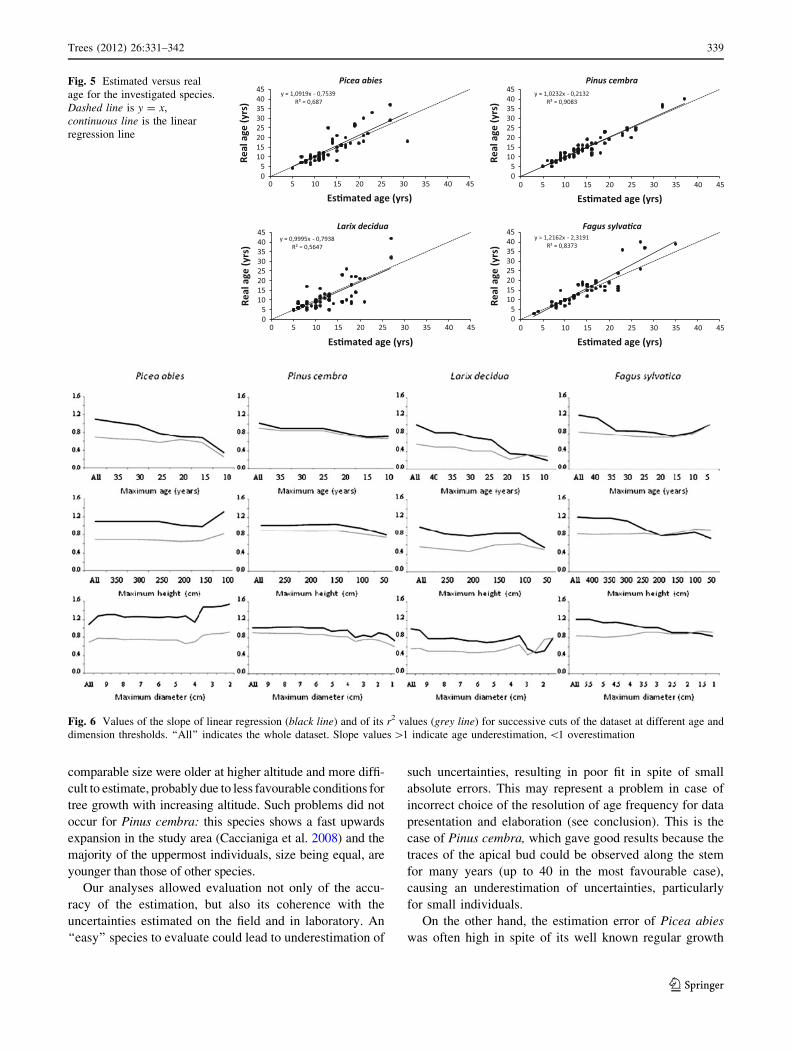
between the estimated and the real age was generally good
(Fig. 5). The estimation error was highly significantly
correlated with tree age (Pearson’s r = 0.630, p \ 0.001)
and age/diameter ratio. (r = 0.378, p = 0.005) but not
with tree dimension (height and diameter). The error varied
significantly between the different geomorphology units
(ANOVA test: p = 0.003): it was higher for individuals
growing on rock outcrops than for those on debris, regular
slopes and moraines (Tukey’s HSD test: p = 0.002, 0.012,
0.020, respectively). Cutting the dataset at decreasing age
thresholds (Fig. 6), the slope of the regression line fell
below 1 indicating a tendency to overestimation of the
youngest individuals. Such tendency was not apparent
cutting the dataset at decreasing dimensional (height and
diameter) thresholds: on the contrary, the age of the
smallest individuals appeared to be underestimated. The
overall fit with the y = x function was the best amongst
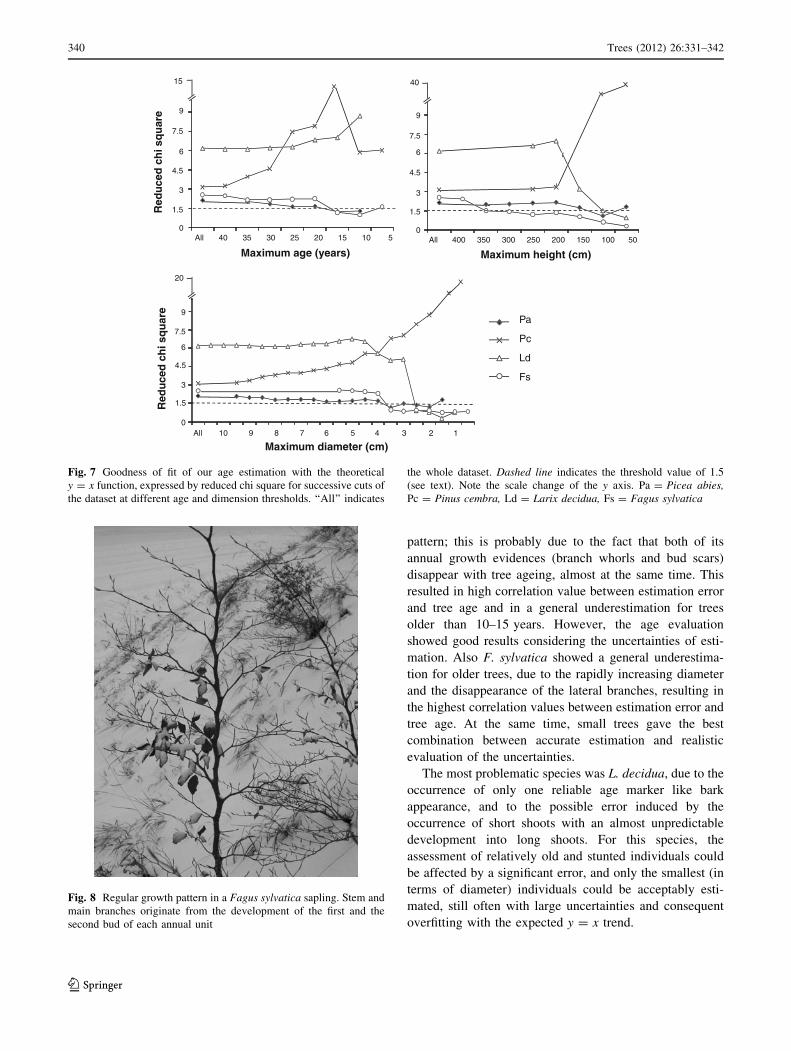
the investigated species: reduced chi square is equal to 2.1 and
drops below 1.5 for trees younger than 20 years (Fig. 7).
Pinus cembra
Pinus cembra develops according to the typical Rauh’s
model with orthotropic, monopodial axes (Fig. 3). With
senescence, the growth pattern becomes irregular as the
apical dominance becomes less evident and the crown
shape is altered by sylleptic reiterations, but the develop-
ment model remains the same, similar to what is observed
in other pine species such as Pinus pinea (Mutke et al.
2005). In young individuals, annual growth units are
clearly visible, both for the occurrence of whorls and for
the evident scar ahead the whorl of branches. The scar
remains visible for many years due to the thin and smooth
bark (Fig. 4), but an overestimation of age is made possible
by the occurrence of scar-like traces in the bark. Like
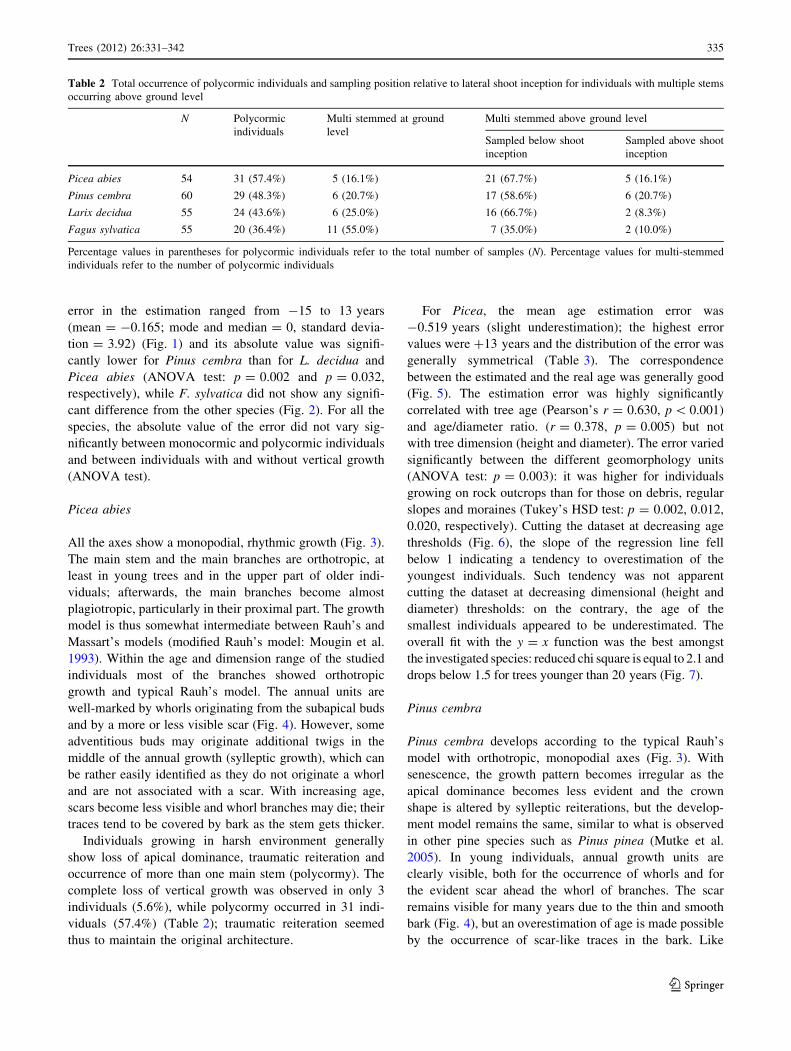
Table 2 Total occurrence of polycormic individuals and sampling position relative to lateral shoot inception for individuals with multiple stems
occurring above ground level
N Polycormic
individuals
Multi stemmed at ground
level
Multi stemmed above ground level
Sampled below shoot
inception
Sampled above shoot
inception
Picea abies 54 31 (57.4%) 5 (16.1%) 21 (67.7%) 5 (16.1%)
Pinus cembra 60 29 (48.3%) 6 (20.7%) 17 (58.6%) 6 (20.7%)
Larix decidua 55 24 (43.6%) 6 (25.0%) 16 (66.7%) 2 (8.3%)
Fagus sylvatica 55 20 (36.4%) 11 (55.0%) 7 (35.0%) 2 (10.0%)
Percentage values in parentheses for polycormic individuals refer to the total number of samples (N). Percentage values for multi-stemmed
individuals refer to the number of polycormic individuals
Trees (2012) 26:331–342 335
123
Picea, but less frequently, additional branches may develop
from adventitious buds. The absence of vertical growth was
observed in 10 individuals (16.7%), polycormy in 29
individuals (48.3%) (Table 2).
The mean estimation error was -0.133 years; the
highest error was ?6 years; the distribution of the error
was symmetrical (Table 3). The overall age estimation was
good (Fig. 5). The error was highly significantly correlated
with tree age (r = 0.428, p = 0.001), and significantly
correlated with age/height ratio (r = 0.279, p = 0.031)
and with altitude (r = 0.305, p = 0.018), and varied sig-
nificantly between different morphology units (ANOVA:
p \ 0.001). Tukey’s HSD test revealed a significantly
higher estimation error on rock outcrops than on regular
slopes (p \ 0.001). The slope of the regression line and the
r2 values did not show important changes at decreasing age
and dimension thresholds, even if a general trend to
overestimation could be observed (Fig. 6). Notwithstand-
ing the good age estimation, the fit with the y = x function
resulted poor and worsened considering only the youngest
and smallest individuals (Fig. 7), because estimation
uncertainties were underestimated.
Larix decidua
Like the previous species, larch follows Rauh’s model, but
its growth is complicated by the occurrence of two kinds of
branches, dwarf shoots (brachyblasts) and long shoots
(macroblasts). The shoot of the current growing season
bears singly spaced needles; on the following year, lateral
buds may originate a dwarf shoot or a lateral ramification.
Dwarf shoots may remain unchanged and bear a bundle of
needles or develop into a long shoot (or, in mature trees,
give origin to male or female cones: Farrar 1995). A dwarf
shoot may remain quiescent for many years before giving
origin to a long shoot: this makes the age estimation dif-
ficult, because a shoot can be more than 1 year younger
0
5
10
15
20
25
30
35
-15 -13 -11 -9 -7 -5 -3 -1 1 3 5 7 9 11 13
Fre
qu
ency
(%
)
Estimation error (years)
All species
0
5
10
15
20
25
30
35
-15 -13 -11 -9 -7 -5 -3 -1 1 3 5 7 9 11 13
Fre
qu
ency
(%
)
Estimation error (years)
Picea abies
0
5
10
15
20
25
30
35
-15 -13 -11 -9 -7 -5 -3 -1 1 3 5 7 9 11 13
Fre
qu
ency
(%
)
Estimation error (years)
Pinus cembra
0
5
10
15
20
25
30
35
-15 -13 -11 -9 -7 -5 -3 -1 1 3 5 7 9 11 13
Fre
qu
ency
(%
)
Estimation error (years)
Larix decidua
0
5
10
15
20
25
30
35
-15 -13 -11 -9 -7 -5 -3 -1 1 3 5 7 9 11 13
Fre
qu
ency
(%
)Estimation error (years)
Fagus sylvatica
Fig. 1 Frequency distribution
of the estimation error for all the
species (upper panel) and for
each species (lower panels)
-2
0
2
4
6
8
10
12
14
16
18
20
Pa Pc Ld Fs
Yea
rs
Age
Error
Abs. Error
Fig. 2 Means of age, estimation error and absolute value of
estimation error (abs. error) for the investigated species. Error barsindicate the standard error. Pa = Picea abies, Pc = Pinus cembra,
Ld = Larix decidua, Fs = Fagus sylvatica
336 Trees (2012) 26:331–342
123
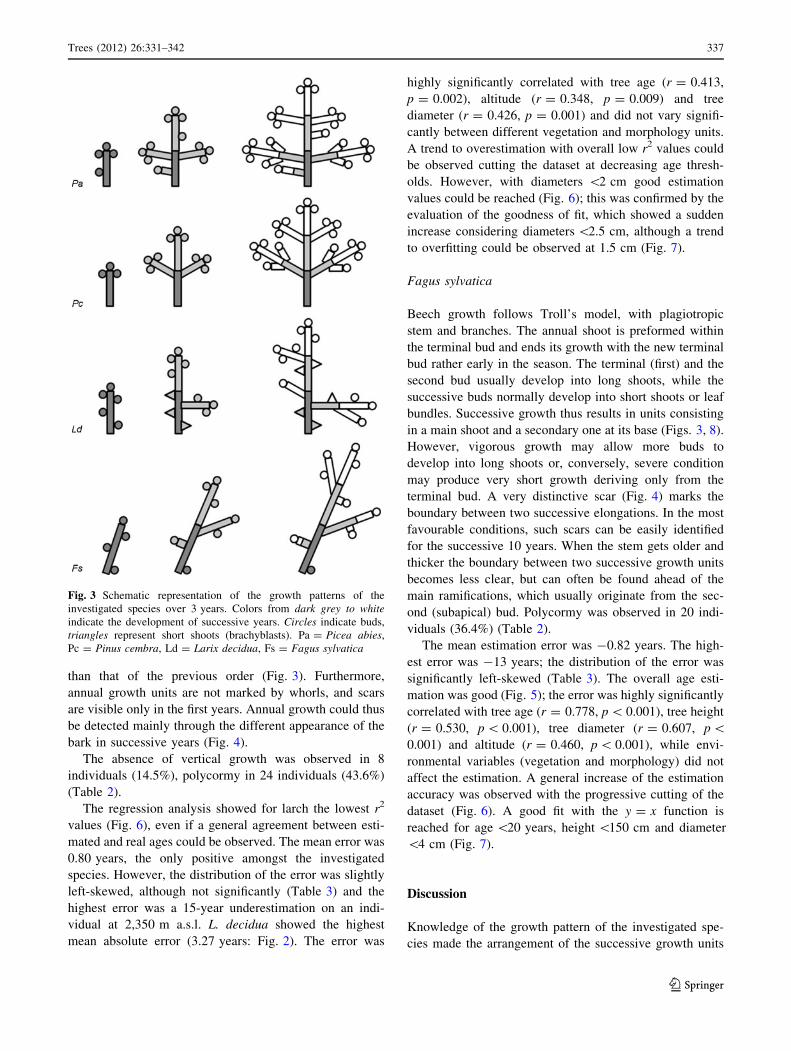
than that of the previous order (Fig. 3). Furthermore,
annual growth units are not marked by whorls, and scars
are visible only in the first years. Annual growth could thus
be detected mainly through the different appearance of the
bark in successive years (Fig. 4).
The absence of vertical growth was observed in 8
individuals (14.5%), polycormy in 24 individuals (43.6%)
(Table 2).
The regression analysis showed for larch the lowest r2
values (Fig. 6), even if a general agreement between esti-
mated and real ages could be observed. The mean error was
0.80 years, the only positive amongst the investigated
species. However, the distribution of the error was slightly
left-skewed, although not significantly (Table 3) and the
highest error was a 15-year underestimation on an indi-
vidual at 2,350 m a.s.l. L. decidua showed the highest
mean absolute error (3.27 years: Fig. 2). The error was
highly significantly correlated with tree age (r = 0.413,
p = 0.002), altitude (r = 0.348, p = 0.009) and tree
diameter (r = 0.426, p = 0.001) and did not vary signifi-
cantly between different vegetation and morphology units.
A trend to overestimation with overall low r2 values could
be observed cutting the dataset at decreasing age thresh-
olds. However, with diameters \2 cm good estimation
values could be reached (Fig. 6); this was confirmed by the
evaluation of the goodness of fit, which showed a sudden
increase considering diameters \2.5 cm, although a trend
to overfitting could be observed at 1.5 cm (Fig. 7).
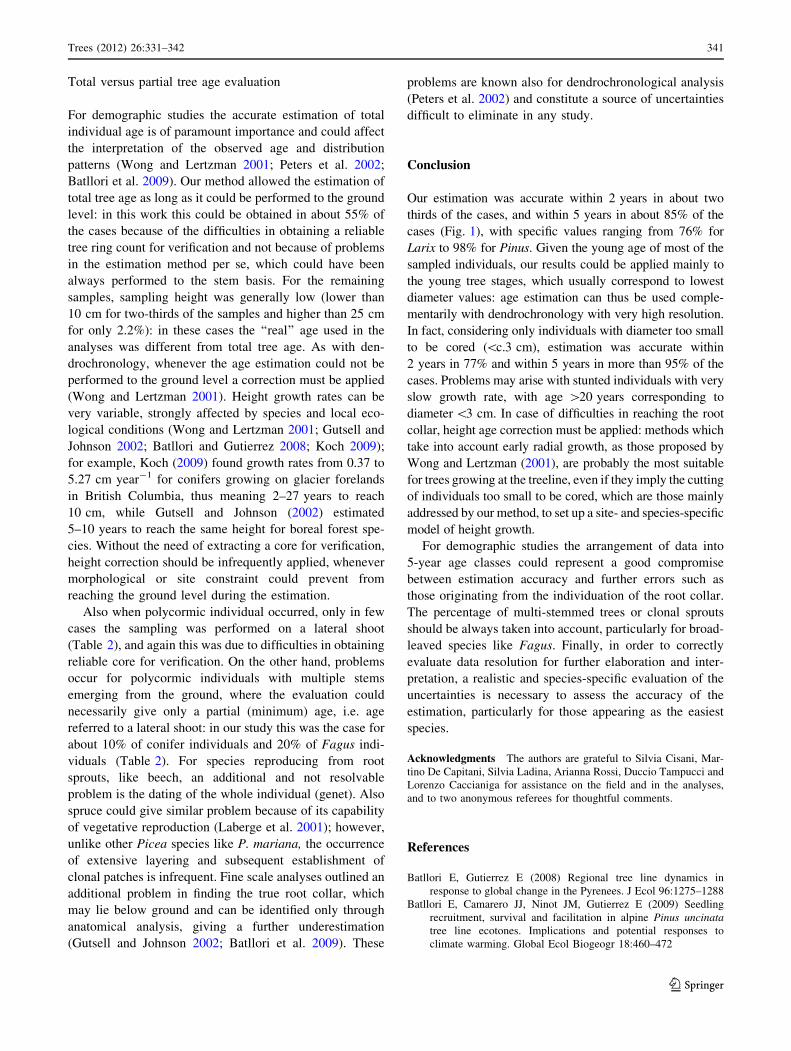
Fagus sylvatica
Beech growth follows Troll’s model, with plagiotropic
stem and branches. The annual shoot is preformed within
the terminal bud and ends its growth with the new terminal
bud rather early in the season. The terminal (first) and the
second bud usually develop into long shoots, while the
successive buds normally develop into short shoots or leaf
bundles. Successive growth thus results in units consisting
in a main shoot and a secondary one at its base (Figs. 3, 8).
However, vigorous growth may allow more buds to
develop into long shoots or, conversely, severe condition
may produce very short growth deriving only from the
terminal bud. A very distinctive scar (Fig. 4) marks the
boundary between two successive elongations. In the most
favourable conditions, such scars can be easily identified
for the successive 10 years. When the stem gets older and
thicker the boundary between two successive growth units
becomes less clear, but can often be found ahead of the
main ramifications, which usually originate from the sec-
ond (subapical) bud. Polycormy was observed in 20 indi-
viduals (36.4%) (Table 2).
The mean estimation error was -0.82 years. The high-
est error was -13 years; the distribution of the error was
significantly left-skewed (Table 3). The overall age esti-
mation was good (Fig. 5); the error was highly significantly
correlated with tree age (r = 0.778, p \ 0.001), tree height
(r = 0.530, p \ 0.001), tree diameter (r = 0.607, p \0.001) and altitude (r = 0.460, p \ 0.001), while envi-
ronmental variables (vegetation and morphology) did not
affect the estimation. A general increase of the estimation
accuracy was observed with the progressive cutting of the
dataset (Fig. 6). A good fit with the y = x function is
reached for age \20 years, height \150 cm and diameter
\4 cm (Fig. 7).
Discussion
Knowledge of the growth pattern of the investigated spe-
cies made the arrangement of the successive growth units
Fig. 3 Schematic representation of the growth patterns of the
investigated species over 3 years. Colors from dark grey to whiteindicate the development of successive years. Circles indicate buds,
triangles represent short shoots (brachyblasts). Pa = Picea abies,
Pc = Pinus cembra, Ld = Larix decidua, Fs = Fagus sylvatica
Trees (2012) 26:331–342 337
123
predictable, and thus the age estimation could be per-
formed with generally good results. The main factor
affecting the estimation was the age of the individual. This
can be due to the accumulation of possible errors with
increasing age and to the decreasing evidence of markers of
annual growth units. However, only F. sylvatica and, to a
lesser extent, Pinus cembra showed a coherent increase of
the estimation with decreasing age and dimension, while
the other species often showed contrasting trends (Fig. 6),
probably indicating increasing variability in radial and
vertical growth of the trees with age. Particularly Picea
abies showed a general trend to age overestimation for the
youngest individuals and to underestimation for the
smallest ones (Fig. 6). These contrasting results could be
explained with the difficult individuation of growth units
for small but relatively old individuals. The decrease of fit
with decreasing tree size and age is also due to the low
number of samples and the subsequent low r2 values.
Our data showed no significant difference in the esti-
mation in case of loss of vertical growth or polycormy, thus
indicating that in most of the traumatic reiteration pro-
cesses the architectural model and the growth pattern
remain unchanged. This is particularly important at the
treeline, where harsh climatic conditions may result in
stunted forms as a result of successive losses of apical
growth as the tree gets taller and grows above the snow
cover and beyond the effects of radiative heating from the
ground (Tranquillini 1979; Payette et al. 1996; Paulsen
et al. 2000). Difficulties may arise in the evaluation of the
total age of polycormic individuals as the estimated age
could correspond to that of a secondary shoot and thus be
substantially lower than that of the whole individual
(genet).
The observed effect of altitude on the estimation accu-
racy may be due to the fact that the species showing
a highly significant increase of the error with altitude
(F. sylvatica and L. decidua) showed also a significant increase
of age (r = 0.447 and 0.422, respectively). Thus, trees of
Fig. 4 a Limit between two successive growth units in Picea abies, b scars marking the annual growth units in Pinus cembra, c limit between 2
and 3-years-old growth units in Larix deciduas, d scars marking annual growth units in Fagus sylvatica
Table 3 Statistics of the distribution of the estimation errors
Piceaabies
Pinuscembra
Larixdecidua
Fagussylvatica
N 54 60 55 55
Mean -0.519 -0.133 0.800 -0.818
Median 0.000 0.000 0.000 0.000
Mode 0.000 0.000 0.000 0.000
Maximum
overestimation
13 6 12 7
Maximum
underestimation
-12 -5 -15 -13
Standard deviation 4.219 2.221 4.774 4.046
Skewness -0.414 0.299 -0.470 -1.442
Std. error skewness 0.325 0.309 0.322 0.322
Ratio skewness/St.
error skewness
-1.277 0.967 -1.461 -4.483
Kurtosis 2.353 0.703 1.789 3.049
Std. error kurtosis 0.639 0.608 0.634 0.634
338 Trees (2012) 26:331–342
123
comparable size were older at higher altitude and more diffi-
cult to estimate, probably due to less favourable conditions for
tree growth with increasing altitude. Such problems did not
occur for Pinus cembra: this species shows a fast upwards
expansion in the study area (Caccianiga et al. 2008) and the
majority of the uppermost individuals, size being equal, are
younger than those of other species.
Our analyses allowed evaluation not only of the accu-
racy of the estimation, but also its coherence with the
uncertainties estimated on the field and in laboratory. An
‘‘easy’’ species to evaluate could lead to underestimation of
such uncertainties, resulting in poor fit in spite of small
absolute errors. This may represent a problem in case of
incorrect choice of the resolution of age frequency for data
presentation and elaboration (see conclusion). This is the
case of Pinus cembra, which gave good results because the
traces of the apical bud could be observed along the stem
for many years (up to 40 in the most favourable case),
causing an underestimation of uncertainties, particularly
for small individuals.
On the other hand, the estimation error of Picea abies
was often high in spite of its well known regular growth
Fig. 5 Estimated versus real
age for the investigated species.
Dashed line is y = x,
continuous line is the linear
regression line
Fig. 6 Values of the slope of linear regression (black line) and of its r2 values (grey line) for successive cuts of the dataset at different age and
dimension thresholds. ‘‘All’’ indicates the whole dataset. Slope values [1 indicate age underestimation, \1 overestimation
Trees (2012) 26:331–342 339
123
pattern; this is probably due to the fact that both of its
annual growth evidences (branch whorls and bud scars)
disappear with tree ageing, almost at the same time. This
resulted in high correlation value between estimation error
and tree age and in a general underestimation for trees
older than 10–15 years. However, the age evaluation
showed good results considering the uncertainties of esti-
mation. Also F. sylvatica showed a general underestima-
tion for older trees, due to the rapidly increasing diameter
and the disappearance of the lateral branches, resulting in
the highest correlation values between estimation error and
tree age. At the same time, small trees gave the best
combination between accurate estimation and realistic
evaluation of the uncertainties.
The most problematic species was L. decidua, due to the
occurrence of only one reliable age marker like bark
appearance, and to the possible error induced by the
occurrence of short shoots with an almost unpredictable
development into long shoots. For this species, the
assessment of relatively old and stunted individuals could
be affected by a significant error, and only the smallest (in
terms of diameter) individuals could be acceptably esti-
mated, still often with large uncertainties and consequent
overfitting with the expected y = x trend.
0
1.5
3
4.5
6
7.5
9
All 40 35 30 25 20 15 10 5
Red
uce
d c
hi s
qu
are
Maximum age (years)
0
1.5
3
4.5
6
7.5
9
All 400 350 300 250 200 150 100 50
Maximum height (cm)
0
1.5
3
4.5
6
7.5
9
Maximum diameter (cm)All 10 9 8 7 6 5 4 3 2 1
15 40
20
Red
uce
d c
hi s
qu
are
Pa
Pc
Ld
Fs
Fig. 7 Goodness of fit of our age estimation with the theoretical
y = x function, expressed by reduced chi square for successive cuts of
the dataset at different age and dimension thresholds. ‘‘All’’ indicates
the whole dataset. Dashed line indicates the threshold value of 1.5
(see text). Note the scale change of the y axis. Pa = Picea abies,Pc = Pinus cembra, Ld = Larix decidua, Fs = Fagus sylvatica
Fig. 8 Regular growth pattern in a Fagus sylvatica sapling. Stem and
main branches originate from the development of the first and the
second bud of each annual unit
340 Trees (2012) 26:331–342
123
Total versus partial tree age evaluation
For demographic studies the accurate estimation of total
individual age is of paramount importance and could affect
the interpretation of the observed age and distribution
patterns (Wong and Lertzman 2001; Peters et al. 2002;
Batllori et al. 2009). Our method allowed the estimation of
total tree age as long as it could be performed to the ground
level: in this work this could be obtained in about 55% of
the cases because of the difficulties in obtaining a reliable
tree ring count for verification and not because of problems
in the estimation method per se, which could have been
always performed to the stem basis. For the remaining
samples, sampling height was generally low (lower than
10 cm for two-thirds of the samples and higher than 25 cm
for only 2.2%): in these cases the ‘‘real’’ age used in the
analyses was different from total tree age. As with den-
drochronology, whenever the age estimation could not be
performed to the ground level a correction must be applied
(Wong and Lertzman 2001). Height growth rates can be
very variable, strongly affected by species and local eco-
logical conditions (Wong and Lertzman 2001; Gutsell and
Johnson 2002; Batllori and Gutierrez 2008; Koch 2009);
for example, Koch (2009) found growth rates from 0.37 to
5.27 cm year-1 for conifers growing on glacier forelands
in British Columbia, thus meaning 2–27 years to reach
10 cm, while Gutsell and Johnson (2002) estimated
5–10 years to reach the same height for boreal forest spe-
cies. Without the need of extracting a core for verification,
height correction should be infrequently applied, whenever
morphological or site constraint could prevent from
reaching the ground level during the estimation.
Also when polycormic individual occurred, only in few
cases the sampling was performed on a lateral shoot
(Table 2), and again this was due to difficulties in obtaining
reliable core for verification. On the other hand, problems
occur for polycormic individuals with multiple stems
emerging from the ground, where the evaluation could
necessarily give only a partial (minimum) age, i.e. age
referred to a lateral shoot: in our study this was the case for
about 10% of conifer individuals and 20% of Fagus indi-
viduals (Table 2). For species reproducing from root
sprouts, like beech, an additional and not resolvable
problem is the dating of the whole individual (genet). Also
spruce could give similar problem because of its capability
of vegetative reproduction (Laberge et al. 2001); however,
unlike other Picea species like P. mariana, the occurrence
of extensive layering and subsequent establishment of
clonal patches is infrequent. Fine scale analyses outlined an
additional problem in finding the true root collar, which
may lie below ground and can be identified only through
anatomical analysis, giving a further underestimation
(Gutsell and Johnson 2002; Batllori et al. 2009). These
problems are known also for dendrochronological analysis
(Peters et al. 2002) and constitute a source of uncertainties
difficult to eliminate in any study.
Conclusion
Our estimation was accurate within 2 years in about two
thirds of the cases, and within 5 years in about 85% of the
cases (Fig. 1), with specific values ranging from 76% for
Larix to 98% for Pinus. Given the young age of most of the
sampled individuals, our results could be applied mainly to
the young tree stages, which usually correspond to lowest
diameter values: age estimation can thus be used comple-
mentarily with dendrochronology with very high resolution.
In fact, considering only individuals with diameter too small
to be cored (\c.3 cm), estimation was accurate within
2 years in 77% and within 5 years in more than 95% of the
cases. Problems may arise with stunted individuals with very
slow growth rate, with age [20 years corresponding to
diameter \3 cm. In case of difficulties in reaching the root
collar, height age correction must be applied: methods which
take into account early radial growth, as those proposed by
Wong and Lertzman (2001), are probably the most suitable
for trees growing at the treeline, even if they imply the cutting
of individuals too small to be cored, which are those mainly
addressed by our method, to set up a site- and species-specific
model of height growth.
For demographic studies the arrangement of data into
5-year age classes could represent a good compromise
between estimation accuracy and further errors such as
those originating from the individuation of the root collar.
The percentage of multi-stemmed trees or clonal sprouts
should be always taken into account, particularly for broad-
leaved species like Fagus. Finally, in order to correctly
evaluate data resolution for further elaboration and inter-
pretation, a realistic and species-specific evaluation of the
uncertainties is necessary to assess the accuracy of the
estimation, particularly for those appearing as the easiest
species.
Acknowledgments The authors are grateful to Silvia Cisani, Mar-
tino De Capitani, Silvia Ladina, Arianna Rossi, Duccio Tampucci and
Lorenzo Caccianiga for assistance on the field and in the analyses,
and to two anonymous referees for thoughtful comments.
References
Batllori E, Gutierrez E (2008) Regional tree line dynamics in
response to global change in the Pyrenees. J Ecol 96:1275–1288
Batllori E, Camarero JJ, Ninot JM, Gutierrez E (2009) Seedling
recruitment, survival and facilitation in alpine Pinus uncinatatree line ecotones. Implications and potential responses to
climate warming. Global Ecol Biogeogr 18:460–472
Trees (2012) 26:331–342 341
123
Begin C, Filion L (1999) Black spruce (Picea mariana) architecture.
Can J Bot 77:664–672
Bell AD (1991) Plant form. An illustrated guide to flowering plant
morphology. Oxford University Press, Oxford
Caccianiga M, Payette S (2006) Recent advance of white spruce
(Picea glauca) in the coastal tundra of the eastern shore of
Hudson Bay (Quebec, Canada). J Biogeogr 33:2120–2135
Caccianiga M, Andreis C, Armiraglio S, Leonelli G, Pelfini M, Sala D
(2008) Climate continentality and treeline species distribution in
the Alps. Plant Biosyst 142:66–78
Camarero JJ, Gutierrez E (2004) Pace and pattern of recent treeline
dynamics: response of ecotones to climatic variability in the
Spanish Pyrenees. Clim Change 63:181–200
Farrar JL (1995) Trees of the Northern United States and Canada.
Iowa State University Press, Iowa
Gutsell SL, Johnson EA (2002) Accurately ageing trees and
examining their height-growth rates: implications for interpret-
ing forest dynamics. J Ecol 90:153–166
Halle F (2004) Architectures des plantes. JPC Editions
Halle F, Oldeman RAA (1970) Essai sur l’architecture et la dynamique de
croissance des arbres tropicaux. Masson et Cie, Paris
Halle F, Oldeman RAA, Tomlinson PB (1978) Tropical trees and
forests. An architectural analysis. Springer, Berlin
Harsch MA, Hulme PE, McGlone MS, Duncan RP (2009) Are
treelines advancing? A global meta-analysis of treeline response
to climate warming. Ecol Lett 12:1040–1049
Hattenschwiler S, Smith WK (1999) Seedling occurrence in alpine
treeline conifers: a case study from the central Rocky Mountains,
USA. Acta Oecol 20:219–224
Holtmeier FK (2003) Mountain timberlines. Ecology, patchiness, and
dynamics. Advances in global change research, volume 14.
Kluwer, Dordrecht
Koch J (2009) Improving age estimates for late Holocene glacial
landforms using dendrochronology—Some examples from Gar-
ibaldi Provincial Park, British Columbia. Quater Geochronol
4(2009):130–139
Laberge MJ, Payette S, Pitre N (2001) Development of stunted black
spruce (Picea mariana) clones in the subarctic environment: a
dendro-architectural analysis. Ecoscience 8:489–498
Mayer H (1974) Walder der Ostalpenraumes. Gustav Fischer, Jena
McCarthy DP, Luckman BH, Kelly PE (1991) Sampling height-age
error correction for spruce seedlings in glacial forefields,
Canadian Cordillera. Arct Alp Res 23:451–455
Mougin E, Lopes A, Karam MA, Fung AK (1993) Effect of tree
structure on X-band microwave signature of conifers. IEEE T
Geosci Remote 31:655–667
Mutke S, Sievanen R, Nikinmaa E, Perttunen J, Gil L (2005) Crown
architecture of grafted stone pine (Pinus pinea L.): shoot growth
and bud differentiation. Trees Struct Funct 19:15–25
Paulsen J, Weber UM, Korner C (2000) Tree growth near treeline:
abrupt or gradual reduction with altitude? Arct Antarct Alp Res
32:14–20
Payette S, Delwaide A, Morneau C, Lavoie C (1996) Patterns of tree
stem decline along a snow-drift gradient at treeline: a case study
using stem analysis. Can J Bot 74:1671–1683
Pereg D, Payette S (1998) Development of black spruce growth forms
at treeline. Plant Ecol 138:137–147
Peters VS, Macdonald SE, Dale MRT (2002) Aging discrepancies of
white spruce affect the interpretation of static age structure in
boreal mixedwoods. Can J For Res 32:1496–1501
Pezzi G, Ferrari C, Corazza M (2008) The altitudinal limit of beech
woods in the Northern Apennines (Italy). Its spatial patterns and
some thermal inferences. Folia Geobot 43:443–459
Robinson DF (1996) A symbolic framework for the description of tree
architecture models. Bot J Linn Soc 121:243–261
Taylor JR (1982) An introduction to error analysis. The study of
uncertainties in physical measurements. University Science
Books, Sausalito
Tranquillini W (1979) Physiological ecology of the alpine timberline.
Springer, Berlin
Wiegand T, Camarero JJ, Ruger N, Gutierrez E (2006) Abrupt
population changes in treeline ecotones along smooth gradients.
J Ecol 94:880–892
Wong CM, Lertzman KP (2001) Errors in estimating tree age:
implications for studies of stand dynamics. Can J For Res
31:1262–1271
342 Trees (2012) 26:331–342
123
Recommended