Health Enterprise Zones and Infant Mortality in Maryland
April 9, 2014
Carlessia A. Hussein, RN, DrPHDirector
Office of Minority Health and Health DisparitiesMaryland Department of Health and Mental Hygiene
1

Maryland is One of the Most Racial/Ethnic Diverse States
45% minority
4 jurisdictions>50% minority
6 jurisdictions >40% minority
9 jurisdictions>33% minority
Out of 24 jurisdictions
2

Disparities by Race/Ethnic Group
Selected Racial and Ethnic Health Disparities in Maryland(Shows how many times higher the minority rate is compared to the White rate)
3

Unadjusted ED Visit Rates per 100,000 for Diabetes, by County, Black vs. White, Maryland 2011
Dorcheste
r
Queen Anne's
Worce
ster
Wico
mico
Carolin
e Kent
Talbot
Baltimore City
St. M
ary's
Anne Aru
ndel
Baltimore
Calvert
State
Of M
aryland
Harford
Cecil
Charles
Frederic
k
Carroll
Wash
ington
Somerset
Montg
omery
Prince
Georg
e's
Howard
Allegany
Garrett
0
200
400
600
800
1000
1200
1400
1600
Black White
Maryland
Both Place and Race Matter to this rate

Hospital Admission Rate Disparities Black vs. White
• For Ambulatory Care Sensitive Conditions (or AHRQ Prevention Quality Indicators) for Maryland:
• Kid’s Asthma: Black rate is 3.1 times higher• Adult Asthma: Black rate is 2.7 times higher• Adult Hypertension: 4.5 times higher• Adult Congest Heart Fail 2.6 times higher• Various Diabetes metrics 2.6x to 4.6 x
higher• (data from AHRQ State Snapshots as presented in the
MHQCC Health Disparities Workgroup Report)5

Cost of Disparities in Maryland
• Minority Health Disparities cost Maryland between 1 and 2 Billion Dollars per year of direct medical costs.
• Excess charges from Black/White hospitalization disparities alone were $814 Million in 2011.– These are just the hospital charges, NOT including
physician fees for hospital care, emergency department charges, or any outpatient costs.
6

Maryland Health Disparities Workgroup
• Convened by Maryland Health Quality and Cost Council in 2011 (Council chaired by Lt. Gov Brown and Sec Sharfstein)
• Workgroup Chaired by Dean Reece of U of MD School of Medicine, included diverse experts on minority health
• Maryland Office of Minority Health and Health Disparities staffed workgroup and co-drafted Final Report in 2012
• Report Recommendations:• Health Enterprise Zones (HEZs)• Maryland Health Innovation Prize• Racial and Ethnic tracking of health care delivery performance
7

Report Implementation
• Legislature passed Maryland Health Improvement and Disparities Reduction Act of 2012 based on the Report
• Administration funded HEZ program with $ 4 million per year for four years beginning in 2013
• State Health Department and the Community Health Resources Commission oversee implementation
• Five HEZs were designated in January 2013
8

Maryland Health Improvement & Disparities Reduction Act of 2012
• Health Enterprise Zones• Racial / ethnic data from insurers (MHCC)• Racial / ethnic data for incentive programs: • Hospital incentives (HSCRC)• Patient-Centered Medical Homes (MHCC)
• Hospitals report efforts to reduce Disparities• Health education institutions report efforts• Cultural competency workgroup of Health
Quality and Cost Council9

10

Health Enterprise Zones: Definition and Eligibility
• A Health Enterprise Zone was defined in law as– A contiguous area of one or more zip codes– Experiencing documented poor health outcomes
and health disparities– Experiencing documented economic disadvantage
• Operationalized eligibility as– Bottom 50% on one of two poverty metrics, AND– Bottom 50% on one of two poor health metrics
11

Health Enterprise Zones:Provider Incentives
• HEZ enabling legislation provides various statutory incentives for providers in the Zones:– State income tax credits– Hiring tax credits– Grants for equipment purchase or lease– Loan repayment assistance programs
• These are contingent on– Participating in cultural competency training– Accepting Medicaid and uninsured patients– Participating with the Coordinating Organization 12

Health Enterprise Zones:Community Intervention
• HEZ enabling legislation provides grants for community-level public health interventions:– Deploying community health workers– Increasing availability of fresh fruits and vegetables– Improving access to safe physical activity– Transportation assistance programs– Mobile crisis teams for mental health– Providing cultural competency training– Supporting community coalitions
13

Health Enterprise Zones:Principles for Proposals
• HEZ call for proposals contained 13 principles that doubled as proposal review criteria.
• Several key principles were:– Cultural, linguistic, and health literacy competency– Workforce diversity– Outreach and targeting of minority populations– Racial, ethnic & language data collection/reporting– Addressing social determinants of health– Balance between provider and community focus
14

Health Enterprise Zones:Progress and Future
• Five HEZs designated in January of 2013• To date, 43 new health providers of various
types hired in the zones• Cultural competency training assistance
• Programmatic technical assistance
• Quarterly reporting on productivity and quality
• External evaluation contract to be established15

Infant Mortality in Maryland: DEMO Programs
• MHHD is currently funding 3 pilot Minority Health Disparities Reduction Demonstration Grant (DEMO) sites for minority infant mortality in FY 2014
• DEMO Programs utilize: – Minority Perinatal Navigators, CHWs, and health promoters; – Community coalitions and taskforces; – Increased community outreach and education;– Enhancement of clinical services;– Infrastructure for Program Sustainability;– Inter-county collaboration.
16

Infant Mortality in Maryland: General Background
• Racial and Ethnic Breakdown of births and infant deaths, Maryland 2012
17
2012 Births % total Deaths % total Death rate *
White 42,791 59% 174 38% 4.1
Black 24,306 33% 251 55% 10.3
Hispanic 10,201 14% 56 12% 5.5
Asian 5,430 7% 21 5% 3.9
Amer Ind 164 0% 1 0% 6.1 **
* Infant deaths per 1000 live births, the Infant Mortality Rate**American Indian rate varies greatly year to year due to small numbers

Infant Mortality Reductionin Maryland
2005 2006 2007 2008 2009 2010 2011 2012 20130.0
5.0
10.0
15.0
20.0
25.0
Maryland Infant Mortality Rates, 2006-2012, by Race, Maryland Vital Statis-tics Administration
Maryland Black Linear (Maryland Black)Maryland White Linear (Maryland White)
Deat
hs p
er 1
,000
Live
Birt
hs Black
White
18

Racial/Ethnic Population in Delaware
33.7% minority
2 jurisdictions>33% minority
Out of 3 jurisdictions
19
Racial or Ethnic Minority Population, by Jurisdiction, Delaware, 2010
% Minority
New Castle 37.5%
Kent 33.4%
Sussex 23.5%
Delaware 33.7%

Infant Mortality in Delaware: General Background
• Racial and Ethnic Breakdown of births and infant deaths, Delaware 5-Year Average, 2006-2011
20
2006-2011 Births % total Deaths % total Death rate *
White 7,818 68% 46 51% 5.9
Black 3,140 27% 42 46% 14.2
Other Race 598 5% 3 3% 5.2
* Infant deaths per 1000 live births, the Infant Mortality Rate

Infant Mortality Reductionin Delaware
21
2003 2004 2005 2006 2007 2008 2009 2010 2011 20120.0
5.0
10.0
15.0
20.0
25.0
Delaware Infant Mortality Rates, 2004-2011, by Race, Delaware Vital Statistics Administration
Delaware White Linear (Delaware White)Delaware Black Linear (Delaware Black)
Deat
hs p
er 1
,000
Live
Birt
hs
White
Black

Disparities Reduction Principles
HEZs DEMO Program
Community coalitions Community coalitions and taskforces
Community health workers and workforce diversity
Minority Perinatal Navigators, CHWs, and health promoters
Outreach and targeting of minority populations
Increased community outreach and education
Addressing social determinants of health Linkage to community resources
Provider Incentives (tax credits, loan repayment)
Enhancement of clinical services
Evaluation and Sustainability Infrastructure for Program Sustainability
Chronic Disease Utilization Chronic Disease and Infant Mortality
22

Linkages to Maryland HEZsDEMO PROGRAMS
Shared logic model and common operational design features
HEZsLow Birth Weight is used in designation of HEZs & HEZs may choose to target Infant Mortality
INFANT MORTALITY
Programs develop locally-targeted strategies for reducing infant mortality within a community
23
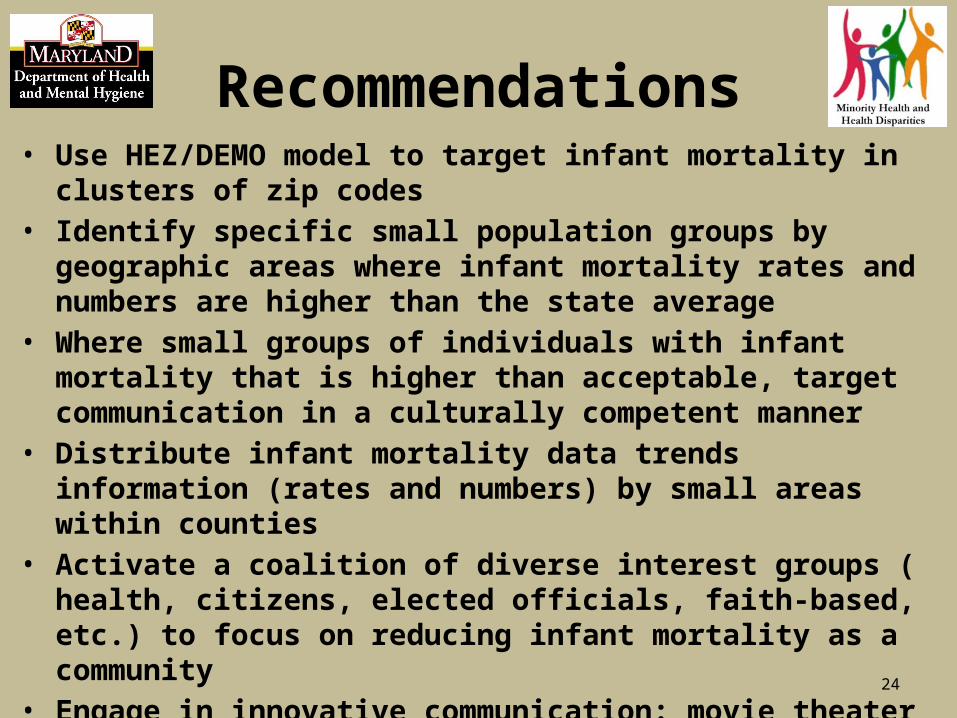
Recommendations
24
• Use HEZ/DEMO model to target infant mortality in clusters of zip codes• Identify specific small population groups by geographic areas where
infant mortality rates and numbers are higher than the state average• Where small groups of individuals with infant mortality that is higher
than acceptable, target communication in a culturally competent manner
• Distribute infant mortality data trends information (rates and numbers) by small areas within counties
• Activate a coalition of diverse interest groups ( health, citizens, elected officials, faith-based, etc.) to focus on reducing infant mortality as a community
• Engage in innovative communication: movie theater ads, Man/Boys support groups, sports and entertainment personalities, grandma/senior citizen groups, etc.
Important LinksHealth Disparities Planhttp://dhmh.maryland.gov/mhhd/Documents/Health%20Disparities%20Plan%202010.pdf
Health Disparities Workgroup Final Reporthttp://www.governor.maryland.gov/ltgovernorn/documents/disparitiesreport120117.pdf
Cultural Competency Workgroup Reporthttp://dhmh.maryland.gov/mhgcc/SiteAssets/SitePAges/meetings/Cult%20Comp%20Full%20Report%2012.13.pdf
Maryland Chartbook of Minority Health and Minority Health Disparities Datahttp://dhmh.maryland.gov/mhhd/Documents/Maryland-API-Data-Report-2013.pdf
25

Contact Information
Office of Minority Health and Health DisparitiesMaryland Department of Health and Mental Hygiene
201 West Preston Street, Room 500Baltimore, Maryland 21201
Phone: 410-767-7117Fax: 410-333-7525
Website: www.dhmh.maryland.gov/mhhdFacebook: www.facebook.com/MarylandmhhdTwitter: @MarylandDHMHEmail: [email protected]
26
Recommended