Henkel
Q2 2016
Hans Van Bylen, CEO
Carsten Knobel, CFO
Düsseldorf, August 11, 2016
2
Disclaimer
This information contains forward-looking statements which are based on current estimates
and assumptions made by the corporate management of Henkel AG & Co. KGaA.
Statements with respect to the future are characterized by the use of words such as “expect”,
“intend”, “plan”, “anticipate”, “believe”, “estimate”, and similar terms. Such statements are not
to be understood as in any way guaranteeing that those expectations will turn out to be
accurate. Future performance and results actually achieved by Henkel AG & Co. KGaA and
its affiliated companies depend on a number of risks and uncertainties and may therefore
differ materially from the forward-looking statements. Many of these factors are outside
Henkel's control and cannot be accurately estimated in advance, such as the future economic
environment and the actions of competitors and others involved in the marketplace. Henkel
neither plans nor undertakes to update any forward-looking statements. This document has
been issued for information purposes only and is not intended to constitute an investment
advice or an offer to sell, or a solicitation of an offer to buy, any securities.
Q2 2016 – Henkel Investor & Analyst CallAugust 11, 2016
3
Agenda
Q2 2016 – Henkel Investor & Analyst CallAugust 11, 2016
1.
3.
Key developments Q2 2016
Financials Q2 2016
Summary & outlook FY 2016
2.
4
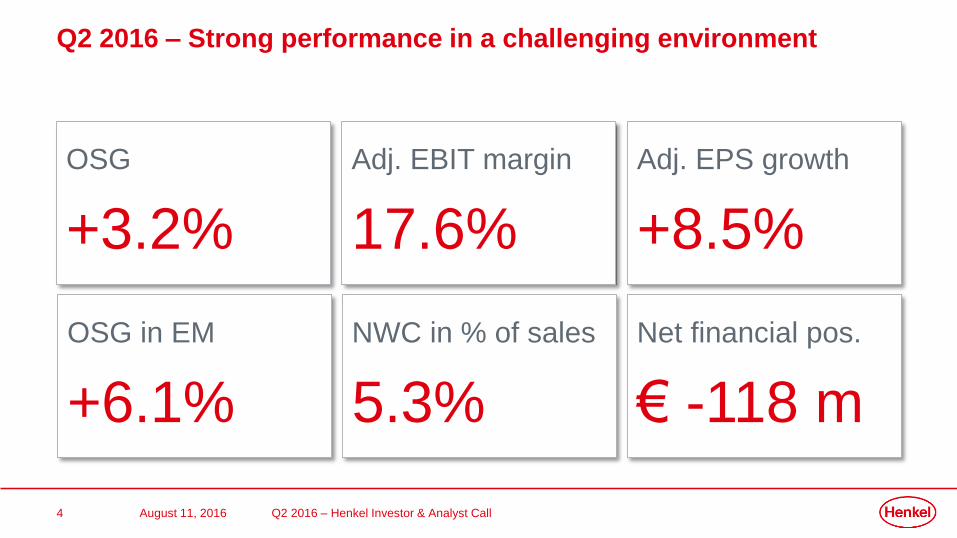
Q2 2016 – Strong performance in a challenging environment
Q2 2016 – Henkel Investor & Analyst CallAugust 11, 2016
OSG
+3.2%
Adj. EPS growth
+8.5%
Adj. EBIT margin
17.6%
NWC in % of sales
5.3%
Net financial pos.
€ -118 m
OSG in EM
+6.1%
5
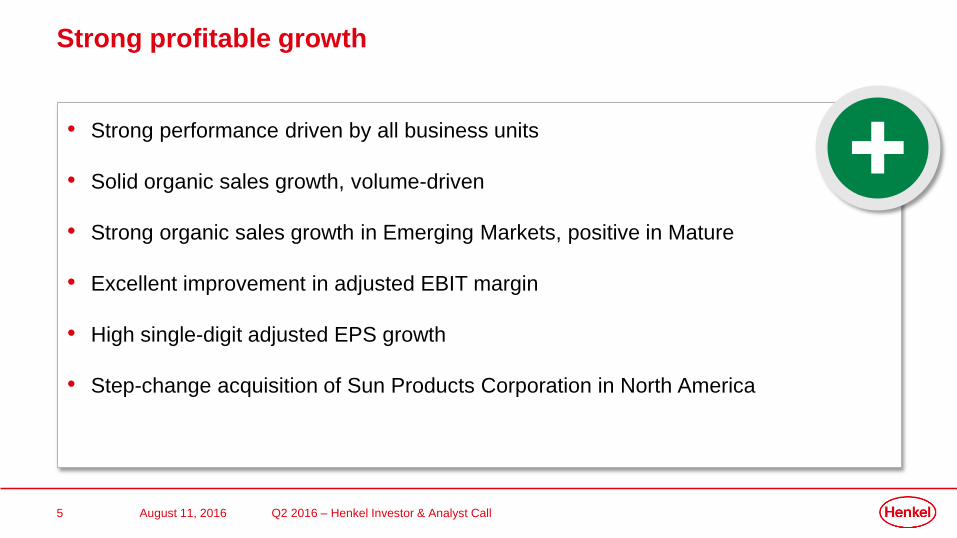
• Strong performance driven by all business units
• Solid organic sales growth, volume-driven
• Strong organic sales growth in Emerging Markets, positive in Mature
• Excellent improvement in adjusted EBIT margin
• High single-digit adjusted EPS growth
• Step-change acquisition of Sun Products Corporation in North America
Strong profitable growth
Q2 2016 – Henkel Investor & Analyst CallAugust 11, 2016
6
• Geo-political instability and macro-economic volatility in some countries
• Global GDP growth on a moderate level with slowing growth dynamics
• Intensified FX headwinds in key currencies
• Persisting macroeconomic headwind still impacting Adhesive Technologies
demand in China
Increasingly challenging environment
Q2 2016 – Henkel Investor & Analyst CallAugust 11, 2016
7
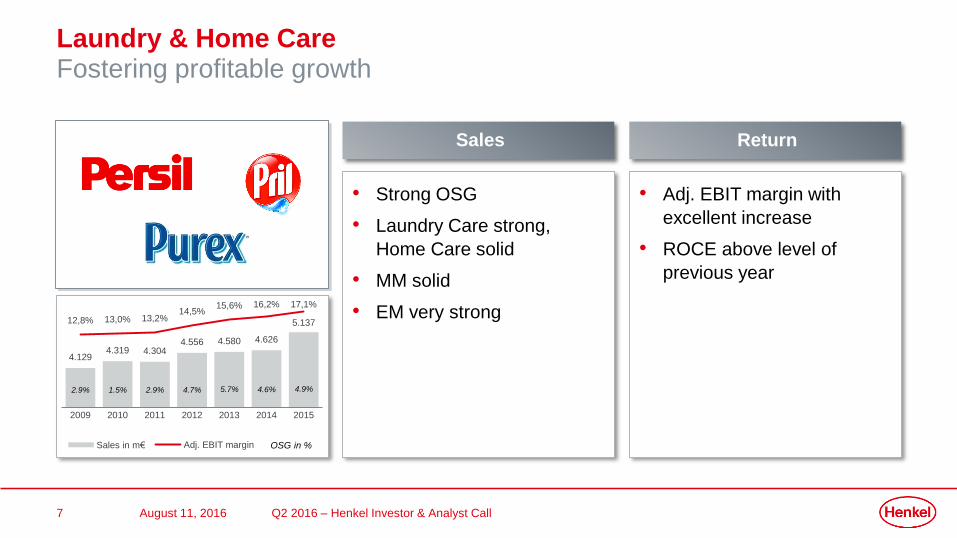
Laundry & Home CareFostering profitable growth
Q2 2016 – Henkel Investor & Analyst CallAugust 11, 2016
• Strong OSG
• Laundry Care strong,
Home Care solid
• MM solid
• EM very strong
Sales
• Adj. EBIT margin with
excellent increase
• ROCE above level of
previous year
Return
4.1294.319 4.304
4.556 4.580 4.626
5.13712,8% 13,0% 13,2%14,5%
15,6% 16,2% 17,1%
2009 2010 2011 2012 2013 2014 2015
Sales in m€ Adj. EBIT margin OSG in %
2.9% 1.5% 2.9% 4.7% 5.7% 4.6% 4.9%
8 Q2 2016 – Henkel Investor & Analyst CallAugust 11, 2016
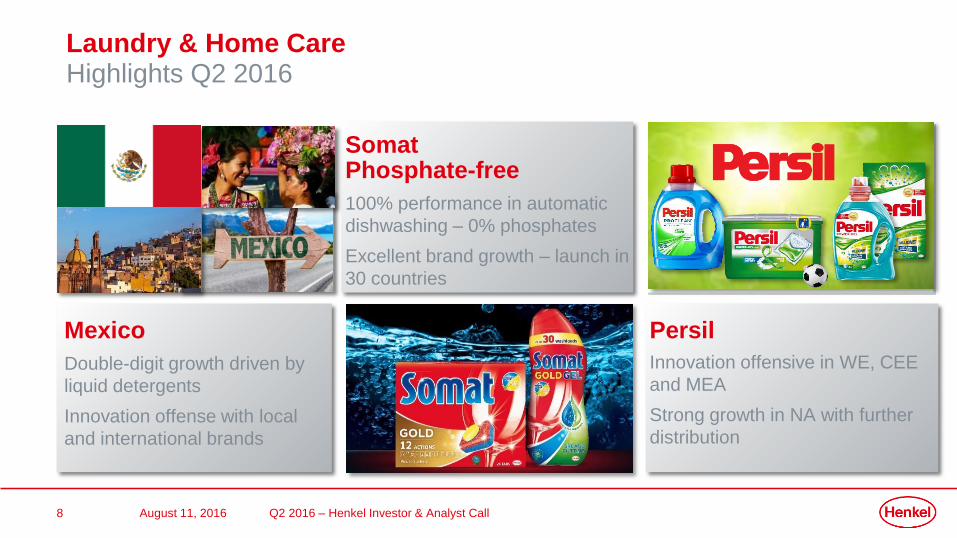
Laundry & Home CareHighlights Q2 2016
Mexico
Double-digit growth driven by
liquid detergents
Innovation offense with local
and international brands
SomatPhosphate-free
100% performance in automatic
dishwashing – 0% phosphates
Excellent brand growth – launch in
30 countries
Persil
Innovation offensive in WE, CEE
and MEA
Strong growth in NA with further
distribution
9
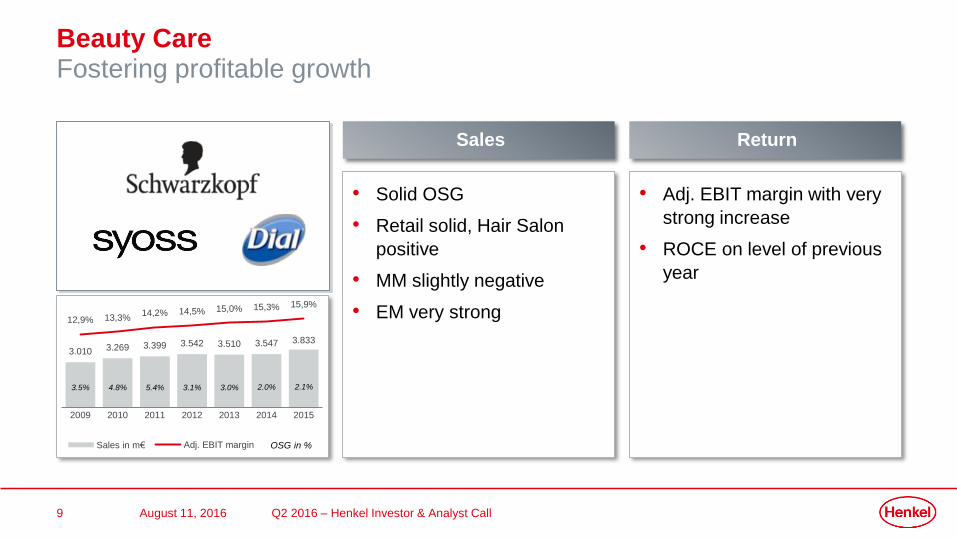
Beauty CareFostering profitable growth
Q2 2016 – Henkel Investor & Analyst CallAugust 11, 2016
Sales Return
3.010 3.269 3.399 3.542 3.510 3.547 3.833
12,9% 13,3%14,2% 14,5% 15,0% 15,3% 15,9%
2009 2010 2011 2012 2013 2014 2015
Sales in m€ Adj. EBIT margin OSG in %
3.5% 4.8% 5.4% 3.1% 3.0% 2.0% 2.1%
• Solid OSG
• Retail solid, Hair Salon
positive
• MM slightly negative
• EM very strong
• Adj. EBIT margin with very
strong increase
• ROCE on level of previous
year
10
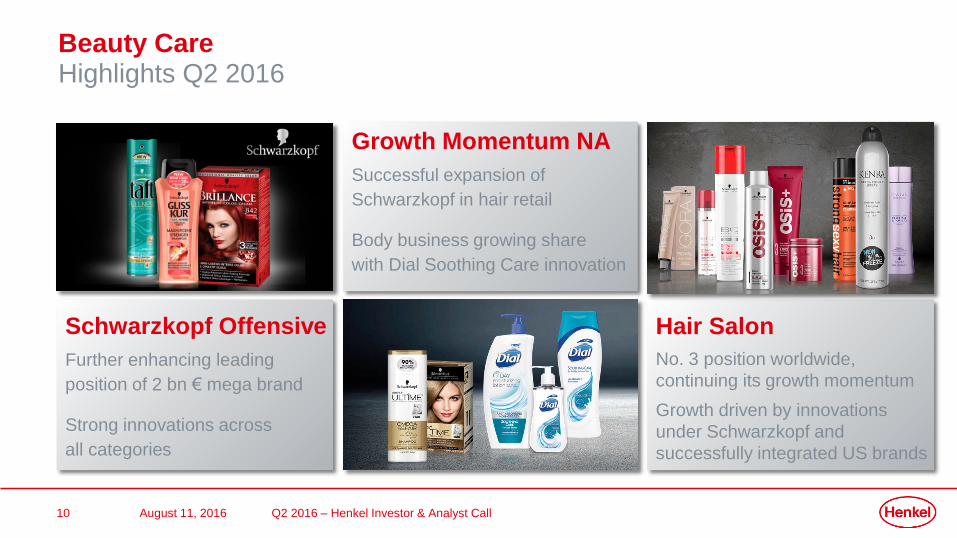
Beauty CareHighlights Q2 2016
August 11, 2016 Q2 2016 – Henkel Investor & Analyst Call
Schwarzkopf Offensive
Further enhancing leading
position of 2 bn € mega brand
Strong innovations across
all categories
Growth Momentum NA
Successful expansion of
Schwarzkopf in hair retail
Body business growing share
with Dial Soothing Care innovation
Hair Salon
No. 3 position worldwide,
continuing its growth momentum
Growth driven by innovations
under Schwarzkopf and
successfully integrated US brands
11
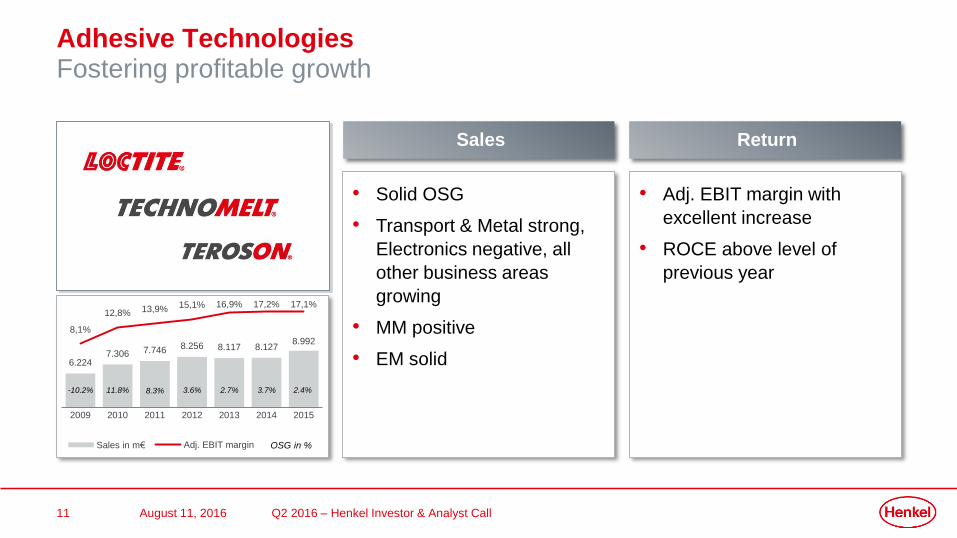
Adhesive TechnologiesFostering profitable growth
Q2 2016 – Henkel Investor & Analyst CallAugust 11, 2016
Sales Return
6.2247.306 7.746 8.256 8.117 8.127
8.992
8,1%
12,8% 13,9% 15,1% 16,9% 17,2% 17,1%
2009 2010 2011 2012 2013 2014 2015
Sales in m€ Adj. EBIT margin OSG in %
-10.2% 11.8% 8.3% 3.6% 2.7% 3.7% 2.4%
• Solid OSG
• Transport & Metal strong,
Electronics negative, all
other business areas
growing
• MM positive
• EM solid
• Adj. EBIT margin with
excellent increase
• ROCE above level of
previous year
12
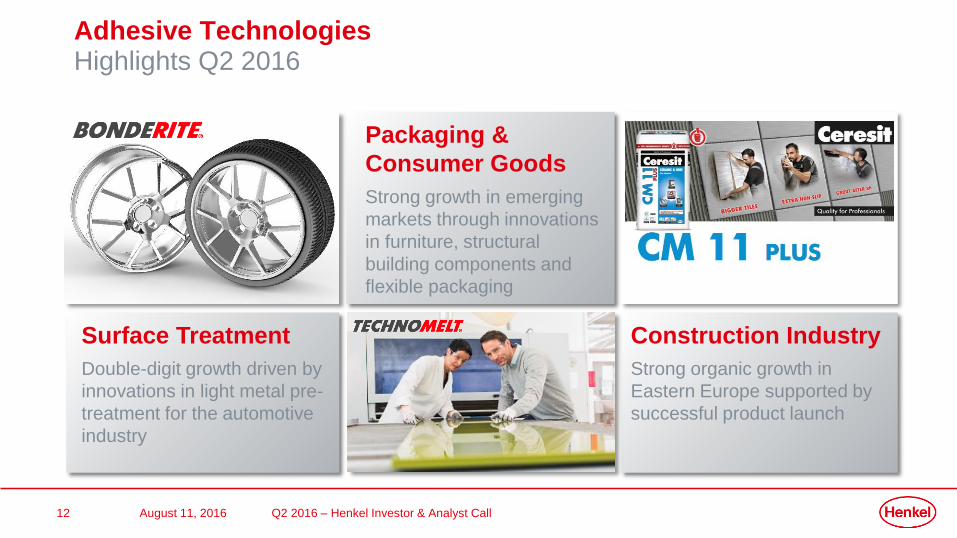
Adhesive TechnologiesHighlights Q2 2016
Q2 2016 – Henkel Investor & Analyst CallAugust 11, 2016
Surface Treatment
Double-digit growth driven by
innovations in light metal pre-
treatment for the automotive
industry
Packaging &
Consumer Goods
Strong growth in emerging
markets through innovations
in furniture, structural
building components and
flexible packaging
Construction Industry
Strong organic growth in
Eastern Europe supported by
successful product launch
13
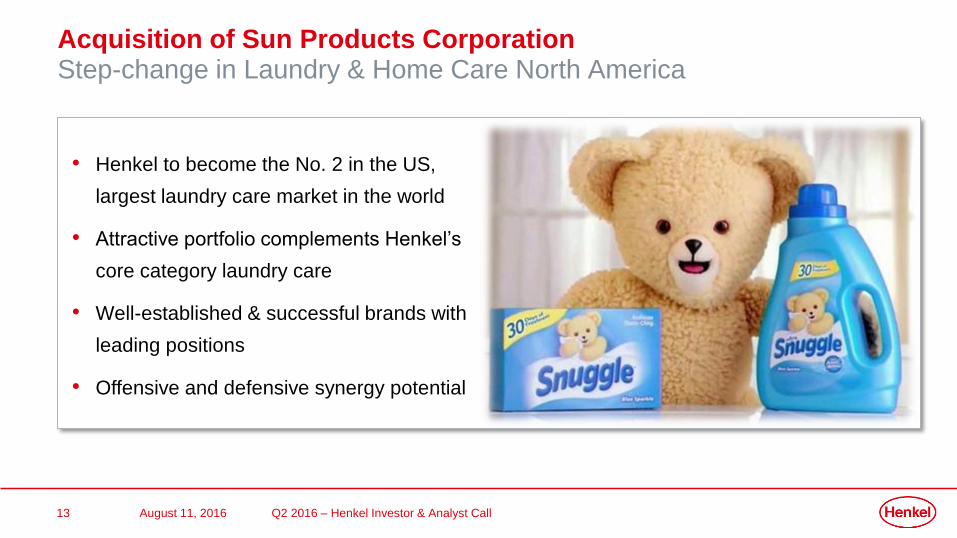
Acquisition of Sun Products Corporation Step-change in Laundry & Home Care North America
Q2 2016 – Henkel Investor & Analyst CallAugust 11, 2016
• Henkel to become the No. 2 in the US,
largest laundry care market in the world
• Attractive portfolio complements Henkel’s
core category laundry care
• Well-established & successful brands with
leading positions
• Offensive and defensive synergy potential
14
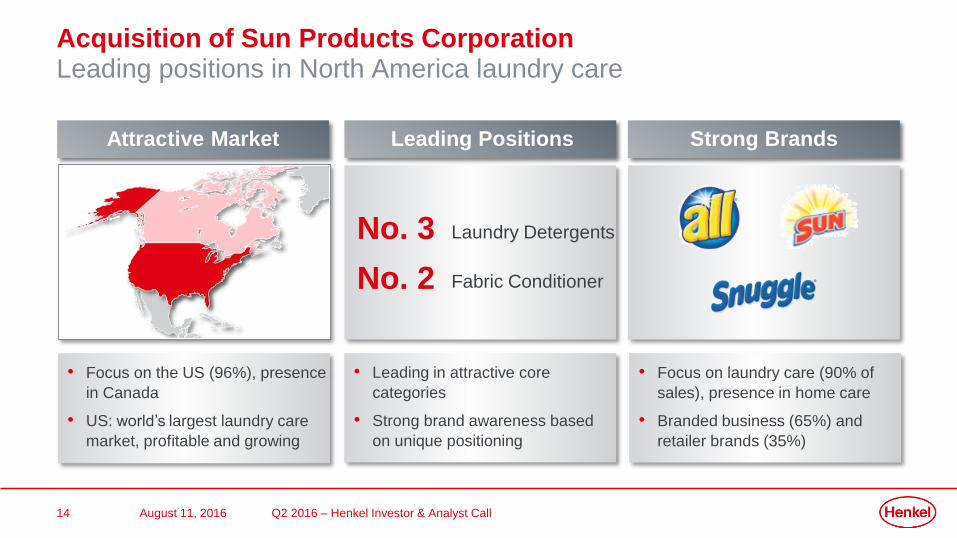
Acquisition of Sun Products CorporationLeading positions in North America laundry care
Leading Positions
• Focus on the US (96%), presence
in Canada
• US: world’s largest laundry care
market, profitable and growing
• Leading in attractive core
categories
• Strong brand awareness based
on unique positioning
No. 3 Laundry Detergents
No. 2 Fabric Conditioner
Attractive Market Strong Brands
• Focus on laundry care (90% of
sales), presence in home care
• Branded business (65%) and
retailer brands (35%)
August 11, 2016 Q2 2016 – Henkel Investor & Analyst Call
15 Q2 2016 – Henkel Investor & Analyst Call
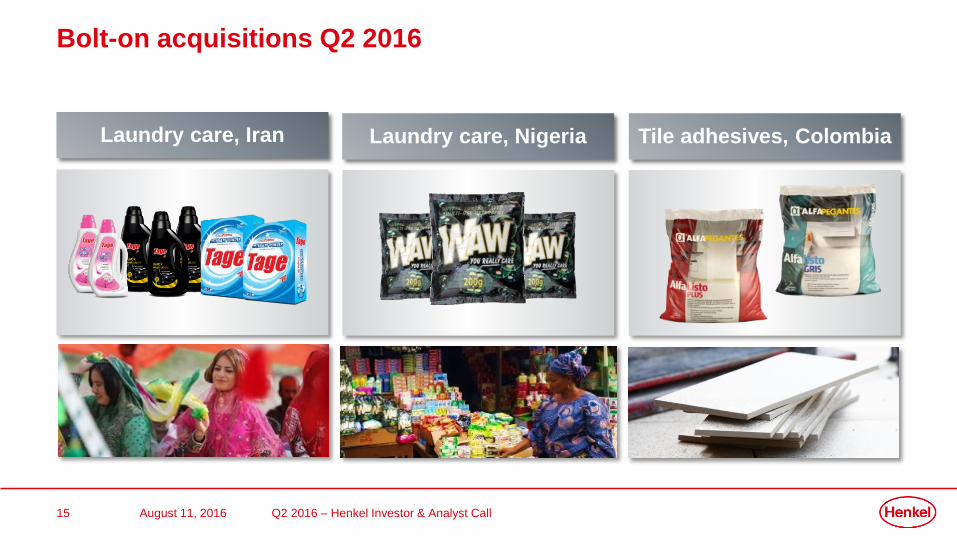
Laundry care, Iran Laundry care, Nigeria
August 11, 2016
Tile adhesives, Colombia
Bolt-on acquisitions Q2 2016
16
Agenda
Q2 2016 – Henkel Investor & Analyst CallAugust 11, 2016
1.
3.
Key developments Q2 2016
Financials Q2 2016
Summary & outlook FY 2016
2.
17 Q2 2016 – Henkel Investor & Analyst Call17 August 11, 2016
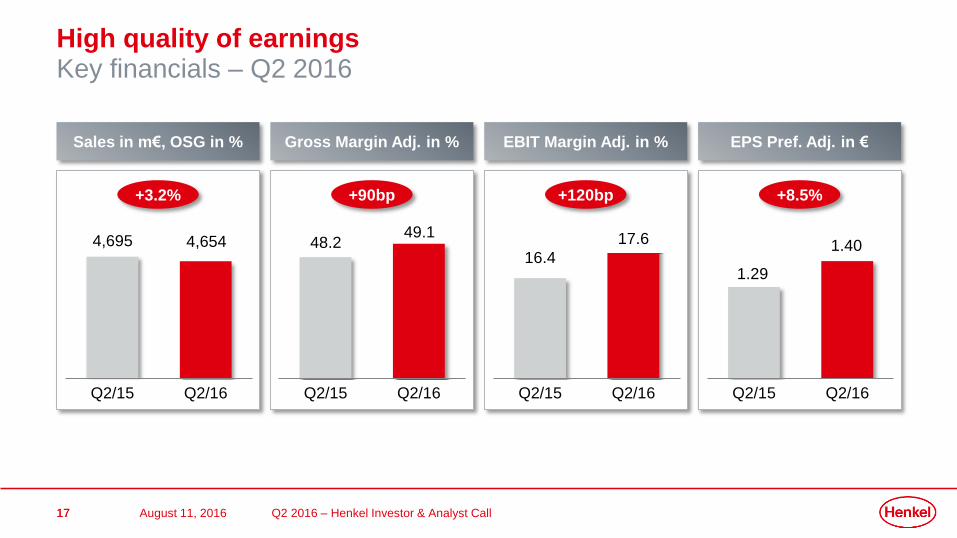
Sales in m€, OSG in % EBIT Margin Adj. in % EPS Pref. Adj. in €
Q2/15 Q2/16
4,695 4,654
Q2/15 Q2/16
16.4
17.6
Q2/15 Q2/16
1.29
1.40
+3.2% +120bp +8.5%
Q2/15 Q2/16
Gross Margin Adj. in %
48.249.1
+90bp
High quality of earningsKey financials – Q2 2016
18
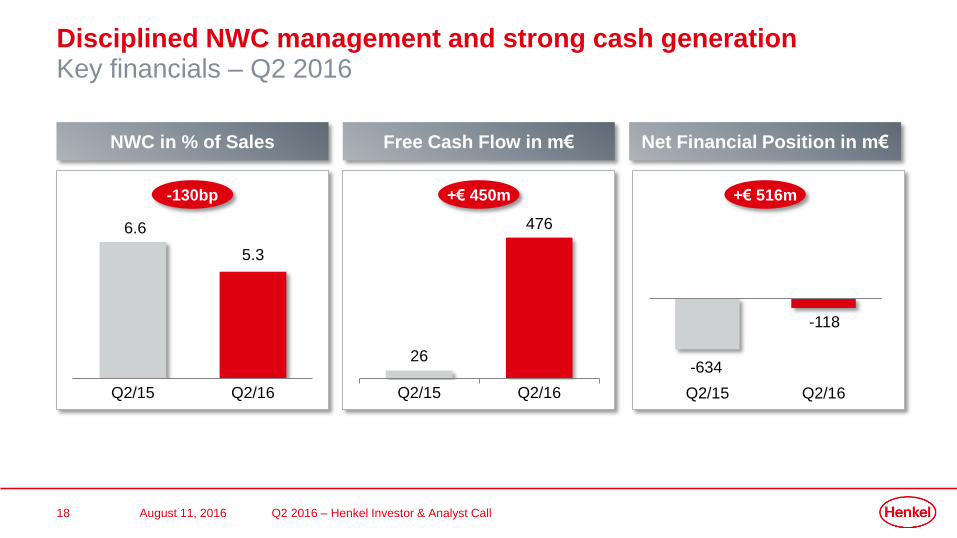
Disciplined NWC management and strong cash generationKey financials – Q2 2016
Q2 2016 – Henkel Investor & Analyst CallAugust 11, 2016
NWC in % of Sales
-130bp
Free Cash Flow in m€ Net Financial Position in m€
Q2/15 Q2/16
6.6
5.3
+€ 450m
26
476
Q2/15 Q2/16 Q2/15 Q2/16
-634
-118
+€ 516m
19
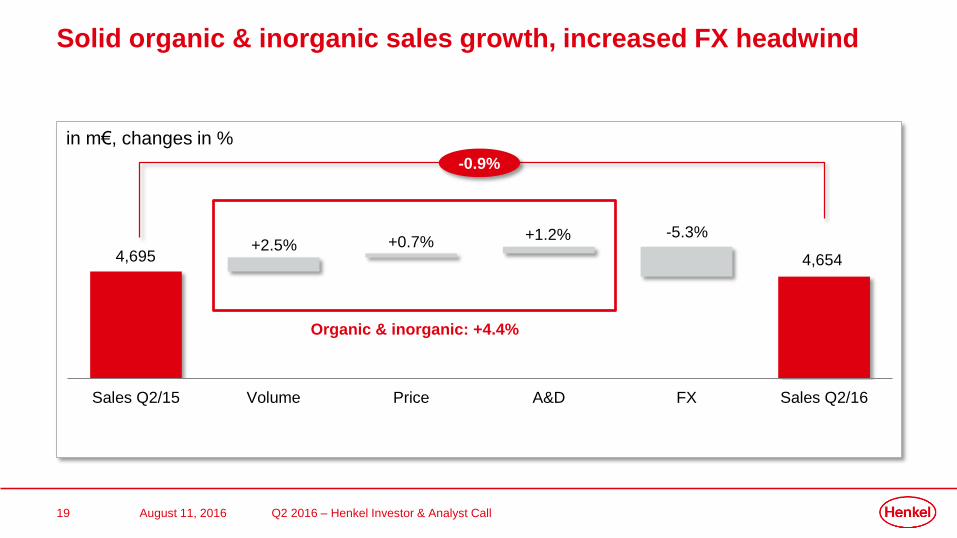
Sales Q2/15 Volume Price A&D FX Sales Q2/16
Solid organic & inorganic sales growth, increased FX headwind
Q2 2016 – Henkel Investor & Analyst CallAugust 11, 2016
in m€, changes in %
-0.9%
Organic & inorganic: +4.4%
4,695 4,654+2.5% +0.7% +1.2% -5.3%
20
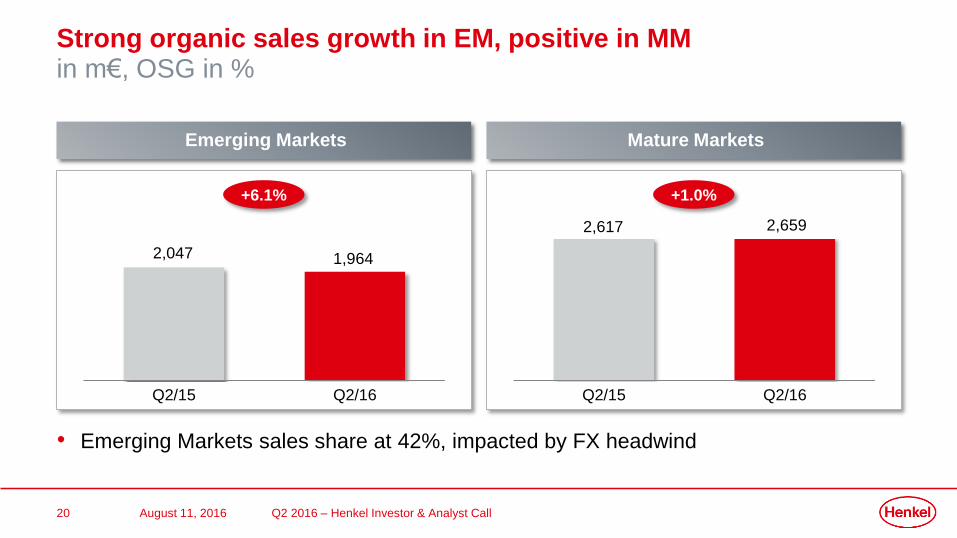
Strong organic sales growth in EM, positive in MMin m€, OSG in %
Q2 2016 – Henkel Investor & Analyst Call
Emerging Markets Mature Markets
August 11, 2016
+6.1% +1.0%
Q2/15 Q2/16
2,617 2,659
• Emerging Markets sales share at 42%, impacted by FX headwind
Q2/15 Q2/16
2,047 1,964
21
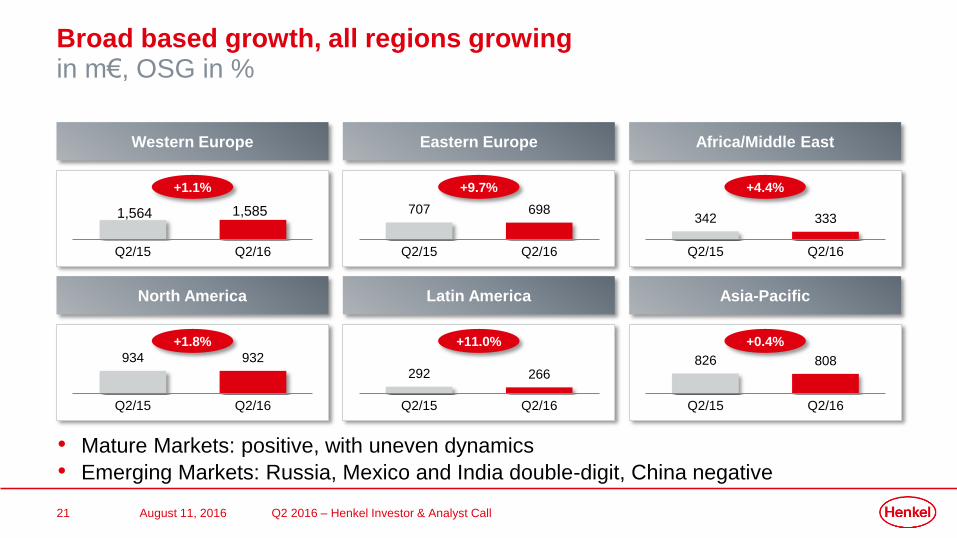
Broad based growth, all regions growingin m€, OSG in %
August 11, 2016 Q2 2016 – Henkel Investor & Analyst Call
• Mature Markets: positive, with uneven dynamics
• Emerging Markets: Russia, Mexico and India double-digit, China negative
Western Europe Eastern Europe
707 698
Q2/15 Q2/16
+9.7%
Africa/Middle East
342 333
Q2/15 Q2/16
+4.4%
North America
934 932
Q2/15 Q2/16
+1.8%
Latin America
292 266
Q2/15 Q2/16
+11.0%
Asia-Pacific
826 808
Q2/15 Q2/16
+0.4%
Q2/15 Q2/16
+1.1%
1,564 1,585
22
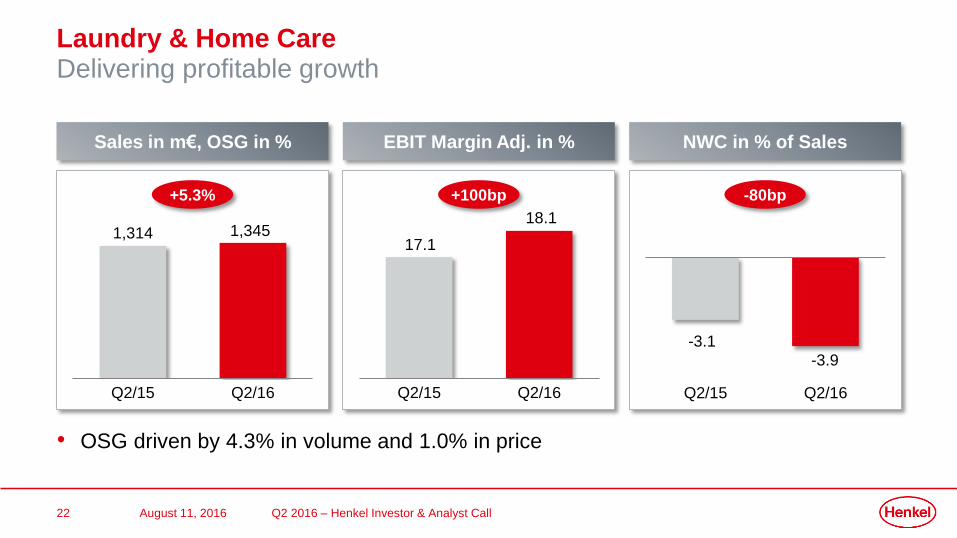
Laundry & Home CareDelivering profitable growth
Q2 2016 – Henkel Investor & Analyst CallAugust 11, 2016
Sales in m€, OSG in %
+5.3%
Q2/15 Q2/16
EBIT Margin Adj. in %
+100bp
Q2/15 Q2/16
NWC in % of Sales
-80bp
Q2/15 Q2/16
• OSG driven by 4.3% in volume and 1.0% in price
17.1
18.1
-3.1
-3.9
1,314 1,345
23
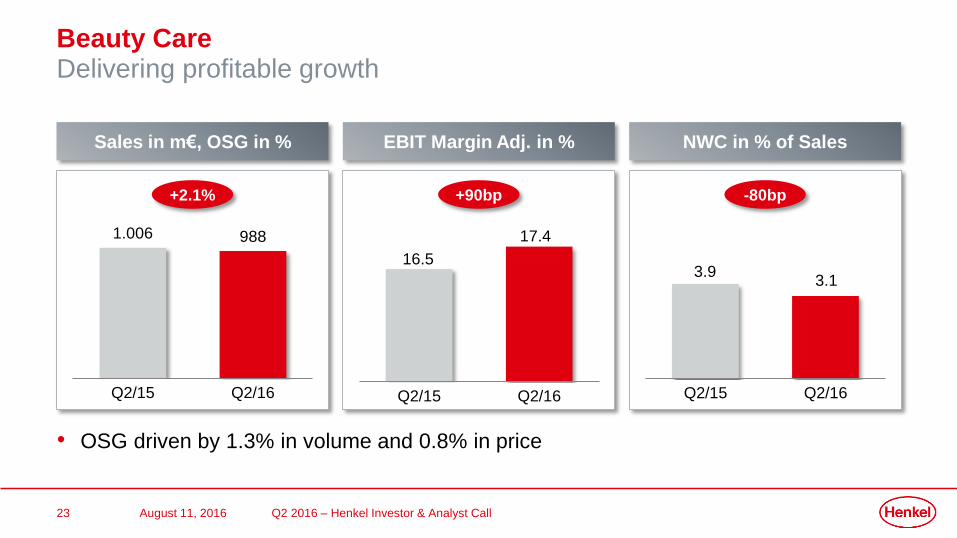
Beauty CareDelivering profitable growth
Q2 2016 – Henkel Investor & Analyst CallAugust 11, 2016
Sales in m€, OSG in %
+2.1%
1.006 988
Q2/15 Q2/16
EBIT Margin Adj. in %
+90bp
Q2/15 Q2/16
NWC in % of Sales
-80bp
Q2/15 Q2/16
• OSG driven by 1.3% in volume and 0.8% in price
16.5
17.4
3.93.1
24
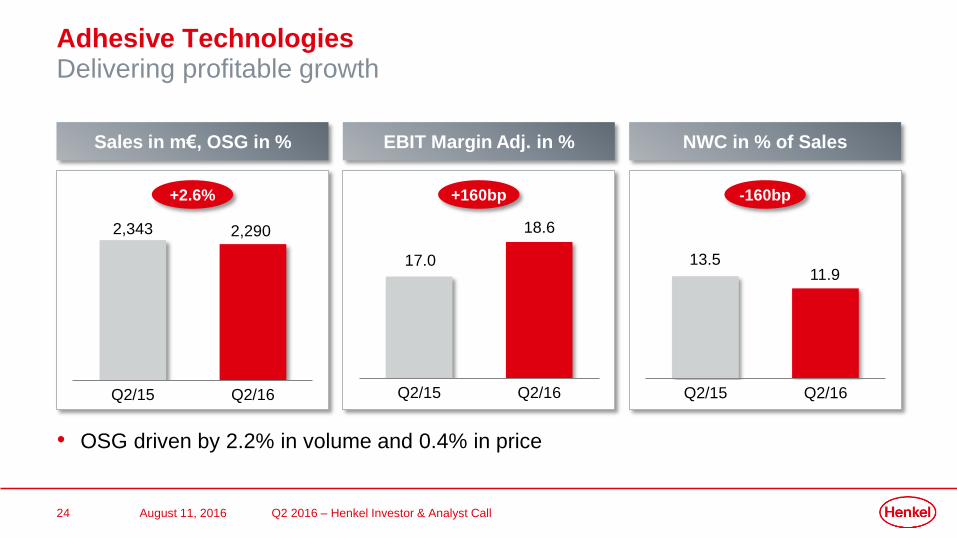
Adhesive TechnologiesDelivering profitable growth
Q2 2016 – Henkel Investor & Analyst CallAugust 11, 2016
Sales in m€, OSG in %
+2.6%
Q2/15 Q2/16
EBIT Margin Adj. in %
+160bp
Q2/15 Q2/16
NWC in % of Sales
• OSG driven by 2.2% in volume and 0.4% in price
17.0
18.62,343 2,290
-160bp
Q2/15 Q2/16
13.511.9
25
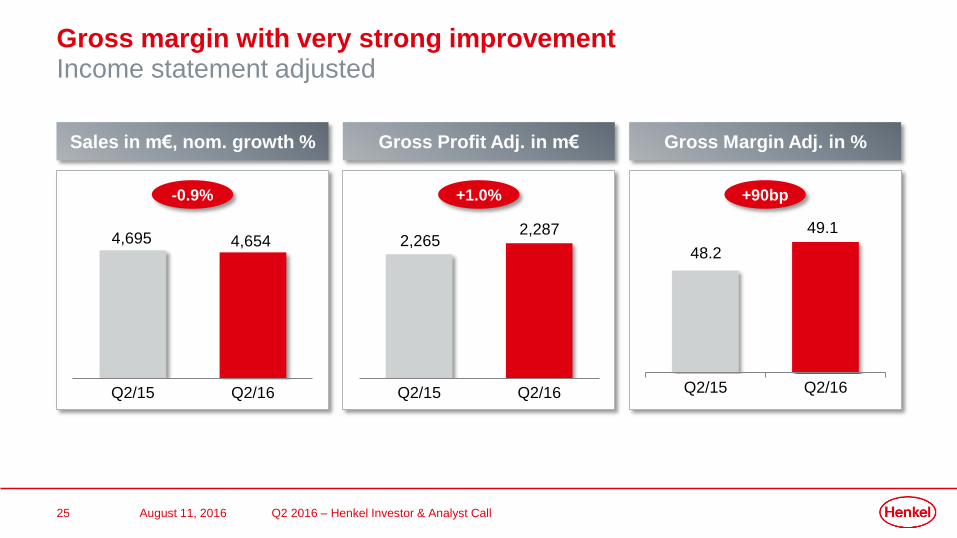
Gross margin with very strong improvementIncome statement adjusted
Q2 2016 – Henkel Investor & Analyst CallAugust 11, 2016
Sales in m€, nom. growth %
-0.9%
Q2/15 Q2/16
Gross Profit Adj. in m€
+1.0%
Gross Margin Adj. in %
+90bp
Q2/15 Q2/16Q2/15 Q2/16
4,695 4,654 2,2652,287
48.2
49.1
26
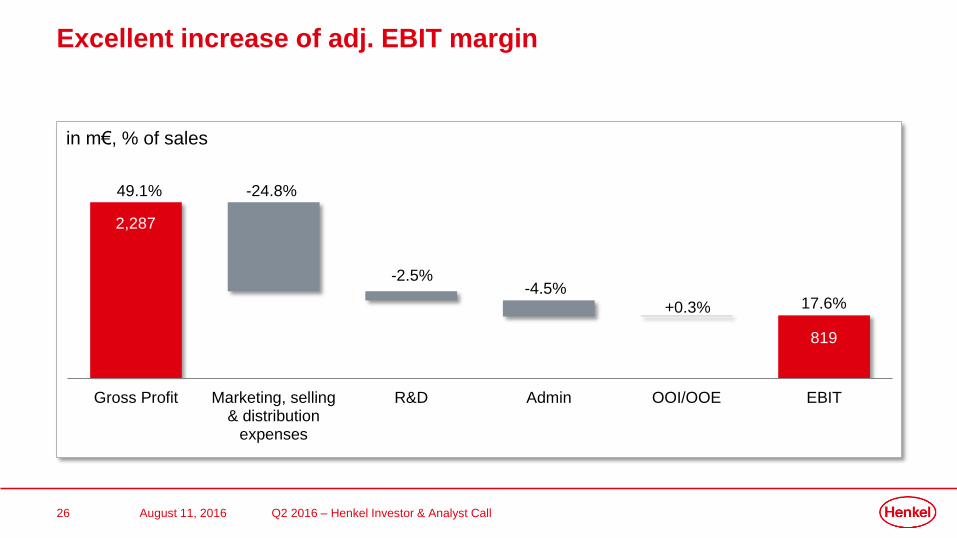
Excellent increase of adj. EBIT margin
Q2 2016 – Henkel Investor & Analyst CallAugust 11, 2016
Gross Profit Marketing, selling& distribution
expenses
R&D Admin OOI/OOE EBIT
in m€, % of sales
2,287
819
49.1%
17.6%
-24.8%
-2.5%-4.5%
+0.3%
27
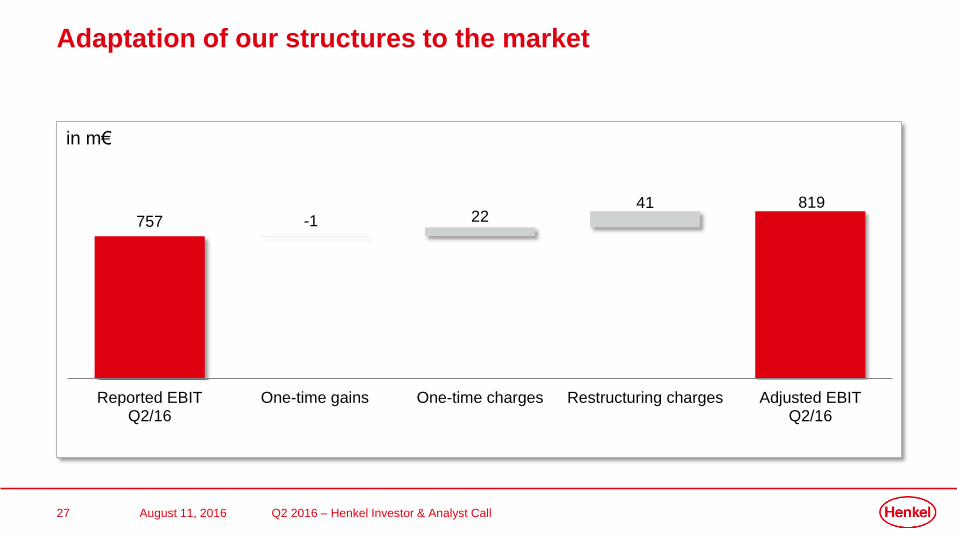
Adaptation of our structures to the market
Q2 2016 – Henkel Investor & Analyst CallAugust 11, 2016
757 -1 2241 819
Reported EBITQ2/16
One-time gains One-time charges Restructuring charges Adjusted EBITQ2/16
in m€
28
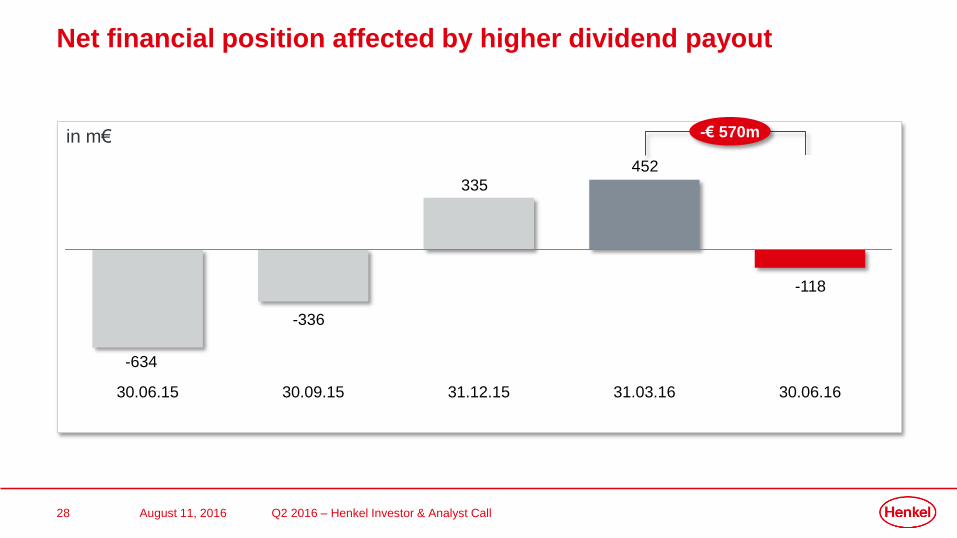
Net financial position affected by higher dividend payout
Q2 2016 – Henkel Investor & Analyst CallAugust 11, 2016
in m€
30.06.15 30.09.15 31.12.15 31.03.16 30.06.16
-€ 570m
-118
-634
-336
335
452
29
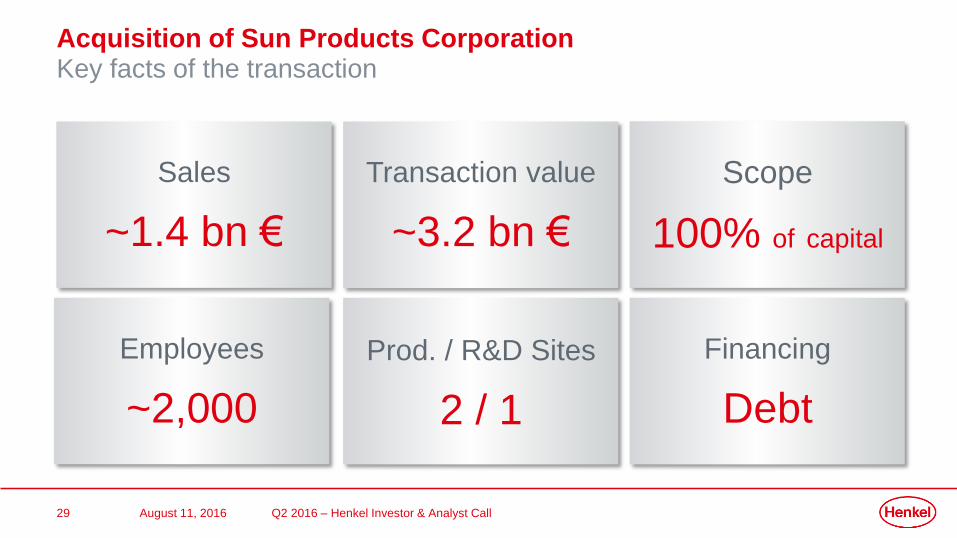
Acquisition of Sun Products CorporationKey facts of the transaction
Sales
~1.4 bn €
Transaction value
~3.2 bn €
Prod. / R&D Sites
2 / 1
Employees
~2,000
Financing
Debt
Scope
100% of capital
August 11, 2016 Q2 2016 – Henkel Investor & Analyst Call
30
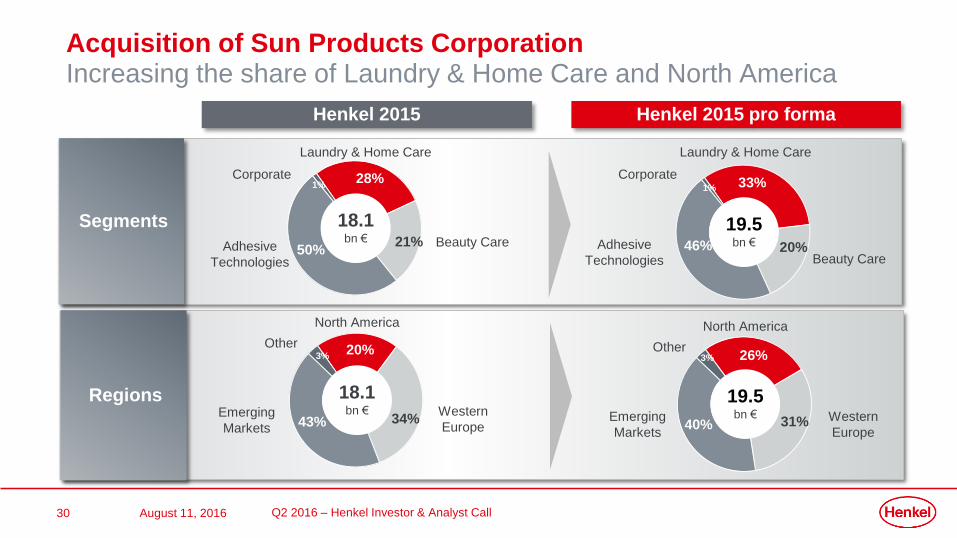
Henkel 2015 Henkel 2015 pro forma
Segments 18.1 bn € Beauty CareAdhesive
Technologies
28%
50%
Laundry & Home Care
1%Corporate
21%19.5bn €
Beauty CareAdhesive
Technologies
33%
46%
1%
Corporate
20%
Laundry & Home Care
Q2 2016 – Henkel Investor & Analyst CallAugust 11, 2016
Regions 18.1 bn €
North America
Emerging
Markets
20%
43%Western
Europe
3%
Other
34%
19.5bn €
North America
Emerging
Markets
26%
40%Western
Europe
3%Other
31%
Acquisition of Sun Products CorporationIncreasing the share of Laundry & Home Care and North America
31
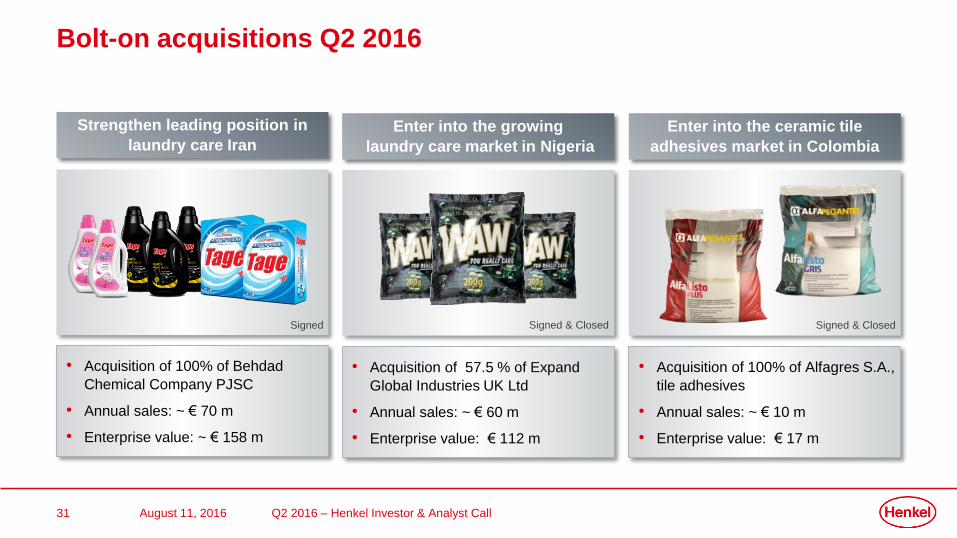
• Acquisition of 57.5 % of Expand
Global Industries UK Ltd
• Annual sales: ~ € 60 m
• Enterprise value: € 112 m
• Acquisition of 100% of Behdad
Chemical Company PJSC
• Annual sales: ~ € 70 m
• Enterprise value: ~ € 158 m
Q2 2016 – Henkel Investor & Analyst Call
Strengthen leading position in
laundry care Iran
Enter into the growing
laundry care market in Nigeria
August 11, 2016
Enter into the ceramic tile
adhesives market in Colombia
• Acquisition of 100% of Alfagres S.A.,
tile adhesives
• Annual sales: ~ € 10 m
• Enterprise value: € 17 m
Bolt-on acquisitions Q2 2016
Signed Signed & Closed Signed & Closed
32
Agenda
August 11, 2016 Q2 2016 – Henkel Investor & Analyst Call
1.
3.
Key developments Q2 2016
Financials Q2 2016
Summary & outlook FY 2016
2.
33
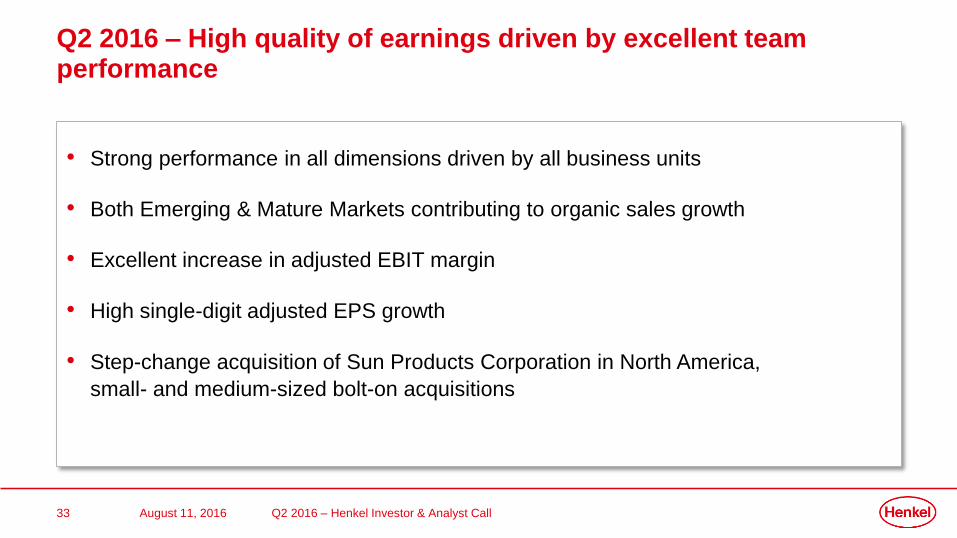
Q2 2016 – High quality of earnings driven by excellent team performance
Q2 2016 – Henkel Investor & Analyst CallAugust 11, 2016
• Strong performance in all dimensions driven by all business units
• Both Emerging & Mature Markets contributing to organic sales growth
• Excellent increase in adjusted EBIT margin
• High single-digit adjusted EPS growth
• Step-change acquisition of Sun Products Corporation in North America,
small- and medium-sized bolt-on acquisitions
34
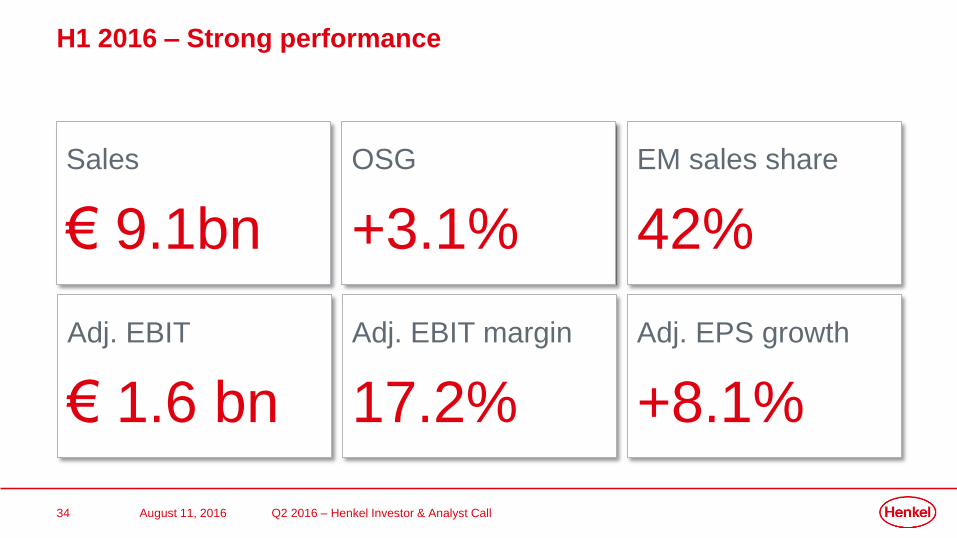
H1 2016 – Strong performance
Q2 2016 – Henkel Investor & Analyst CallAugust 11, 2016
Sales
€ 9.1bn
OSG
+3.1%
Adj. EBIT margin
17.2%
Adj. EPS growth
+8.1%
Adj. EBIT
€ 1.6 bn
EM sales share
42%
35
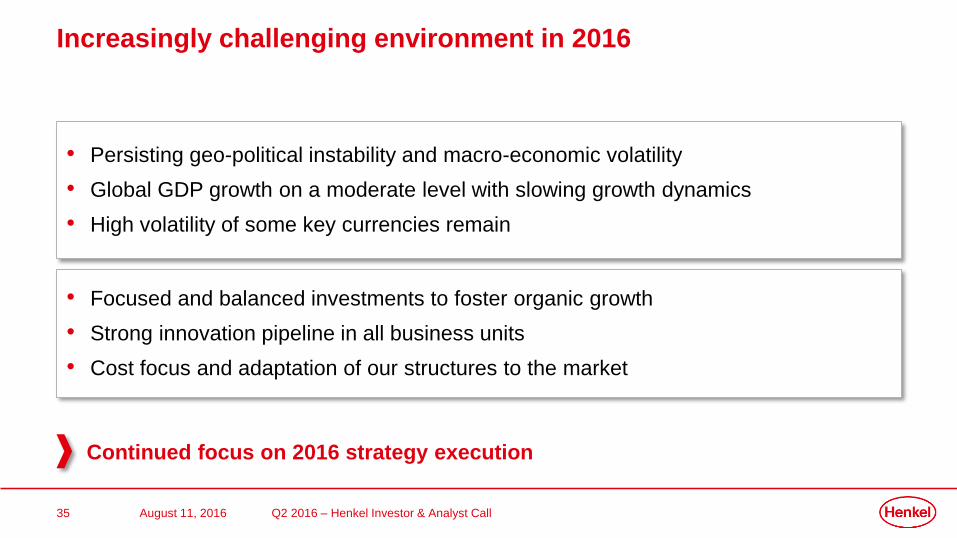
Increasingly challenging environment in 2016
Q2 2016 – Henkel Investor & Analyst CallAugust 11, 2016
• Persisting geo-political instability and macro-economic volatility
• Global GDP growth on a moderate level with slowing growth dynamics
• High volatility of some key currencies remain
• Focused and balanced investments to foster organic growth
• Strong innovation pipeline in all business units
• Cost focus and adaptation of our structures to the market
Continued focus on 2016 strategy execution
36
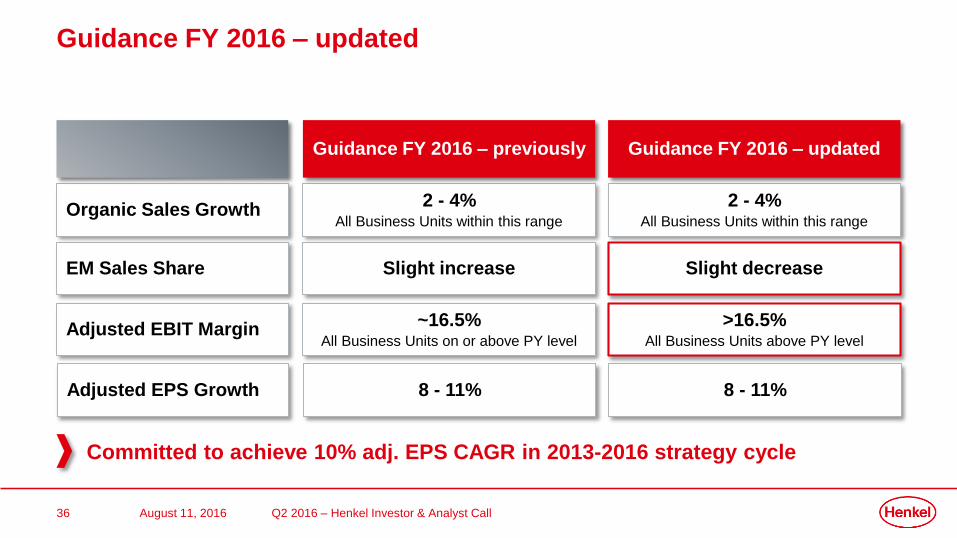
Guidance FY 2016 – updated
Q2 2016 – Henkel Investor & Analyst CallAugust 11, 2016
Organic Sales Growth
EM Sales Share
Adjusted EBIT Margin
Adjusted EPS Growth
2 - 4%All Business Units within this range
Guidance FY 2016 – previously
Slight increase
~16.5%All Business Units on or above PY level
8 - 11%
Committed to achieve 10% adj. EPS CAGR in 2013-2016 strategy cycle
2 - 4%All Business Units within this range
Guidance FY 2016 – updated
Slight decrease
>16.5%All Business Units above PY level
8 - 11%
37
Upcoming events
Q2 2016 – Henkel Investor & Analyst CallAugust 11, 2016
• November 8th, 2016
Q3 2016 Earnings Release
• November 17th, 2016
Henkel Strategic Priorities & Targets
• February 23, 2017
Full Year 2016 Earnings Release

Thank you
39
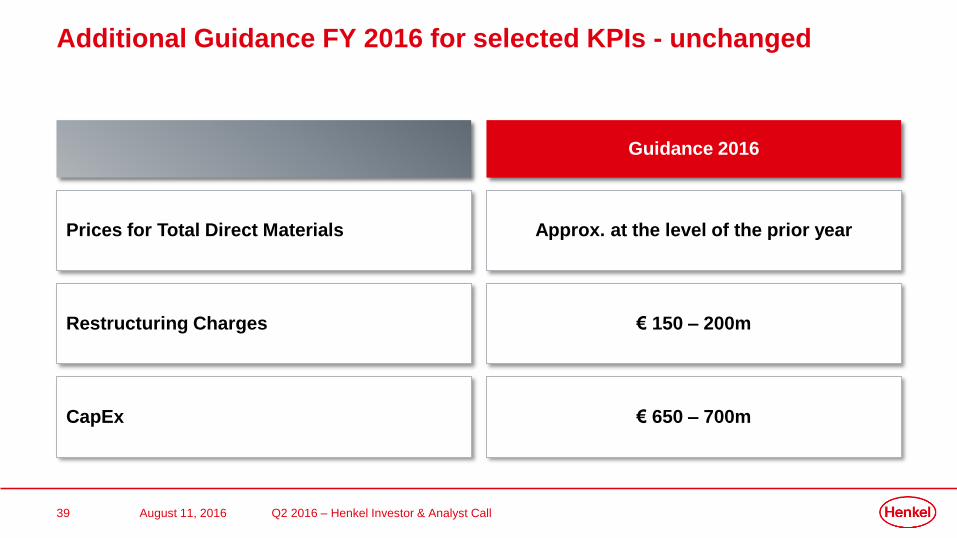
Additional Guidance FY 2016 for selected KPIs - unchanged
Q2 2016 – Henkel Investor & Analyst CallAugust 11, 2016
Prices for Total Direct Materials
Restructuring Charges
CapEx
Approx. at the level of the prior year
Guidance 2016
€ 150 – 200m
€ 650 – 700m
40
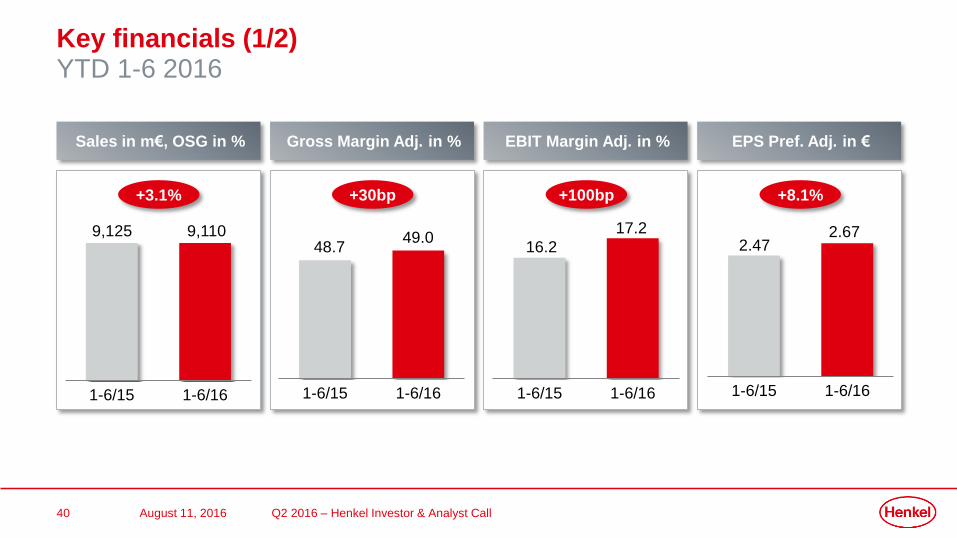
Key financials (1/2)YTD 1-6 2016
Q2 2016 – Henkel Investor & Analyst CallAugust 11, 2016
EPS Pref. Adj. in €EBIT Margin Adj. in %Gross Margin Adj. in %Sales in m€, OSG in %
+3.1%
1-6/15 1-6/16
9,125 9,110
+30bp +100bp +8.1%
1-6/15 1-6/16
49.048.7
1-6/15 1-6/16
16.2
17.2
1-6/15 1-6/16
2.672.47
41
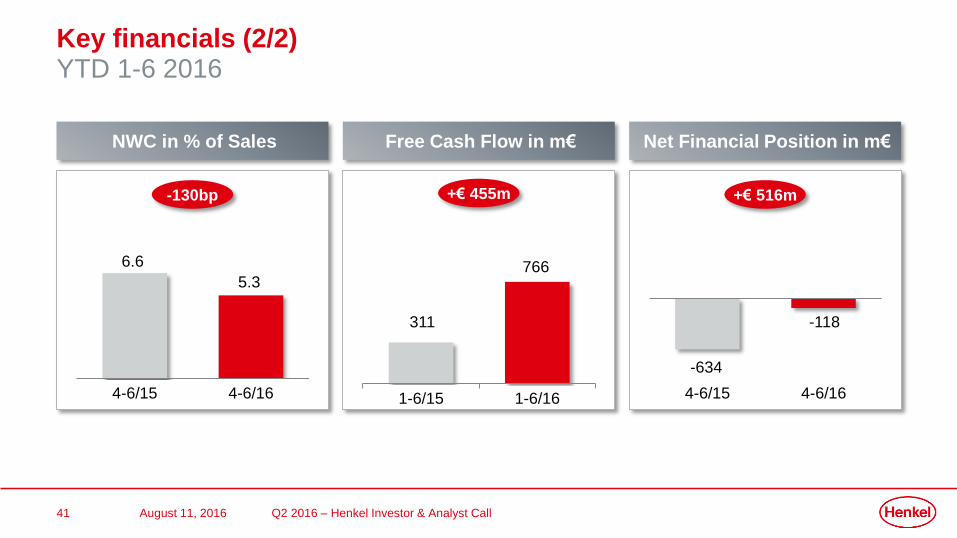
Key financials (2/2)YTD 1-6 2016
Q2 2016 – Henkel Investor & Analyst CallAugust 11, 2016
NWC in % of Sales Free Cash Flow in m€ Net Financial Position in m€
1-6/15 1-6/16
311
766
4-6/15 4-6/16
-634
-118
+€ 516m-130bp
4-6/15 4-6/16
5.3
6.6
+€ 455m
42
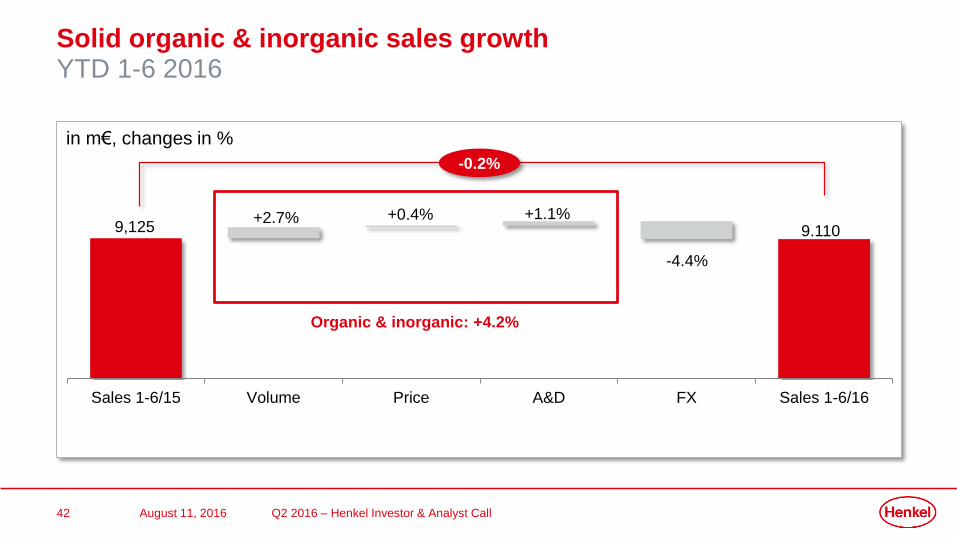
Sales 1-6/15 Volume Price A&D FX Sales 1-6/16
Solid organic & inorganic sales growthYTD 1-6 2016
Q2 2016 – Henkel Investor & Analyst CallAugust 11, 2016
in m€, changes in %
-0.2%
Organic & inorganic: +4.2%
9,125 9.110+2.7% +0.4% +1.1%
-4.4%
43
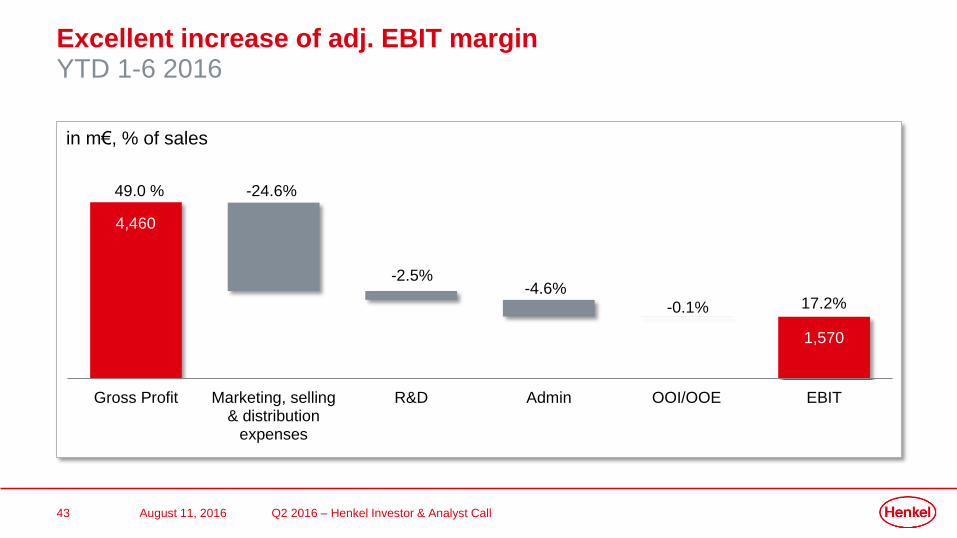
Excellent increase of adj. EBIT marginYTD 1-6 2016
Q2 2016 – Henkel Investor & Analyst CallAugust 11, 2016
Gross Profit Marketing, selling& distribution
expenses
R&D Admin OOI/OOE EBIT
in m€, % of sales
4,460
1,570
49.0 %
17.2%
-24.6%
-2.5%-4.6%
-0.1%
44
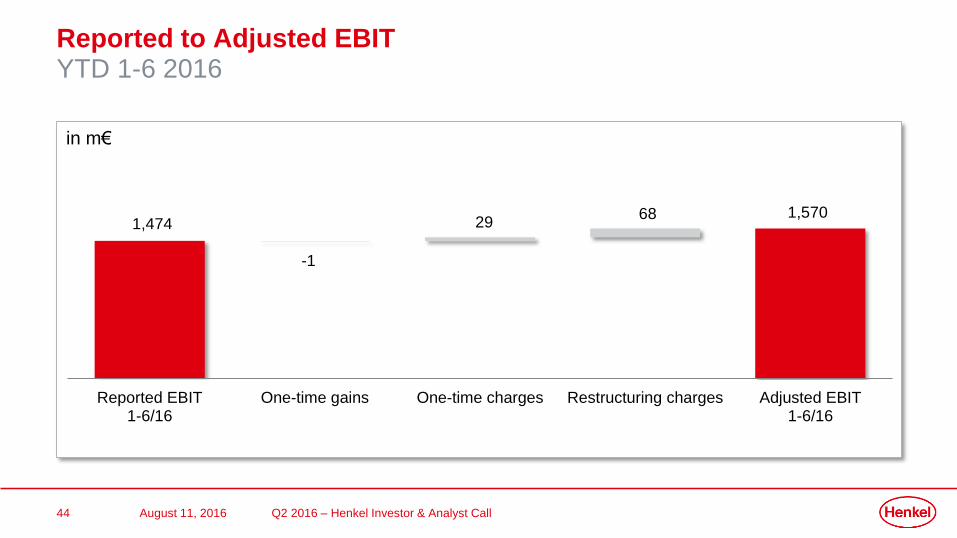
Reported to Adjusted EBIT YTD 1-6 2016
Q2 2016 – Henkel Investor & Analyst CallAugust 11, 2016
Reported EBIT1-6/16
One-time gains One-time charges Restructuring charges Adjusted EBIT1-6/16
in m€
1,474
-1
2968 1,570
45
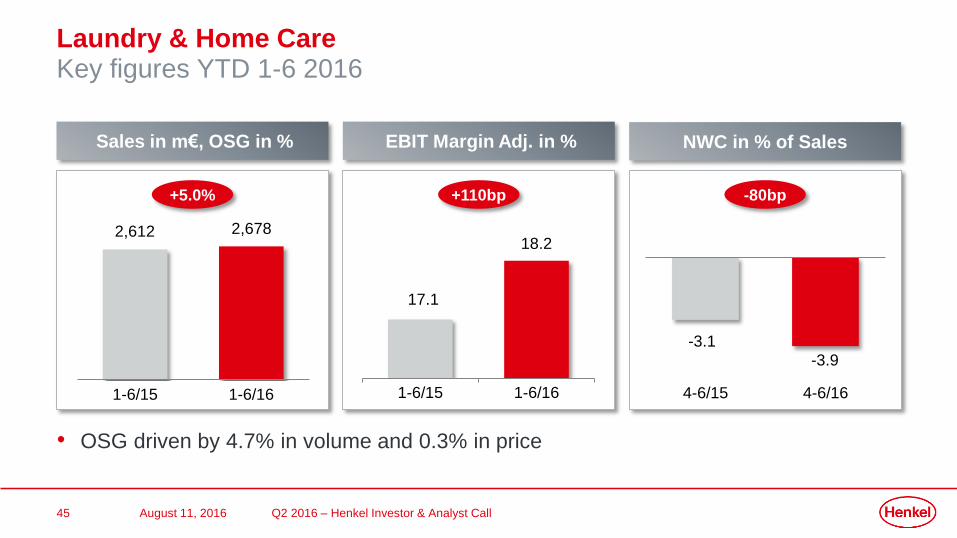
Laundry & Home CareKey figures YTD 1-6 2016
Q2 2016 – Henkel Investor & Analyst CallAugust 11, 2016
Sales in m€, OSG in % EBIT Margin Adj. in %
1-6/15 1-6/16
2,6782,612
1-6/15 1-6/16
18.2
17.1
• OSG driven by 4.7% in volume and 0.3% in price
+110bp+5.0%
NWC in % of Sales
-80bp
4-6/15 4-6/16
-3.1
-3.9
46
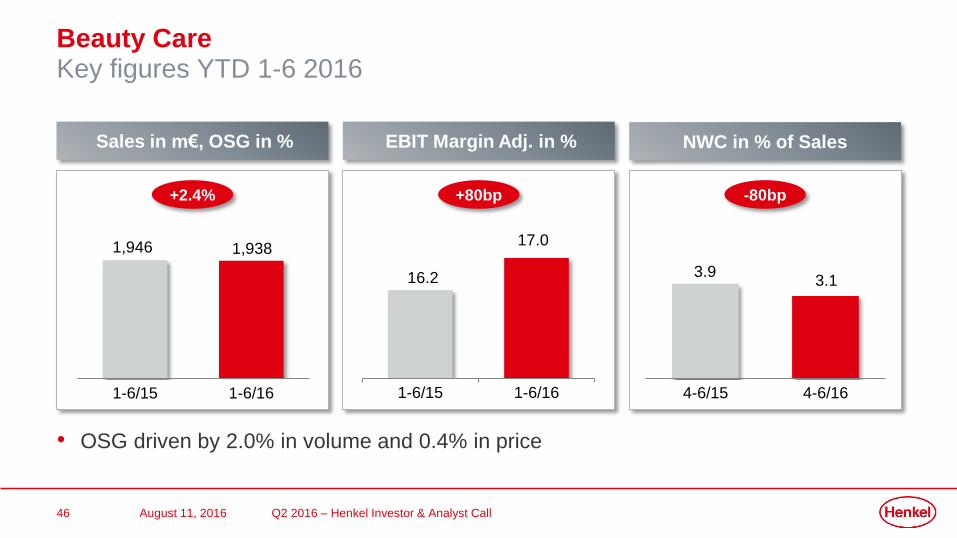
Beauty CareKey figures YTD 1-6 2016
Q2 2016 – Henkel Investor & Analyst CallAugust 11, 2016
• OSG driven by 2.0% in volume and 0.4% in price
Sales in m€, OSG in % EBIT Margin Adj. in %
1-6/15 1-6/16
1,9381,946
1-6/15 1-6/16
17.0
16.2
+80bp+2.4%
NWC in % of Sales
-80bp
4-6/15 4-6/16
3.93.1
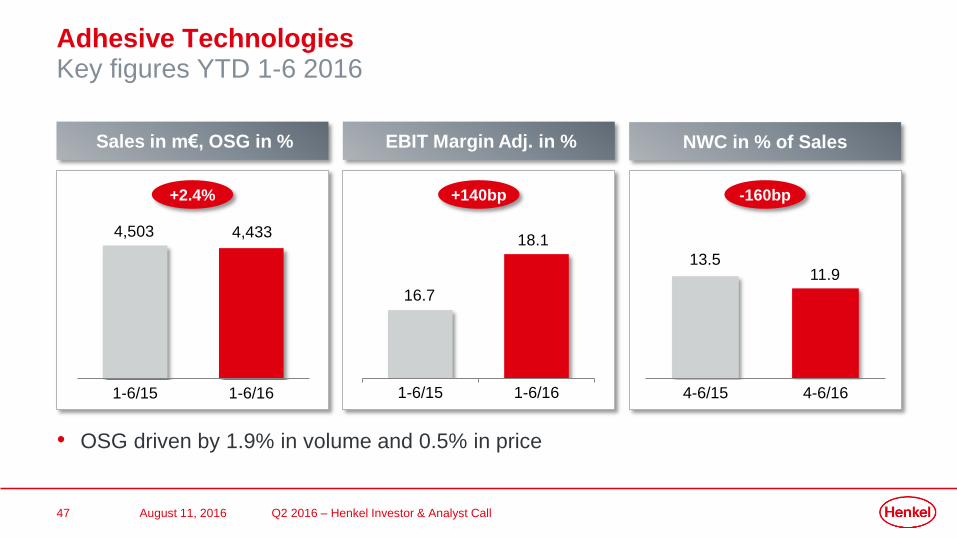
47
+2.4%
Adhesive TechnologiesKey figures YTD 1-6 2016
Q2 2016 – Henkel Investor & Analyst CallAugust 11, 2016
• OSG driven by 1.9% in volume and 0.5% in price
Sales in m€, OSG in %
1-6/15 1-6/16
4,4334,503
NWC in % of Sales
-160bp
4-6/15 4-6/16
13.511.9
EBIT Margin Adj. in %
1-6/15 1-6/16
18.1
16.7
+140bp
Recommended