Image Analysis and 3D Reconstruction Technique
Satinder Singh MD., FCCPProfessor of Radiology & Medicine (Div. of CV diseases)
Chief Cardiopulmonary RadiologyDirector Cardiac CT
University of Alabama at Birmingham

Disclosure
GE Imaging in Healthcare Advisory Board

Introduction
Complexity of coronary anatomy, cardiac motion, calcium related artifacts and subtle nature of coronary lesions necessitate evaluation of coronary CTA on workstation capable of 2 & 3 dimensional display
The interpreting physician must know how to do the post processing & not just rely on processed images by technologist

Objective
Review the practical post processing techniques which are “must” for interpreting coronary CTA
Discuss strengths and weaknesses of commonly used 3D reformatting methods
Discuss coronary CTA image analysis in patients with Suspected CAD CABG/Stents Coronary artery anomalies

Post Processing Cardiac CTA
Post-Processing
Patient Preparation
Data Acquisition
Data Reconstruction
BMI, HR, Breath hold
HR, Arrhythmia, Calcification, Contrast opacification, Prospective vs Retrospective gating
FOV, Slice thickness, Recon filter
Common Reformation Techniques
Multiplanar Reformation (MPR) Maximum-intensity projection (MIP) Shaded surface display (SSD) Direct volume rendering (DVR)

Transaxial Data Series of 2D images stacked in
the longitudinal (Z-axis) direction of acquisition
Proper W/L required for accurate interpretation Ideally window level should be mean
of the HU values of the ROI, window width should be 2.5 times the level
Fow a standard 120 kVp exam W/L of 800/300 are useful starting points, readjust for body habitus, extent of calcification & contrast intensity
800/300
450/50
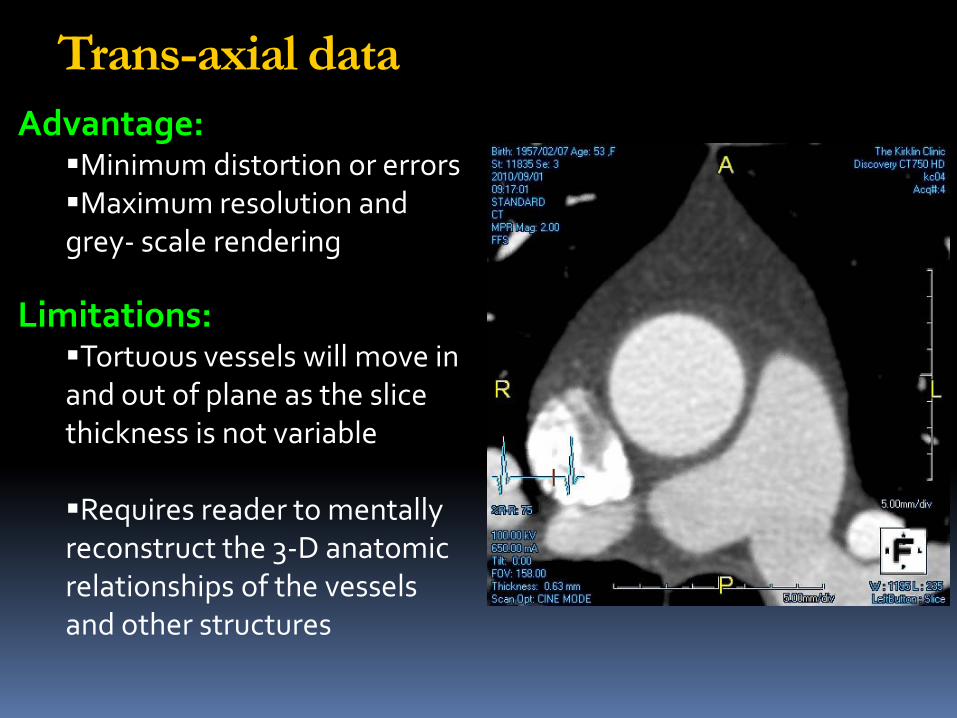
Advantage: Minimum distortion or errors Maximum resolution and grey- scale rendering
Limitations:Tortuous vessels will move in and out of plane as the slice thickness is not variable
Requires reader to mentally reconstruct the 3-D anatomic relationships of the vessels and other structures
Trans-axial data
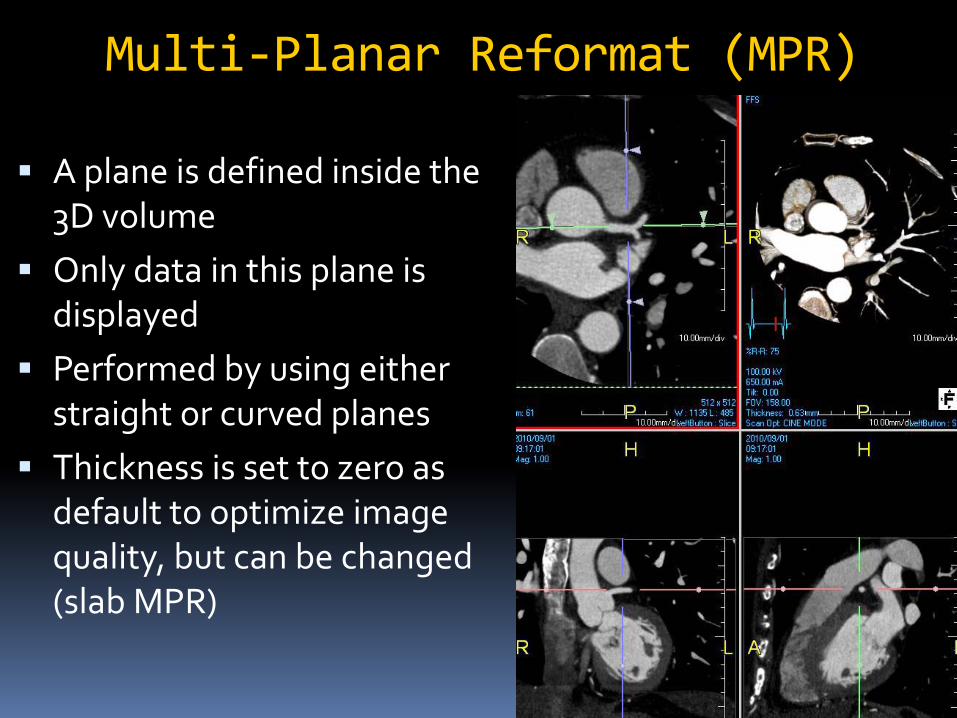
Multi-Planar Reformat (MPR)
A plane is defined inside the 3D volume
Only data in this plane is displayed
Performed by using either straight or curved planes
Thickness is set to zero as default to optimize image quality, but can be changed (slab MPR)

MPR Advantage: Ease of use and speed Provide images
containing all available information (all Hounsfield unit values retained)
Useful in delineating the morphology of the plaque and its effect on the lumen and adjacent vessel wall
Disadvantage: Operator dependence;
prone to introduce false positive & negative stenosis
Viewing from multiple different view points is required (double oblique method)
Only one branch of a vessel is displayed at a time

Double Oblique Method54 Y/M with chest pain and abnormal stress MPI
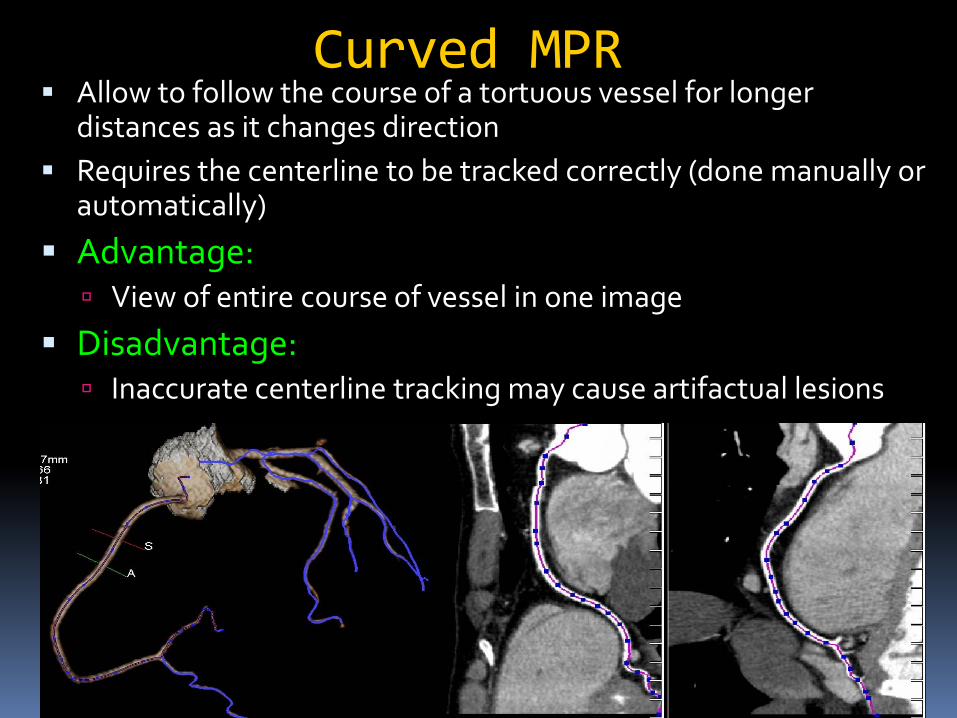
Curved MPR Allow to follow the course of a tortuous vessel for longer
distances as it changes direction Requires the centerline to be tracked correctly (done manually or
automatically)
Advantage: View of entire course of vessel in one image
Disadvantage: Inaccurate centerline tracking may cause artifactual lesions
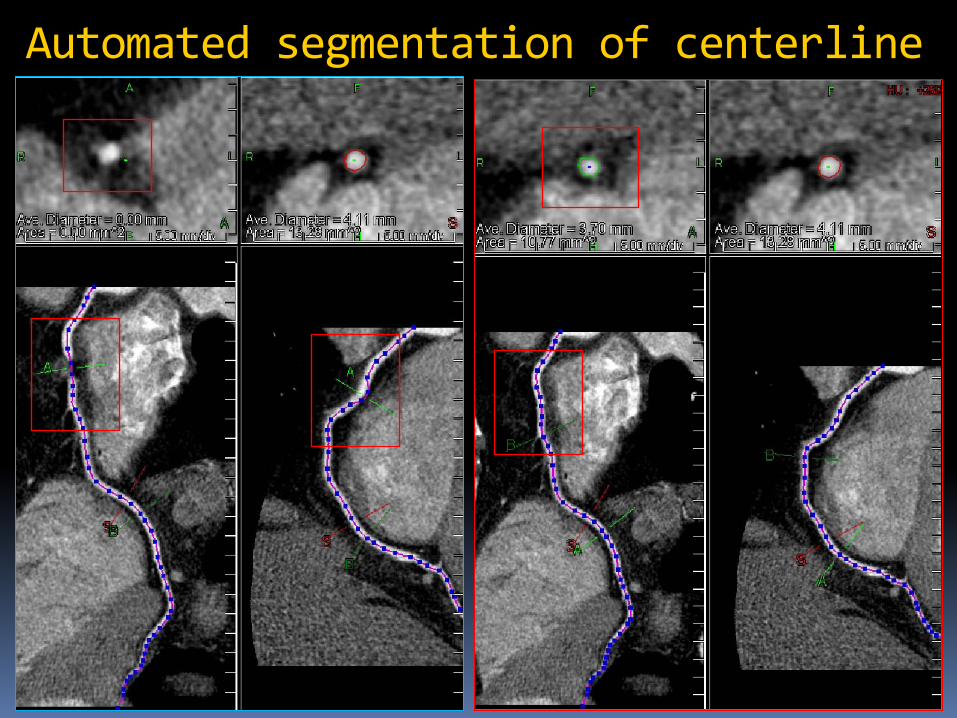
Automated segmentation of centerline
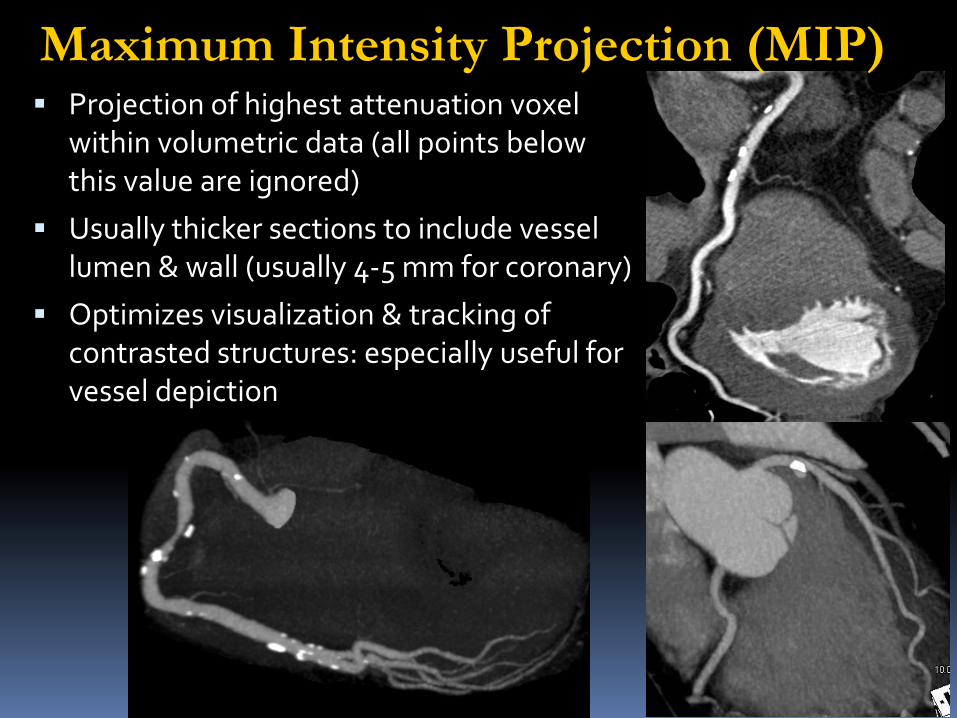
Maximum Intensity Projection (MIP) Projection of highest attenuation voxel
within volumetric data (all points below this value are ignored)
Usually thicker sections to include vessel lumen & wall (usually 4-5 mm for coronary)
Optimizes visualization & tracking of contrasted structures: especially useful for vessel depiction

MIP Advantage: Fast & easy to configure Visualization of long segment
of vessel Decreased perceived image
noise Good differentiation between
vessel and background Decrease artifacts from metal
Disadvantage: No in-depth information:
Loss of lesion information within slab volume
Leads to overestimation of stenosis
Interference from overlapping structures

Switching back and forth between formats , toggling between MIP and MPR captures advantages of both when reading a particular vessel segment
Volume Rendering Virtual light rays are cast from a viewing point through
the tissue or tissues of interest Create histogram of CT data to determine # of voxels
& range of H.U Tissues are assigned a specific range of H.U & each
tissue has assigned color, brightness & degree of opacity (100%; most opaque, 0%; transparent)
Cast rays to each point in volume & determine opacity value of all voxels in path of ray
Place sum of all opacity for each ray in final image Clip planes and thinner slabs can be employed
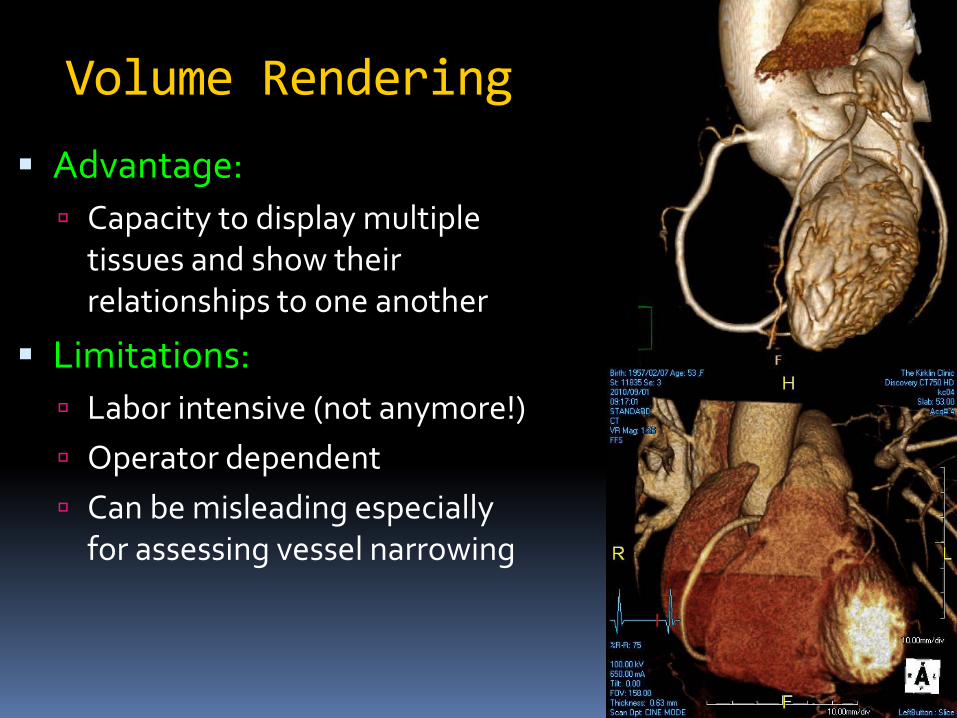
Volume Rendering
Advantage: Capacity to display multiple
tissues and show their relationships to one another
Limitations: Labor intensive (not anymore!) Operator dependent Can be misleading especially
for assessing vessel narrowing
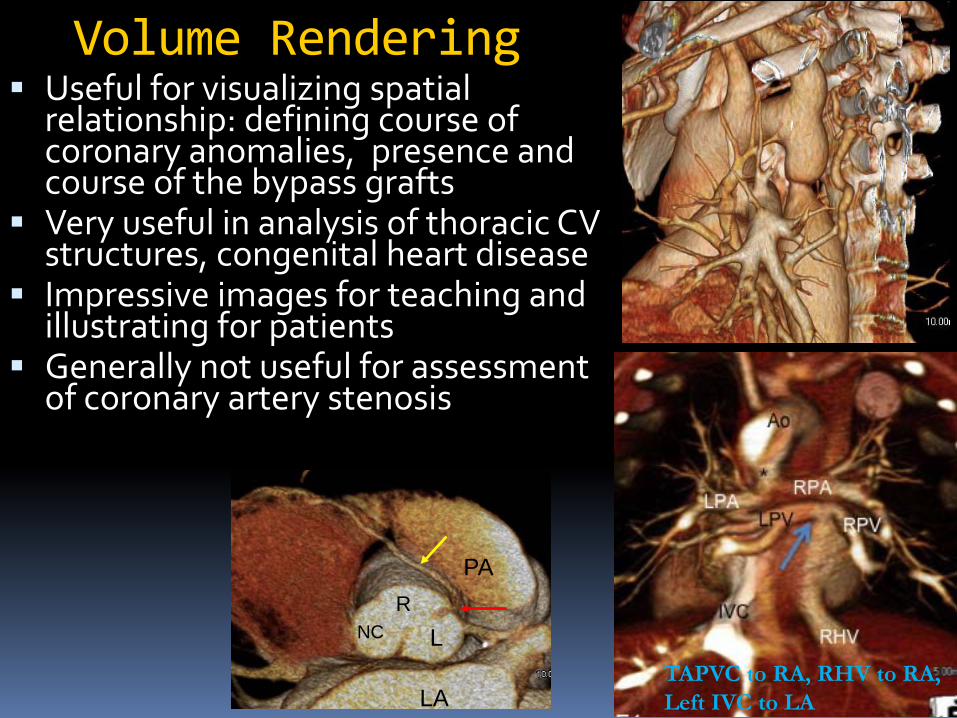
Volume Rendering Useful for visualizing spatial
relationship: defining course of coronary anomalies, presence and course of the bypass grafts
Very useful in analysis of thoracic CV structures, congenital heart disease
Impressive images for teaching and illustrating for patients
Generally not useful for assessment of coronary artery stenosis
PA
LA
RLNC
TAPVC to RA, RHV to RA, Left IVC to LA

Coronary CTA Image Analysis
Coronary artery morphology: 2D axial Curved MPR (double oblique method) MIP VR
Cardiac Function: 2D method: Area length, Simpson’s method 3D method: Threshold method
Valves (retrospective gated) Myocardial Perfusion
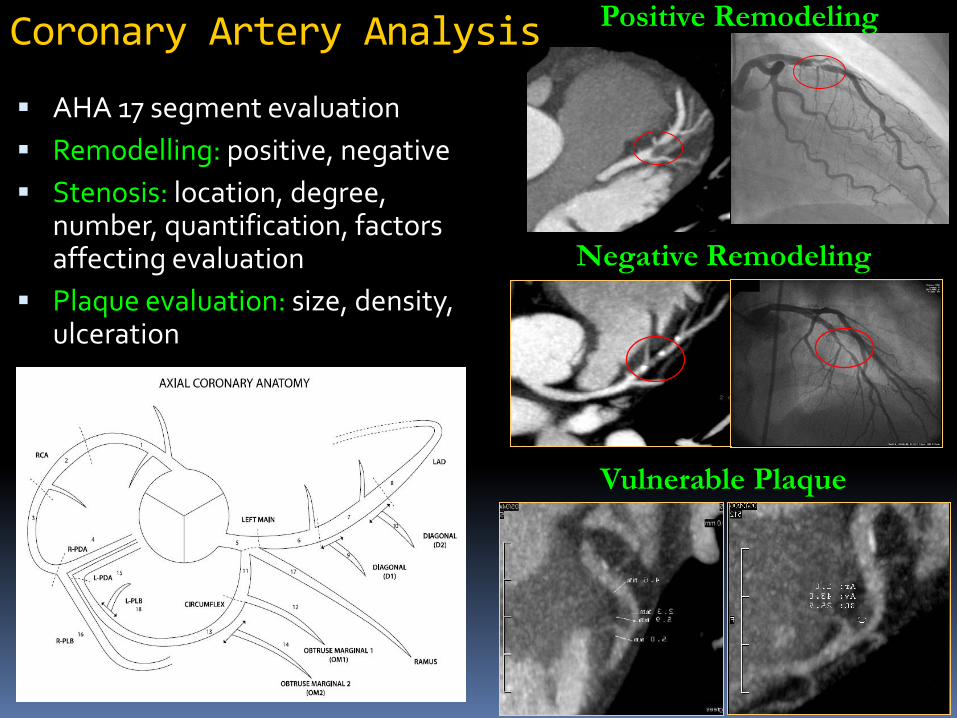
Coronary Artery Analysis
AHA 17 segment evaluation Remodelling: positive, negative Stenosis: location, degree,
number, quantification, factors affecting evaluation
Plaque evaluation: size, density, ulceration
Positive Remodeling
Negative Remodeling
Vulnerable Plaque
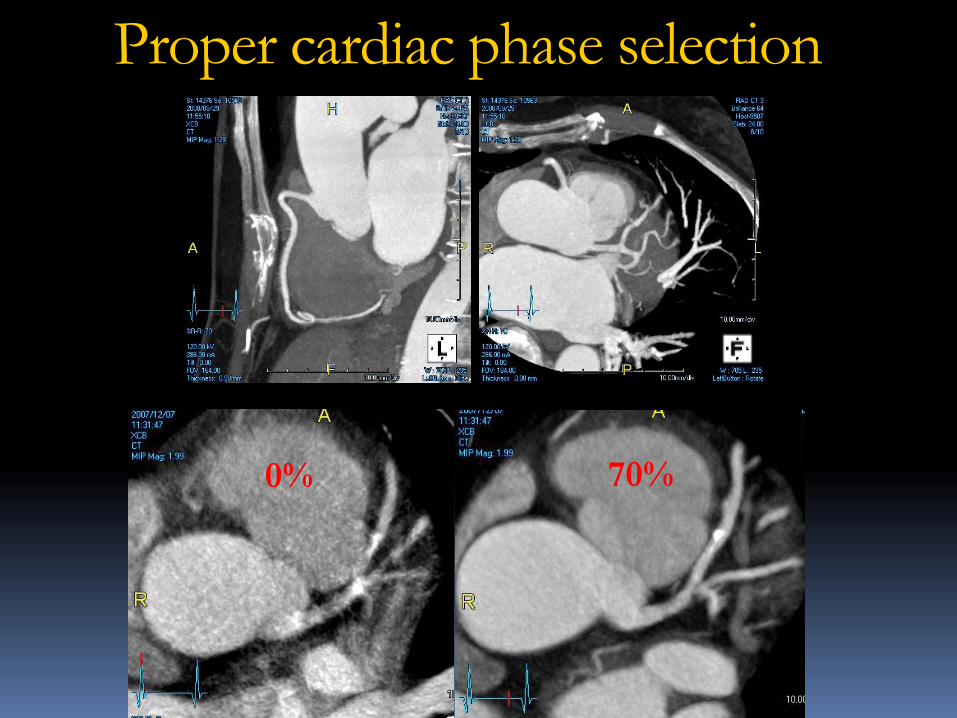
Proper cardiac phase selection
70%0%

Padding in Prospective gating
64% 74% 84%

Window/Level
W/L: 800/100 W/L: 800/350

Evaluation of Calcified Lesions
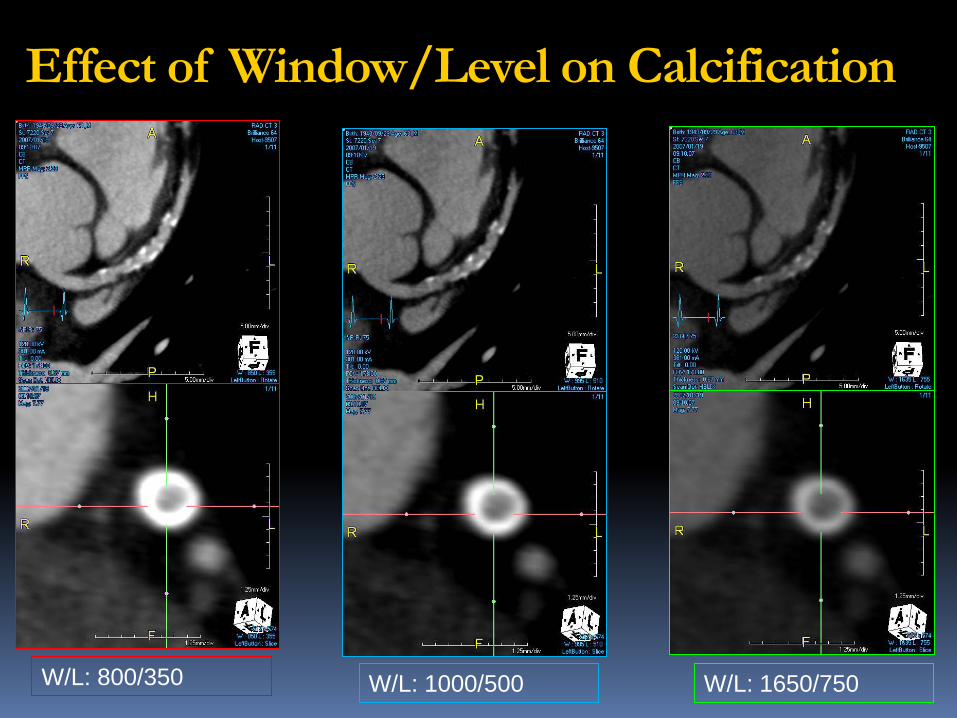
W/L: 800/350 W/L: 1000/500 W/L: 1650/750
Effect of Window/Level on Calcification

Plaque Characterization

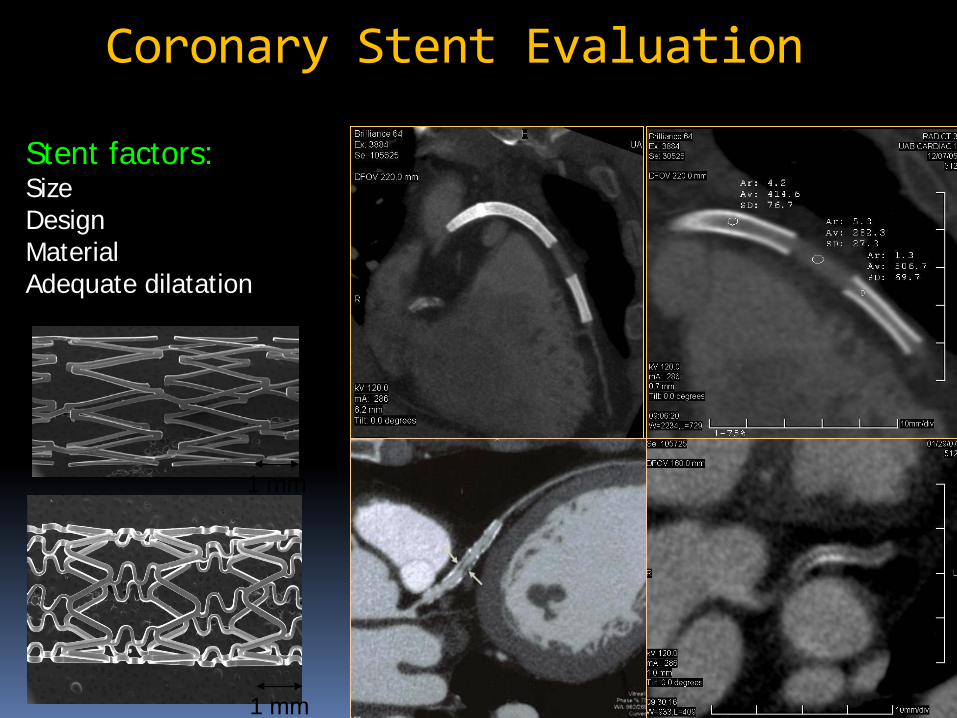
Coronary Stent Evaluation
1 mm
Stent factors: Size Design Material Adequate dilatation
1 mm
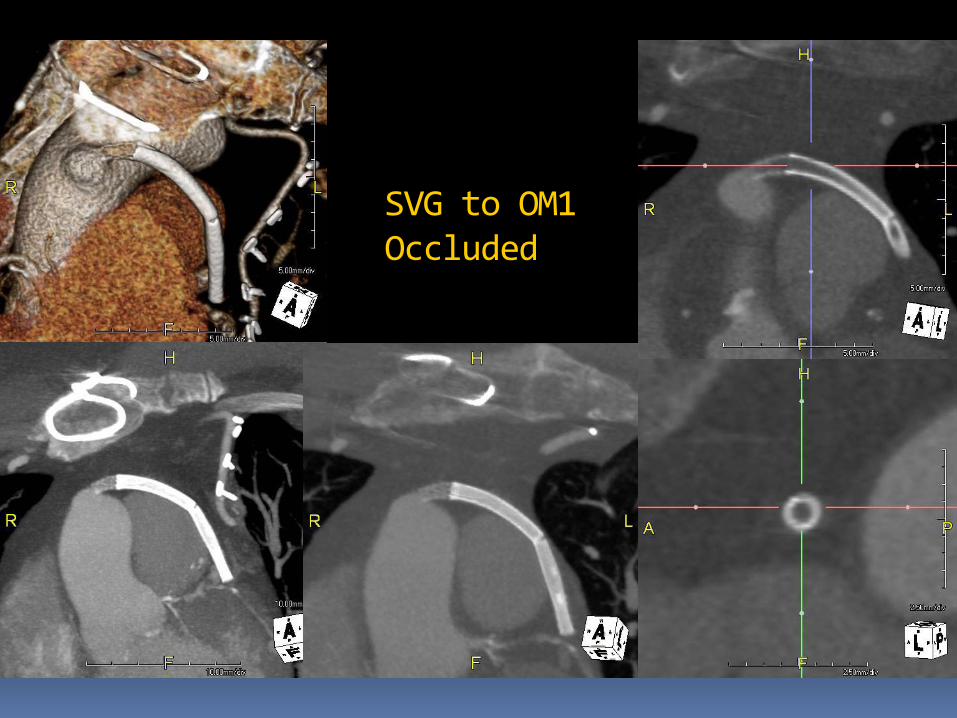
SVG to OM1 Occluded

0.5 mm 1.0 mm 2.0 mm 3.0 mm 4.0 mm
0.5 mm 1.0 mm 2.0 mm 3.0 mm 4.0 mm
Rabbit Iliac artery 3 mm Nitinol Stent: Effect of image thickness

Rabbit Aorta Stents: Standard vs Sharp filter
Smooth Sharp

Improving Stent evaluation
High mAs to improve contrast resolution High intravascular attenuation (high CM
iodine/flow rate) Low HR Iterative reconstruction: less blooming Use sharp kernel for reconstruction Thin section images, MPR, double oblique

CABG VR shows the grafts
course
MIP/MPR for patency
Must look at anastamosis sites
Re-do: relation to sternum

Coronary Artery Anomaly In a younger age: restrict FOV
For inter arterial course show pulmonary valve relation (good to have some contrast in right circulation)
VR images show spatial relationship nicely
MPR/Thin MIP images needed to document intramural course & oblique narrow takeoff of the anomalous vessel
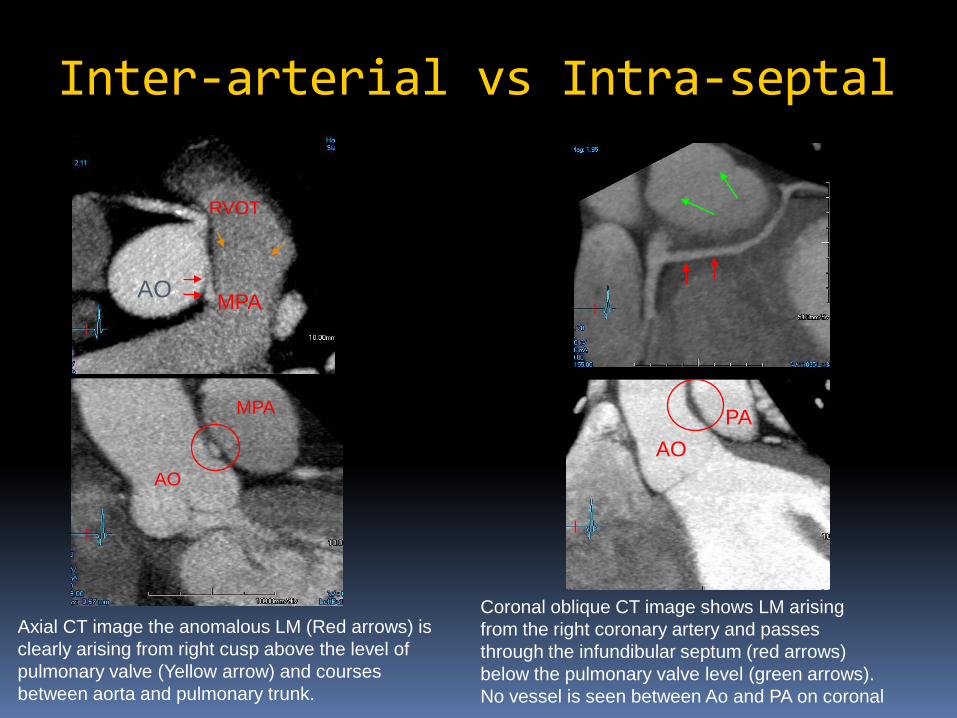
Inter-arterial vs Intra-septal
AO
RVOT
MPA
AO
MPA
Axial CT image the anomalous LM (Red arrows) is clearly arising from right cusp above the level of pulmonary valve (Yellow arrow) and courses between aorta and pulmonary trunk.
AOPA
Coronal oblique CT image shows LM arising from the right coronary artery and passes through the infundibular septum (red arrows) below the pulmonary valve level (green arrows). No vessel is seen between Ao and PA on coronal
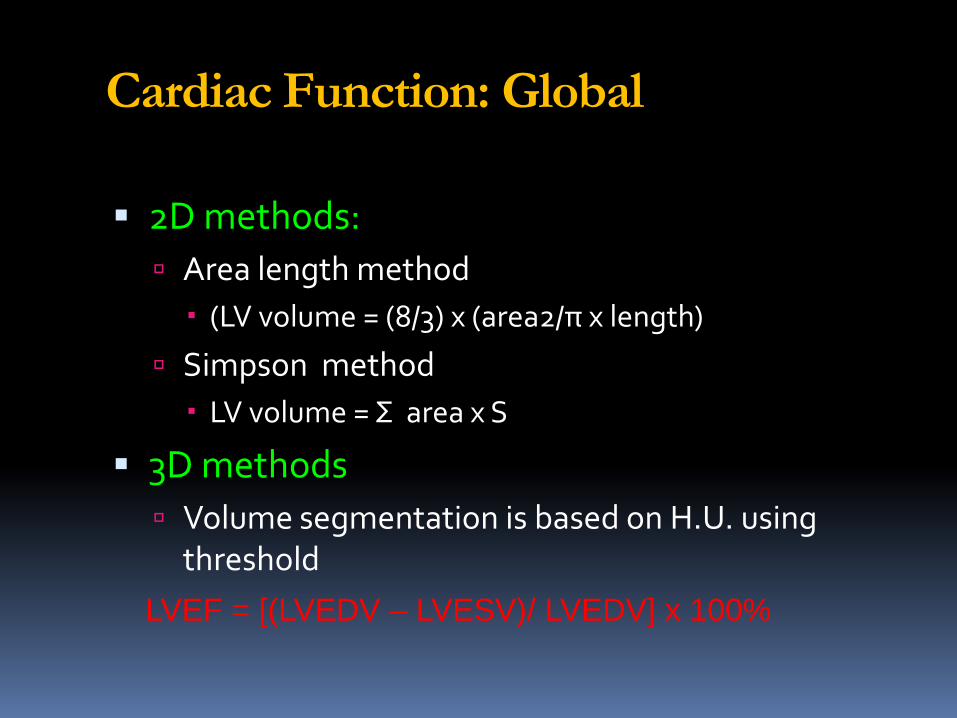
Cardiac Function: Global
2D methods: Area length method (LV volume = (8/3) x (area2/π x length)
Simpson method LV volume = Σ area x S
3D methods Volume segmentation is based on H.U. using
thresholdLVEF = [(LVEDV – LVESV)/ LVEDV] x 100%
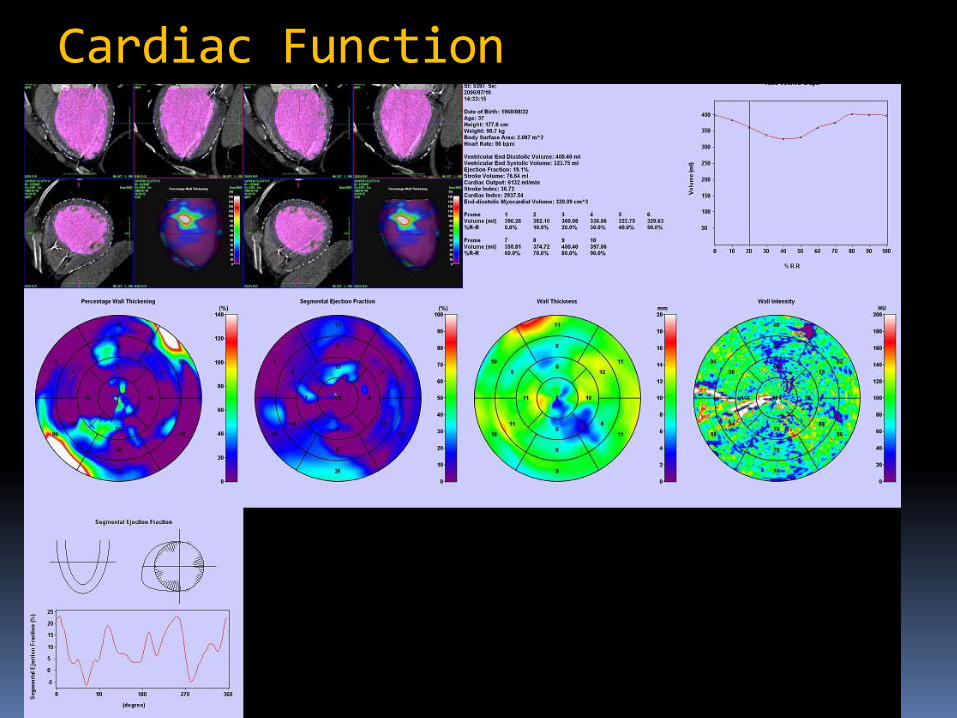
Cardiac Function

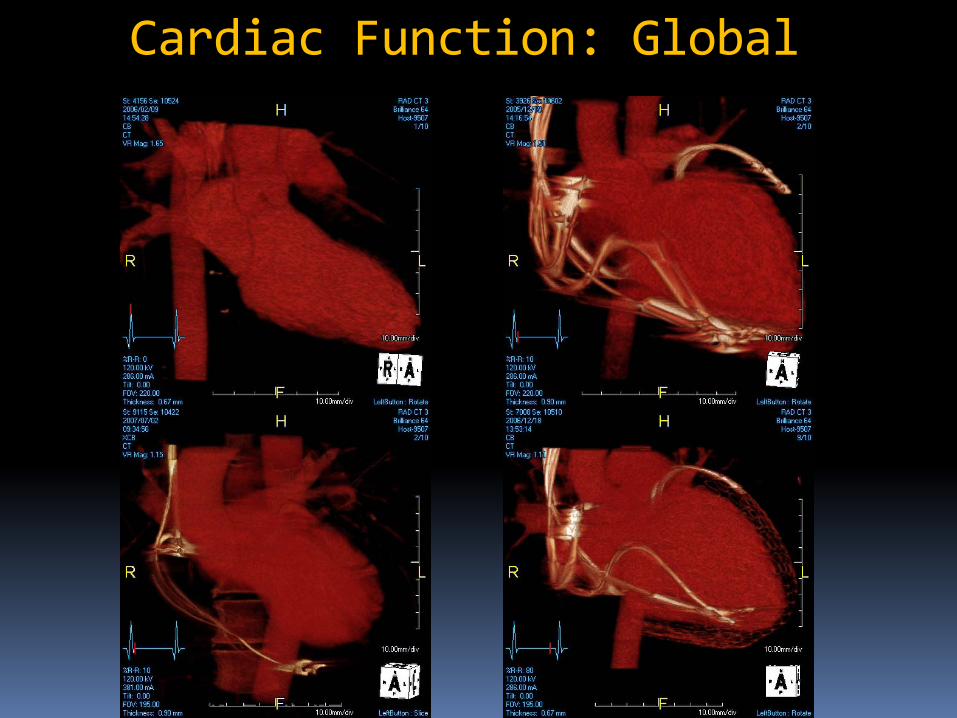
Cardiac Function: Global
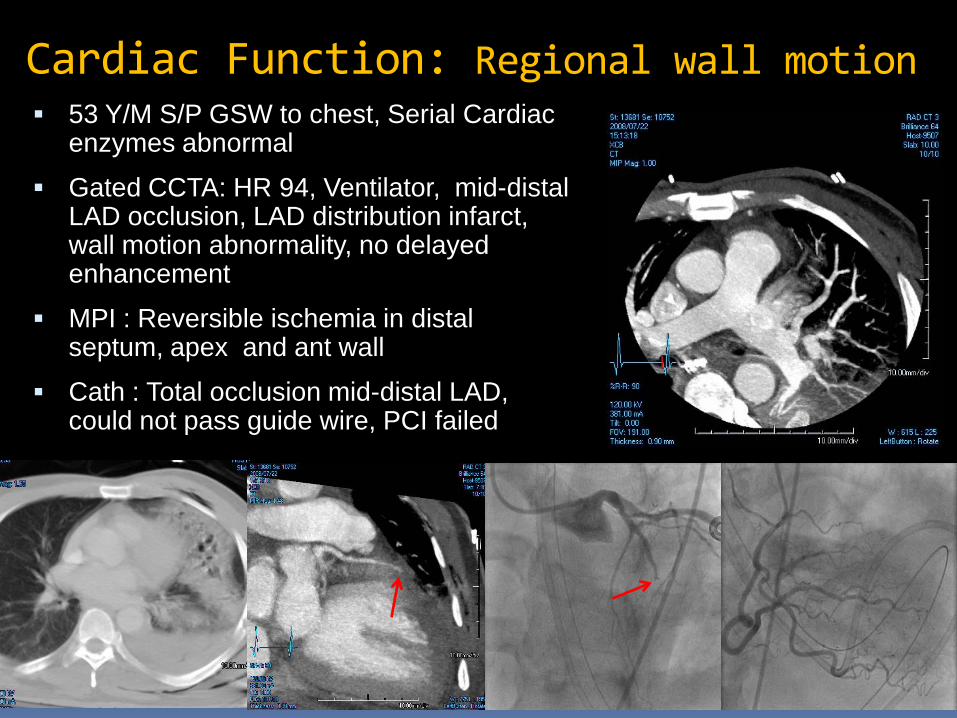
Cardiac Function: Regional wall motion 53 Y/M S/P GSW to chest, Serial Cardiac
enzymes abnormal
Gated CCTA: HR 94, Ventilator, mid-distal LAD occlusion, LAD distribution infarct, wall motion abnormality, no delayed enhancement
MPI : Reversible ischemia in distal septum, apex and ant wall
Cath : Total occlusion mid-distal LAD, could not pass guide wire, PCI failed
Myocardial Perfusion
MinIP and Thin MPR better than thick MIP: due to greater contrast to noise ratio
Use narrow W/L (200/100) maximizes contrast between normal and abnormal myocardium
Persistence of suspected defect across multiple phases
Look for regional wall motion abnormality

Conclusions
Coronary CTA assessment requires real time interaction with the volumetric data and the interpreting physician must become proficient with workstation and post processing techniques Always assess each vessel in multiple
views and toggle between MPR and MIP without changing position to capture advantages of both methods Change W/L for calcified lesions
Stents: Use sharper kernel, thin sections & iterative reconstruction Retrospective gated CTA: valve and
cardiac function evaluation possible Myocardial Perfusion: Use narrow W/L,
minIP and thin MPR more helpful, look for regional wall motion abnormality
Conclusions

Thank [email protected]
Recommended