China Economic Review 32 (2015) 43–56
Contents lists available at ScienceDirect
China Economic Review
Impacts of ISO 14001 adoption on firm performance:Evidence from China
Wenlong HE a, Chong LIU b, Jiangyong LU c,⁎, Jing CAOd
a Guanghua School of Management, Peking University, Beijing 100871, Chinab School of Economics and Management, Tsinghua University, Beijing 100871, Chinac Guanghua School of Management, Peking University, Beijing 100871, Chinad School of Economics and Management, Tsinghua University, Beijing 100087, China
a r t i c l e i n f o
⁎ Corresponding author. Tel.: +86 10 62767406.E-mail addresses: [email protected] (W. H
http://dx.doi.org/10.1016/j.chieco.2014.11.0081043-951X/© 2014 Elsevier Inc. All rights reserved.
a b s t r a c t
Article history:Received 16 January 2013Received in revised form 17 November 2014Accepted 18 November 2014Available online 24 November 2014
This paper investigates the impacts of ISO 14001 adoption on the performance of firms using asample of Chinese firms. The results show that adopting ISO 14001 has insignificant impacts onthe financial performance of Chinese firms. A further investigation shows that the adoption ofISO 14001 increases sales and costs of firms in similar magnitudes, thus causes insignificantnet effects on the financial performance. Despite negligible financial gains, the adoption ofISO 14001 provides implicit non-financial benefits, such as promoting export and relieving coerciveenvironmental inspections from the government.
© 2014 Elsevier Inc. All rights reserved.
JEL classification:D22L51Q56
Keywords:ISO 14001Chinese firmsFinancial performanceNon-financial benefits
1. Introduction
With the urgent need for environmental protection, governments in many countries have formulated command-and-controlpolicies, such as setting energy conservation targets and emission abatement mandates. However, such command-and-controlpolicies are often criticized as being inflexible, heavy-handed, cost-ineffective, and providing fewer incentives for induced technologychanges. Based on the limitations of the command-and-control policies, governments in many countries have begun to encouragecertainmarket-oriented instruments or voluntary approaches that are typically viewed asmore flexible, cost-effective and acceptableto the private sectors (Arimura, Darnall, & Katayama, 2011). Since the mid-1990s, various voluntary actions in environmental man-agement have been adopted by firms around the world, and the most notable practice is the adoption of ISO 14001 standard.
As the standard environmental management system certified by the International Organization for Standardization (ISO), ISO 14001has beenwidely adopted across theworld (Ambec& Lanoie, 2008). To understand the fast expansion of the ISO 14001 standard, scholarshave been interested in twoquestions: (1)Whatmotivatefirms to adopt the ISO14001 standard? (2)What are the impacts of ISO14001adoption onfirmperformance? To date, themajority of the literature has focused on ISO 14001 adoption in developed economies. Somerepresentative studies in this area include Babakri, Bennett, and Franchetti (2003) andDelmas (2000), who studied the expansion of ISO
e), [email protected] (C. Liu), [email protected] (J. Lu), [email protected] (J. Cao).
44 W. He et al. / China Economic Review 32 (2015) 43–56
14001 among U.S. firms, Canon-de-Francia and Garces-Ayerbe (2009) andMorrow and Rondinelli (2002), who studied the adoption ofISO 14001 in European counties, and Arimura et al. (2011), who studied the adoption of ISO 14001 by Japanese firms.
With the rapid development of industrial economy in recent decades, the pollution in China has aroused wide concern around theworld; of particular concern is the frequent haze that comprised high concentrated PM2.5 in urban China. With the heightened aware-ness of corporate social responsibility, an increasing number of Chinese firms are actively pursuing various certifications on environ-mental management, and ISO 14001 is the most popular one. According to the Certification and Accreditation Administration ofChina (CAAC), the number of Chinese firms that adopted ISO 14001 reached 72,124 at the end of 2011, and China has outpacedJapan and the United States to become the world's largest country for ISO 14001 adoption. This paper intends to evaluate impacts ofISO 14001 adoption on performance of Chinese firms.
Although the extant literature has examined the effect (and extent) of ISO 14001 adoption onfirmperformance,findings are not con-clusive (for a review, see Berchicci and King (2007)). Some studies have found that the adoption of ISO 14001 standardwould improve afirm's performance in terms of Tobin's Q, return on assets (ROA), return on sales (ROS), and return on equity (ROE) (Dowell, Hart, &Yeung, 2000; Jacobs, Singhal, & Subramanian, 2010; Morrow & Rondinelli, 2002; Nishitani, 2011), whereas others have found neutralor even negative effects of ISO 14001 adoption on a firm's performance (Gilley, Worrell, Davidson, & EI-Jelly, 2000; King & Lenox,2001). Specifically, firms adopting the ISO 14001 standard are labeled as environment-friendly; therefore, they can gain differential ad-vantages in their product sales, which could lead to larger market shares and higher profitability (Nishitani, 2011). Moreover, firmsadopting the ISO 14001 standard may develop more efficient production processes that reduce operational and waste-disposal costs(Hart &Ahuja, 1996). However, the adoption of the ISO 14001 standardmay not be able to boostfirms' sales or enhance their stockmar-ket evaluation; in such situations, the benefits would fail to offset increased costs of initial adoption and subsequent maintenance fees,especially in the short run (Babakri et al., 2003; Bansal & Bogner, 2002). Therefore, it is still unclear whether ISO 14001 adoption en-hances financial performance of firms or it is merely a placebo for firm managers who want to obtain membership in the ‘green club’.
The difficulty of reaching consistent findings about impacts of ISO 14001 adoption on firm performance may be incurred by thepotential endogeneity problem (Potoski & Prakash, 2005), and divergent research settings (King & Lenox, 2001). For example,Yang, Hong, and Modi (2011) found that positive and significant impacts of environmental management on firm performancewere more likely to be observed in developed countries, whereas such an outcome did not occur in developing countries. Elsayedand Paton (2005) indicated that such distinct effects might also exist across developing countries, such as in China, Argentina, andTurkey. In addition, the adoption of ISO 14001 may exert distinct effects across different industries, and the aggregated net effectmight depend on the industry distribution of sampled firms.
In this paper, we generate a unique dataset by matching a survey of Chinese firms with the annual census data of Chinese industrialfirms. We first examine whether the adoption of ISO 14001 standard affects firm performance approximated by several financial indi-cators, including ROA, ROE and ROS. We find statistically insignificant effects of ISO 14001 adoption on these financial performance in-dicators. To determinemechanisms underlying the findings, we study the impacts of ISO 14001 adoption on sales and costs of firms.Wefind that the ISO 14001 adoption simultaneously increases a firm's sales and costs in similar magnitudes. The increase of sales and costsmay offset each other and lead to insignificant impacts onfirm'sfinancial performance. Furthermore,wedivide industries into three sub-groups according to their pollution levels, namely heavy-, mid- and light-pollution industries. Results show that ISO 14001 adoption sig-nificantly affects sales and costs of firms in heavy-pollution industries, but does not affect firms in themid- or light-pollution industries.
Given the insignificant impacts of the ISO 14001 adoption on firm performance, the question remains why somany Chinese firmshave adopted ISO 14001 standard. Therefore, we further examine several implicit benefits of ISO 14001 adoption. Firstly, because alarge number of Chinese firms have made considerable headway in their implementation of “going-out” strategies, we considerfirm exporting. The findings show that Chinese firms with ISO 14001 certification tend to export a larger percentage of their totalsales, suggesting that ISO 14001 adoption provides Chinese firms with better access to the global market. Secondly, the Chinesegovernment has strengthened environmental inspections against manufacturing firms as a control measure against deteriorationof environmental pollution. Therefore, we also investigate how ISO 14001 adoption, as a substitute for command-and-control policies,helps firms relieve the pressure of government environmental inspections. Results show that firms with ISO 14001 certificationreceive less frequent inspections than their counterparts without ISO 14001 certification. In sum, although ISO 14001 adoptiondoes not improve financial performance of Chinese firms, there are implicit benefits associatedwith the certification thatmay explainwhy Chinese firms actively adopt the ISO 14001 standard.
This paper is organized as follows: in Section 2, we give a brief introduction of the data and empirical methods; in Section 3, wepresent the primary results and robustness tests; and in Section 4, we reach the conclusion.
2. Data and methods
2.1. Data
To examine the impacts of ISO 14001 adoption on firm performance, we combined a firm-level survey that was conducted by theChina Center for Economic Research (CCER) in 2006 with Chinese industrial firm census data that were compiled annually by theNational Bureau of Statistics. This CCER survey includes 1268 manufacturing firms randomly selected from 12 cities based onChina's industrial firm census data. The 12 sampled cities represent Chinese regions with different development levels.1 In each
1 The 12 sampled citieswere distributed among coastal, central andwestern regions. According to the per-capita GDP of 2005, these 12 citieswere grouped into threecategories: high, middle and low income. The income gap was roughly twofold between any two neighboring groups.
45W. He et al. / China Economic Review 32 (2015) 43–56
sampled city, the survey covers approximately 100manufacturingfirmswith annual sales over 5million RMB. Themajority (68.7%) ofthe sampled firms are domestic privately owned firms, and the remaining percentage is equally distributed among SOEs and foreign-owned firms.2 In terms of export, 37.2% of the sampled firms engaged in export, and the average share of export to total sales is 10%. Inthe CCER survey, the respondents are asked if the firm has adopted the ISO 14001 standard and in which year the adoption occurred.The overall ISO 14001 adoption ratio in the sample is 14%.
Because the sampled firms in the CCER survey are randomly selected from China's industrial firm census data, the CCER survey isactually a subsample of China's industrial firm census data; therefore, we are able to match the sampled firms by their firm identifi-cation code to create a panel dataset. The financial information and other firm characteristics are derived from the census data,where-as the status of a firm's ISO 14001 adoption in various years is derived from the CCER survey.We confine the period of study betweenthe years of 2004 and 2007, and thus, the final sample comprised 3868 observations. Table 1 provides definitions of variablesand information on data sources. To address the randomness of the sampled firms in the CCER survey, we compare the summarystatistics of two datasets and find that the CCER survey has a similar pattern to the firms in the industrial census data in terms of itsmean and standard deviation of key variables. Panel A in Table 2 reports the summary statistics of variables in the current research,while Panel B in Table 2 reports the comparison with the industrial census data for the randomness of sample selection in the CCERsurvey.
2.2. Panel regression method
We first examine the impacts of ISO 14001 adoption on the sampled firms' financial performancewith panel regressions. The basicmodel specification can be expressed as follows:
2 Bec
Yit ¼ β0 þ β1ISOAdoptionit þ X0
itγ þ λ j þ νp þ θt þ εit ð1Þ
where i, j, p, t are subscripts representing the firm, 2-digit industry, province and year, respectively; Yit is a series of dependentvariables that indicate firm performance, such as ROA, ROE, ROS, sales, and costs; ISOAdoptionit is the key explanatory variable thatindicates whether firm i adopted ISO 14001 in year t; and Xit is a vector of control variables at both the firm- and the industry-levelthat have been proven to affectfirm's financial performance. Thefirm-level control variables include firm size, ownership type, financialleverage, advertising expenditures, as well as total factor productivity which is considered as a proxy of managerial quality (Melitz,2003). The industry-level control variables are Herfindahl–Hirschman Index (HHI) of 2-digit industries in the city and growth rate of2-digit industries in the city. Accordingly, β1 and γ are the coefficients of ISOAdoptionit and Xit. Finally, we include the 2-digit industrydummies (λj), subnational region dummies (νp), and year dummies (θt) to capture the industry and location differences and macro-economic conditions that might affect a firm's performance. εit is the error term.
2.3. Instrumental variables estimation
Our panel regressionsmay suffer from endogeneity for the following reasons. First, some unobserved omitted variables which in-fluence both firms' decisions about whether to adopt ISO 14001 and their financial performance (Barla, 2007), may bias the results.Second, reverse causality may arise, in that firms with better performance may have a higher probability to adopt ISO 14001. To ad-dress the endogeneity issue, we use instrumental variable (IV) techniques.We use rival firm's ISO 14001 adoption ratio within the sameprovince and the same industry as an IV for the focalfirm's ISO 14001 adoption. Rivalfirms' ISO 14001 adoptionmay positively associatewith the focal firm's adopting behavior due to peer pressure. On the other hand, rival firms' ISO 14001 adoption seems irrelevant tothe focal firm's financial performance because ISO 14001 is working through the development of internal procedures which shouldnot generate significant externalities (Barla, 2007).
2.4. Propensity score matching method
We also employ the propensity scorematching (PSM)method for robustness checks.Wefirst classify our sample into two groups:the treatment group and the control group. The treatment group is composed of firms that have adopted the ISO 14001 standard,whereas the control group is composed of the non-adoption counterparts. The second step is to calculate propensity scores, whichmeasure the extent of matching in the two groups inmultiple dimensions. Specifically, propensity score is defined as “the conditionalprobability of receiving a treatment given pre-treatment characteristics” by Rosenbaum and Rubin (1983), and is calculated asp(X) = Pr[D = 1|X] = E[D|X], where X is the multidimensional vector of characteristics of the control group and D is an indicatorof ISO 14001 adoption. We control several dimensions that may affect firms' propensity to adopt ISO 14001, including firm demo-graphics and industry-level characteristics. To calculate propensity scores, we follow Dehejia and Wahba (2002) and Becker andIchino (2002), and use a logit model, which is specified as:
p Xið Þ ¼ Pr Di ¼ 1jXi½ � ¼ exp βXið Þ1þ exp βXið Þ ð2Þ
ause the firms with ownership in Hong Kong, Macau, and Taiwan (HMT) only comprised a small fraction, we categorized them into foreign owned.
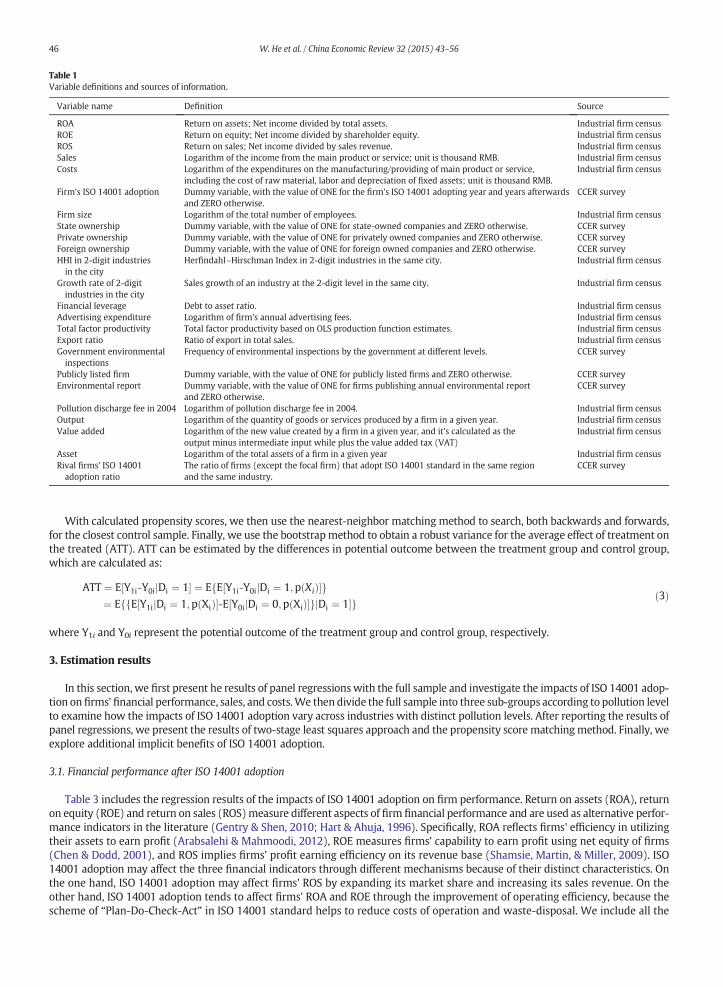
Table 1Variable definitions and sources of information.
Variable name Definition Source
ROA Return on assets; Net income divided by total assets. Industrial firm censusROE Return on equity; Net income divided by shareholder equity. Industrial firm censusROS Return on sales; Net income divided by sales revenue. Industrial firm censusSales Logarithm of the income from the main product or service; unit is thousand RMB. Industrial firm censusCosts Logarithm of the expenditures on the manufacturing/providing of main product or service,
including the cost of raw material, labor and depreciation of fixed assets; unit is thousand RMB.Industrial firm census
Firm's ISO 14001 adoption Dummy variable, with the value of ONE for the firm's ISO 14001 adopting year and years afterwardsand ZERO otherwise.
CCER survey
Firm size Logarithm of the total number of employees. Industrial firm censusState ownership Dummy variable, with the value of ONE for state-owned companies and ZERO otherwise. CCER surveyPrivate ownership Dummy variable, with the value of ONE for privately owned companies and ZERO otherwise. CCER surveyForeign ownership Dummy variable, with the value of ONE for foreign owned companies and ZERO otherwise. CCER surveyHHI in 2-digit industriesin the city
Herfindahl–Hirschman Index in 2-digit industries in the same city. Industrial firm census
Growth rate of 2-digitindustries in the city
Sales growth of an industry at the 2-digit level in the same city. Industrial firm census
Financial leverage Debt to asset ratio. Industrial firm censusAdvertising expenditure Logarithm of firm's annual advertising fees. Industrial firm censusTotal factor productivity Total factor productivity based on OLS production function estimates. Industrial firm censusExport ratio Ratio of export in total sales. Industrial firm censusGovernment environmentalinspections
Frequency of environmental inspections by the government at different levels. CCER survey
Publicly listed firm Dummy variable, with the value of ONE for publicly listed firms and ZERO otherwise. CCER surveyEnvironmental report Dummy variable, with the value of ONE for firms publishing annual environmental report
and ZERO otherwise.CCER survey
Pollution discharge fee in 2004 Logarithm of pollution discharge fee in 2004. Industrial firm censusOutput Logarithm of the quantity of goods or services produced by a firm in a given year. Industrial firm censusValue added Logarithm of the new value created by a firm in a given year, and it's calculated as the
output minus intermediate input while plus the value added tax (VAT)Industrial firm census
Asset Logarithm of the total assets of a firm in a given year Industrial firm censusRival firms' ISO 14001adoption ratio
The ratio of firms (except the focal firm) that adopt ISO 14001 standard in the same regionand the same industry.
CCER survey
46 W. He et al. / China Economic Review 32 (2015) 43–56
With calculated propensity scores, we then use the nearest-neighbor matching method to search, both backwards and forwards,for the closest control sample. Finally, we use the bootstrapmethod to obtain a robust variance for the average effect of treatment onthe treated (ATT). ATT can be estimated by the differences in potential outcome between the treatment group and control group,which are calculated as:
ATT ¼ E Y1i‐Y0ijDi ¼ 1½ � ¼ E E Y1i‐Y0ijDi ¼ 1;p Xið Þ½ �f g¼ E E Y1i½ jDi ¼ 1;p Xið Þf �‐E Y0ijDi ¼ 0;p Xið Þ½ �gjDi ¼ 1�f g ð3Þ
where Y1i and Y0i represent the potential outcome of the treatment group and control group, respectively.
3. Estimation results
In this section, we first present he results of panel regressionswith the full sample and investigate the impacts of ISO 14001 adop-tion on firms' financial performance, sales, and costs.We then divide the full sample into three sub-groups according to pollution levelto examine how the impacts of ISO 14001 adoption vary across industries with distinct pollution levels. After reporting the results ofpanel regressions, we present the results of two-stage least squares approach and the propensity score matchingmethod. Finally, weexplore additional implicit benefits of ISO 14001 adoption.
3.1. Financial performance after ISO 14001 adoption
Table 3 includes the regression results of the impacts of ISO 14001 adoption on firm performance. Return on assets (ROA), returnon equity (ROE) and return on sales (ROS)measure different aspects of firm financial performance and are used as alternative perfor-mance indicators in the literature (Gentry & Shen, 2010; Hart & Ahuja, 1996). Specifically, ROA reflects firms' efficiency in utilizingtheir assets to earn profit (Arabsalehi & Mahmoodi, 2012), ROE measures firms' capability to earn profit using net equity of firms(Chen & Dodd, 2001), and ROS implies firms' profit earning efficiency on its revenue base (Shamsie, Martin, & Miller, 2009). ISO14001 adoption may affect the three financial indicators through different mechanisms because of their distinct characteristics. Onthe one hand, ISO 14001 adoption may affect firms' ROS by expanding its market share and increasing its sales revenue. On theother hand, ISO 14001 adoption tends to affect firms' ROA and ROE through the improvement of operating efficiency, because thescheme of “Plan-Do-Check-Act” in ISO 14001 standard helps to reduce costs of operation and waste-disposal. We include all the
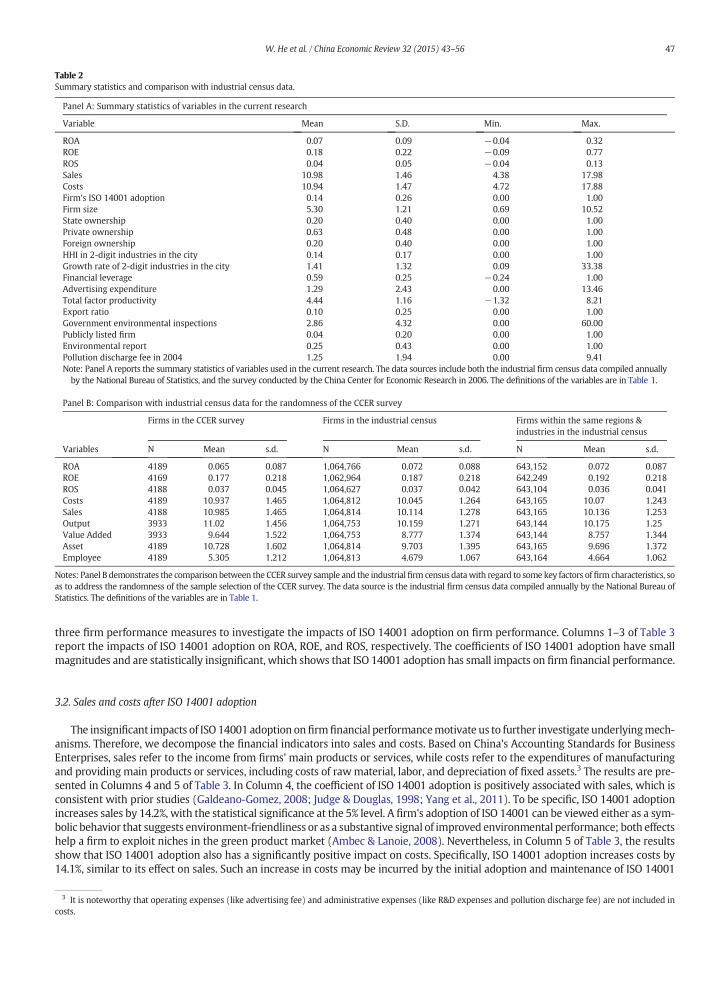
Table 2Summary statistics and comparison with industrial census data.
Panel A: Summary statistics of variables in the current research
Variable Mean S.D. Min. Max.
ROA 0.07 0.09 −0.04 0.32ROE 0.18 0.22 −0.09 0.77ROS 0.04 0.05 −0.04 0.13Sales 10.98 1.46 4.38 17.98Costs 10.94 1.47 4.72 17.88Firm's ISO 14001 adoption 0.14 0.26 0.00 1.00Firm size 5.30 1.21 0.69 10.52State ownership 0.20 0.40 0.00 1.00Private ownership 0.63 0.48 0.00 1.00Foreign ownership 0.20 0.40 0.00 1.00HHI in 2-digit industries in the city 0.14 0.17 0.00 1.00Growth rate of 2-digit industries in the city 1.41 1.32 0.09 33.38Financial leverage 0.59 0.25 −0.24 1.00Advertising expenditure 1.29 2.43 0.00 13.46Total factor productivity 4.44 1.16 −1.32 8.21Export ratio 0.10 0.25 0.00 1.00Government environmental inspections 2.86 4.32 0.00 60.00Publicly listed firm 0.04 0.20 0.00 1.00Environmental report 0.25 0.43 0.00 1.00Pollution discharge fee in 2004 1.25 1.94 0.00 9.41Note: Panel A reports the summary statistics of variables used in the current research. The data sources include both the industrial firm census data compiled annuallyby the National Bureau of Statistics, and the survey conducted by the China Center for Economic Research in 2006. The definitions of the variables are in Table 1.
Panel B: Comparison with industrial census data for the randomness of the CCER survey
Firms in the CCER survey Firms in the industrial census Firms within the same regions &industries in the industrial census
Variables N Mean s.d. N Mean s.d. N Mean s.d.
ROA 4189 0.065 0.087 1,064,766 0.072 0.088 643,152 0.072 0.087ROE 4169 0.177 0.218 1,062,964 0.187 0.218 642,249 0.192 0.218ROS 4188 0.037 0.045 1,064,627 0.037 0.042 643,104 0.036 0.041Costs 4189 10.937 1.465 1,064,812 10.045 1.264 643,165 10.07 1.243Sales 4188 10.985 1.465 1,064,814 10.114 1.278 643,165 10.136 1.253Output 3933 11.02 1.456 1,064,753 10.159 1.271 643,144 10.175 1.25Value Added 3933 9.644 1.522 1,064,753 8.777 1.374 643,144 8.757 1.344Asset 4189 10.728 1.602 1,064,814 9.703 1.395 643,165 9.696 1.372Employee 4189 5.305 1.212 1,064,813 4.679 1.067 643,164 4.664 1.062
Notes: Panel B demonstrates the comparison between the CCER survey sample and the industrialfirm census datawith regard to some key factors of firm characteristics, soas to address the randomness of the sample selection of the CCER survey. The data source is the industrial firm census data compiled annually by the National Bureau ofStatistics. The definitions of the variables are in Table 1.
47W. He et al. / China Economic Review 32 (2015) 43–56
three firm performance measures to investigate the impacts of ISO 14001 adoption on firm performance. Columns 1–3 of Table 3report the impacts of ISO 14001 adoption on ROA, ROE, and ROS, respectively. The coefficients of ISO 14001 adoption have smallmagnitudes and are statistically insignificant, which shows that ISO 14001 adoption has small impacts on firm financial performance.
3.2. Sales and costs after ISO 14001 adoption
The insignificant impacts of ISO 14001 adoption onfirmfinancial performancemotivate us to further investigate underlyingmech-anisms. Therefore, we decompose the financial indicators into sales and costs. Based on China's Accounting Standards for BusinessEnterprises, sales refer to the income from firms' main products or services, while costs refer to the expenditures of manufacturingand providing main products or services, including costs of rawmaterial, labor, and depreciation of fixed assets.3 The results are pre-sented in Columns 4 and 5 of Table 3. In Column 4, the coefficient of ISO 14001 adoption is positively associated with sales, which isconsistent with prior studies (Galdeano-Gomez, 2008; Judge & Douglas, 1998; Yang et al., 2011). To be specific, ISO 14001 adoptionincreases sales by 14.2%, with the statistical significance at the 5% level. A firm's adoption of ISO 14001 can be viewed either as a sym-bolic behavior that suggests environment-friendliness or as a substantive signal of improved environmental performance; both effectshelp a firm to exploit niches in the green product market (Ambec & Lanoie, 2008). Nevertheless, in Column 5 of Table 3, the resultsshow that ISO 14001 adoption also has a significantly positive impact on costs. Specifically, ISO 14001 adoption increases costs by14.1%, similar to its effect on sales. Such an increase in costs may be incurred by the initial adoption and maintenance of ISO 14001
3 It is noteworthy that operating expenses (like advertising fee) and administrative expenses (like R&D expenses and pollution discharge fee) are not included incosts.
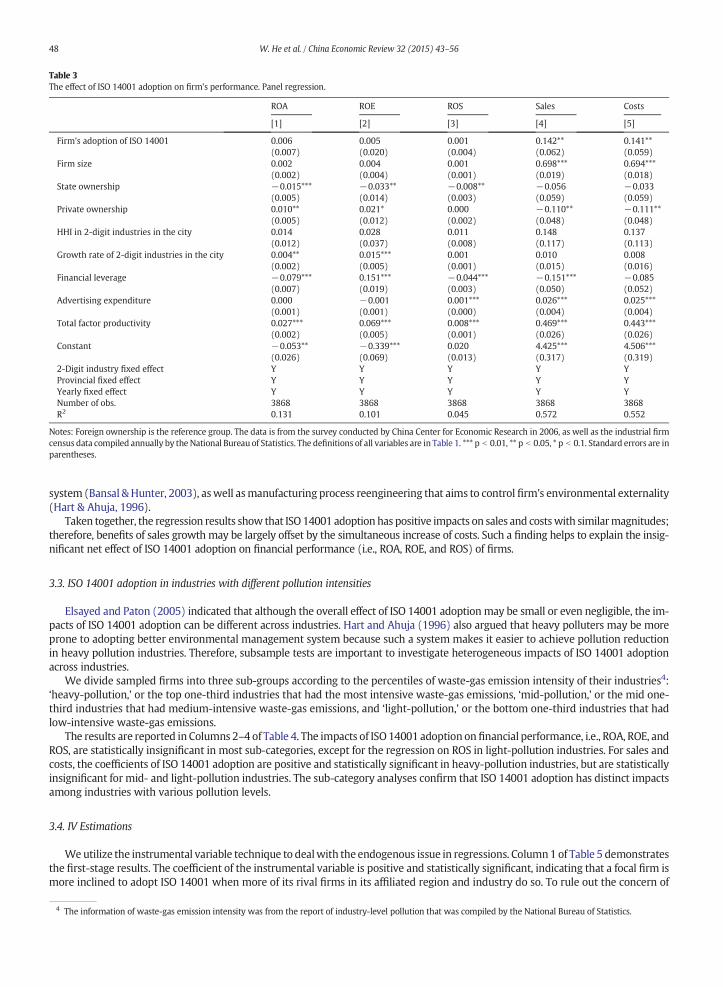
Table 3The effect of ISO 14001 adoption on firm's performance. Panel regression.
ROA ROE ROS Sales Costs
[1] [2] [3] [4] [5]
Firm's adoption of ISO 14001 0.006 0.005 0.001 0.142** 0.141**(0.007) (0.020) (0.004) (0.062) (0.059)
Firm size 0.002 0.004 0.001 0.698*** 0.694***(0.002) (0.004) (0.001) (0.019) (0.018)
State ownership −0.015*** −0.033** −0.008** −0.056 −0.033(0.005) (0.014) (0.003) (0.059) (0.059)
Private ownership 0.010** 0.021* 0.000 −0.110** −0.111**(0.005) (0.012) (0.002) (0.048) (0.048)
HHI in 2-digit industries in the city 0.014 0.028 0.011 0.148 0.137(0.012) (0.037) (0.008) (0.117) (0.113)
Growth rate of 2-digit industries in the city 0.004** 0.015*** 0.001 0.010 0.008(0.002) (0.005) (0.001) (0.015) (0.016)
Financial leverage −0.079*** 0.151*** −0.044*** −0.151*** −0.085(0.007) (0.019) (0.003) (0.050) (0.052)
Advertising expenditure 0.000 −0.001 0.001*** 0.026*** 0.025***(0.001) (0.001) (0.000) (0.004) (0.004)
Total factor productivity 0.027*** 0.069*** 0.008*** 0.469*** 0.443***(0.002) (0.005) (0.001) (0.026) (0.026)
Constant −0.053** −0.339*** 0.020 4.425*** 4.506***(0.026) (0.069) (0.013) (0.317) (0.319)
2-Digit industry fixed effect Y Y Y Y YProvincial fixed effect Y Y Y Y YYearly fixed effect Y Y Y Y YNumber of obs. 3868 3868 3868 3868 3868R2 0.131 0.101 0.045 0.572 0.552
Notes: Foreign ownership is the reference group. The data is from the survey conducted by China Center for Economic Research in 2006, as well as the industrial firmcensus data compiled annually by the National Bureau of Statistics. The definitions of all variables are in Table 1. *** p b 0.01, ** p b 0.05, * p b 0.1. Standard errors are inparentheses.
48 W. He et al. / China Economic Review 32 (2015) 43–56
system (Bansal &Hunter, 2003), aswell asmanufacturing process reengineering that aims to control firm's environmental externality(Hart & Ahuja, 1996).
Taken together, the regression results show that ISO14001 adoption has positive impacts on sales and costswith similarmagnitudes;therefore, benefits of sales growthmay be largely offset by the simultaneous increase of costs. Such a finding helps to explain the insig-nificant net effect of ISO 14001 adoption on financial performance (i.e., ROA, ROE, and ROS) of firms.
3.3. ISO 14001 adoption in industries with different pollution intensities
Elsayed and Paton (2005) indicated that although the overall effect of ISO 14001 adoption may be small or even negligible, the im-pacts of ISO 14001 adoption can be different across industries. Hart and Ahuja (1996) also argued that heavy polluters may be moreprone to adopting better environmental management system because such a system makes it easier to achieve pollution reductionin heavy pollution industries. Therefore, subsample tests are important to investigate heterogeneous impacts of ISO 14001 adoptionacross industries.
We divide sampled firms into three sub-groups according to the percentiles of waste-gas emission intensity of their industries4:‘heavy-pollution,’ or the top one-third industries that had the most intensive waste-gas emissions, ‘mid-pollution,’ or the mid one-third industries that had medium-intensive waste-gas emissions, and ‘light-pollution,’ or the bottom one-third industries that hadlow-intensive waste-gas emissions.
The results are reported in Columns 2–4 of Table 4. The impacts of ISO 14001 adoption on financial performance, i.e., ROA, ROE, andROS, are statistically insignificant in most sub-categories, except for the regression on ROS in light-pollution industries. For sales andcosts, the coefficients of ISO 14001 adoption are positive and statistically significant in heavy-pollution industries, but are statisticallyinsignificant for mid- and light-pollution industries. The sub-category analyses confirm that ISO 14001 adoption has distinct impactsamong industries with various pollution levels.
3.4. IV Estimations
Weutilize the instrumental variable technique to dealwith the endogenous issue in regressions. Column1 of Table 5 demonstratesthe first-stage results. The coefficient of the instrumental variable is positive and statistically significant, indicating that a focal firm ismore inclined to adopt ISO 14001 when more of its rival firms in its affiliated region and industry do so. To rule out the concern of
4 The information of waste-gas emission intensity was from the report of industry-level pollution that was compiled by the National Bureau of Statistics.
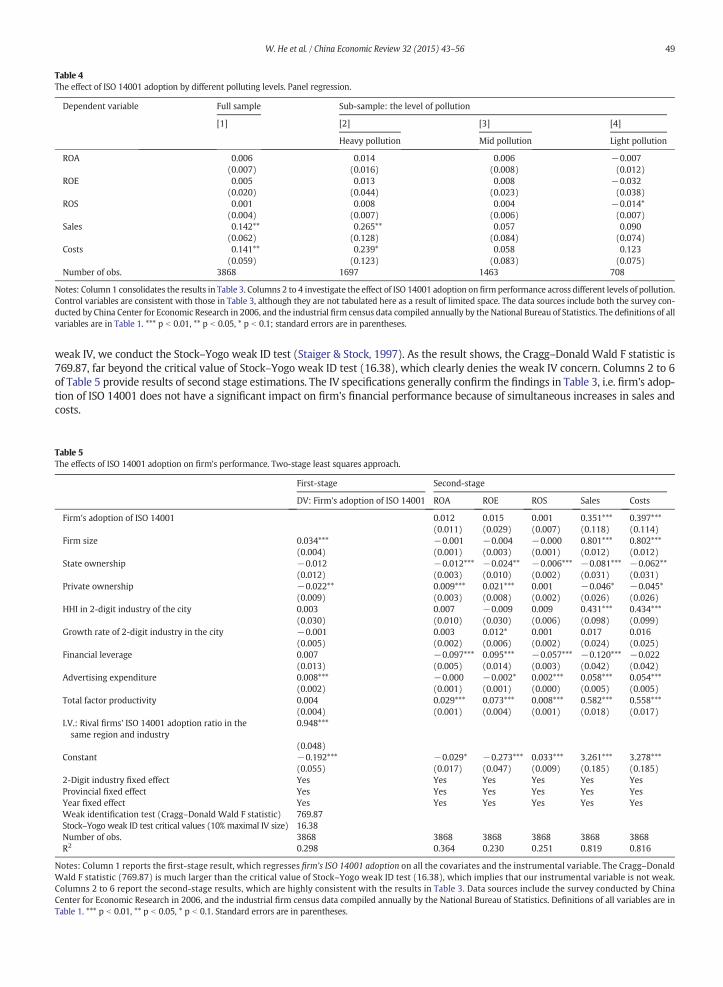
Table 4The effect of ISO 14001 adoption by different polluting levels. Panel regression.
Dependent variable Full sample Sub-sample: the level of pollution
[1] [2] [3] [4]
Heavy pollution Mid pollution Light pollution
ROA 0.006 0.014 0.006 −0.007(0.007) (0.016) (0.008) (0.012)
ROE 0.005 0.013 0.008 −0.032(0.020) (0.044) (0.023) (0.038)
ROS 0.001 0.008 0.004 −0.014*(0.004) (0.007) (0.006) (0.007)
Sales 0.142** 0.265** 0.057 0.090(0.062) (0.128) (0.084) (0.074)
Costs 0.141** 0.239* 0.058 0.123(0.059) (0.123) (0.083) (0.075)
Number of obs. 3868 1697 1463 708
Notes: Column 1 consolidates the results in Table 3. Columns 2 to 4 investigate the effect of ISO 14001 adoption on firm performance across different levels of pollution.Control variables are consistent with those in Table 3, although they are not tabulated here as a result of limited space. The data sources include both the survey con-ducted by China Center for Economic Research in 2006, and the industrial firm census data compiled annually by the National Bureau of Statistics. The definitions of allvariables are in Table 1. *** p b 0.01, ** p b 0.05, * p b 0.1; standard errors are in parentheses.
49W. He et al. / China Economic Review 32 (2015) 43–56
weak IV, we conduct the Stock–Yogo weak ID test (Staiger & Stock, 1997). As the result shows, the Cragg–Donald Wald F statistic is769.87, far beyond the critical value of Stock–Yogo weak ID test (16.38), which clearly denies the weak IV concern. Columns 2 to 6of Table 5 provide results of second stage estimations. The IV specifications generally confirm the findings in Table 3, i.e. firm's adop-tion of ISO 14001 does not have a significant impact on firm's financial performance because of simultaneous increases in sales andcosts.
Table 5The effects of ISO 14001 adoption on firm's performance. Two-stage least squares approach.
First-stage Second-stage
DV: Firm's adoption of ISO 14001 ROA ROE ROS Sales Costs
Firm's adoption of ISO 14001 0.012 0.015 0.001 0.351*** 0.397***(0.011) (0.029) (0.007) (0.118) (0.114)
Firm size 0.034*** −0.001 −0.004 −0.000 0.801*** 0.802***(0.004) (0.001) (0.003) (0.001) (0.012) (0.012)
State ownership −0.012 −0.012*** −0.024** −0.006*** −0.081*** −0.062**(0.012) (0.003) (0.010) (0.002) (0.031) (0.031)
Private ownership −0.022** 0.009*** 0.021*** 0.001 −0.046* −0.045*(0.009) (0.003) (0.008) (0.002) (0.026) (0.026)
HHI in 2-digit industry of the city 0.003 0.007 −0.009 0.009 0.431*** 0.434***(0.030) (0.010) (0.030) (0.006) (0.098) (0.099)
Growth rate of 2-digit industry in the city −0.001 0.003 0.012* 0.001 0.017 0.016(0.005) (0.002) (0.006) (0.002) (0.024) (0.025)
Financial leverage 0.007 −0.097*** 0.095*** −0.057*** −0.120*** −0.022(0.013) (0.005) (0.014) (0.003) (0.042) (0.042)
Advertising expenditure 0.008*** −0.000 −0.002* 0.002*** 0.058*** 0.054***(0.002) (0.001) (0.001) (0.000) (0.005) (0.005)
Total factor productivity 0.004 0.029*** 0.073*** 0.008*** 0.582*** 0.558***(0.004) (0.001) (0.004) (0.001) (0.018) (0.017)
I.V.: Rival firms' ISO 14001 adoption ratio in thesame region and industry
0.948***
(0.048)Constant −0.192*** −0.029* −0.273*** 0.033*** 3.261*** 3.278***
(0.055) (0.017) (0.047) (0.009) (0.185) (0.185)2-Digit industry fixed effect Yes Yes Yes Yes Yes YesProvincial fixed effect Yes Yes Yes Yes Yes YesYear fixed effect Yes Yes Yes Yes Yes YesWeak identification test (Cragg–Donald Wald F statistic) 769.87Stock–Yogo weak ID test critical values (10% maximal IV size) 16.38Number of obs. 3868 3868 3868 3868 3868 3868R2 0.298 0.364 0.230 0.251 0.819 0.816
Notes: Column 1 reports the first-stage result, which regresses firm's ISO 14001 adoption on all the covariates and the instrumental variable. The Cragg–DonaldWald F statistic (769.87) is much larger than the critical value of Stock–Yogo weak ID test (16.38), which implies that our instrumental variable is not weak.Columns 2 to 6 report the second-stage results, which are highly consistent with the results in Table 3. Data sources include the survey conducted by ChinaCenter for Economic Research in 2006, and the industrial firm census data compiled annually by the National Bureau of Statistics. Definitions of all variables are inTable 1. *** p b 0.01, ** p b 0.05, * p b 0.1. Standard errors are in parentheses.
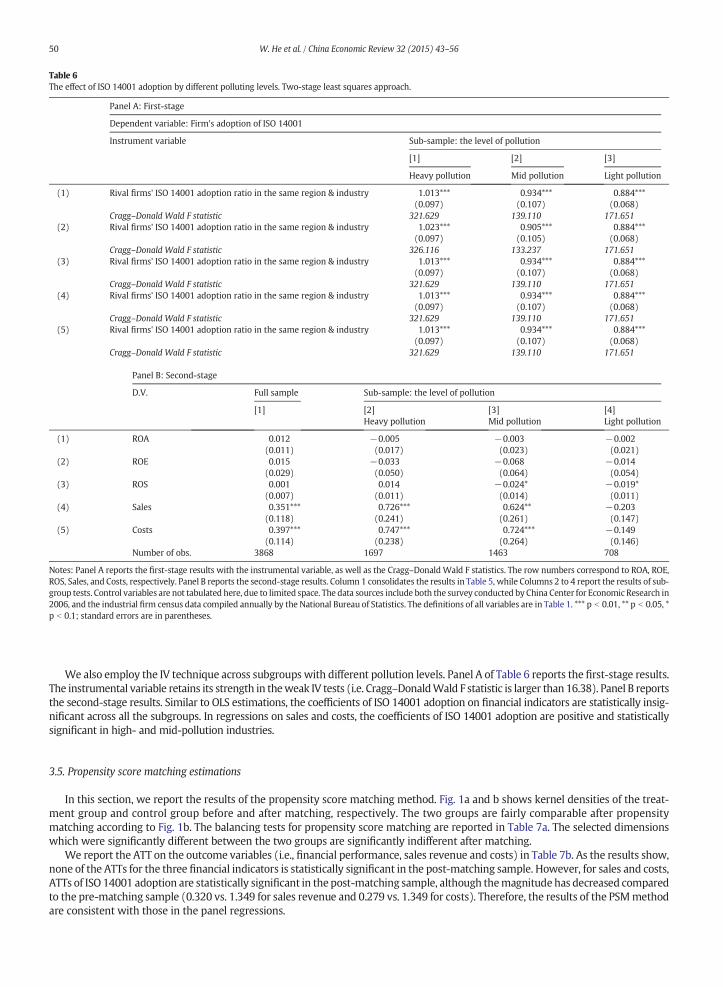
Table 6The effect of ISO 14001 adoption by different polluting levels. Two-stage least squares approach.
Panel A: First-stage
Dependent variable: Firm's adoption of ISO 14001
Instrument variable Sub-sample: the level of pollution
[1] [2] [3]
Heavy pollution Mid pollution Light pollution
(1) Rival firms' ISO 14001 adoption ratio in the same region & industry 1.013*** 0.934*** 0.884***(0.097) (0.107) (0.068)
Cragg–Donald Wald F statistic 321.629 139.110 171.651(2) Rival firms' ISO 14001 adoption ratio in the same region & industry 1.023*** 0.905*** 0.884***
(0.097) (0.105) (0.068)Cragg–Donald Wald F statistic 326.116 133.237 171.651
(3) Rival firms' ISO 14001 adoption ratio in the same region & industry 1.013*** 0.934*** 0.884***(0.097) (0.107) (0.068)
Cragg–Donald Wald F statistic 321.629 139.110 171.651(4) Rival firms' ISO 14001 adoption ratio in the same region & industry 1.013*** 0.934*** 0.884***
(0.097) (0.107) (0.068)Cragg–Donald Wald F statistic 321.629 139.110 171.651
(5) Rival firms' ISO 14001 adoption ratio in the same region & industry 1.013*** 0.934*** 0.884***(0.097) (0.107) (0.068)
Cragg–Donald Wald F statistic 321.629 139.110 171.651
Panel B: Second-stage
D.V. Full sample Sub-sample: the level of pollution
[1] [2] [3] [4]Heavy pollution Mid pollution Light pollution
(1) ROA 0.012 −0.005 −0.003 −0.002(0.011) (0.017) (0.023) (0.021)
(2) ROE 0.015 −0.033 −0.068 −0.014(0.029) (0.050) (0.064) (0.054)
(3) ROS 0.001 0.014 −0.024* −0.019*(0.007) (0.011) (0.014) (0.011)
(4) Sales 0.351*** 0.726*** 0.624** −0.203(0.118) (0.241) (0.261) (0.147)
(5) Costs 0.397*** 0.747*** 0.724*** −0.149(0.114) (0.238) (0.264) (0.146)
Number of obs. 3868 1697 1463 708
Notes: Panel A reports the first-stage results with the instrumental variable, as well as the Cragg–DonaldWald F statistics. The row numbers correspond to ROA, ROE,ROS, Sales, and Costs, respectively. Panel B reports the second-stage results. Column 1 consolidates the results in Table 5, while Columns 2 to 4 report the results of sub-group tests. Control variables are not tabulated here, due to limited space. The data sources include both the survey conducted by China Center for Economic Research in2006, and the industrial firm census data compiled annually by the National Bureau of Statistics. The definitions of all variables are in Table 1. *** p b 0.01, ** p b 0.05, *p b 0.1; standard errors are in parentheses.
50 W. He et al. / China Economic Review 32 (2015) 43–56
We also employ the IV technique across subgroups with different pollution levels. Panel A of Table 6 reports the first-stage results.The instrumental variable retains its strength in theweak IV tests (i.e. Cragg–DonaldWald F statistic is larger than 16.38). Panel B reportsthe second-stage results. Similar to OLS estimations, the coefficients of ISO 14001 adoption on financial indicators are statistically insig-nificant across all the subgroups. In regressions on sales and costs, the coefficients of ISO 14001 adoption are positive and statisticallysignificant in high- and mid-pollution industries.
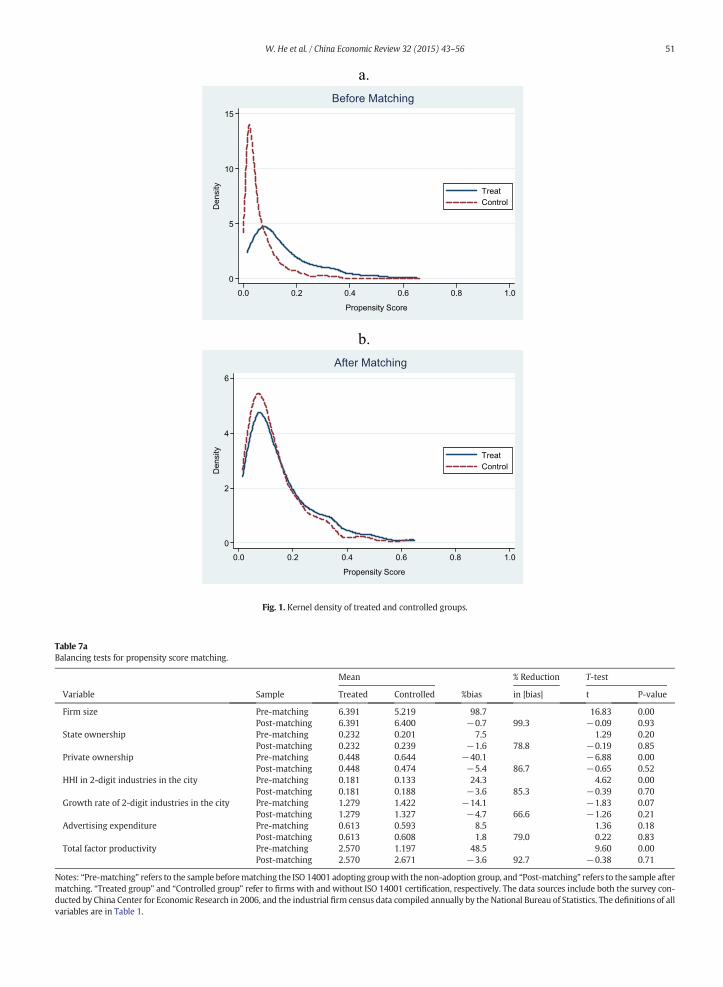
3.5. Propensity score matching estimations
In this section, we report the results of the propensity score matching method. Fig. 1a and b shows kernel densities of the treat-ment group and control group before and after matching, respectively. The two groups are fairly comparable after propensitymatching according to Fig. 1b. The balancing tests for propensity score matching are reported in Table 7a. The selected dimensionswhich were significantly different between the two groups are significantly indifferent after matching.
We report the ATT on the outcome variables (i.e., financial performance, sales revenue and costs) in Table 7b. As the results show,none of the ATTs for the three financial indicators is statistically significant in the post-matching sample. However, for sales and costs,ATTs of ISO 14001 adoption are statistically significant in the post-matching sample, although themagnitude has decreased comparedto the pre-matching sample (0.320 vs. 1.349 for sales revenue and 0.279 vs. 1.349 for costs). Therefore, the results of the PSMmethodare consistent with those in the panel regressions.
a.
b.
0
5
10
15
Den
sity
0.0 0.2 0.4 0.6 0.8 1.0
Propensity Score
TreatControl
Before Matching
0
2
4
6
Den
sity
0.0 0.2 0.4 0.6 0.8 1.0
Propensity Score
TreatControl
After Matching
Fig. 1. Kernel density of treated and controlled groups.
Table 7aBalancing tests for propensity score matching.
Mean % Reduction T-test
Variable Sample Treated Controlled %bias in |bias| t P-value
Firm size Pre-matching 6.391 5.219 98.7 16.83 0.00Post-matching 6.391 6.400 −0.7 99.3 −0.09 0.93
State ownership Pre-matching 0.232 0.201 7.5 1.29 0.20Post-matching 0.232 0.239 −1.6 78.8 −0.19 0.85
Private ownership Pre-matching 0.448 0.644 −40.1 −6.88 0.00Post-matching 0.448 0.474 −5.4 86.7 −0.65 0.52
HHI in 2-digit industries in the city Pre-matching 0.181 0.133 24.3 4.62 0.00Post-matching 0.181 0.188 −3.6 85.3 −0.39 0.70
Growth rate of 2-digit industries in the city Pre-matching 1.279 1.422 −14.1 −1.83 0.07Post-matching 1.279 1.327 −4.7 66.6 −1.26 0.21
Advertising expenditure Pre-matching 0.613 0.593 8.5 1.36 0.18Post-matching 0.613 0.608 1.8 79.0 0.22 0.83
Total factor productivity Pre-matching 2.570 1.197 48.5 9.60 0.00Post-matching 2.570 2.671 −3.6 92.7 −0.38 0.71
Notes: “Pre-matching” refers to the sample beforematching the ISO 14001 adopting groupwith the non-adoption group, and “Post-matching” refers to the sample aftermatching. “Treated group” and “Controlled group” refer to firms with and without ISO 14001 certification, respectively. The data sources include both the survey con-ducted by China Center for Economic Research in 2006, and the industrial firm census data compiled annually by the National Bureau of Statistics. The definitions of allvariables are in Table 1.
51W. He et al. / China Economic Review 32 (2015) 43–56
Table 7bImpact of ISO 14001 adoption on firm's performance. Propensity score matching.
Variable Sample Treated group Controlled group ATT s.e. t-value
ROA Pre-matching 0.066 0.065 0.000 0.005 0.080Post-matching 0.066 0.059 0.007 0.008 0.970
ROE Pre-matching 0.175 0.177 −0.002 0.013 −0.160Post-matching 0.175 0.155 0.020 0.022 1.090
ROS Pre-matching 0.041 0.036 0.005 0.003 1.82*Post-matching 0.041 0.039 0.003 0.005 0.640
Sales Pre-matching 12.236 10.886 1.349 0.084 15.98***Post-matching 12.236 11.916 0.320 0.102 2.41**
Costs Pre-matching 12.188 10.838 1.349 0.084 15.97***Post-matching 12.188 11.909 0.279 0.108 2.12**
Notes: The data source here is the industrial firm census data compiled annually by the National Bureau of Statistics. The definitions of the variables are in Table 1. ***p b 0.01, ** p b 0.05, * p b 0.1. Standard errors are calculated using the bootstrap method with 300 replications.
52 W. He et al. / China Economic Review 32 (2015) 43–56
We also utilize the PSMmethod to examine the impacts of ISO 14001 adoption across industries with different pollution levels. Theresults reported in Table 8 show that ISO 14001 adoption has positive and statistically significant impacts on firm financial performance(i.e., ROA, ROE, and ROS) as well as sales and costs in heavy-pollution industries. It is noteworthy that the economic magnitude of ISO14001 adoption on sales is larger than that on costs (0.326 vs. 0.239); the net effect of ISO 14001 adoption on financial performanceof firms in heavy-pollution industries is positive and significant. Nevertheless, the coefficients of ISO 14001 are statistically insignificantfor firms in mid- and light-pollution industries. Such results are consistent with those of the panel regressions.
3.6. Sensitivity analysis: Rosenbaum bounds
Although matching has become a popular method to estimate average treatment effects, the method is based on the conditionalindependence assumption, which states that researchers should observe all of the variables that simultaneously influence the partic-ipation decisions and outcome variables. In other words, if there are unobserved variables that simultaneously affect the ISO 14001adoption and firm performance, matching estimators can be biased. To address this concern, we conducted a sensitivity analysisusing the Rosenbaum bounds method (DiPrete & Gangl, 2004; Rosenbaum, 2002). The purpose of this procedure is to determine ifthe average treatment effect is affected by unobserved variables.
Assume that the treatment probability is as follows:
Table 8Impact
ROAROEROSSalesCosts
Notes: CpropensResearcp b 0.05
Pi ¼ P Di ¼ 1jXi;uið Þ ¼ F βXi þ γuið Þ
where Xi are the observed covariates, ui is an unobserved covariate, γ is the effect of ui on the treatment selection and F is the logisticdistribution. We define the ratio of the odds that a treated case i has the unobserved characteristic as the odds that the control case jhas the characteristic:
Pi= 1−Pið ÞPj= 1−Pj
� � ¼ exp βXi þ γuið Þexp βXj þ γuj
� �
As implied by the matching procedure, i and j have the same covariates, which implies the following:
Pi= 1−Pið ÞPj= 1−Pj
� � ¼ exp γ ui−uj
� �h i
of ISO 14001 adoption by different polluting levels. Propensity score matching.
A, Full sample B, Heavy pollution C, Mid pollution D, Light pollution
ATT t-value ATT t-value ATT t-value ATT t-value
0.007 0.970 0.041 2.89*** 0.004 0.400 0.006 0.4600.020 1.090 0.057 1.76* 0.002 0.080 0.000 0.0100.003 0.640 0.024 3.56*** −0.002 −0.310 −0.010 −1.1000.320 2.41** 0.326 2.07** 0.185 0.720 0.108 0.4900.279 2.12** 0.239 1.74* 0.190 0.750 0.108 0.500
olumns 1 and 2 consolidate the results in Table 5B. Columns 3 to 8 examine the effect of ISO 14001 adoption at different levels of pollution by using theity score matching method. The results are consistent with those in Table 4. The data sources include both the survey conducted by China Center for Economich in 2006, and the industrial firm census data compiled annually by theNational Bureau of Statistics. The definitions of all variables are in Table 1. *** p b 0.01, **, * p b 0.1.
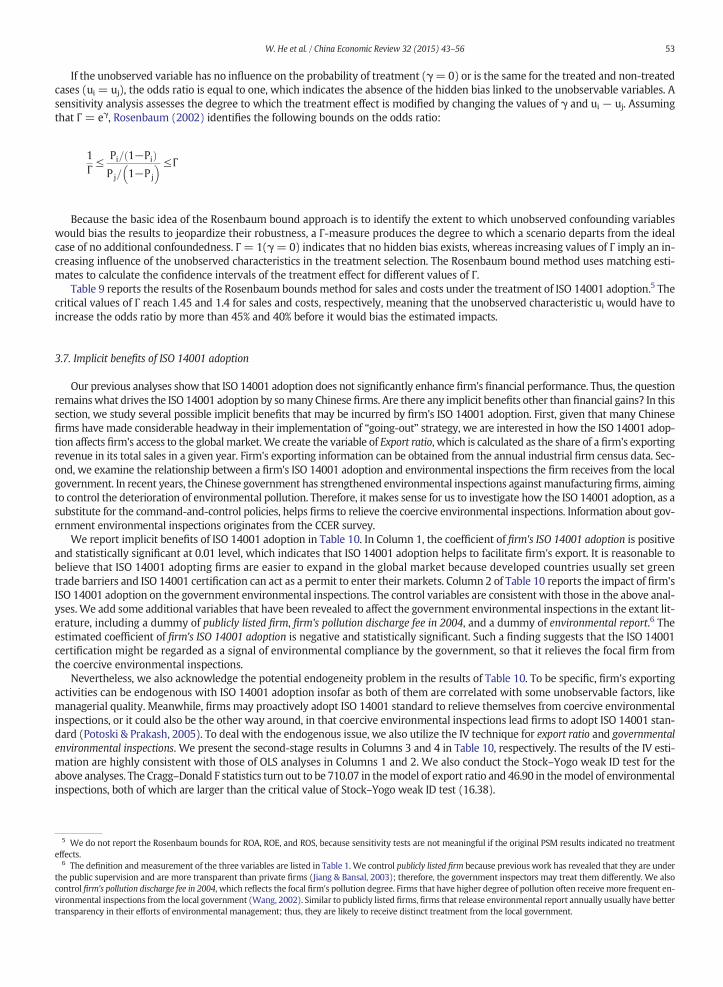
53W. He et al. / China Economic Review 32 (2015) 43–56
If the unobserved variable has no influence on the probability of treatment (γ=0) or is the same for the treated and non-treatedcases (ui = uj), the odds ratio is equal to one, which indicates the absence of the hidden bias linked to the unobservable variables. Asensitivity analysis assesses the degree to which the treatment effect is modified by changing the values of γ and ui − uj. Assumingthat Г = eγ, Rosenbaum (2002) identifies the following bounds on the odds ratio:
5 Weeffects.
6 Thethe pubcontrolvironmetranspa
1Г≤ Pi= 1−Pið Þ
Pj= 1−Pj
� � ≤Г
Because the basic idea of the Rosenbaum bound approach is to identify the extent to which unobserved confounding variableswould bias the results to jeopardize their robustness, a Γ-measure produces the degree to which a scenario departs from the idealcase of no additional confoundedness. Γ= 1(γ= 0) indicates that no hidden bias exists, whereas increasing values of Γ imply an in-creasing influence of the unobserved characteristics in the treatment selection. The Rosenbaum bound method uses matching esti-mates to calculate the confidence intervals of the treatment effect for different values of Γ.
Table 9 reports the results of the Rosenbaum bounds method for sales and costs under the treatment of ISO 14001 adoption.5 Thecritical values of Γ reach 1.45 and 1.4 for sales and costs, respectively, meaning that the unobserved characteristic ui would have toincrease the odds ratio by more than 45% and 40% before it would bias the estimated impacts.
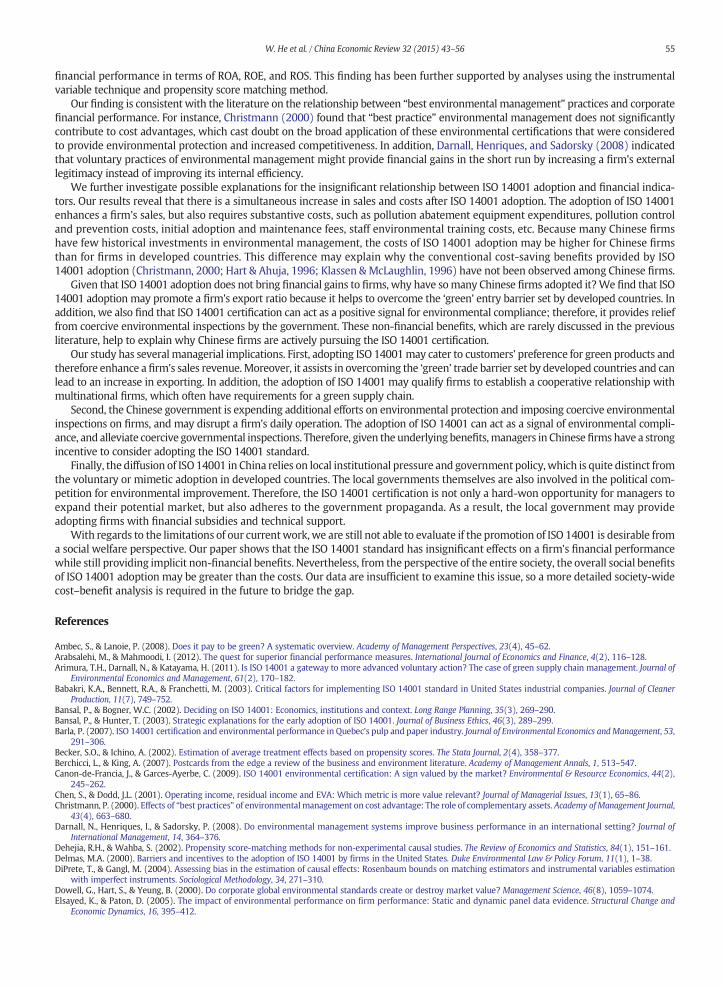
3.7. Implicit benefits of ISO 14001 adoption
Our previous analyses show that ISO 14001 adoption does not significantly enhance firm's financial performance. Thus, the questionremainswhat drives the ISO 14001 adoption by somany Chinese firms. Are there any implicit benefits other than financial gains? In thissection, we study several possible implicit benefits that may be incurred by firm's ISO 14001 adoption. First, given that many Chinesefirms have made considerable headway in their implementation of “going-out” strategy, we are interested in how the ISO 14001 adop-tion affects firm's access to the global market.We create the variable of Export ratio, which is calculated as the share of a firm's exportingrevenue in its total sales in a given year. Firm's exporting information can be obtained from the annual industrial firm census data. Sec-ond, we examine the relationship between a firm's ISO 14001 adoption and environmental inspections the firm receives from the localgovernment. In recent years, the Chinese government has strengthened environmental inspections againstmanufacturing firms, aimingto control the deterioration of environmental pollution. Therefore, it makes sense for us to investigate how the ISO 14001 adoption, as asubstitute for the command-and-control policies, helps firms to relieve the coercive environmental inspections. Information about gov-ernment environmental inspections originates from the CCER survey.
We report implicit benefits of ISO 14001 adoption in Table 10. In Column 1, the coefficient of firm's ISO 14001 adoption is positiveand statistically significant at 0.01 level, which indicates that ISO 14001 adoption helps to facilitate firm's export. It is reasonable tobelieve that ISO 14001 adopting firms are easier to expand in the global market because developed countries usually set greentrade barriers and ISO 14001 certification can act as a permit to enter their markets. Column 2 of Table 10 reports the impact of firm'sISO 14001 adoption on the government environmental inspections. The control variables are consistent with those in the above anal-yses.We add some additional variables that have been revealed to affect the government environmental inspections in the extant lit-erature, including a dummy of publicly listed firm, firm's pollution discharge fee in 2004, and a dummy of environmental report.6 Theestimated coefficient of firm's ISO 14001 adoption is negative and statistically significant. Such a finding suggests that the ISO 14001certification might be regarded as a signal of environmental compliance by the government, so that it relieves the focal firm fromthe coercive environmental inspections.
Nevertheless, we also acknowledge the potential endogeneity problem in the results of Table 10. To be specific, firm's exportingactivities can be endogenous with ISO 14001 adoption insofar as both of them are correlated with some unobservable factors, likemanagerial quality. Meanwhile, firms may proactively adopt ISO 14001 standard to relieve themselves from coercive environmentalinspections, or it could also be the other way around, in that coercive environmental inspections lead firms to adopt ISO 14001 stan-dard (Potoski & Prakash, 2005). To deal with the endogenous issue, we also utilize the IV technique for export ratio and governmentalenvironmental inspections. We present the second-stage results in Columns 3 and 4 in Table 10, respectively. The results of the IV esti-mation are highly consistent with those of OLS analyses in Columns 1 and 2. We also conduct the Stock–Yogo weak ID test for theabove analyses. The Cragg–Donald F statistics turn out to be 710.07 in themodel of export ratio and 46.90 in themodel of environmentalinspections, both of which are larger than the critical value of Stock–Yogo weak ID test (16.38).
do not report the Rosenbaum bounds for ROA, ROE, and ROS, because sensitivity tests are not meaningful if the original PSM results indicated no treatment
definition and measurement of the three variables are listed in Table 1. We control publicly listed firm because previous work has revealed that they are underlic supervision and are more transparent than private firms (Jiang & Bansal, 2003); therefore, the government inspectors may treat them differently. We alsofirm's pollution discharge fee in 2004, which reflects the focal firm's pollution degree. Firms that have higher degree of pollution often receive more frequent en-ntal inspections from the local government (Wang, 2002). Similar to publicly listed firms, firms that release environmental report annually usually have betterrency in their efforts of environmental management; thus, they are likely to receive distinct treatment from the local government.
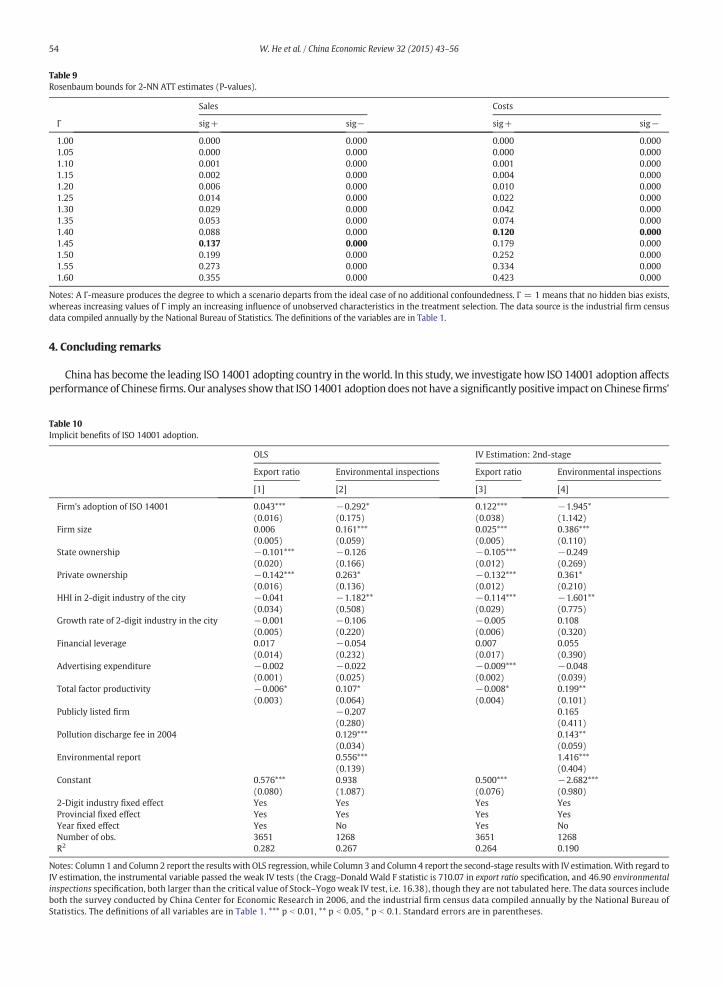
Table 9Rosenbaum bounds for 2-NN ATT estimates (P-values).
Sales Costs
Γ sig+ sig− sig+ sig−
1.00 0.000 0.000 0.000 0.0001.05 0.000 0.000 0.000 0.0001.10 0.001 0.000 0.001 0.0001.15 0.002 0.000 0.004 0.0001.20 0.006 0.000 0.010 0.0001.25 0.014 0.000 0.022 0.0001.30 0.029 0.000 0.042 0.0001.35 0.053 0.000 0.074 0.0001.40 0.088 0.000 0.120 0.0001.45 0.137 0.000 0.179 0.0001.50 0.199 0.000 0.252 0.0001.55 0.273 0.000 0.334 0.0001.60 0.355 0.000 0.423 0.000
Notes: A Γ-measure produces the degree to which a scenario departs from the ideal case of no additional confoundedness. Γ = 1 means that no hidden bias exists,whereas increasing values of Γ imply an increasing influence of unobserved characteristics in the treatment selection. The data source is the industrial firm censusdata compiled annually by the National Bureau of Statistics. The definitions of the variables are in Table 1.
54 W. He et al. / China Economic Review 32 (2015) 43–56
4. Concluding remarks
China has become the leading ISO 14001 adopting country in theworld. In this study, we investigate how ISO 14001 adoption affectsperformance of Chinesefirms. Our analyses show that ISO14001 adoption does not have a significantly positive impact onChinesefirms'
Table 10Implicit benefits of ISO 14001 adoption.
OLS IV Estimation: 2nd-stage
Export ratio Environmental inspections Export ratio Environmental inspections
[1] [2] [3] [4]
Firm's adoption of ISO 14001 0.043*** −0.292* 0.122*** −1.945*(0.016) (0.175) (0.038) (1.142)
Firm size 0.006 0.161*** 0.025*** 0.386***(0.005) (0.059) (0.005) (0.110)
State ownership −0.101*** −0.126 −0.105*** −0.249(0.020) (0.166) (0.012) (0.269)
Private ownership −0.142*** 0.263* −0.132*** 0.361*(0.016) (0.136) (0.012) (0.210)
HHI in 2-digit industry of the city −0.041 −1.182** −0.114*** −1.601**(0.034) (0.508) (0.029) (0.775)
Growth rate of 2-digit industry in the city −0.001 −0.106 −0.005 0.108(0.005) (0.220) (0.006) (0.320)
Financial leverage 0.017 −0.054 0.007 0.055(0.014) (0.232) (0.017) (0.390)
Advertising expenditure −0.002 −0.022 −0.009*** −0.048(0.001) (0.025) (0.002) (0.039)
Total factor productivity −0.006* 0.107* −0.008* 0.199**(0.003) (0.064) (0.004) (0.101)
Publicly listed firm −0.207 0.165(0.280) (0.411)
Pollution discharge fee in 2004 0.129*** 0.143**(0.034) (0.059)
Environmental report 0.556*** 1.416***(0.139) (0.404)
Constant 0.576*** 0.938 0.500*** −2.682***(0.080) (1.087) (0.076) (0.980)
2-Digit industry fixed effect Yes Yes Yes YesProvincial fixed effect Yes Yes Yes YesYear fixed effect Yes No Yes NoNumber of obs. 3651 1268 3651 1268R2 0.282 0.267 0.264 0.190
Notes: Column 1 and Column 2 report the results with OLS regression, while Column 3 and Column 4 report the second-stage results with IV estimation.With regard toIV estimation, the instrumental variable passed the weak IV tests (the Cragg–Donald Wald F statistic is 710.07 in export ratio specification, and 46.90 environmentalinspections specification, both larger than the critical value of Stock–Yogo weak IV test, i.e. 16.38), though they are not tabulated here. The data sources includeboth the survey conducted by China Center for Economic Research in 2006, and the industrial firm census data compiled annually by the National Bureau ofStatistics. The definitions of all variables are in Table 1. *** p b 0.01, ** p b 0.05, * p b 0.1. Standard errors are in parentheses.
55W. He et al. / China Economic Review 32 (2015) 43–56
financial performance in terms of ROA, ROE, and ROS. This finding has been further supported by analyses using the instrumentalvariable technique and propensity score matching method.
Our finding is consistent with the literature on the relationship between “best environmental management” practices and corporatefinancial performance. For instance, Christmann (2000) found that “best practice” environmental management does not significantlycontribute to cost advantages, which cast doubt on the broad application of these environmental certifications that were consideredto provide environmental protection and increased competitiveness. In addition, Darnall, Henriques, and Sadorsky (2008) indicatedthat voluntary practices of environmental management might provide financial gains in the short run by increasing a firm's externallegitimacy instead of improving its internal efficiency.
We further investigate possible explanations for the insignificant relationship between ISO 14001 adoption and financial indica-tors. Our results reveal that there is a simultaneous increase in sales and costs after ISO 14001 adoption. The adoption of ISO 14001enhances a firm's sales, but also requires substantive costs, such as pollution abatement equipment expenditures, pollution controland prevention costs, initial adoption and maintenance fees, staff environmental training costs, etc. Because many Chinese firmshave few historical investments in environmental management, the costs of ISO 14001 adoption may be higher for Chinese firmsthan for firms in developed countries. This difference may explain why the conventional cost-saving benefits provided by ISO14001 adoption (Christmann, 2000; Hart & Ahuja, 1996; Klassen &McLaughlin, 1996) have not been observed among Chinese firms.
Given that ISO 14001 adoption does not bring financial gains to firms, why have somany Chinese firms adopted it?We find that ISO14001 adoption may promote a firm's export ratio because it helps to overcome the ‘green’ entry barrier set by developed countries. Inaddition, we also find that ISO 14001 certification can act as a positive signal for environmental compliance; therefore, it provides relieffrom coercive environmental inspections by the government. These non-financial benefits, which are rarely discussed in the previousliterature, help to explain why Chinese firms are actively pursuing the ISO 14001 certification.
Our study has several managerial implications. First, adopting ISO 14001may cater to customers' preference for green products andtherefore enhance a firm's sales revenue.Moreover, it assists in overcoming the ‘green’ trade barrier set by developed countries and canlead to an increase in exporting. In addition, the adoption of ISO 14001 may qualify firms to establish a cooperative relationship withmultinational firms, which often have requirements for a green supply chain.
Second, the Chinese government is expending additional efforts on environmental protection and imposing coercive environmentalinspections on firms, and may disrupt a firm's daily operation. The adoption of ISO 14001 can act as a signal of environmental compli-ance, and alleviate coercive governmental inspections. Therefore, given the underlying benefits,managers in Chinesefirms have a strongincentive to consider adopting the ISO 14001 standard.
Finally, the diffusion of ISO 14001 in China relies on local institutional pressure and government policy, which is quite distinct fromthe voluntary or mimetic adoption in developed countries. The local governments themselves are also involved in the political com-petition for environmental improvement. Therefore, the ISO 14001 certification is not only a hard-won opportunity for managers toexpand their potential market, but also adheres to the government propaganda. As a result, the local government may provideadopting firms with financial subsidies and technical support.
With regards to the limitations of our currentwork,we are still not able to evaluate if the promotion of ISO 14001 is desirable froma social welfare perspective. Our paper shows that the ISO 14001 standard has insignificant effects on a firm's financial performancewhile still providing implicit non-financial benefits. Nevertheless, from the perspective of the entire society, the overall social benefitsof ISO 14001 adoption may be greater than the costs. Our data are insufficient to examine this issue, so a more detailed society-widecost–benefit analysis is required in the future to bridge the gap.
References
Ambec, S., & Lanoie, P. (2008). Does it pay to be green? A systematic overview. Academy of Management Perspectives, 23(4), 45–62.Arabsalehi, M., & Mahmoodi, I. (2012). The quest for superior financial performance measures. International Journal of Economics and Finance, 4(2), 116–128.Arimura, T.H., Darnall, N., & Katayama, H. (2011). Is ISO 14001 a gateway to more advanced voluntary action? The case of green supply chain management. Journal of
Environmental Economics and Management, 61(2), 170–182.Babakri, K.A., Bennett, R.A., & Franchetti, M. (2003). Critical factors for implementing ISO 14001 standard in United States industrial companies. Journal of Cleaner
Production, 11(7), 749–752.Bansal, P., & Bogner, W.C. (2002). Deciding on ISO 14001: Economics, institutions and context. Long Range Planning, 35(3), 269–290.Bansal, P., & Hunter, T. (2003). Strategic explanations for the early adoption of ISO 14001. Journal of Business Ethics, 46(3), 289–299.Barla, P. (2007). ISO 14001 certification and environmental performance in Quebec's pulp and paper industry. Journal of Environmental Economics andManagement, 53,
291–306.Becker, S.O., & Ichino, A. (2002). Estimation of average treatment effects based on propensity scores. The Stata Journal, 2(4), 358–377.Berchicci, L., & King, A. (2007). Postcards from the edge a review of the business and environment literature. Academy of Management Annals, 1, 513–547.Canon-de-Francia, J., & Garces-Ayerbe, C. (2009). ISO 14001 environmental certification: A sign valued by the market? Environmental & Resource Economics, 44(2),
245–262.Chen, S., & Dodd, J.L. (2001). Operating income, residual income and EVA: Which metric is more value relevant? Journal of Managerial Issues, 13(1), 65–86.Christmann, P. (2000). Effects of “best practices” of environmentalmanagement on cost advantage: The role of complementary assets. Academy ofManagement Journal,
43(4), 663–680.Darnall, N., Henriques, I., & Sadorsky, P. (2008). Do environmental management systems improve business performance in an international setting? Journal of
International Management, 14, 364–376.Dehejia, R.H., & Wahba, S. (2002). Propensity score-matching methods for non-experimental causal studies. The Review of Economics and Statistics, 84(1), 151–161.Delmas, M.A. (2000). Barriers and incentives to the adoption of ISO 14001 by firms in the United States. Duke Environmental Law & Policy Forum, 11(1), 1–38.DiPrete, T., & Gangl, M. (2004). Assessing bias in the estimation of causal effects: Rosenbaum bounds on matching estimators and instrumental variables estimation
with imperfect instruments. Sociological Methodology, 34, 271–310.Dowell, G., Hart, S., & Yeung, B. (2000). Do corporate global environmental standards create or destroy market value? Management Science, 46(8), 1059–1074.Elsayed, K., & Paton, D. (2005). The impact of environmental performance on firm performance: Static and dynamic panel data evidence. Structural Change and
Economic Dynamics, 16, 395–412.
56 W. He et al. / China Economic Review 32 (2015) 43–56
Galdeano-Gomez, E. (2008). Does an endogenous relationship exist between environmental and economic performance? A resource-based view on the horticulturalsector. Environmental & Resource Economics, 40(1), 73–89.
Gentry, R.J., & Shen,W. (2010). The relationship between accounting andmarketmeasures of firm financial performance: How strong is it? Journal of Managerial Issues,22(4), 514–530.
Gilley, K.M., Worrell, D.L., Davidson, W.N., & EI-Jelly, A. (2000). Corporate environmental initiatives and anticipated firm performance: The differential effects ofprocess-driven versus product-driven greening initiatives. Journal of Management, 26(6), 1199–1216.
Hart, S.L., & Ahuja, G. (1996). Does it pay to be green? An empirical examination of the relationship between emission reduction and firm performance. BusinessStrategy and the Environment, 5(1), 30–37.
Jacobs, B., Singhal, V., & Subramanian, R. (2010). An empirical investigation of environmental performance and the market value of the firm. Journal of OperationsManagement, 28, 430–441.
Jiang, R.J., & Bansal, P. (2003). Seeing the need for ISO 14001. Journal of Management Studies, 40(4), 1047–1067.Judge, W.Q., & Douglas, T.J. (1998). Performance implications of incorporating natural environmental issues into the strategic planning process: An empirical assessment.
Journal of Management Studies, 35(2), 241–262.King, A.A., & Lenox, M.J. (2001). Does it really pay to be green? An empirical study of firm environmental and financial performance. Journal of Industrial Ecology, 5(1),
105–116.Klassen, R.D., & McLaughlin, C.P. (1996). The impact of environmental management on firm performance. Management Science, 42(8), 1199–1214.Melitz, M.J. (2003). The impact of trade on intra-industry reallocations and aggregate industry productivity. Econometrica, 71(6), 1695–1725.Morrow, D., & Rondinelli, D. (2002). Adopting corporate environmental management systems: Motivations and results of ISO 14001 and EMAS certification. European
Management Journal, 20(2), 159–171.Nishitani, K. (2011). An empirical analysis of the effects on firms' economic performance of implementing environmental management systems. Environmental &
Resource Economics, 48(4), 569–586.Potoski, M., & Prakash, A. (2005). Green clubs and voluntary governance: ISO 14001 and firms' regulatory compliance. American Journal of Political Science, 49(2),
235–248.Rosenbaum, P.R. (2002). Observational studies. New York: Springer.Rosenbaum, P.R., & Rubin, D.B. (1983). The central role of the propensity score in observational studies for causal effects. Biometrika, 70(1), 41–55.Shamsie, J., Martin, X., & Miller, D. (2009). In with the old, in with the new: Capabilities, strategies, and performance among the Hollywood studios. Strategic Management
Journal, 30(13), 1440–1452.Staiger, D., & Stock, J.H. (1997). Instrumental variables regression with weak instruments. Econometrica, 65(3), 557–586.Wang, H. (2002). Pollution regulation and abatement efforts: Evidence from China. Ecological Economics, 41(1), 85–94.Yang, M.G.M., Hong, P., & Modi, S.B. (2011). Impact of lean manufacturing and environmental management on business performance: An empirical study of
manufacturing firms. International Journal of Production Economics, 129(2), 251–261.
Recommended