BASIN MANAGEMENT ACTION PLAN
for the Implementation of Total Maximum Daily Loads for Nutrients
Adopted by the Florida Department of Environmental Protection
in the
Indian River Lagoon Basin Banana River Lagoon
developed by the Banana River Lagoon Stakeholders
in cooperation with the
Florida Department of Environmental Protection Division of Environmental Assessment and Restoration
Bureau of Watershed Restoration Tallahassee, FL 32399
January 2013
FINAL Banana River Lagoon Basin Management Action Plan – January 2013
ii
ACKNOWLEDGMENTS: The Banana River Lagoon Basin Management Action Plan was prepared as part of a statewide watershed management approach to restore and protect Florida’s water quality. It was developed by the Banana River Lagoon stakeholders, identified below, with participation from affected local, regional, and state governmental interests; elected officials and citizens; and private interests. - = Empty cell
ALLOCATION ENTITIES AGENCIES OTHER INTERESTED PARTIES
Agricultural Producers Florida Department of Agriculture and Consumer Services 3E Consultants
Brevard County Florida Department of Environmental Protection Algae Collection Technology, Inc.
City of Cape Canaveral Indian River Lagoon National Estuary Program Applied Ecology
City of Cocoa Beach St. Johns River Water Management District Applied Technology and Management City of Indian Harbour Beach - Citizens
City of Satellite Beach - E Sciences, Inc. Cape Canaveral Air Force Station - Eco Sense International Florida Department of Transportation, District 5 - England Thims and Miller Kennedy Space Center - Jones Edmunds and Associates Patrick Air Force Base - Marine Resources Council - - Masteller and Moler, Inc, - - SAIC - - SpecPro, Inc. - - Stormwater Solutions, Inc. - - Wildwood Consulting, Inc.
FINAL Banana River Lagoon Basin Management Action Plan – January 2013
iii
For additional information on Total Maximum Daily Loads and the watershed management approach in the Banana River Lagoon, contact: Mary Paulic, Basin Coordinator Florida Department of Environmental Protection Bureau of Watershed Restoration, Watershed Planning and Coordination Section 2600 Blair Stone Road, Mail Station 3565 Tallahassee, FL 32399-2400 Email: [email protected] Phone: (850) 245–8560
FINAL Banana River Lagoon Basin Management Action Plan – January 2013
iv
TABLE OF CONTENTS LIST OF ACRONYMS ................................................................................................... VII EXECUTIVE SUMMARY ............................................................................................... IX CHAPTER 1 : CONTEXT, PURPOSE, AND SCOPE OF THE PLAN ............................ 1
1.1 Water Quality Standards and Total Maximum Daily Loads .......................... 1 1.2 TMDL Implementation ...................................................................................... 2 1.3 The Banana River Lagoon Basin Management Action Plan ......................... 3
1.3.1 Stakeholder Involvement ................................................................................... 3 1.3.2 Plan Purpose and Scope ................................................................................... 4 1.3.3 BMAP Approach ................................................................................................ 4 1.3.4 Pollutant Reduction and Discharge Allocations .................................................. 9 1.3.5 TMDLs in the Banana River Lagoon Subbasin .................................................. 9
1.4 Assumptions and Considerations Regarding TMDL Implementation ....... 10 1.4.1 Assumptions .....................................................................................................10 1.4.2 Considerations .................................................................................................11
1.5 Future Growth in the Basin ........................................................................... 13 1.6 Relation of the BMAP to Other Restoration Plans ...................................... 14 1.7 Economic Benefits of the Indian River Lagoon System ............................. 14
CHAPTER 2 : BANANA RIVER LAGOON BASIN SETTING ...................................... 16 2.1 Basin Hydrology ............................................................................................. 16 2.2 Land Use Coverage ........................................................................................ 16 2.3 Seagrass Depth Limit Changes .................................................................... 18
CHAPTER 3 : POLLUTANT SOURCES AND ANTICIPATED OUTCOMES ............... 21 3.1 Point Source Facilities ................................................................................... 21 3.2 Municipal Separate Storm Sewer Systems .................................................. 22
3.2.1 NPDES MS4 Phase II Stormwater Permit Requirements .................................22 3.3 Non-MS4 Stormwater Sources ...................................................................... 23 3.4 Agriculture ...................................................................................................... 24 3.5 Anticipated Outcomes of BMAP Implementation ........................................ 24
CHAPTER 4 : DETAILED ALLOCATIONS .................................................................. 25 4.1 Calculating Baseline Loads........................................................................... 25 4.2 De Minimus Determination ............................................................................ 26 4.3 Target Load per Acre ..................................................................................... 26 4.4 Allocations and Required Reductions ......................................................... 26 4.5 Allocations by Source ................................................................................... 28
4.5.1 NPDES Facilities ..............................................................................................28 4.5.2 MS4s ................................................................................................................28 4.5.3 Non-MS4s ........................................................................................................29 4.5.4 Agriculture ........................................................................................................29
FINAL Banana River Lagoon Basin Management Action Plan – January 2013
v
CHAPTER 5 : MANAGEMENT ACTIONS .................................................................... 30 5.1 MS4 Projects to Meet Allocations ................................................................. 30
5.1.1 MS4 Projects in the Banana River Lagoon A Project Zone ...............................31 5.1.2 MS4 Projects to Meet Allocations in the Banana River Lagoon B Project Zone 31
5.2 Non-MS4 Urban Stormwater Projects .......................................................... 31 5.3 Provisional BMPs ........................................................................................... 34
5.3.1 Floating Islands ................................................................................................34 5.3.2 Public Education and Outreach ........................................................................34 5.3.3 Muck Removal ..................................................................................................35 5.3.4 Aquatic Vegetation Harvesting .........................................................................35 5.3.5 Water Control Structures ..................................................................................35
CHAPTER 6 : ASSESSING PROGRESS AND MAKING CHANGES.......................... 36 6.1 Seagrass Target Evaluation .......................................................................... 36 6.2 Tracking Implementation ............................................................................... 36 6.3 Adaptive Management Measures .................................................................. 37 6.4 Seagrass and Water Quality Monitoring ...................................................... 37
6.4.1 Objectives ........................................................................................................37 6.4.2 Monitoring Parameters, Frequency, and Network .............................................38 6.4.3 Data Management and Assessment .................................................................39 6.4.4 Quality Assurance/Quality Control ....................................................................42
6.5 Research Priorities ........................................................................................ 42 CHAPTER 7 : COMMITMENT TO PLAN IMPLEMENTATION .................................... 43 APPENDICES ............................................................................................................... 51
Appendix A: TMDL Basin Rotation Schedule ....................................................... 52 Appendix B: Summary of Statutory Provisions Guiding BMAP
Development and Implementation ......................................................... 53 Appendix C: Summary of EPA-Recommended Elements of a
Comprehensive Watershed Plan ............................................................ 56 Appendix D: Process To Conduct the Seagrass Depth Limit Compliance
Evaluation................................................................................................. 59 Appendix E: Projects to Achieve the TMDL .......................................................... 61 Appendix F: Glossary of Terms ............................................................................. 73 Appendix G: Bibliography of Key References and Websites .............................. 77
FINAL Banana River Lagoon Basin Management Action Plan – January 2013
vi
LIST OF FIGURES FIGURE 1: BRL SUBBASIN WBIDS ............................................................................................... 6 FIGURE 2: ENTITIES IN THE BRL A PROJECT ZONE ....................................................................... 7 FIGURE 3: ENTITIES IN THE BRL B PROJECT ZONE ....................................................................... 8 FIGURE 4: 2000 LAND USES IN THE BRL SUBBASIN .....................................................................17 FIGURE 5: STEP 1 COMPLIANCE EVALUATION FOR BRL A FOR 2003–07 ......................................18 FIGURE 6: STEP 1 COMPLIANCE EVALUATION FOR BRL A FOR 2005–09 ......................................19 FIGURE 7: STEP 1 COMPLIANCE EVALUATION FOR BRL B FOR 2003–07 ......................................19 FIGURE 8: STEP 1 COMPLIANCE EVALUATION FOR BRL B FOR 2005–09 ......................................20 FIGURE 9: MONITORING NETWORK IN THE BRL A PROJECT ZONE ................................................40 FIGURE 10: MONITORING NETWORK IN THE BRL B PROJECT ZONE ..............................................41
LIST OF TABLES
TABLE ES-1: TMDLS IN THE BANANA RIVER LAGOON SUBBASIN ...................................................X TABLE 1: DESIGNATED USE ATTAINMENT CATEGORIES FOR FLORIDA SURFACE WATERS ............... 2 TABLE 2: PHASES OF THE WATERSHED MANAGEMENT CYCLE ....................................................... 2 TABLE 3: TMDLS IN THE BANANA RIVER LAGOON SUBBASIN .......................................................10 TABLE 4: 2000 LAND USES IN THE BRL SUBBASIN ......................................................................16 TABLE 5: STEP 2 COMPLIANCE EVALUATION FOR THE BRL SUBBASIN..........................................20 TABLE 6: TN REQUIRED REDUCTIONS BY SOURCE FROM THE BRL TMDL ....................................21 TABLE 7: TP REQUIRED REDUCTIONS BY SOURCE FROM THE BRL TMDL.....................................21 TABLE 8: MS4S IN THE BRL SUBBASIN .......................................................................................22 TABLE 9: BASELINE LOADS FOR THE STORMWATER ENTITIES IN BRL B .......................................25 TABLE 10: DE MINIMUS DETERMINATION FOR BRL B ...................................................................26 TABLE 11: TARGET LOADS PER ACRE FOR TN AND TP IN BRL B .................................................26 TABLE 12: TN TOTAL TMDL REQUIRED REDUCTIONS IN BRL B ...................................................27 TABLE 13: TP TOTAL TMDL REQUIRED REDUCTIONS IN BRL B ...................................................27 TABLE 14: NDPES FACILITIES AND ALLOCATIONS IN THE BRL B PROJECT ZONE .........................28 TABLE 15: TN AND TP REQUIRED REDUCTIONS FOR THE MS4S IN BRL B ....................................28 TABLE 16: SUMMARY OF MS4 LOAD REDUCTIONS FOR TN BY PROJECT TYPE IN BRL A ...............31 TABLE 17: SUMMARY OF MS4 LOAD REDUCTIONS FOR TP BY PROJECT TYPE IN BRL A ...............31 TABLE 18: SUMMARY OF MS4 LOAD REDUCTIONS FOR TN BY PROJECT TYPE IN BRL B ...............33 TABLE 19: SUMMARY OF MS4 LOAD REDUCTIONS FOR TP BY PROJECT TYPE IN BRL B ...............33 TABLE 20: SUMMARY OF NON-MS4 LOAD REDUCTIONS FOR TN BY PROJECT TYPE IN BRL A .......33 TABLE 21: SUMMARY OF NON-MS4 LOAD REDUCTIONS FOR TP BY PROJECT TYPE IN BRL A .......33 TABLE 22: WATER QUALITY MONITORING STATIONS IN THE BRL SUBBASIN .................................39 TABLE A-1: MAJOR HYDROLOGIC BASINS BY GROUP AND FDEP DISTRICT OFFICE .......................52 TABLE G-1: STORMWATER AND WATER QUALITY PROTECTION WEBSITES ....................................77
FINAL Banana River Lagoon Basin Management Action Plan – January 2013
vii
LIST OF ACRONYMS
AFB Air Force Base AFS Air Force Station BMAP Basin Management Action Plan BMP Best Management Practice BRL Banana River Lagoon CCMP Comprehensive Conservation Management Plan CDS Continuous Deflective Separation (Unit) C.F.R. Code of Federal Regulations DO Dissolved Oxygen DOC Dissolved Organic Carbon EMC Event Mean Concentration EPA U.S. Environmental Protection Agency ERP Environmental Resource Permit F.A.C. Florida Administrative Code FDACS Florida Department of Agriculture and Consumer Services FDEP Florida Department of Environmental Protection FDOT Florida Department of Transportation F.S. Florida Statutes FWRA Florida Watershed Restoration Act FYN Florida Yards and Neighborhoods GIS Geographic Information System IRL Indian River Lagoon IWR Impaired Surface Waters Rule LID Low Impact Development MAPS Managed Aquatic Plant Systems MEP Maximum Extent Practicable MS4 Municipal Separate Storm Sewer System NELAC National Environmental Laboratory Accreditation Council NELAP National Environmental Laboratory Accreditation Program NEP National Estuary Program NPDES National Pollutant Discharge Elimination System NRCS Natural Resources Conservation Service O&M Operation and Maintenance PAR Photosynthetically Active Radiation PLRG Pollutant Load Reduction Goal PLSM Pollutant Load Screening Model POTW Publicly Owned Treatment Works PSA Public Service Announcement QA/QC Quality Assurance/Quality Control ROC Runoff Coefficient SJRWMD St. Johns River Water Management District SOP Standard Operating Procedure STORET STOrage and RETrieval (Database) SWIM Surface Water Improvement and Management SWMP Stormwater Management Program TKN Total Kjeldahl Nitrogen TMDL Total Maximum Daily Load TN Total Nitrogen

FINAL Banana River Lagoon Basin Management Action Plan – January 2013
viii
TOC Total Organic Carbon TP Total Phosphorus TSS Total Suspended Solids USACE U.S. Army Corps of Engineers WBID Waterbody Identification WLA Wasteload Allocation WWTF Wastewater Treatment Facility
FINAL Banana River Lagoon Basin Management Action Plan – January 2013
ix
EXECUTIVE SUMMARY
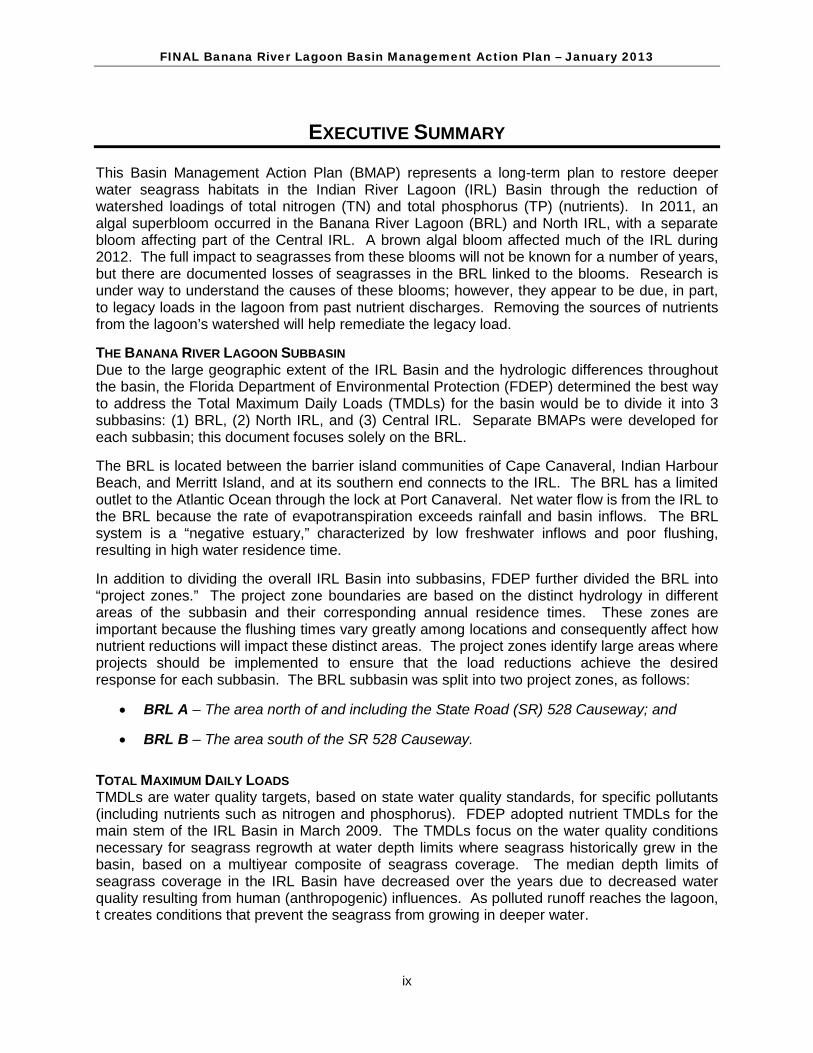
This Basin Management Action Plan (BMAP) represents a long-term plan to restore deeper water seagrass habitats in the Indian River Lagoon (IRL) Basin through the reduction of watershed loadings of total nitrogen (TN) and total phosphorus (TP) (nutrients). In 2011, an algal superbloom occurred in the Banana River Lagoon (BRL) and North IRL, with a separate bloom affecting part of the Central IRL. A brown algal bloom affected much of the IRL during 2012. The full impact to seagrasses from these blooms will not be known for a number of years, but there are documented losses of seagrasses in the BRL linked to the blooms. Research is under way to understand the causes of these blooms; however, they appear to be due, in part, to legacy loads in the lagoon from past nutrient discharges. Removing the sources of nutrients from the lagoon’s watershed will help remediate the legacy load.
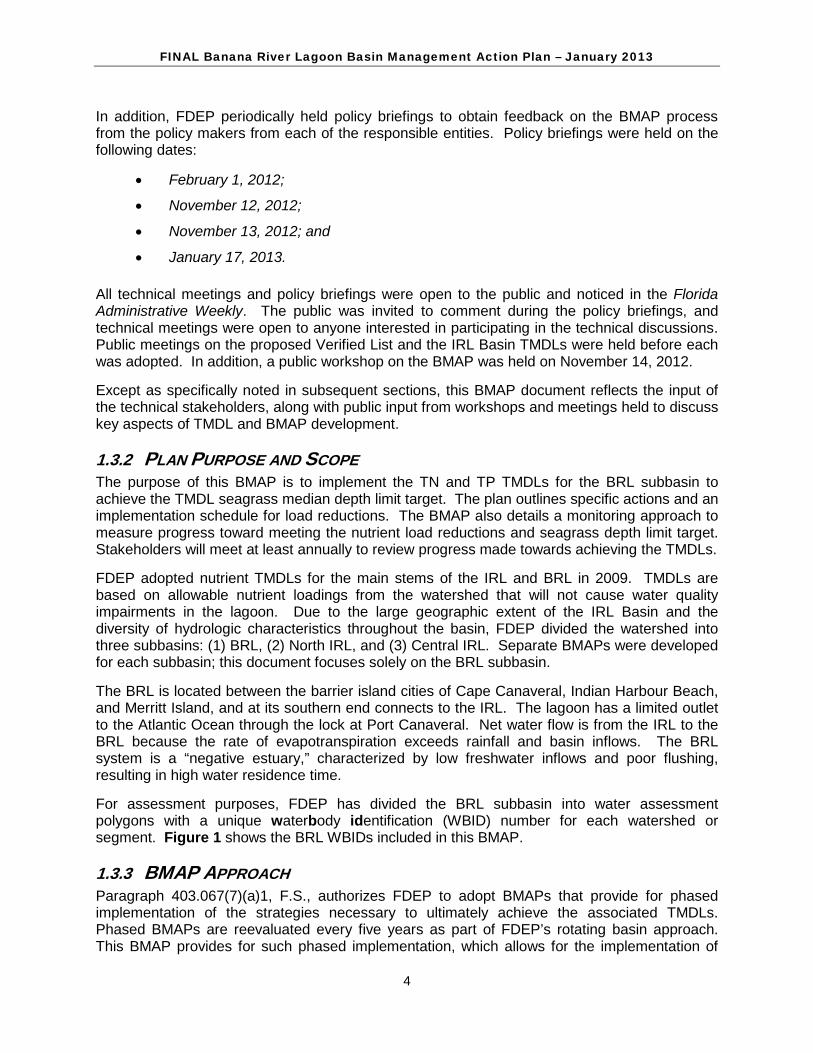
THE BANANA RIVER LAGOON SUBBASIN Due to the large geographic extent of the IRL Basin and the hydrologic differences throughout the basin, the Florida Department of Environmental Protection (FDEP) determined the best way to address the Total Maximum Daily Loads (TMDLs) for the basin would be to divide it into 3 subbasins: (1) BRL, (2) North IRL, and (3) Central IRL. Separate BMAPs were developed for each subbasin; this document focuses solely on the BRL.
The BRL is located between the barrier island communities of Cape Canaveral, Indian Harbour Beach, and Merritt Island, and at its southern end connects to the IRL. The BRL has a limited outlet to the Atlantic Ocean through the lock at Port Canaveral. Net water flow is from the IRL to the BRL because the rate of evapotranspiration exceeds rainfall and basin inflows. The BRL system is a “negative estuary,” characterized by low freshwater inflows and poor flushing, resulting in high water residence time.
In addition to dividing the overall IRL Basin into subbasins, FDEP further divided the BRL into “project zones.” The project zone boundaries are based on the distinct hydrology in different areas of the subbasin and their corresponding annual residence times. These zones are important because the flushing times vary greatly among locations and consequently affect how nutrient reductions will impact these distinct areas. The project zones identify large areas where projects should be implemented to ensure that the load reductions achieve the desired response for each subbasin. The BRL subbasin was split into two project zones, as follows:
• BRL A – The area north of and including the State Road (SR) 528 Causeway; and
• BRL B – The area south of the SR 528 Causeway.
TOTAL MAXIMUM DAILY LOADS TMDLs are water quality targets, based on state water quality standards, for specific pollutants (including nutrients such as nitrogen and phosphorus). FDEP adopted nutrient TMDLs for the main stem of the IRL Basin in March 2009. The TMDLs focus on the water quality conditions necessary for seagrass regrowth at water depth limits where seagrass historically grew in the basin, based on a multiyear composite of seagrass coverage. The median depth limits of seagrass coverage in the IRL Basin have decreased over the years due to decreased water quality resulting from human (anthropogenic) influences. As polluted runoff reaches the lagoon, t creates conditions that prevent the seagrass from growing in deeper water.
FINAL Banana River Lagoon Basin Management Action Plan – January 2013
x
To determine the amount of nutrient reductions needed to improve lagoon water quality in each subbasin, the TMDL analysis regressed 3 years of loading levels against the same years’ seagrass coverage to calculate the restoration target of 10% less than the multiyear composite of historical seagrass depth limit coverage. This target is based on 7 years of historical seagrass data from 1943 to 1999 to determine at what depths the deep edge of the seagrass beds previously grew. Since changes in the IRL Basin will likely prevent 100% restoration of seagrass at these depths, the TMDL allowed for a 10% reduction in the target seagrass depth. The 10% reduction was selected to be consistent with the water quality criteria in Rule 62-302, Florida Administrative Code (F.A.C.), which allows up to a 10% reduction in the photo-compensation point. This target should result in nutrient reductions that allow seagrass to grow almost to the depths previously seen in the area.
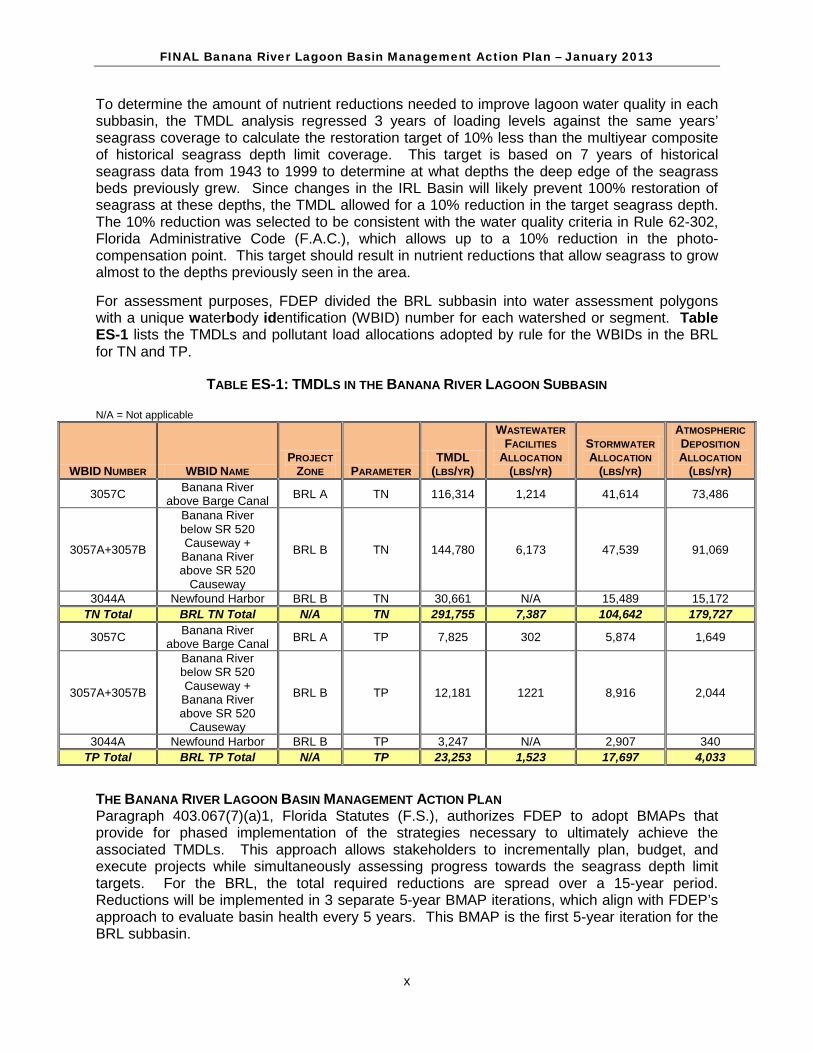
For assessment purposes, FDEP divided the BRL subbasin into water assessment polygons with a unique waterbody identification (WBID) number for each watershed or segment. Table ES-1 lists the TMDLs and pollutant load allocations adopted by rule for the WBIDs in the BRL for TN and TP.
TABLE ES-1: TMDLS IN THE BANANA RIVER LAGOON SUBBASIN N/A = Not applicable
WBID NUMBER WBID NAME PROJECT
ZONE PARAMETER TMDL
(LBS/YR)
WASTEWATER FACILITIES
ALLOCATION (LBS/YR)
STORMWATER ALLOCATION
(LBS/YR)
ATMOSPHERIC DEPOSITION ALLOCATION
(LBS/YR)
3057C Banana River above Barge Canal BRL A TN 116,314 1,214 41,614 73,486
3057A+3057B
Banana River below SR 520 Causeway + Banana River above SR 520
Causeway
BRL B TN 144,780 6,173 47,539 91,069
3044A Newfound Harbor BRL B TN 30,661 N/A 15,489 15,172 TN Total BRL TN Total N/A TN 291,755 7,387 104,642 179,727
3057C Banana River above Barge Canal BRL A TP 7,825 302 5,874 1,649
3057A+3057B
Banana River below SR 520 Causeway + Banana River above SR 520
Causeway
BRL B TP 12,181 1221 8,916 2,044
3044A Newfound Harbor BRL B TP 3,247 N/A 2,907 340 TP Total BRL TP Total N/A TP 23,253 1,523 17,697 4,033
THE BANANA RIVER LAGOON BASIN MANAGEMENT ACTION PLAN Paragraph 403.067(7)(a)1, Florida Statutes (F.S.), authorizes FDEP to adopt BMAPs that provide for phased implementation of the strategies necessary to ultimately achieve the associated TMDLs. This approach allows stakeholders to incrementally plan, budget, and execute projects while simultaneously assessing progress towards the seagrass depth limit targets. For the BRL, the total required reductions are spread over a 15-year period. Reductions will be implemented in 3 separate 5-year BMAP iterations, which align with FDEP’s approach to evaluate basin health every 5 years. This BMAP is the first 5-year iteration for the BRL subbasin.
FINAL Banana River Lagoon Basin Management Action Plan – January 2013
xi
The intent of the TMDLs is to recover the deeper water seagrass habitats, with the biological response of the seagrass being the most important factor in evaluating success in achieving TMDL targets. To assess progress for the IRL Basin towards the median seagrass depth limit target, a two-step process was used: Step 1 is a seagrass frequency distribution analysis, and Step 2 is a median seagrass depth evaluation. If seagrass in a project zone passes both evaluation steps, no nutrient reductions are required by the stakeholders in that zone. FDEP conducted the two-step evaluation using seagrass data from 2003, 2005, 2006, 2007, and 2009, which were the latest datasets available at the time of the analysis, to evaluate seagrass for this first BMAP iteration. BRL A was both Step 1 and Step 2 compliant, and BRL B was neither Step 1 nor Step 2 compliant. Therefore, the TMDL depth limit target was achieved in BRL A, and the stakeholders in this zone were not required to make additional reductions in the first BMAP iteration. BRL B did not achieve the TMDL seagrass depth limit targets; therefore, the stakeholders in this zone were required to make additional reductions in this iteration.
In the first 5-year iteration of the BMAP, the required activities are not expected to achieve the TMDLs. Rather, this BMAP only calls for projects and other activities necessary to achieve reductions of 14,608.4 lbs/yr of TN and 3,353.3 lbs/yr of TP, which is 15% of the TMDL total required reductions for the BRL B project zone, by the end of the first 5-year iteration. Compliance with the seagrass depth limit targets will be reevaluated before the next BMAP iteration using seagrass mapping data from 2007, 2009, 2011, and 2013, which will likely be the latest data available at that time. The BRL B project zone did not meet the seagrass depth limit target for 2007 or 2009; therefore, a second iteration of the BRL BMAP will be required to implement additional management actions to achieve the TMDL seagrass depth limit targets.
MANAGEMENT ACTIONS AND BMAP ENFORCEMENT To achieve the required reductions for this iteration of the BMAP, stakeholders submitted structural and nonstructural management actions. The management actions had to meet several criteria to be considered eligible for credit in the BMAP. The activities submitted were required to address nutrient loads and to be located in the appropriate BRL project zone. Management actions were only given credit for the portion of the load reduction that was over and above any permit requirements, to ensure improvement in water quality in the BRL. In addition, projects completed since January 1, 2000, were eligible for BMAP credit because the land uses in the TMDL model are from 2000; therefore, the model did not reflect the benefits of management actions since this time. The actions included in this first iteration of the BMAP have been completed or are planned within the next five years. These projects are the “low-hanging fruit,” and future BMAP iterations will require planning for additional projects.
The stakeholders submitted the projects included in the BMAP to provide reasonable assurance to FDEP that each entity has a plan for meeting its allocation. This list of projects is meant to be flexible enough to allow for changes that may occur over time, provided that the reductions are still met within the specified time frame. For point sources—both wastewater treatment facilities (WWTFs) and municipal separate storm sewer systems (MS4s)—the BMAP-required reductions are enforceable through National Pollutant Discharge Elimination System (NPDES) permits. For non-MS4s, the BMAP requirements are enforceable through the BMAP itself, and FDEP also has the option to designate a non-MS4 as a Phase II MS4 to ensure the reductions occur. For the agricultural sources, applicable best management practices (BMPs) must be implemented or water quality monitoring must occur to demonstrate that the property is not having an impact on water quality. Overall, there must be sufficient projects and reductions to demonstrate that water quality criteria will be met and, if sources of TN and TP do not comply, enforcement action can be taken.
FINAL Banana River Lagoon Basin Management Action Plan – January 2013
xii
ECONOMIC BENEFITS OF THE INDIAN RIVER LAGOON SYSTEM The IRL is a valuable ecological and economic asset for the state of Florida and the counties and cities that border the lagoon and its tributaries. It is considered the most biologically diverse estuary in North America and was recognized as part of the National Estuary Program (NEP) in 1990. The lagoon directly and indirectly supports a large part of the region’s and the state’s economy. A significant increase in the amount and diversity of wildlife in the lagoon and improved water quality in the entire IRL Basin would increase recreational use value by about $80 million per year. The economic value of the entire IRL Basin’s seagrass beds was estimated as $329 million per year for 72,400 acres of seagrass. Therefore, investing in projects and programs to improve the lagoon’s water quality and seagrass beds is not only important for environmental considerations but also to improve the economy.
ANTICIPATED OUTCOMES OF BMAP IMPLEMENTATION With the implementation of the projects outlined in this BMAP, reductions in TN and TP loads to the BRL are expected to improve water quality conditions and seagrass depths. The following outcomes are expected from BMAP implementation:
• Improved water quality trends in the BRL, which will help improve seagrass depth limits;
• Decreased loading of the target pollutants (TN and TP);
• Decreased loading in total suspended solids (TSS) from some of the projects implemented to reduce TN and TP loads;
• Increased coordination between state and local governments and within divisions of local governments when solving problems for surface water quality restoration;
• Additional state and local funding secured for water quality restoration;
• Improved identification of effective projects through stakeholder decision-making and priority-setting processes;
• Enhanced public awareness of pollutant sources, pollutant impacts on water quality, and corresponding corrective actions; and
• Enhanced understanding of basin hydrology, water quality, and pollutant sources.
KEY ELEMENTS OF THE BMAP This BMAP addresses key elements required by the Florida Watershed Restoration Act (FWRA), Chapter 403.067, F.S., including the following:
• Document how the public and other stakeholders were encouraged to participate or participated in developing the BMAP (Section 1.3.1);
• Allocate pollutant reductions in the basin equitably (Chapter 4);
• Identify the mechanisms by which potential future increases in pollutant loading will be addressed (Section 1.5);
• Document management actions/projects to achieve the TMDLs (Chapter 5 and Appendix E);
FINAL Banana River Lagoon Basin Management Action Plan – January 2013
xiii
• Document the implementation schedule, funding, responsibilities, and milestones (Appendix E); and
• Identify monitoring, evaluation, and a reporting strategy to evaluate reasonable progress over time (Section 6.3).
BMAP COST Costs were provided for 31.7% of the activities identified in the BMAP, at an estimated total cost of more than $17.7 million. In addition, annual operation and maintenance (O&M) costs were provided for 11.7% of the projects, at a total cost of $167,195. It is important to note that many BMAP projects were built to achieve multiple objectives, not just nutrient reduction; therefore, multiple objectives should be acknowledged when estimating the cost per pound of nutrient removal from these projects. The funding sources for the projects range from local contributions to legislative appropriations. Stakeholders will continue to explore new sources of funding to ensure that the activities listed in this BMAP can be achieved at the necessary level of effort.
BMAP FOLLOW-UP FDEP will work with the stakeholders to monitor trends in seagrass distribution and water quality, as well as track project implementation. The results will be used to evaluate compliance with the seagrass depth limit targets. The technical stakeholders will meet at least every 12 months after BMAP adoption to follow up on plan implementation, share new information, and continue to coordinate efforts to address TMDL-related issues.
COMMITMENT TO BMAP IMPLEMENTATION The stakeholders have committed to implementing the projects and activities included in this BMAP. The entities are also providing to FDEP, as needed, letters of commitment or resolutions of support to ensure that as staff and board members change over time, the entity has documentation of its support for the BMAP and associated efforts.
FINAL Banana River Lagoon Basin Management Action Plan – January 2013
1
CHAPTER 1: CONTEXT, PURPOSE, AND SCOPE OF THE PLAN
The Indian River Lagoon (IRL) system is a nationally renowned estuary that supports both remarkable biological diversity and recreational resources. However, the seagrass beds in the lagoon system have been impacted over time by loss of wetlands, excessive freshwater discharges, and discharges of pollutants (including nutrients) through stormwater and wastewater (Florida Department of Environmental Protection [FDEP] 2009). To address the nutrient impacts to the seagrass beds, FDEP adopted Total Maximum Daily Loads (TMDLs) to reduce the watershed nutrient inputs to the lagoon. This Basin Management Action Plan (BMAP) focuses on the Banana River Lagoon (BRL) subbasin.
The BMAP represents a long-term plan to restore deeper water seagrass habitats in the BRL Basin through the reduction of watershed loadings of total nitrogen (TN) and total phosphorus (TP) (nutrients). In 2011, an algal superbloom occurred in the BRL and North IRL, with a separate bloom affecting part of the Central IRL. A brown algal bloom affected much of the IRL during 2012. The full impact to seagrasses from these blooms will not be known for a number of years, but there are documented losses of seagrasses in the BRL linked to the blooms. Research is under way to understand the causes of these blooms; however, they appear to be due, in part, to legacy loads in the lagoon from past nutrient discharges. Removing the sources of nutrients from the lagoon’s watershed will help address the legacy loads.
This BMAP represents the joint efforts of multiple stakeholders to prepare a restoration plan for the BRL that works towards meeting the adopted TMDLs. This BMAP includes projects that reduce watershed nutrient loading to the lagoon to improve seagrass coverage, achieve the median seagrass depth limit, and a monitoring plan to guide effective long-term restoration efforts. The BMAP was developed as part of FDEP’s TMDL Program. Stakeholder involvement is critical to the success of the entire TMDL Program.
Stakeholder involvement is particularly essential to develop, gain support for, and secure commitments in a BMAP. FDEP invited all interested stakeholders to participate in the BRL BMAP development and facilitated participation to ensure that all voices were heard and opinions considered. This approach resulted in the first 5-year BMAP iteration that is expected to achieve discernible results through the use of a 15-year, phased implementation.
This chapter describes the TMDL Program, stakeholder involvement in BMAP development, BMAP purpose and scope, BMAP approach, TMDLs addressed, assumptions and considerations identified during BMAP development, and future growth in the basin.
1.1 WATER QUALITY STANDARDS AND TOTAL MAXIMUM DAILY LOADS Florida's water quality standards are designed to ensure that surface waters can be used for their designated purposes, such as drinking water, recreation, and shellfish harvesting. The waters in the BRL subbasin are categorized as Class III waters, meaning they must be suitable for recreation and must support the propagation and maintenance of a healthy, well-balanced population of fish and wildlife. Table 1 shows all designated use categories.
Under Section 303(d) of the federal Clean Water Act, every two years each state must identify its “impaired” waters, including estuaries, lakes, rivers, and streams, that do not meet their designated uses and are not expected to meet applicable water quality standards within the subsequent two years. FDEP is responsible for developing this “303(d) list” of impaired waters.
FINAL Banana River Lagoon Basin Management Action Plan – January 2013
2
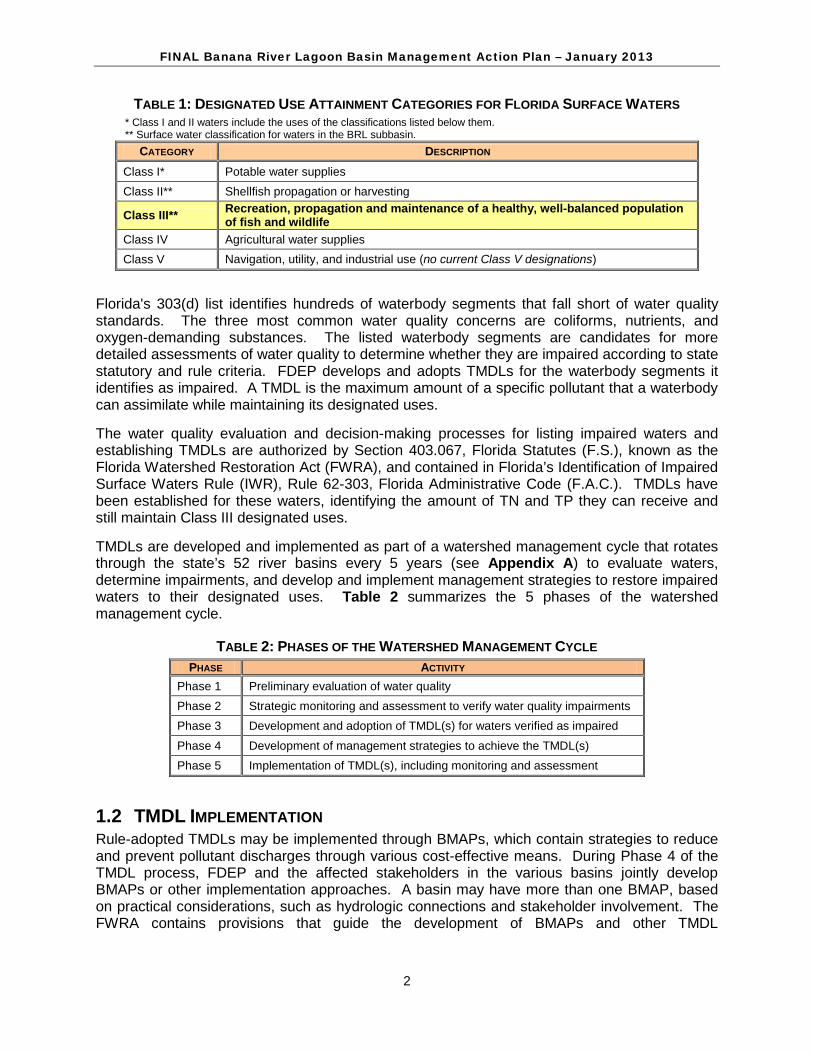
TABLE 1: DESIGNATED USE ATTAINMENT CATEGORIES FOR FLORIDA SURFACE WATERS * Class I and II waters include the uses of the classifications listed below them. ** Surface water classification for waters in the BRL subbasin.
CATEGORY DESCRIPTION Class I* Potable water supplies Class II** Shellfish propagation or harvesting
Class III** Recreation, propagation and maintenance of a healthy, well-balanced population of fish and wildlife
Class IV Agricultural water supplies Class V Navigation, utility, and industrial use (no current Class V designations)
Florida's 303(d) list identifies hundreds of waterbody segments that fall short of water quality standards. The three most common water quality concerns are coliforms, nutrients, and oxygen-demanding substances. The listed waterbody segments are candidates for more detailed assessments of water quality to determine whether they are impaired according to state statutory and rule criteria. FDEP develops and adopts TMDLs for the waterbody segments it identifies as impaired. A TMDL is the maximum amount of a specific pollutant that a waterbody can assimilate while maintaining its designated uses.
The water quality evaluation and decision-making processes for listing impaired waters and establishing TMDLs are authorized by Section 403.067, Florida Statutes (F.S.), known as the Florida Watershed Restoration Act (FWRA), and contained in Florida’s Identification of Impaired Surface Waters Rule (IWR), Rule 62-303, Florida Administrative Code (F.A.C.). TMDLs have been established for these waters, identifying the amount of TN and TP they can receive and still maintain Class III designated uses.
TMDLs are developed and implemented as part of a watershed management cycle that rotates through the state’s 52 river basins every 5 years (see Appendix A) to evaluate waters, determine impairments, and develop and implement management strategies to restore impaired waters to their designated uses. Table 2 summarizes the 5 phases of the watershed management cycle.
TABLE 2: PHASES OF THE WATERSHED MANAGEMENT CYCLE PHASE ACTIVITY
Phase 1 Preliminary evaluation of water quality Phase 2 Strategic monitoring and assessment to verify water quality impairments Phase 3 Development and adoption of TMDL(s) for waters verified as impaired
Phase 4 Development of management strategies to achieve the TMDL(s) Phase 5 Implementation of TMDL(s), including monitoring and assessment
1.2 TMDL IMPLEMENTATION Rule-adopted TMDLs may be implemented through BMAPs, which contain strategies to reduce and prevent pollutant discharges through various cost-effective means. During Phase 4 of the TMDL process, FDEP and the affected stakeholders in the various basins jointly develop BMAPs or other implementation approaches. A basin may have more than one BMAP, based on practical considerations, such as hydrologic connections and stakeholder involvement. The FWRA contains provisions that guide the development of BMAPs and other TMDL
FINAL Banana River Lagoon Basin Management Action Plan – January 2013
3
implementation approaches. Appendix B summarizes the statutory provisions related to BMAP development.
Stakeholder involvement is critical to the success of the TMDL Program, and varies with each phase of implementation to achieve different purposes. The BMAP development process is structured to achieve cooperation and consensus among a broad range of interested parties. Under statute, FDEP invites stakeholders to participate in the BMAP development process and encourages public participation to the greatest extent practicable. FDEP must hold at least one noticed public meeting in the basin to discuss and receive comments during the planning process. Stakeholder involvement is essential to develop, gain support for, and secure commitments to implement the BMAP.
1.3 THE BANANA RIVER LAGOON BASIN MANAGEMENT ACTION PLAN
1.3.1 STAKEHOLDER INVOLVEMENT In June 2009, FDEP initiated BMAP technical meetings involving key stakeholders. The purpose of the technical meetings was to organize and review the technical information that is the basis of the BMAP, gather information to aid in the development of the BMAP, and identify management actions that improve water quality. Additional details about the discussions held at these meetings can be found in the meeting summaries, which are posted at http://publicfiles.dep.state.fl.us/DEAR/BMAP/IndianRiverLagoon/. Technical meetings were held regularly throughout the BMAP development process on the following dates:
• June 12, 2009;
• July 10, 2009;
• October 9, 2009;
• December 11, 2009;
• March 12, 2010;
• May 14, 2010;
• June 18, 2010;
• July 9, 2010;
• January 4, 2011;
• April 8, 2011;
• June 17, 2011;
• September 22, 2011;
• December 2, 2011;
• March 2, 2012;
• April 26, 2012;
• June 7, 2012;
• August 2, 2012; and
• September 20, 2012.
FINAL Banana River Lagoon Basin Management Action Plan – January 2013
4
In addition, FDEP periodically held policy briefings to obtain feedback on the BMAP process from the policy makers from each of the responsible entities. Policy briefings were held on the following dates:
• February 1, 2012;
• November 12, 2012;
• November 13, 2012; and
• January 17, 2013. All technical meetings and policy briefings were open to the public and noticed in the Florida Administrative Weekly. The public was invited to comment during the policy briefings, and technical meetings were open to anyone interested in participating in the technical discussions. Public meetings on the proposed Verified List and the IRL Basin TMDLs were held before each was adopted. In addition, a public workshop on the BMAP was held on November 14, 2012.
Except as specifically noted in subsequent sections, this BMAP document reflects the input of the technical stakeholders, along with public input from workshops and meetings held to discuss key aspects of TMDL and BMAP development.
1.3.2 PLAN PURPOSE AND SCOPE The purpose of this BMAP is to implement the TN and TP TMDLs for the BRL subbasin to achieve the TMDL seagrass median depth limit target. The plan outlines specific actions and an implementation schedule for load reductions. The BMAP also details a monitoring approach to measure progress toward meeting the nutrient load reductions and seagrass depth limit target. Stakeholders will meet at least annually to review progress made towards achieving the TMDLs.
FDEP adopted nutrient TMDLs for the main stems of the IRL and BRL in 2009. TMDLs are based on allowable nutrient loadings from the watershed that will not cause water quality impairments in the lagoon. Due to the large geographic extent of the IRL Basin and the diversity of hydrologic characteristics throughout the basin, FDEP divided the watershed into three subbasins: (1) BRL, (2) North IRL, and (3) Central IRL. Separate BMAPs were developed for each subbasin; this document focuses solely on the BRL subbasin.
The BRL is located between the barrier island cities of Cape Canaveral, Indian Harbour Beach, and Merritt Island, and at its southern end connects to the IRL. The lagoon has a limited outlet to the Atlantic Ocean through the lock at Port Canaveral. Net water flow is from the IRL to the BRL because the rate of evapotranspiration exceeds rainfall and basin inflows. The BRL system is a “negative estuary,” characterized by low freshwater inflows and poor flushing, resulting in high water residence time.
For assessment purposes, FDEP has divided the BRL subbasin into water assessment polygons with a unique waterbody identification (WBID) number for each watershed or segment. Figure 1 shows the BRL WBIDs included in this BMAP.
1.3.3 BMAP APPROACH Paragraph 403.067(7)(a)1, F.S., authorizes FDEP to adopt BMAPs that provide for phased implementation of the strategies necessary to ultimately achieve the associated TMDLs. Phased BMAPs are reevaluated every five years as part of FDEP’s rotating basin approach. This BMAP provides for such phased implementation, which allows for the implementation of
FINAL Banana River Lagoon Basin Management Action Plan – January 2013
5
projects designed to achieve incremental reductions, while simultaneously monitoring to assess progress towards the seagrass depth limit targets.
The total required reductions from the TMDLs are spread over a 15-year period. In the first 5-year iteration of the BMAP, the required activities are not expected to achieve the TMDL. Rather, this BMAP only calls for projects and other activities necessary to achieve reductions of 14,608.4 lbs/yr of TN and 3,353.3 lbs/yr of TP, which is 15% of the TMDL total required reductions for the BRL B project zone, by the end of the first 5-year iteration. A second iteration of the BRL BMAP will be required to implement additional management actions to achieve the TMDL seagrass depth limit targets. These reductions will be more difficult for the stakeholders to achieve in the second BMAP iteration.
In this BMAP, projects completed since January 1, 2000, projects planned in the next 5 years, and provisional credit for ordinances and outreach programs designed to reduce these sources of stormwater pollution were assigned credit. To achieve the seagrass depth limit targets in future BMAP iterations, the stakeholders will have to continue their education and maintenance activities, as well as identify new management actions to achieve the necessary reductions, because past and continuing efforts have already been accounted for.
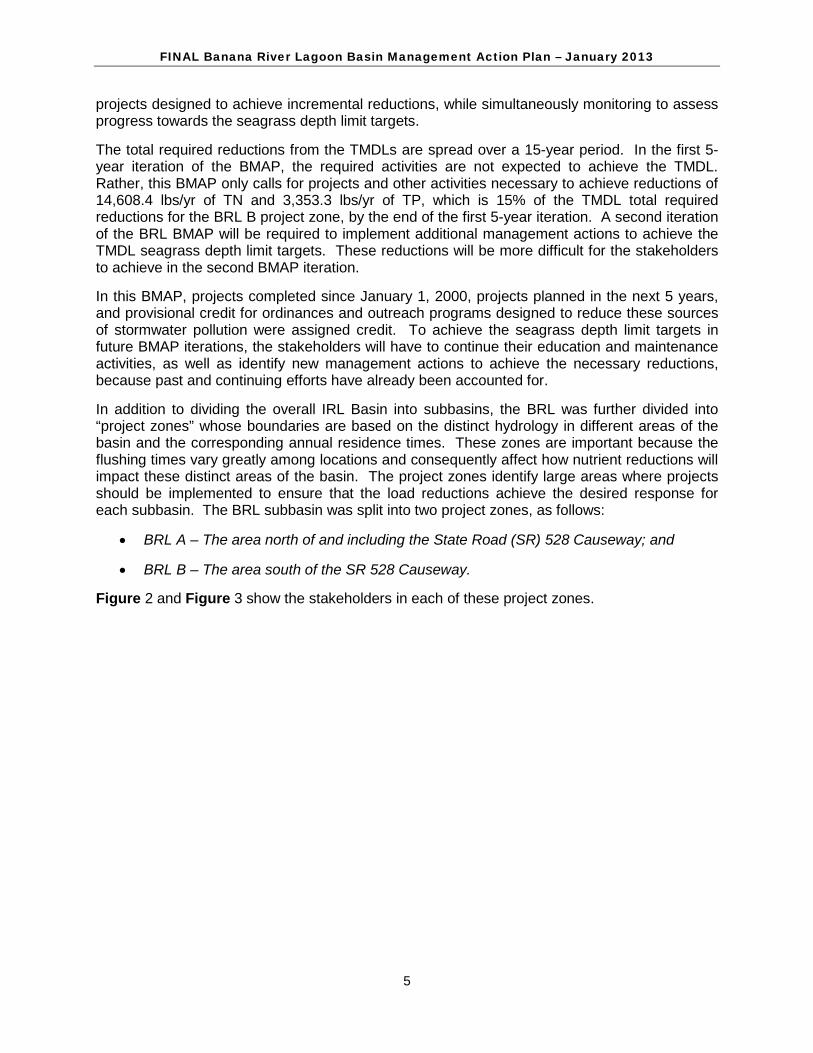
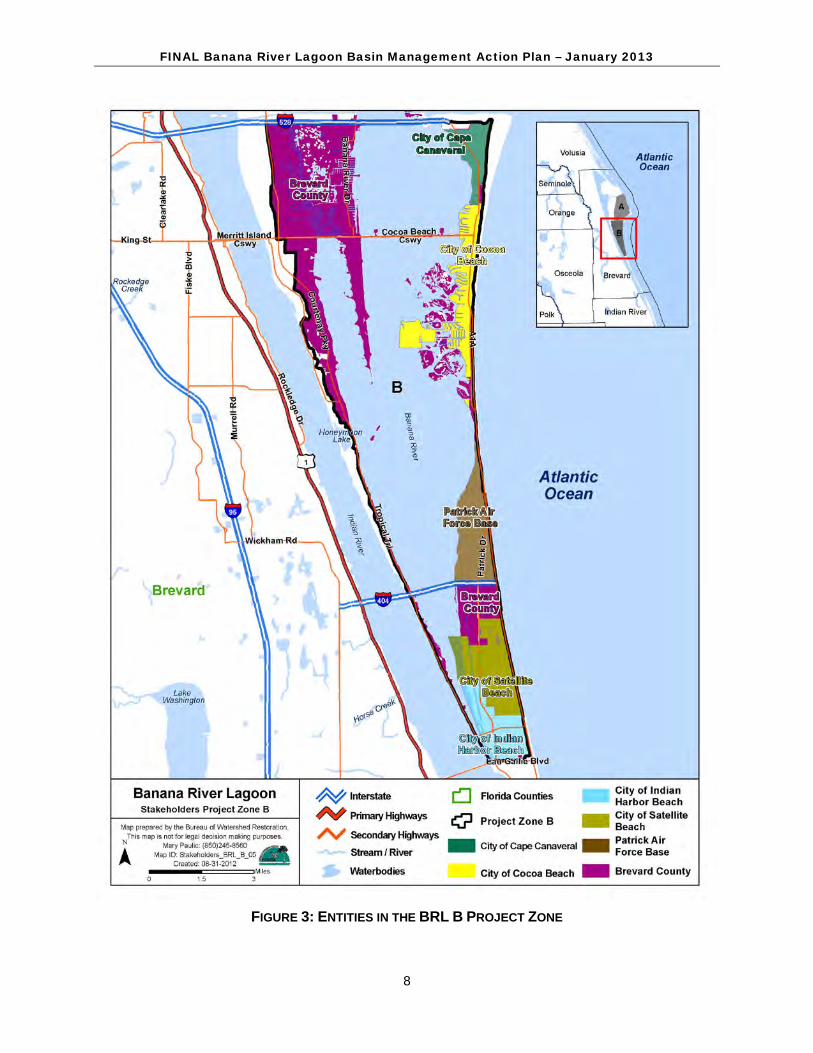
In addition to dividing the overall IRL Basin into subbasins, the BRL was further divided into “project zones” whose boundaries are based on the distinct hydrology in different areas of the basin and the corresponding annual residence times. These zones are important because the flushing times vary greatly among locations and consequently affect how nutrient reductions will impact these distinct areas of the basin. The project zones identify large areas where projects should be implemented to ensure that the load reductions achieve the desired response for each subbasin. The BRL subbasin was split into two project zones, as follows:
• BRL A – The area north of and including the State Road (SR) 528 Causeway; and
• BRL B – The area south of the SR 528 Causeway.
Figure 2 and Figure 3 show the stakeholders in each of these project zones.
FINAL Banana River Lagoon Basin Management Action Plan – January 2013
6
FIGURE 1: BANANA RIVER LAGOON SUBBASIN WBIDS
FINAL Banana River Lagoon Basin Management Action Plan – January 2013
7
FIGURE 2: ENTITIES IN THE BRL A PROJECT ZONE
FINAL Banana River Lagoon Basin Management Action Plan – January 2013
8
FIGURE 3: ENTITIES IN THE BRL B PROJECT ZONE
FINAL Banana River Lagoon Basin Management Action Plan – January 2013
9
1.3.4 POLLUTANT REDUCTION AND DISCHARGE ALLOCATIONS
1.3.4.1 Categories for Rule Allocations The rules adopting TMDLs must establish reasonable and equitable allocations that will alone, or in conjunction with other management and restoration activities, attain the TMDL. Allocations may be to individual sources, source categories, or basins that discharge to the impaired waterbody. The allocations in rule identify either how much pollutant discharge in pounds per year (lbs/yr) each source designation may continue to contribute (discharge allocation), or the lbs/yr or percent of its loading the source designation must reduce (reduction allocation). Currently, the TMDL allocation categories are as follows:
• Wasteload Allocation (WLA) consists of the allocation to point sources permitted under the National Pollutant Discharge Elimination System (NPDES) Program. It includes the following: o Wastewater Allocation is the discharge allocation to industrial and domestic
wastewater facilities.
o NPDES Stormwater Allocation is the allocation to NPDES stormwater permittees that operate municipal separate storm sewer systems (MS4s). These permittees are treated as point sources under the TMDL Program.
• Load Allocation consists of the allocation to nonpoint sources, including agricultural runoff and stormwater from areas that are not included in an MS4 permit.
1.3.4.2 Initial and Detailed Allocations Under the FWRA, the TMDL allocation in rule may be an “initial” allocation among point and nonpoint sources. In such cases, the “detailed” allocation to specific point sources and specific categories of nonpoint sources must be established in the BMAP. The FWRA further states that the BMAP may make detailed allocations to individual “basins” (i.e., subbasins) or to all basins as a whole, as appropriate. Both initial and detailed allocations must be determined based on a number of factors listed in the FWRA, including cost-benefit, technical and environmental feasibility, implementation time frames, and others (see Appendix B).
1.3.5 TMDLS IN THE BANANA RIVER LAGOON SUBBASIN FDEP adopted the nutrient TMDLs for the main stem of the BRL subbasin in March 2009. The TMDLs focus on the water quality conditions necessary for seagrass regrowth at the depth limits where seagrass historically grew based on a multiyear composite of seagrass coverage. The median depth limits for seagrass coverage in the BRL subbasin decreased over the years due to changes in water quality conditions resulting from anthropogenic influences. As polluted runoff reached the lagoon, it created conditions that prevented the seagrass from growing in deeper water.
To determine the nutrient reductions needed to improve lagoon water quality in each subbasin, the TMDL analysis regressed loading estimates for nonpoint and point sources and data for seagrass depth limits for years with all available data. Years that met data requirements were 1943, 1996, 1999, and 2001. Target nutrient loadings were established by substituting a median depth limit target that was 10% less than the seagrass restoration depth into the established regression equations. This median depth target limit was based on 7 years of historical seagrass data from 1943 to 1999 to determine at what depths the deep edge of the
FINAL Banana River Lagoon Basin Management Action Plan – January 2013
10
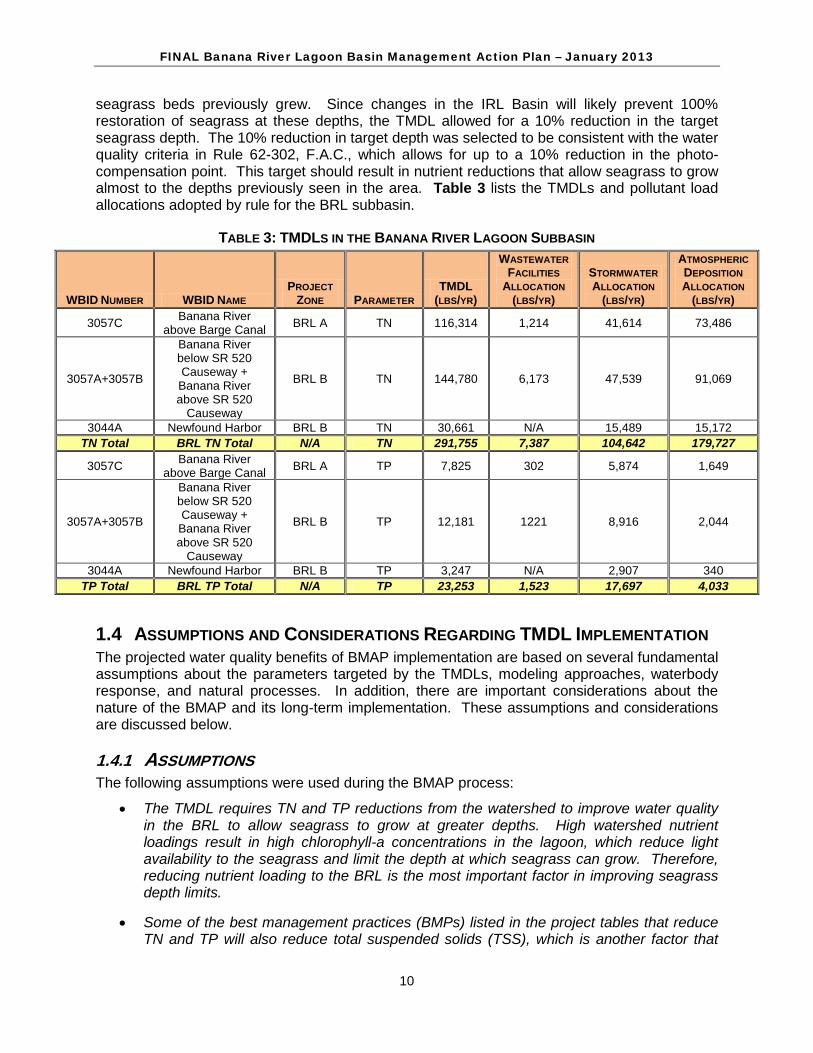
seagrass beds previously grew. Since changes in the IRL Basin will likely prevent 100% restoration of seagrass at these depths, the TMDL allowed for a 10% reduction in the target seagrass depth. The 10% reduction in target depth was selected to be consistent with the water quality criteria in Rule 62-302, F.A.C., which allows for up to a 10% reduction in the photo-compensation point. This target should result in nutrient reductions that allow seagrass to grow almost to the depths previously seen in the area. Table 3 lists the TMDLs and pollutant load allocations adopted by rule for the BRL subbasin.
TABLE 3: TMDLS IN THE BANANA RIVER LAGOON SUBBASIN
WBID NUMBER WBID NAME PROJECT
ZONE PARAMETER TMDL
(LBS/YR)
WASTEWATER FACILITIES
ALLOCATION (LBS/YR)
STORMWATER ALLOCATION
(LBS/YR)
ATMOSPHERIC DEPOSITION ALLOCATION
(LBS/YR)
3057C Banana River above Barge Canal BRL A TN 116,314 1,214 41,614 73,486
3057A+3057B
Banana River below SR 520 Causeway + Banana River above SR 520
Causeway
BRL B TN 144,780 6,173 47,539 91,069
3044A Newfound Harbor BRL B TN 30,661 N/A 15,489 15,172 TN Total BRL TN Total N/A TN 291,755 7,387 104,642 179,727
3057C Banana River above Barge Canal BRL A TP 7,825 302 5,874 1,649
3057A+3057B
Banana River below SR 520 Causeway + Banana River above SR 520
Causeway
BRL B TP 12,181 1221 8,916 2,044
3044A Newfound Harbor BRL B TP 3,247 N/A 2,907 340 TP Total BRL TP Total N/A TP 23,253 1,523 17,697 4,033
1.4 ASSUMPTIONS AND CONSIDERATIONS REGARDING TMDL IMPLEMENTATION The projected water quality benefits of BMAP implementation are based on several fundamental assumptions about the parameters targeted by the TMDLs, modeling approaches, waterbody response, and natural processes. In addition, there are important considerations about the nature of the BMAP and its long-term implementation. These assumptions and considerations are discussed below.
1.4.1 ASSUMPTIONS The following assumptions were used during the BMAP process:
• The TMDL requires TN and TP reductions from the watershed to improve water quality in the BRL to allow seagrass to grow at greater depths. High watershed nutrient loadings result in high chlorophyll-a concentrations in the lagoon, which reduce light availability to the seagrass and limit the depth at which seagrass can grow. Therefore, reducing nutrient loading to the BRL is the most important factor in improving seagrass depth limits.
• Some of the best management practices (BMPs) listed in the project tables that reduce TN and TP will also reduce total suspended solids (TSS), which is another factor that
FINAL Banana River Lagoon Basin Management Action Plan – January 2013
11
limits light penetration in the lagoon. Therefore, reductions in TSS, in conjunction with reductions in nutrients, should allow seagrass to grow at deeper depths in the BRL to achieve the TMDL seagrass depth limit targets.
• Seawater inflow from the lock at Port Canaveral does not have a significant impact on water quality or seagrass distribution in the BRL subbasin.
• The allocations do not include required load reductions from atmospheric deposition because these loads are considered a background, uncontrollable source. The focus of the TMDL allocations is on point source facilities, as well as urban and agricultural stormwater sources in the BRL subbasin.
• Certain BMPs were assigned provisional credit for load reductions in this iteration of the BMAP while additional research is conducted to quantify their effectiveness. These estimated reductions may change, as additional research results become available. Activities that qualified for provisional credit included floating islands, public education and outreach, muck removal, aquatic vegetation harvesting, and water control structures (refer to Section 5.3 for additional details).
1.4.2 CONSIDERATIONS This BMAP requires stakeholders to implement their projects within the specified period to achieve reductions. However, the full implementation of this BMAP will be a long-term process, adaptively managed in five-year cycles. While some projects and activities contained in the BMAP were previously completed or are currently ongoing, many projects will require time for design, permitting, and construction, and to secure funding. Although project funding can be problematic, funding limitations do not affect the requirement that every entity must implement the activities committed to in the BMAP. Achieving water quality standards in the BRL is not an optional objective.
Since BMAP implementation is a long-term process, the TMDL targets established for the BRL subbasin will likely not be achieved in the first five-year cycle. Regular follow-up and continued coordination and communication by the stakeholders is essential to ensure the implementation of management strategies and assessment of their incremental benefits. Additional management actions required to achieve the TMDL, as necessary, will be developed as part of the second and third BMAP iterations.
During the BMAP process, several items were identified that should be addressed in future watershed management cycles to ensure that future BMAPs use the most accurate information:
• Land Uses – The loading estimates in the TMDL are based on land uses at a particular point in time, which allows the model to be validated and calibrated. Land uses, however, change over time and, depending on local trends, can change significantly. The loading estimates for this iteration of the TMDL and BMAP were based on year 2000 land use data. Future iterations should consider more recent land use information and whether allocations should be adjusted accordingly.
• Soil Types – The Natural Resources Conservation Service (NRCS) released a new soil coverage for Florida in February 2010 that includes some significant changes in soil types throughout the IRL Basin. During the next iteration of the BMAP, FDEP will review the updated soil coverage and make adjustments to the Pollutant Load Screening Model (PLSM) as needed.
FINAL Banana River Lagoon Basin Management Action Plan – January 2013
12
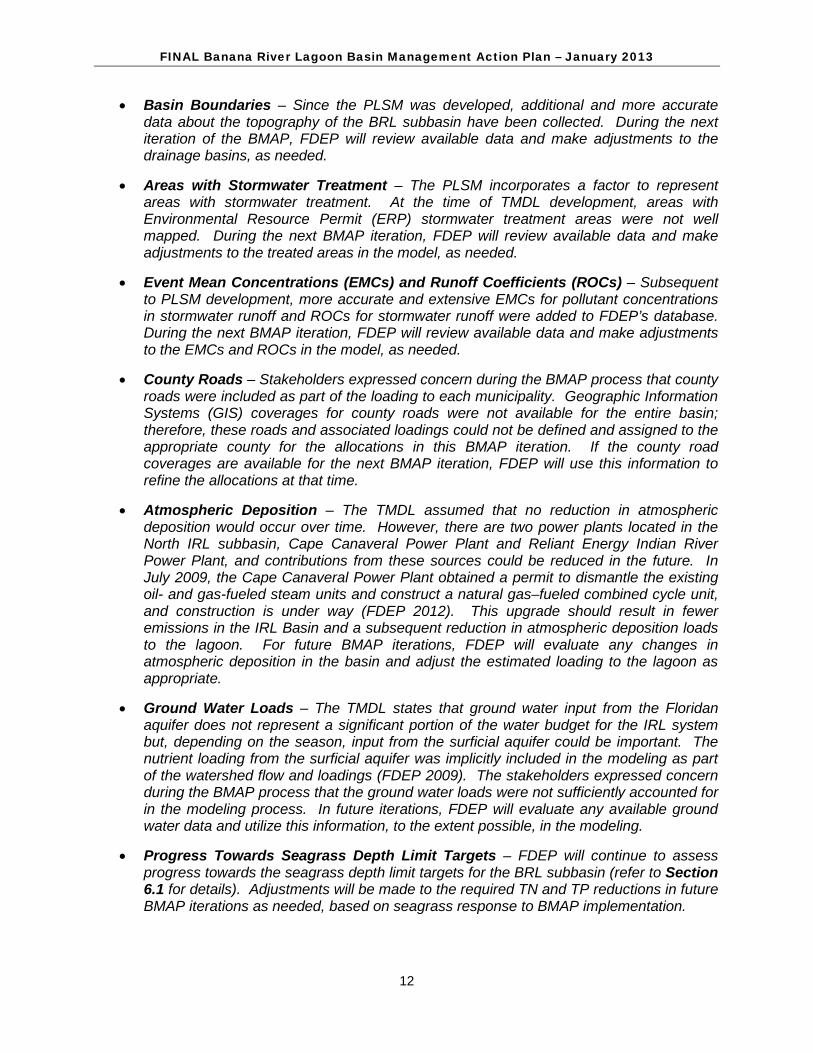
• Basin Boundaries – Since the PLSM was developed, additional and more accurate data about the topography of the BRL subbasin have been collected. During the next iteration of the BMAP, FDEP will review available data and make adjustments to the drainage basins, as needed.
• Areas with Stormwater Treatment – The PLSM incorporates a factor to represent areas with stormwater treatment. At the time of TMDL development, areas with Environmental Resource Permit (ERP) stormwater treatment areas were not well mapped. During the next BMAP iteration, FDEP will review available data and make adjustments to the treated areas in the model, as needed.
• Event Mean Concentrations (EMCs) and Runoff Coefficients (ROCs) – Subsequent to PLSM development, more accurate and extensive EMCs for pollutant concentrations in stormwater runoff and ROCs for stormwater runoff were added to FDEP’s database. During the next BMAP iteration, FDEP will review available data and make adjustments to the EMCs and ROCs in the model, as needed.
• County Roads – Stakeholders expressed concern during the BMAP process that county roads were included as part of the loading to each municipality. Geographic Information Systems (GIS) coverages for county roads were not available for the entire basin; therefore, these roads and associated loadings could not be defined and assigned to the appropriate county for the allocations in this BMAP iteration. If the county road coverages are available for the next BMAP iteration, FDEP will use this information to refine the allocations at that time.
• Atmospheric Deposition – The TMDL assumed that no reduction in atmospheric deposition would occur over time. However, there are two power plants located in the North IRL subbasin, Cape Canaveral Power Plant and Reliant Energy Indian River Power Plant, and contributions from these sources could be reduced in the future. In July 2009, the Cape Canaveral Power Plant obtained a permit to dismantle the existing oil- and gas-fueled steam units and construct a natural gas–fueled combined cycle unit, and construction is under way (FDEP 2012). This upgrade should result in fewer emissions in the IRL Basin and a subsequent reduction in atmospheric deposition loads to the lagoon. For future BMAP iterations, FDEP will evaluate any changes in atmospheric deposition in the basin and adjust the estimated loading to the lagoon as appropriate.
• Ground Water Loads – The TMDL states that ground water input from the Floridan aquifer does not represent a significant portion of the water budget for the IRL system but, depending on the season, input from the surficial aquifer could be important. The nutrient loading from the surficial aquifer was implicitly included in the modeling as part of the watershed flow and loadings (FDEP 2009). The stakeholders expressed concern during the BMAP process that the ground water loads were not sufficiently accounted for in the modeling process. In future iterations, FDEP will evaluate any available ground water data and utilize this information, to the extent possible, in the modeling.
• Progress Towards Seagrass Depth Limit Targets – FDEP will continue to assess progress towards the seagrass depth limit targets for the BRL subbasin (refer to Section 6.1 for details). Adjustments will be made to the required TN and TP reductions in future BMAP iterations as needed, based on seagrass response to BMAP implementation.
FINAL Banana River Lagoon Basin Management Action Plan – January 2013
13
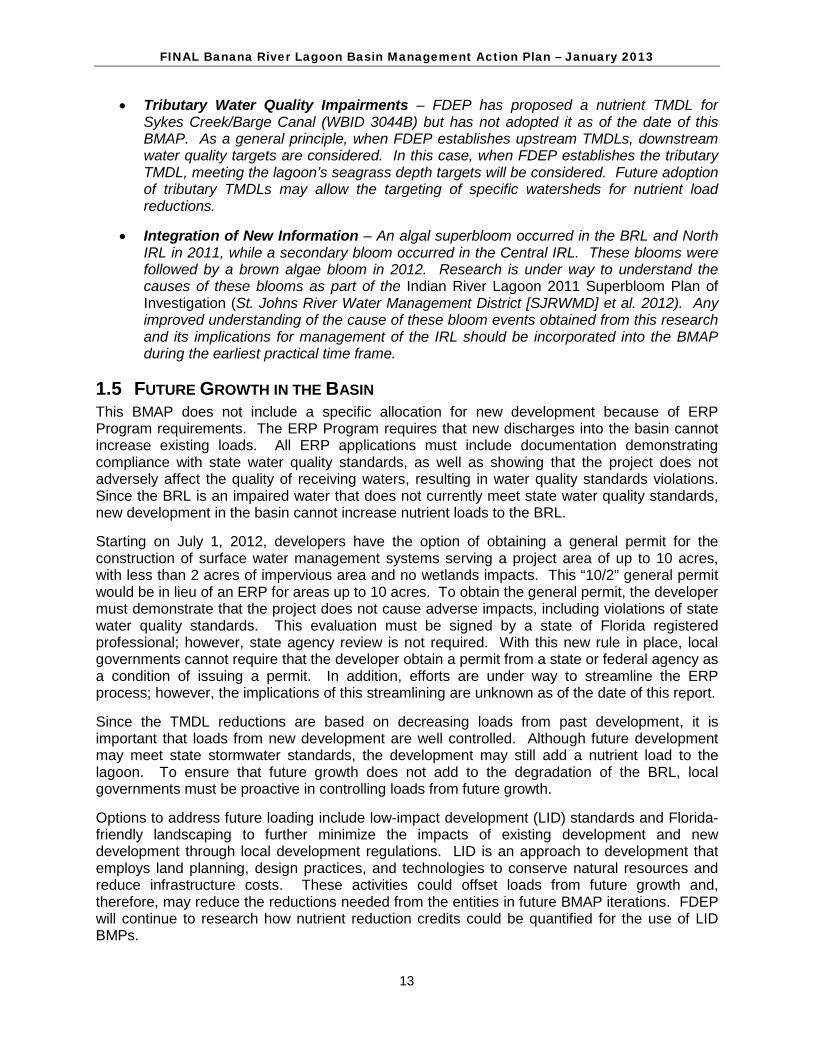
• Tributary Water Quality Impairments – FDEP has proposed a nutrient TMDL for Sykes Creek/Barge Canal (WBID 3044B) but has not adopted it as of the date of this BMAP. As a general principle, when FDEP establishes upstream TMDLs, downstream water quality targets are considered. In this case, when FDEP establishes the tributary TMDL, meeting the lagoon’s seagrass depth targets will be considered. Future adoption of tributary TMDLs may allow the targeting of specific watersheds for nutrient load reductions.
• Integration of New Information – An algal superbloom occurred in the BRL and North IRL in 2011, while a secondary bloom occurred in the Central IRL. These blooms were followed by a brown algae bloom in 2012. Research is under way to understand the causes of these blooms as part of the Indian River Lagoon 2011 Superbloom Plan of Investigation (St. Johns River Water Management District [SJRWMD] et al. 2012). Any improved understanding of the cause of these bloom events obtained from this research and its implications for management of the IRL should be incorporated into the BMAP during the earliest practical time frame.
1.5 FUTURE GROWTH IN THE BASIN This BMAP does not include a specific allocation for new development because of ERP Program requirements. The ERP Program requires that new discharges into the basin cannot increase existing loads. All ERP applications must include documentation demonstrating compliance with state water quality standards, as well as showing that the project does not adversely affect the quality of receiving waters, resulting in water quality standards violations. Since the BRL is an impaired water that does not currently meet state water quality standards, new development in the basin cannot increase nutrient loads to the BRL.
Starting on July 1, 2012, developers have the option of obtaining a general permit for the construction of surface water management systems serving a project area of up to 10 acres, with less than 2 acres of impervious area and no wetlands impacts. This “10/2” general permit would be in lieu of an ERP for areas up to 10 acres. To obtain the general permit, the developer must demonstrate that the project does not cause adverse impacts, including violations of state water quality standards. This evaluation must be signed by a state of Florida registered professional; however, state agency review is not required. With this new rule in place, local governments cannot require that the developer obtain a permit from a state or federal agency as a condition of issuing a permit. In addition, efforts are under way to streamline the ERP process; however, the implications of this streamlining are unknown as of the date of this report.
Since the TMDL reductions are based on decreasing loads from past development, it is important that loads from new development are well controlled. Although future development may meet state stormwater standards, the development may still add a nutrient load to the lagoon. To ensure that future growth does not add to the degradation of the BRL, local governments must be proactive in controlling loads from future growth.
Options to address future loading include low-impact development (LID) standards and Florida-friendly landscaping to further minimize the impacts of existing development and new development through local development regulations. LID is an approach to development that employs land planning, design practices, and technologies to conserve natural resources and reduce infrastructure costs. These activities could offset loads from future growth and, therefore, may reduce the reductions needed from the entities in future BMAP iterations. FDEP will continue to research how nutrient reduction credits could be quantified for the use of LID BMPs.
FINAL Banana River Lagoon Basin Management Action Plan – January 2013
14
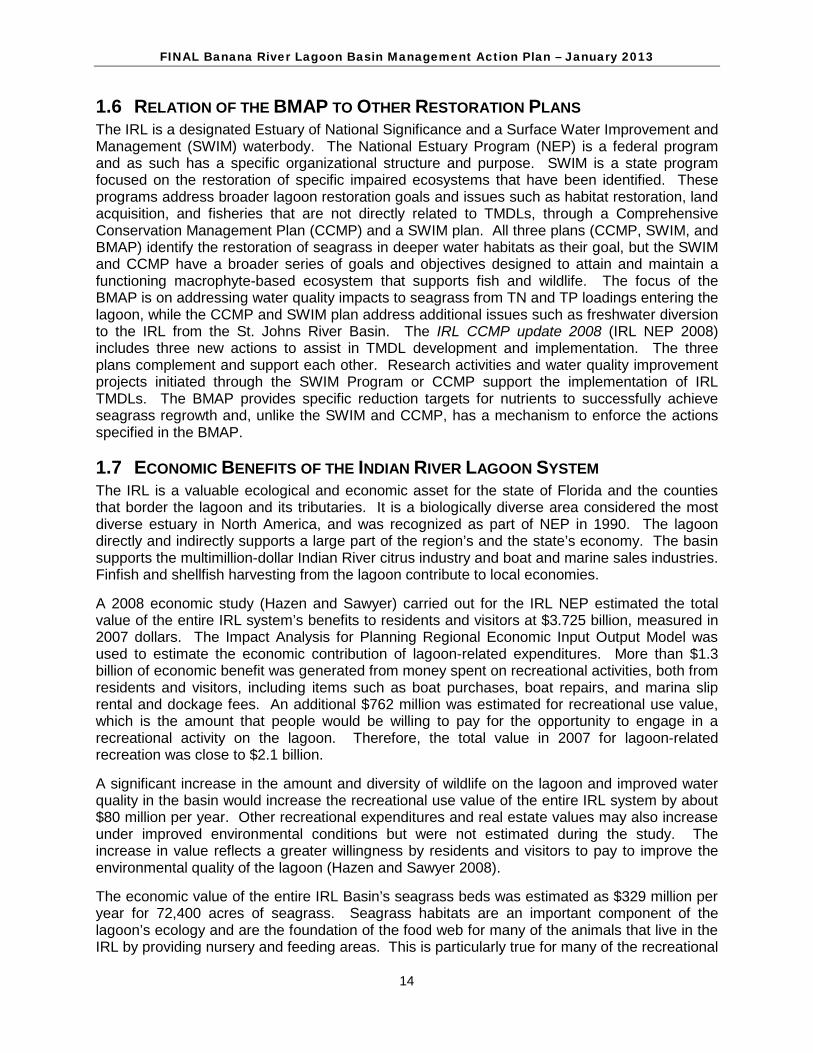
1.6 RELATION OF THE BMAP TO OTHER RESTORATION PLANS The IRL is a designated Estuary of National Significance and a Surface Water Improvement and Management (SWIM) waterbody. The National Estuary Program (NEP) is a federal program and as such has a specific organizational structure and purpose. SWIM is a state program focused on the restoration of specific impaired ecosystems that have been identified. These programs address broader lagoon restoration goals and issues such as habitat restoration, land acquisition, and fisheries that are not directly related to TMDLs, through a Comprehensive Conservation Management Plan (CCMP) and a SWIM plan. All three plans (CCMP, SWIM, and BMAP) identify the restoration of seagrass in deeper water habitats as their goal, but the SWIM and CCMP have a broader series of goals and objectives designed to attain and maintain a functioning macrophyte-based ecosystem that supports fish and wildlife. The focus of the BMAP is on addressing water quality impacts to seagrass from TN and TP loadings entering the lagoon, while the CCMP and SWIM plan address additional issues such as freshwater diversion to the IRL from the St. Johns River Basin. The IRL CCMP update 2008 (IRL NEP 2008) includes three new actions to assist in TMDL development and implementation. The three plans complement and support each other. Research activities and water quality improvement projects initiated through the SWIM Program or CCMP support the implementation of IRL TMDLs. The BMAP provides specific reduction targets for nutrients to successfully achieve seagrass regrowth and, unlike the SWIM and CCMP, has a mechanism to enforce the actions specified in the BMAP.
1.7 ECONOMIC BENEFITS OF THE INDIAN RIVER LAGOON SYSTEM The IRL is a valuable ecological and economic asset for the state of Florida and the counties that border the lagoon and its tributaries. It is a biologically diverse area considered the most diverse estuary in North America, and was recognized as part of NEP in 1990. The lagoon directly and indirectly supports a large part of the region’s and the state’s economy. The basin supports the multimillion-dollar Indian River citrus industry and boat and marine sales industries. Finfish and shellfish harvesting from the lagoon contribute to local economies.
A 2008 economic study (Hazen and Sawyer) carried out for the IRL NEP estimated the total value of the entire IRL system’s benefits to residents and visitors at $3.725 billion, measured in 2007 dollars. The Impact Analysis for Planning Regional Economic Input Output Model was used to estimate the economic contribution of lagoon-related expenditures. More than $1.3 billion of economic benefit was generated from money spent on recreational activities, both from residents and visitors, including items such as boat purchases, boat repairs, and marina slip rental and dockage fees. An additional $762 million was estimated for recreational use value, which is the amount that people would be willing to pay for the opportunity to engage in a recreational activity on the lagoon. Therefore, the total value in 2007 for lagoon-related recreation was close to $2.1 billion.
A significant increase in the amount and diversity of wildlife on the lagoon and improved water quality in the basin would increase the recreational use value of the entire IRL system by about $80 million per year. Other recreational expenditures and real estate values may also increase under improved environmental conditions but were not estimated during the study. The increase in value reflects a greater willingness by residents and visitors to pay to improve the environmental quality of the lagoon (Hazen and Sawyer 2008).
The economic value of the entire IRL Basin’s seagrass beds was estimated as $329 million per year for 72,400 acres of seagrass. Seagrass habitats are an important component of the lagoon’s ecology and are the foundation of the food web for many of the animals that live in the IRL by providing nursery and feeding areas. This is particularly true for many of the recreational

FINAL Banana River Lagoon Basin Management Action Plan – January 2013
15
and commercial fish species. Seagrass may provide additional economic value related to water quality and aesthetics (Hazen and Sawyer 2008). Therefore, investing in projects and programs to improve the lagoon’s water quality and seagrass beds is not only important for environmental considerations but also to improve the economy.
FINAL Banana River Lagoon Basin Management Action Plan – January 2013
16
CHAPTER 2: BANANA RIVER LAGOON BASIN SETTING
Understanding the conditions in a basin is an important component in identifying an appropriate restoration and management plan. This chapter describes the hydrology, land uses, and the results of seagrass evaluation in the Banana River Lagoon (BRL) subbasin.
2.1 BASIN HYDROLOGY The BRL lies between Merritt Island and the coastal barrier island, and extends in a north-south direction from Banana Creek south to the Eau Gallie Causeway. Sykes Creek and Newfound Harbor are the primary tributaries to the Banana River (FDEP 2008). Freshwater inflows to the lagoon come from direct overland runoff, drainage canals, ground water seepage, and rainfall directly onto the surface. Circulation in the BRL is influenced by winds and tidal exchange via a direct connection to the IRL. The BRL system is shallow, with an average depth of 2 meters, and poorly flushed, with an estimated 2 years for a complete flush. The high evaporation and limited freshwater inputs contribute to higher salinity levels in the BRL than in the southern portions of the IRL (FDEP 2009). In addition, the lagoon may operate as a negative estuary during the period of net evaporation loss. In this case, a net flow of ocean water into the BRL equalizes the water budget balance, which has major effects on the circulation, flushing rates, and capability of the BRL to assimilate nutrient loads (Woodward-Clyde Consultants 1994).
Over time, the hydrology of the BRL has been modified, including ditching, draining, and the impoundment of marshes. These modifications include the loss of over 40,000 acres of wetlands.
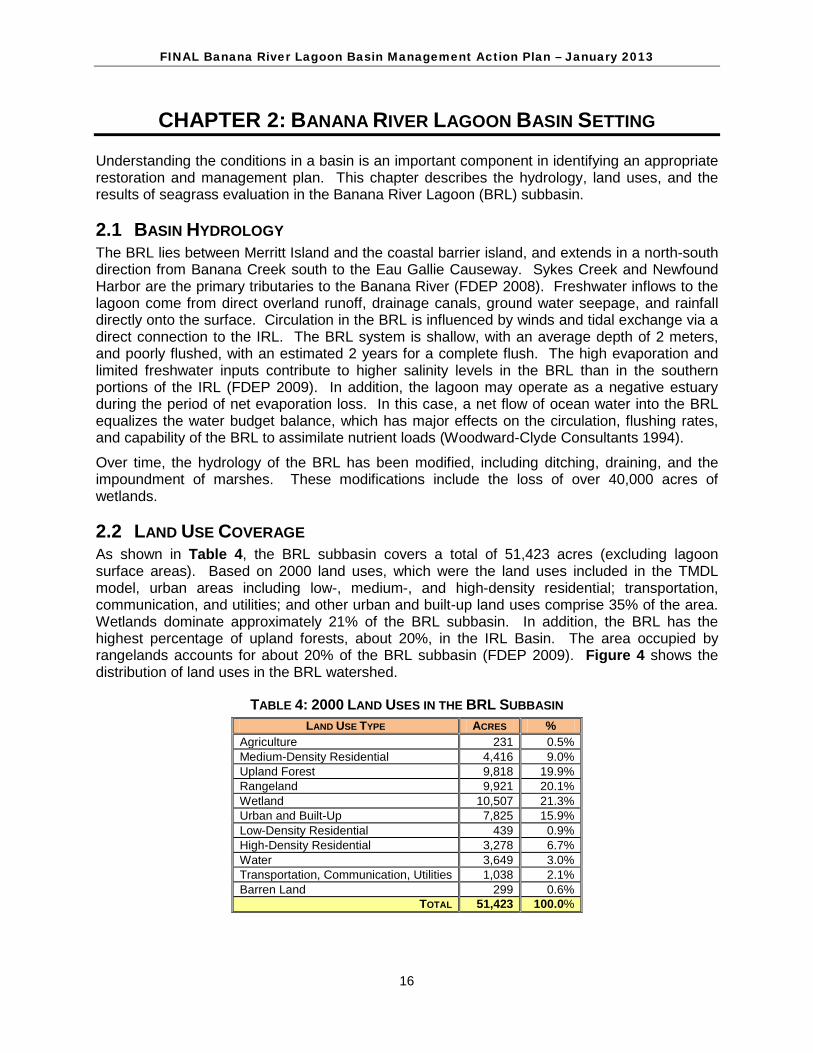
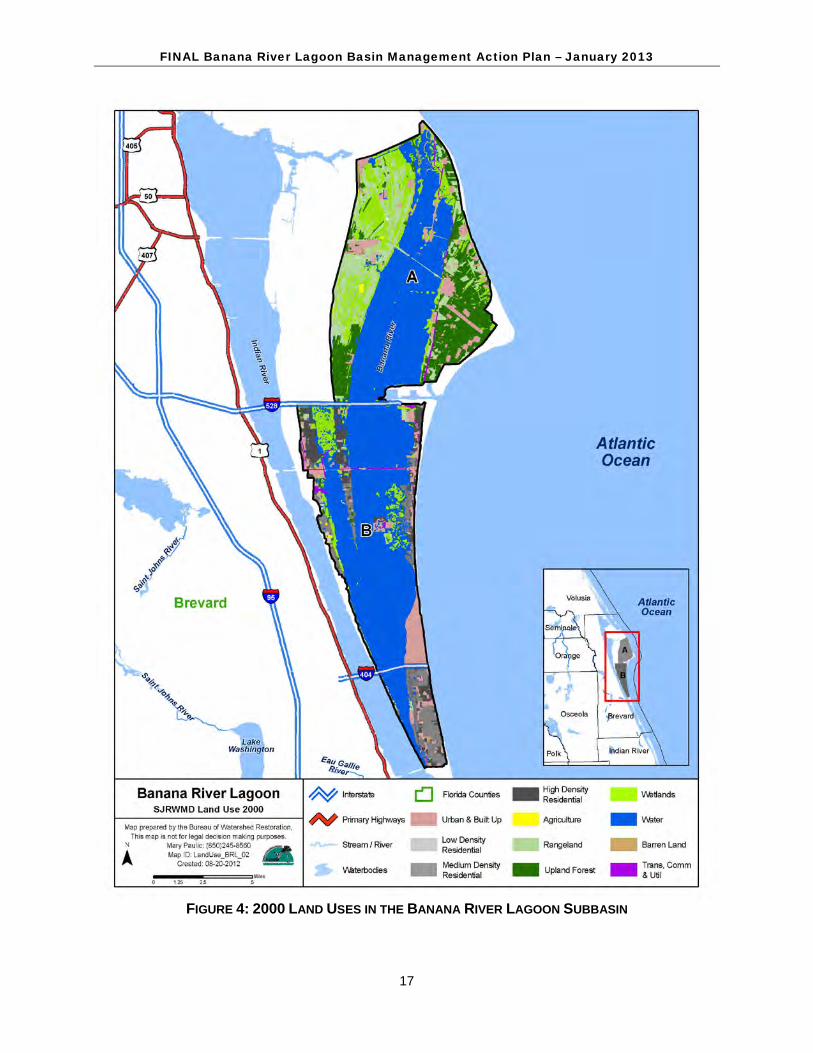
2.2 LAND USE COVERAGE As shown in Table 4, the BRL subbasin covers a total of 51,423 acres (excluding lagoon surface areas). Based on 2000 land uses, which were the land uses included in the TMDL model, urban areas including low-, medium-, and high-density residential; transportation, communication, and utilities; and other urban and built-up land uses comprise 35% of the area. Wetlands dominate approximately 21% of the BRL subbasin. In addition, the BRL has the highest percentage of upland forests, about 20%, in the IRL Basin. The area occupied by rangelands accounts for about 20% of the BRL subbasin (FDEP 2009). Figure 4 shows the distribution of land uses in the BRL watershed.
TABLE 4: 2000 LAND USES IN THE BRL SUBBASIN LAND USE TYPE ACRES %
Agriculture 231 0.5% Medium-Density Residential 4,416 9.0% Upland Forest 9,818 19.9% Rangeland 9,921 20.1% Wetland 10,507 21.3% Urban and Built-Up 7,825 15.9% Low-Density Residential 439 0.9% High-Density Residential 3,278 6.7% Water 3,649 3.0% Transportation, Communication, Utilities 1,038 2.1% Barren Land 299 0.6%
TOTAL 51,423 100.0%
FINAL Banana River Lagoon Basin Management Action Plan – January 2013
17
FIGURE 4: 2000 LAND USES IN THE BANANA RIVER LAGOON SUBBASIN
FINAL Banana River Lagoon Basin Management Action Plan – January 2013
18
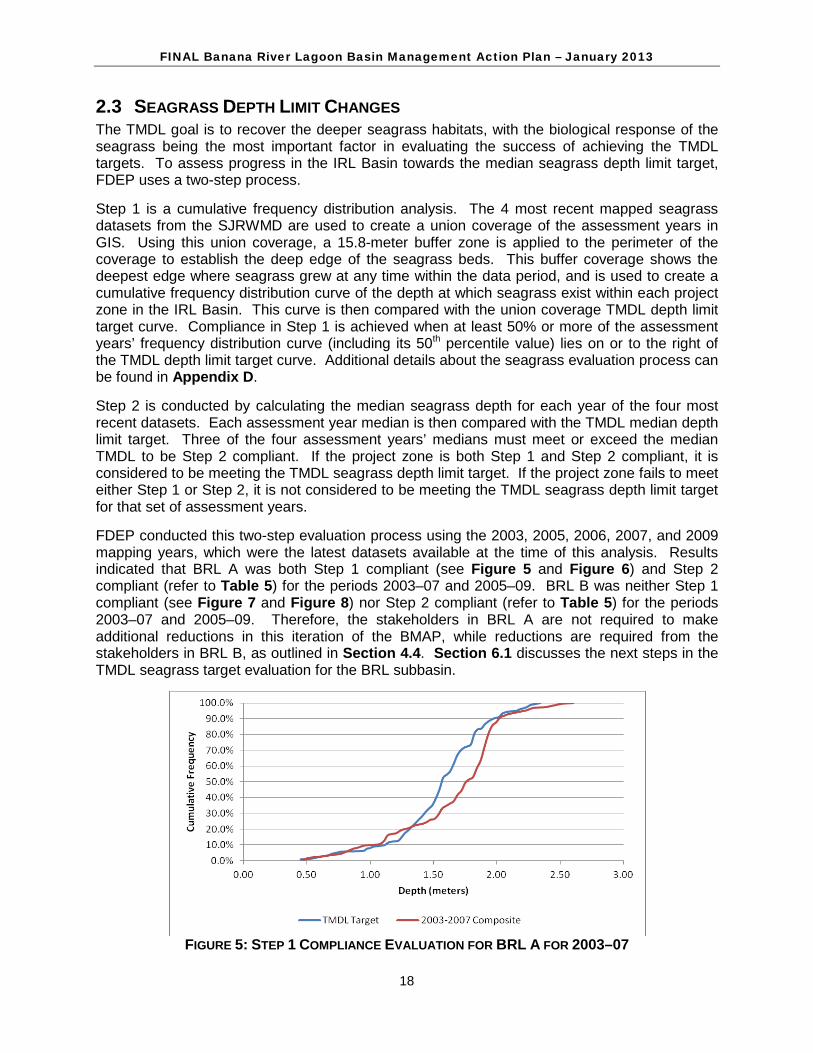
2.3 SEAGRASS DEPTH LIMIT CHANGES The TMDL goal is to recover the deeper seagrass habitats, with the biological response of the seagrass being the most important factor in evaluating the success of achieving the TMDL targets. To assess progress in the IRL Basin towards the median seagrass depth limit target, FDEP uses a two-step process.
Step 1 is a cumulative frequency distribution analysis. The 4 most recent mapped seagrass datasets from the SJRWMD are used to create a union coverage of the assessment years in GIS. Using this union coverage, a 15.8-meter buffer zone is applied to the perimeter of the coverage to establish the deep edge of the seagrass beds. This buffer coverage shows the deepest edge where seagrass grew at any time within the data period, and is used to create a cumulative frequency distribution curve of the depth at which seagrass exist within each project zone in the IRL Basin. This curve is then compared with the union coverage TMDL depth limit target curve. Compliance in Step 1 is achieved when at least 50% or more of the assessment years’ frequency distribution curve (including its 50th percentile value) lies on or to the right of the TMDL depth limit target curve. Additional details about the seagrass evaluation process can be found in Appendix D.
Step 2 is conducted by calculating the median seagrass depth for each year of the four most recent datasets. Each assessment year median is then compared with the TMDL median depth limit target. Three of the four assessment years’ medians must meet or exceed the median TMDL to be Step 2 compliant. If the project zone is both Step 1 and Step 2 compliant, it is considered to be meeting the TMDL seagrass depth limit target. If the project zone fails to meet either Step 1 or Step 2, it is not considered to be meeting the TMDL seagrass depth limit target for that set of assessment years.
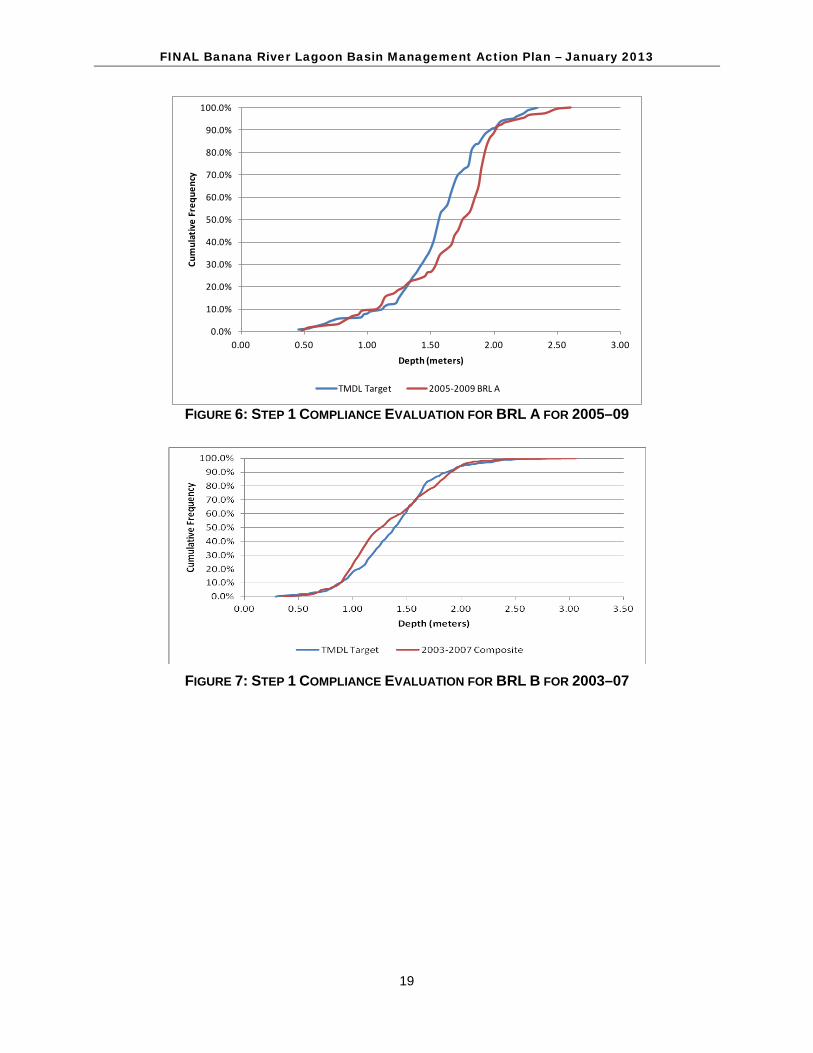
FDEP conducted this two-step evaluation process using the 2003, 2005, 2006, 2007, and 2009 mapping years, which were the latest datasets available at the time of this analysis. Results indicated that BRL A was both Step 1 compliant (see Figure 5 and Figure 6) and Step 2 compliant (refer to Table 5) for the periods 2003–07 and 2005–09. BRL B was neither Step 1 compliant (see Figure 7 and Figure 8) nor Step 2 compliant (refer to Table 5) for the periods 2003–07 and 2005–09. Therefore, the stakeholders in BRL A are not required to make additional reductions in this iteration of the BMAP, while reductions are required from the stakeholders in BRL B, as outlined in Section 4.4. Section 6.1 discusses the next steps in the TMDL seagrass target evaluation for the BRL subbasin.
FIGURE 5: STEP 1 COMPLIANCE EVALUATION FOR BRL A FOR 2003–07
FINAL Banana River Lagoon Basin Management Action Plan – January 2013
19
0.0%
10.0%
20.0%
30.0%
40.0%
50.0%
60.0%
70.0%
80.0%
90.0%
100.0%
0.00 0.50 1.00 1.50 2.00 2.50 3.00
Cum
ulat
ive
Freq
uenc
y
Depth (meters)
TMDL Target 2005-2009 BRL A
FIGURE 6: STEP 1 COMPLIANCE EVALUATION FOR BRL A FOR 2005–09
FIGURE 7: STEP 1 COMPLIANCE EVALUATION FOR BRL B FOR 2003–07
FINAL Banana River Lagoon Basin Management Action Plan – January 2013
20
0.0%
10.0%
20.0%
30.0%
40.0%
50.0%
60.0%
70.0%
80.0%
90.0%
100.0%
0.00 0.50 1.00 1.50 2.00 2.50 3.00 3.50
Cum
ulat
ive
Freq
uenc
y
Depth (meters)
TMDL Target 2005-2009 BRL B
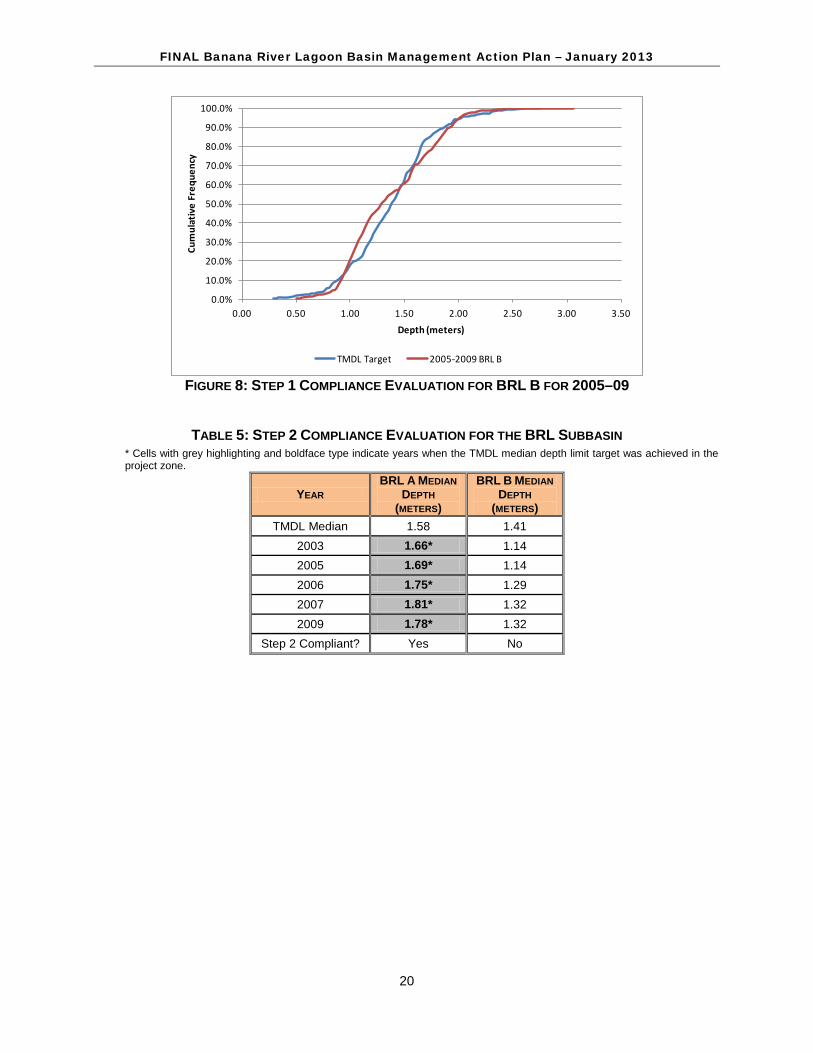
FIGURE 8: STEP 1 COMPLIANCE EVALUATION FOR BRL B FOR 2005–09
TABLE 5: STEP 2 COMPLIANCE EVALUATION FOR THE BRL SUBBASIN * Cells with grey highlighting and boldface type indicate years when the TMDL median depth limit target was achieved in the project zone.
YEAR BRL A MEDIAN
DEPTH (METERS)
BRL B MEDIAN DEPTH
(METERS) TMDL Median 1.58 1.41
2003 1.66* 1.14 2005 1.69* 1.14 2006 1.75* 1.29 2007 1.81* 1.32 2009 1.78* 1.32
Step 2 Compliant? Yes No
FINAL Banana River Lagoon Basin Management Action Plan – January 2013
21
CHAPTER 3: POLLUTANT SOURCES AND ANTICIPATED OUTCOMES
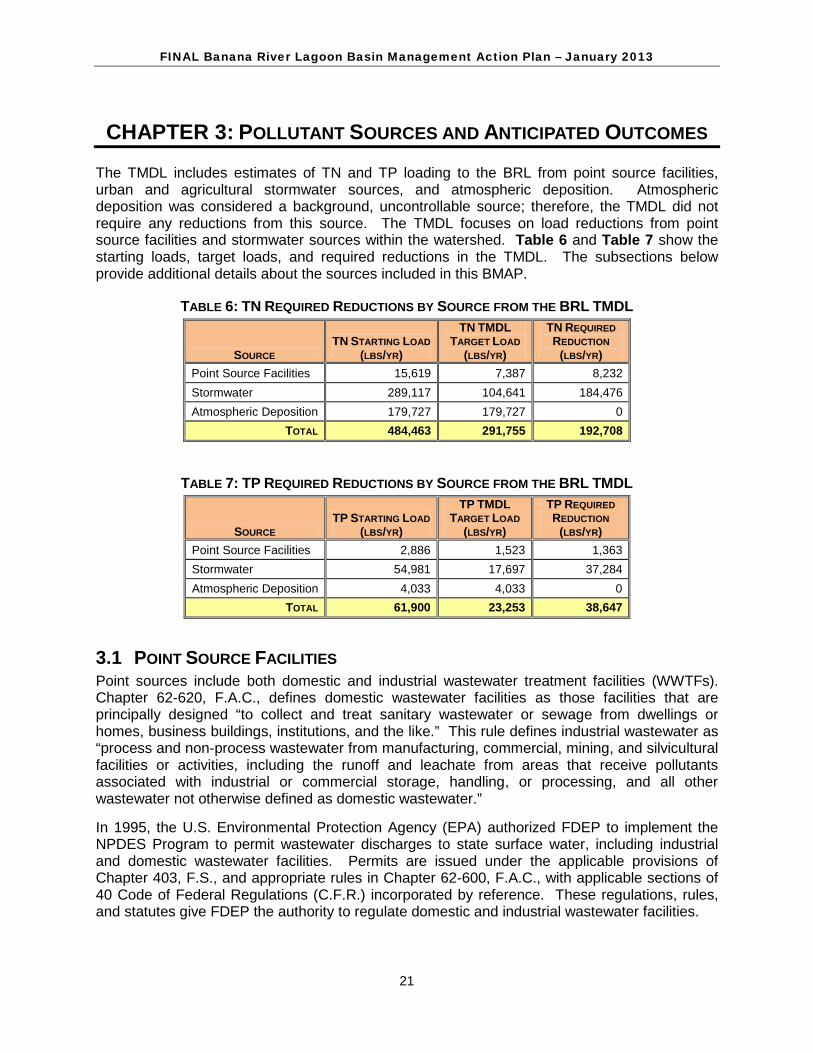
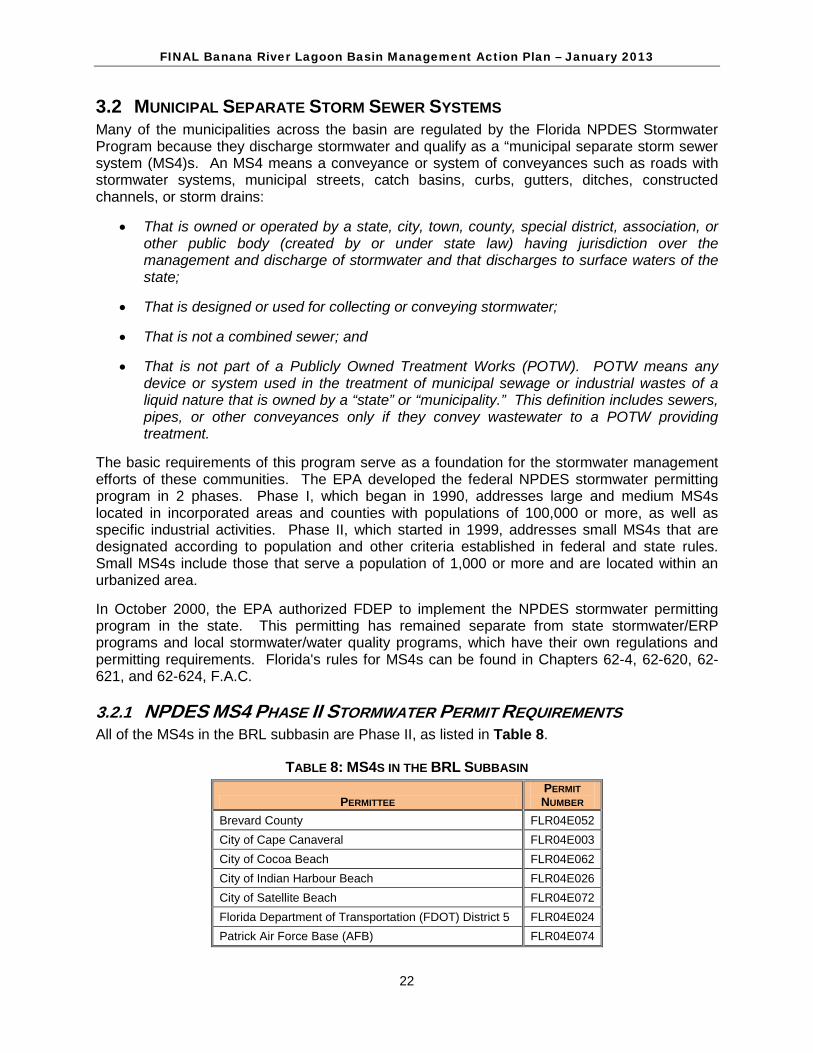
The TMDL includes estimates of TN and TP loading to the BRL from point source facilities, urban and agricultural stormwater sources, and atmospheric deposition. Atmospheric deposition was considered a background, uncontrollable source; therefore, the TMDL did not require any reductions from this source. The TMDL focuses on load reductions from point source facilities and stormwater sources within the watershed. Table 6 and Table 7 show the starting loads, target loads, and required reductions in the TMDL. The subsections below provide additional details about the sources included in this BMAP.
TABLE 6: TN REQUIRED REDUCTIONS BY SOURCE FROM THE BRL TMDL
SOURCE TN STARTING LOAD
(LBS/YR)
TN TMDL TARGET LOAD
(LBS/YR)
TN REQUIRED REDUCTION
(LBS/YR) Point Source Facilities 15,619 7,387 8,232 Stormwater 289,117 104,641 184,476 Atmospheric Deposition 179,727 179,727 0
TOTAL 484,463 291,755 192,708
TABLE 7: TP REQUIRED REDUCTIONS BY SOURCE FROM THE BRL TMDL
SOURCE TP STARTING LOAD
(LBS/YR)
TP TMDL TARGET LOAD
(LBS/YR)
TP REQUIRED REDUCTION
(LBS/YR) Point Source Facilities 2,886 1,523 1,363 Stormwater 54,981 17,697 37,284 Atmospheric Deposition 4,033 4,033 0
TOTAL 61,900 23,253 38,647
3.1 POINT SOURCE FACILITIES Point sources include both domestic and industrial wastewater treatment facilities (WWTFs). Chapter 62-620, F.A.C., defines domestic wastewater facilities as those facilities that are principally designed “to collect and treat sanitary wastewater or sewage from dwellings or homes, business buildings, institutions, and the like.” This rule defines industrial wastewater as “process and non-process wastewater from manufacturing, commercial, mining, and silvicultural facilities or activities, including the runoff and leachate from areas that receive pollutants associated with industrial or commercial storage, handling, or processing, and all other wastewater not otherwise defined as domestic wastewater.”
In 1995, the U.S. Environmental Protection Agency (EPA) authorized FDEP to implement the NPDES Program to permit wastewater discharges to state surface water, including industrial and domestic wastewater facilities. Permits are issued under the applicable provisions of Chapter 403, F.S., and appropriate rules in Chapter 62-600, F.A.C., with applicable sections of 40 Code of Federal Regulations (C.F.R.) incorporated by reference. These regulations, rules, and statutes give FDEP the authority to regulate domestic and industrial wastewater facilities.
FINAL Banana River Lagoon Basin Management Action Plan – January 2013
22
3.2 MUNICIPAL SEPARATE STORM SEWER SYSTEMS Many of the municipalities across the basin are regulated by the Florida NPDES Stormwater Program because they discharge stormwater and qualify as a “municipal separate storm sewer system (MS4)s. An MS4 means a conveyance or system of conveyances such as roads with stormwater systems, municipal streets, catch basins, curbs, gutters, ditches, constructed channels, or storm drains:
• That is owned or operated by a state, city, town, county, special district, association, or other public body (created by or under state law) having jurisdiction over the management and discharge of stormwater and that discharges to surface waters of the state;
• That is designed or used for collecting or conveying stormwater;
• That is not a combined sewer; and
• That is not part of a Publicly Owned Treatment Works (POTW). POTW means any device or system used in the treatment of municipal sewage or industrial wastes of a liquid nature that is owned by a “state” or “municipality.” This definition includes sewers, pipes, or other conveyances only if they convey wastewater to a POTW providing treatment.
The basic requirements of this program serve as a foundation for the stormwater management efforts of these communities. The EPA developed the federal NPDES stormwater permitting program in 2 phases. Phase I, which began in 1990, addresses large and medium MS4s located in incorporated areas and counties with populations of 100,000 or more, as well as specific industrial activities. Phase II, which started in 1999, addresses small MS4s that are designated according to population and other criteria established in federal and state rules. Small MS4s include those that serve a population of 1,000 or more and are located within an urbanized area.
In October 2000, the EPA authorized FDEP to implement the NPDES stormwater permitting program in the state. This permitting has remained separate from state stormwater/ERP programs and local stormwater/water quality programs, which have their own regulations and permitting requirements. Florida's rules for MS4s can be found in Chapters 62-4, 62-620, 62-621, and 62-624, F.A.C.
3.2.1 NPDES MS4 PHASE II STORMWATER PERMIT REQUIREMENTS All of the MS4s in the BRL subbasin are Phase II, as listed in Table 8.
TABLE 8: MS4S IN THE BRL SUBBASIN
PERMITTEE PERMIT NUMBER
Brevard County FLR04E052 City of Cape Canaveral FLR04E003 City of Cocoa Beach FLR04E062 City of Indian Harbour Beach FLR04E026 City of Satellite Beach FLR04E072 Florida Department of Transportation (FDOT) District 5 FLR04E024 Patrick Air Force Base (AFB) FLR04E074
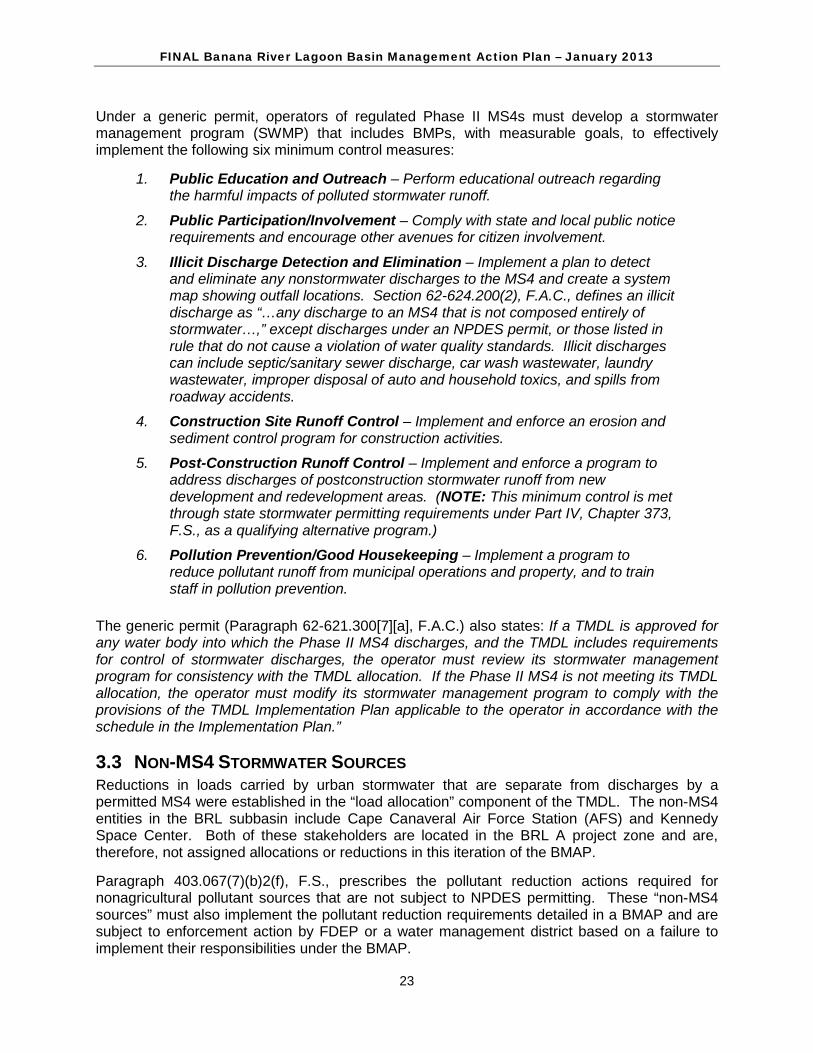
FINAL Banana River Lagoon Basin Management Action Plan – January 2013
23
Under a generic permit, operators of regulated Phase II MS4s must develop a stormwater management program (SWMP) that includes BMPs, with measurable goals, to effectively implement the following six minimum control measures:
1. Public Education and Outreach – Perform educational outreach regarding the harmful impacts of polluted stormwater runoff.
2. Public Participation/Involvement – Comply with state and local public notice requirements and encourage other avenues for citizen involvement.
3. Illicit Discharge Detection and Elimination – Implement a plan to detect and eliminate any nonstormwater discharges to the MS4 and create a system map showing outfall locations. Section 62-624.200(2), F.A.C., defines an illicit discharge as “…any discharge to an MS4 that is not composed entirely of stormwater…,” except discharges under an NPDES permit, or those listed in rule that do not cause a violation of water quality standards. Illicit discharges can include septic/sanitary sewer discharge, car wash wastewater, laundry wastewater, improper disposal of auto and household toxics, and spills from roadway accidents.
4. Construction Site Runoff Control – Implement and enforce an erosion and sediment control program for construction activities.
5. Post-Construction Runoff Control – Implement and enforce a program to address discharges of postconstruction stormwater runoff from new development and redevelopment areas. (NOTE: This minimum control is met through state stormwater permitting requirements under Part IV, Chapter 373, F.S., as a qualifying alternative program.)
6. Pollution Prevention/Good Housekeeping – Implement a program to reduce pollutant runoff from municipal operations and property, and to train staff in pollution prevention.
The generic permit (Paragraph 62-621.300[7][a], F.A.C.) also states: If a TMDL is approved for any water body into which the Phase II MS4 discharges, and the TMDL includes requirements for control of stormwater discharges, the operator must review its stormwater management program for consistency with the TMDL allocation. If the Phase II MS4 is not meeting its TMDL allocation, the operator must modify its stormwater management program to comply with the provisions of the TMDL Implementation Plan applicable to the operator in accordance with the schedule in the Implementation Plan.”
3.3 NON-MS4 STORMWATER SOURCES Reductions in loads carried by urban stormwater that are separate from discharges by a permitted MS4 were established in the “load allocation” component of the TMDL. The non-MS4 entities in the BRL subbasin include Cape Canaveral Air Force Station (AFS) and Kennedy Space Center. Both of these stakeholders are located in the BRL A project zone and are, therefore, not assigned allocations or reductions in this iteration of the BMAP.
Paragraph 403.067(7)(b)2(f), F.S., prescribes the pollutant reduction actions required for nonagricultural pollutant sources that are not subject to NPDES permitting. These “non-MS4 sources” must also implement the pollutant reduction requirements detailed in a BMAP and are subject to enforcement action by FDEP or a water management district based on a failure to implement their responsibilities under the BMAP.
FINAL Banana River Lagoon Basin Management Action Plan – January 2013
24
Load reductions, and the responsibility for meeting them, were assigned to the entity that governs and permitted development on these non-MS4 urban lands. Failure to reduce these loadings can result in enforcement action by FDEP pursuant to Paragraph 403.067(7)(b)2(h), F.S.
FDEP can designate an entity as a regulated Phase II MS4 if its discharges are determined to be a significant contributor of pollutants to surface waters of the state in accordance with Rule Section 62-624.800, F.A.C. The designation of an entity as a Phase II MS4 can occur when a TMDL has been adopted for a waterbody or segment into which the entity discharges the pollutant(s) of concern. If an entity is designated as a regulated Phase II MS4, it will be subject to the conditions of the Phase II MS4 Generic Permit.
3.4 AGRICULTURE The primary agricultural land use in the BRL subbasin when the land use data were collected was citrus. However, due to urban encroachment, citrus health issues (freeze/disease), and the economic downturn, the operations identified as agriculture in the land use data have been either converted to urban land uses or abandoned. A review of the most recent aerial imagery shows a significant conversion to urban uses, as well as a few small abandoned/out-of-production citrus groves. Because of this, agriculture is considered de minimus in the BRL (refer to Section 4.2). If any active commercial agricultural operations are identified, the Florida Department of Agriculture and Consumer Services (FDACS) field staff and/or local contractors will attempt to enroll them in the appropriate BMP program(s).
3.5 ANTICIPATED OUTCOMES OF BMAP IMPLEMENTATION With the implementation of the projects outlined in this BMAP, reductions in the TN and TP loads to the BRL are expected to improve water quality conditions and seagrass depths. The following outcomes are expected from BMAP implementation:
• Improved water quality trends in the BRL that will help to improve seagrass depth limits;
• Decreased loading of the target pollutants (TN and TP);
• Decreased TSS loading from some of the projects implemented to reduce TN and TP loads;
• Increased coordination between state and local governments and within divisions of local governments when problem solving for surface water quality restoration;
• Additional state and local funding secured for water quality restoration;
• Improved identification of effective projects through the stakeholder decision-making and priority-setting processes;
• Enhanced public awareness of pollutant sources, pollutant impacts on water quality, and corresponding corrective actions; and
• Enhanced understanding of basin hydrology, water quality, and pollutant sources.
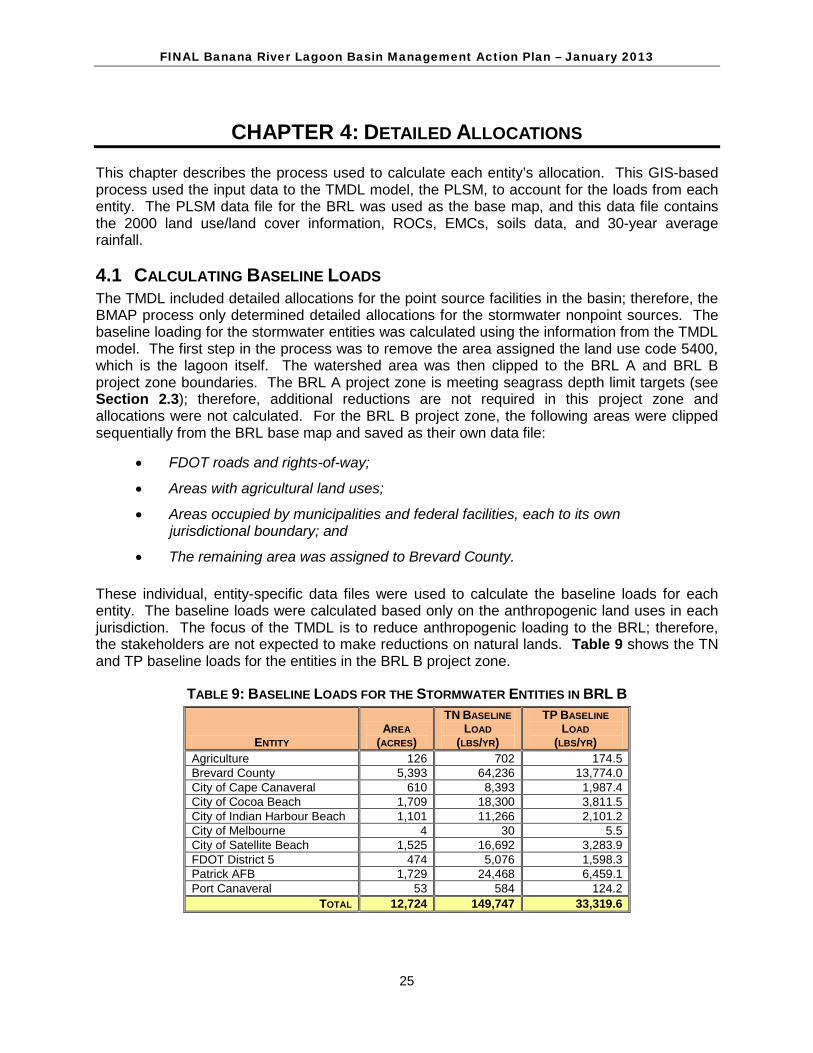
FINAL Banana River Lagoon Basin Management Action Plan – January 2013
25
CHAPTER 4: DETAILED ALLOCATIONS
This chapter describes the process used to calculate each entity’s allocation. This GIS-based process used the input data to the TMDL model, the PLSM, to account for the loads from each entity. The PLSM data file for the BRL was used as the base map, and this data file contains the 2000 land use/land cover information, ROCs, EMCs, soils data, and 30-year average rainfall.
4.1 CALCULATING BASELINE LOADS The TMDL included detailed allocations for the point source facilities in the basin; therefore, the BMAP process only determined detailed allocations for the stormwater nonpoint sources. The baseline loading for the stormwater entities was calculated using the information from the TMDL model. The first step in the process was to remove the area assigned the land use code 5400, which is the lagoon itself. The watershed area was then clipped to the BRL A and BRL B project zone boundaries. The BRL A project zone is meeting seagrass depth limit targets (see Section 2.3); therefore, additional reductions are not required in this project zone and allocations were not calculated. For the BRL B project zone, the following areas were clipped sequentially from the BRL base map and saved as their own data file:
• FDOT roads and rights-of-way;
• Areas with agricultural land uses;
• Areas occupied by municipalities and federal facilities, each to its own jurisdictional boundary; and
• The remaining area was assigned to Brevard County. These individual, entity-specific data files were used to calculate the baseline loads for each entity. The baseline loads were calculated based only on the anthropogenic land uses in each jurisdiction. The focus of the TMDL is to reduce anthropogenic loading to the BRL; therefore, the stakeholders are not expected to make reductions on natural lands. Table 9 shows the TN and TP baseline loads for the entities in the BRL B project zone.
TABLE 9: BASELINE LOADS FOR THE STORMWATER ENTITIES IN BRL B
ENTITY AREA
(ACRES)
TN BASELINE LOAD
(LBS/YR)
TP BASELINE LOAD
(LBS/YR) Agriculture 126 702 174.5 Brevard County 5,393 64,236 13,774.0 City of Cape Canaveral 610 8,393 1,987.4 City of Cocoa Beach 1,709 18,300 3,811.5 City of Indian Harbour Beach 1,101 11,266 2,101.2 City of Melbourne 4 30 5.5 City of Satellite Beach 1,525 16,692 3,283.9 FDOT District 5 474 5,076 1,598.3 Patrick AFB 1,729 24,468 6,459.1 Port Canaveral 53 584 124.2
TOTAL 12,724 149,747 33,319.6
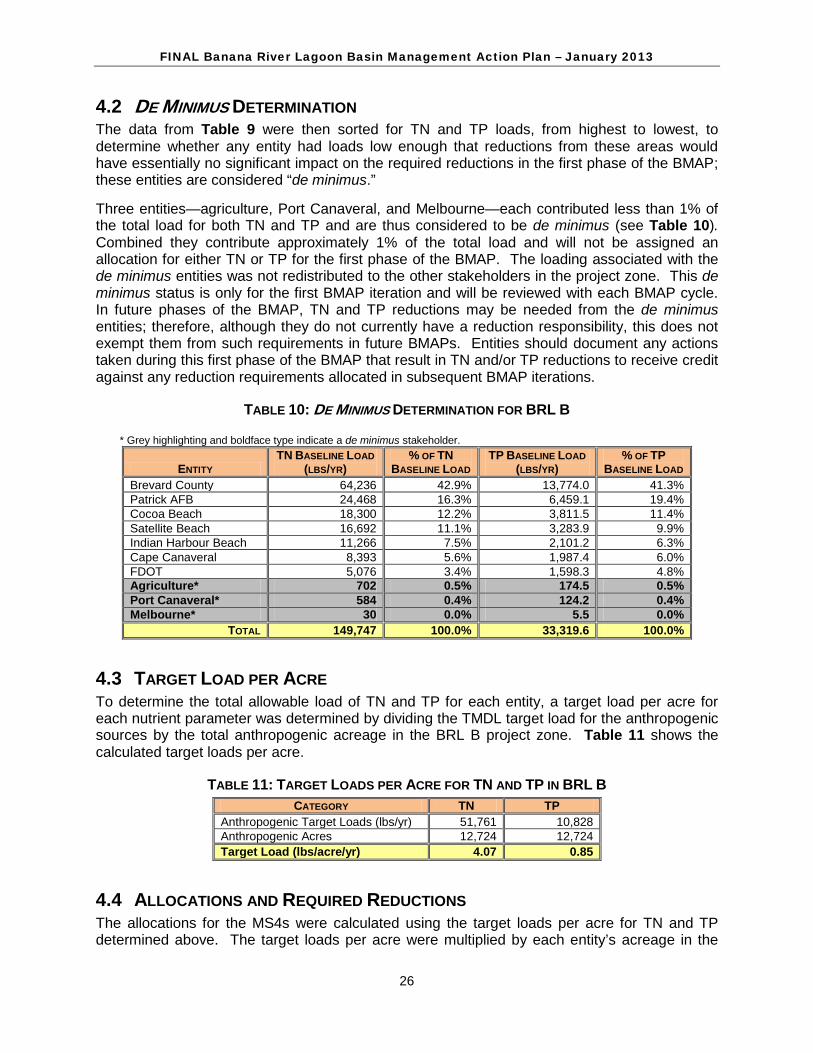
FINAL Banana River Lagoon Basin Management Action Plan – January 2013
26
4.2 DE MINIMUS DETERMINATION The data from Table 9 were then sorted for TN and TP loads, from highest to lowest, to determine whether any entity had loads low enough that reductions from these areas would have essentially no significant impact on the required reductions in the first phase of the BMAP; these entities are considered “de minimus.”
Three entities—agriculture, Port Canaveral, and Melbourne—each contributed less than 1% of the total load for both TN and TP and are thus considered to be de minimus (see Table 10). Combined they contribute approximately 1% of the total load and will not be assigned an allocation for either TN or TP for the first phase of the BMAP. The loading associated with the de minimus entities was not redistributed to the other stakeholders in the project zone. This de minimus status is only for the first BMAP iteration and will be reviewed with each BMAP cycle. In future phases of the BMAP, TN and TP reductions may be needed from the de minimus entities; therefore, although they do not currently have a reduction responsibility, this does not exempt them from such requirements in future BMAPs. Entities should document any actions taken during this first phase of the BMAP that result in TN and/or TP reductions to receive credit against any reduction requirements allocated in subsequent BMAP iterations.
TABLE 10: DE MINIMUS DETERMINATION FOR BRL B
* Grey highlighting and boldface type indicate a de minimus stakeholder.
ENTITY TN BASELINE LOAD
(LBS/YR) % OF TN
BASELINE LOAD TP BASELINE LOAD
(LBS/YR) % OF TP
BASELINE LOAD Brevard County 64,236 42.9% 13,774.0 41.3% Patrick AFB 24,468 16.3% 6,459.1 19.4% Cocoa Beach 18,300 12.2% 3,811.5 11.4% Satellite Beach 16,692 11.1% 3,283.9 9.9% Indian Harbour Beach 11,266 7.5% 2,101.2 6.3% Cape Canaveral 8,393 5.6% 1,987.4 6.0% FDOT 5,076 3.4% 1,598.3 4.8% Agriculture* 702 0.5% 174.5 0.5% Port Canaveral* 584 0.4% 124.2 0.4% Melbourne* 30 0.0% 5.5 0.0%
TOTAL 149,747 100.0% 33,319.6 100.0%
4.3 TARGET LOAD PER ACRE To determine the total allowable load of TN and TP for each entity, a target load per acre for each nutrient parameter was determined by dividing the TMDL target load for the anthropogenic sources by the total anthropogenic acreage in the BRL B project zone. Table 11 shows the calculated target loads per acre.
TABLE 11: TARGET LOADS PER ACRE FOR TN AND TP IN BRL B CATEGORY TN TP
Anthropogenic Target Loads (lbs/yr) 51,761 10,828 Anthropogenic Acres 12,724 12,724 Target Load (lbs/acre/yr) 4.07 0.85
4.4 ALLOCATIONS AND REQUIRED REDUCTIONS The allocations for the MS4s were calculated using the target loads per acre for TN and TP determined above. The target loads per acre were multiplied by each entity’s acreage in the
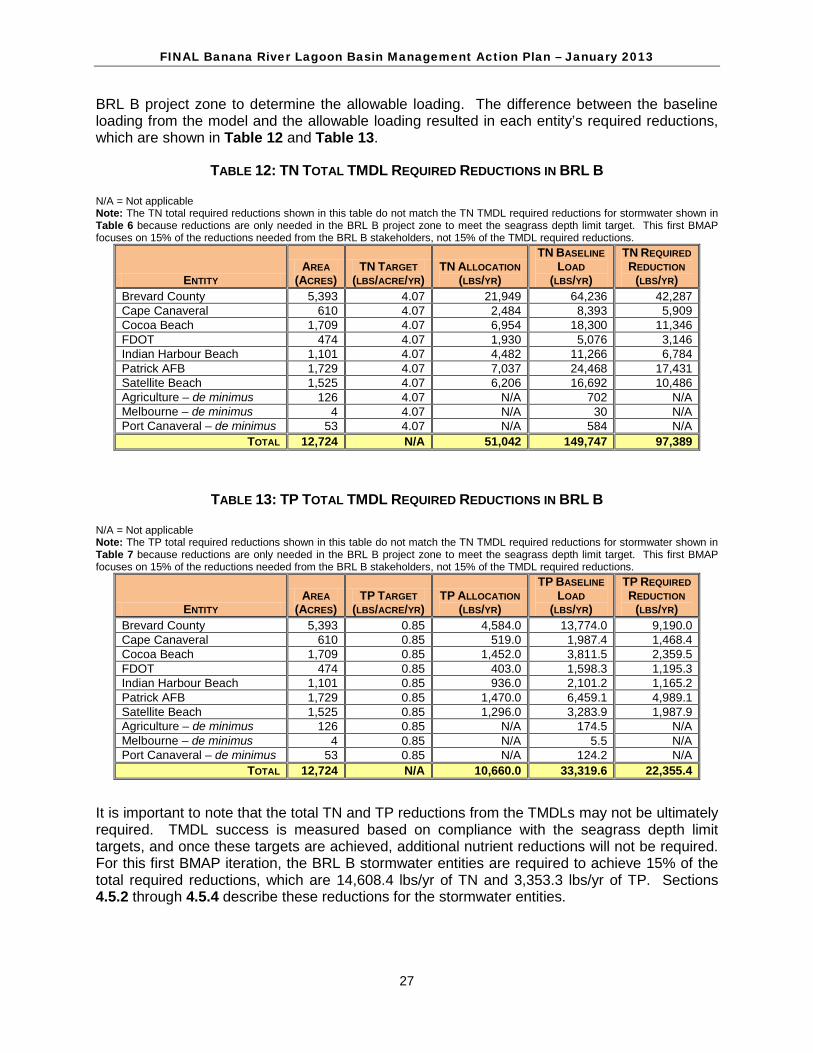
FINAL Banana River Lagoon Basin Management Action Plan – January 2013
27
BRL B project zone to determine the allowable loading. The difference between the baseline loading from the model and the allowable loading resulted in each entity’s required reductions, which are shown in Table 12 and Table 13.
TABLE 12: TN TOTAL TMDL REQUIRED REDUCTIONS IN BRL B N/A = Not applicable Note: The TN total required reductions shown in this table do not match the TN TMDL required reductions for stormwater shown in Table 6 because reductions are only needed in the BRL B project zone to meet the seagrass depth limit target. This first BMAP focuses on 15% of the reductions needed from the BRL B stakeholders, not 15% of the TMDL required reductions.
ENTITY AREA
(ACRES) TN TARGET
(LBS/ACRE/YR) TN ALLOCATION
(LBS/YR)
TN BASELINE LOAD
(LBS/YR)
TN REQUIRED REDUCTION
(LBS/YR) Brevard County 5,393 4.07 21,949 64,236 42,287 Cape Canaveral 610 4.07 2,484 8,393 5,909 Cocoa Beach 1,709 4.07 6,954 18,300 11,346 FDOT 474 4.07 1,930 5,076 3,146 Indian Harbour Beach 1,101 4.07 4,482 11,266 6,784 Patrick AFB 1,729 4.07 7,037 24,468 17,431 Satellite Beach 1,525 4.07 6,206 16,692 10,486 Agriculture – de minimus 126 4.07 N/A 702 N/A Melbourne – de minimus 4 4.07 N/A 30 N/A Port Canaveral – de minimus 53 4.07 N/A 584 N/A
TOTAL 12,724 N/A 51,042 149,747 97,389
TABLE 13: TP TOTAL TMDL REQUIRED REDUCTIONS IN BRL B N/A = Not applicable Note: The TP total required reductions shown in this table do not match the TN TMDL required reductions for stormwater shown in Table 7 because reductions are only needed in the BRL B project zone to meet the seagrass depth limit target. This first BMAP focuses on 15% of the reductions needed from the BRL B stakeholders, not 15% of the TMDL required reductions.
ENTITY AREA
(ACRES) TP TARGET
(LBS/ACRE/YR) TP ALLOCATION
(LBS/YR)
TP BASELINE LOAD
(LBS/YR)
TP REQUIRED REDUCTION
(LBS/YR) Brevard County 5,393 0.85 4,584.0 13,774.0 9,190.0 Cape Canaveral 610 0.85 519.0 1,987.4 1,468.4 Cocoa Beach 1,709 0.85 1,452.0 3,811.5 2,359.5 FDOT 474 0.85 403.0 1,598.3 1,195.3 Indian Harbour Beach 1,101 0.85 936.0 2,101.2 1,165.2 Patrick AFB 1,729 0.85 1,470.0 6,459.1 4,989.1 Satellite Beach 1,525 0.85 1,296.0 3,283.9 1,987.9 Agriculture – de minimus 126 0.85 N/A 174.5 N/A Melbourne – de minimus 4 0.85 N/A 5.5 N/A Port Canaveral – de minimus 53 0.85 N/A 124.2 N/A
TOTAL 12,724 N/A 10,660.0 33,319.6 22,355.4 It is important to note that the total TN and TP reductions from the TMDLs may not be ultimately required. TMDL success is measured based on compliance with the seagrass depth limit targets, and once these targets are achieved, additional nutrient reductions will not be required. For this first BMAP iteration, the BRL B stormwater entities are required to achieve 15% of the total required reductions, which are 14,608.4 lbs/yr of TN and 3,353.3 lbs/yr of TP. Sections 4.5.2 through 4.5.4 describe these reductions for the stormwater entities.
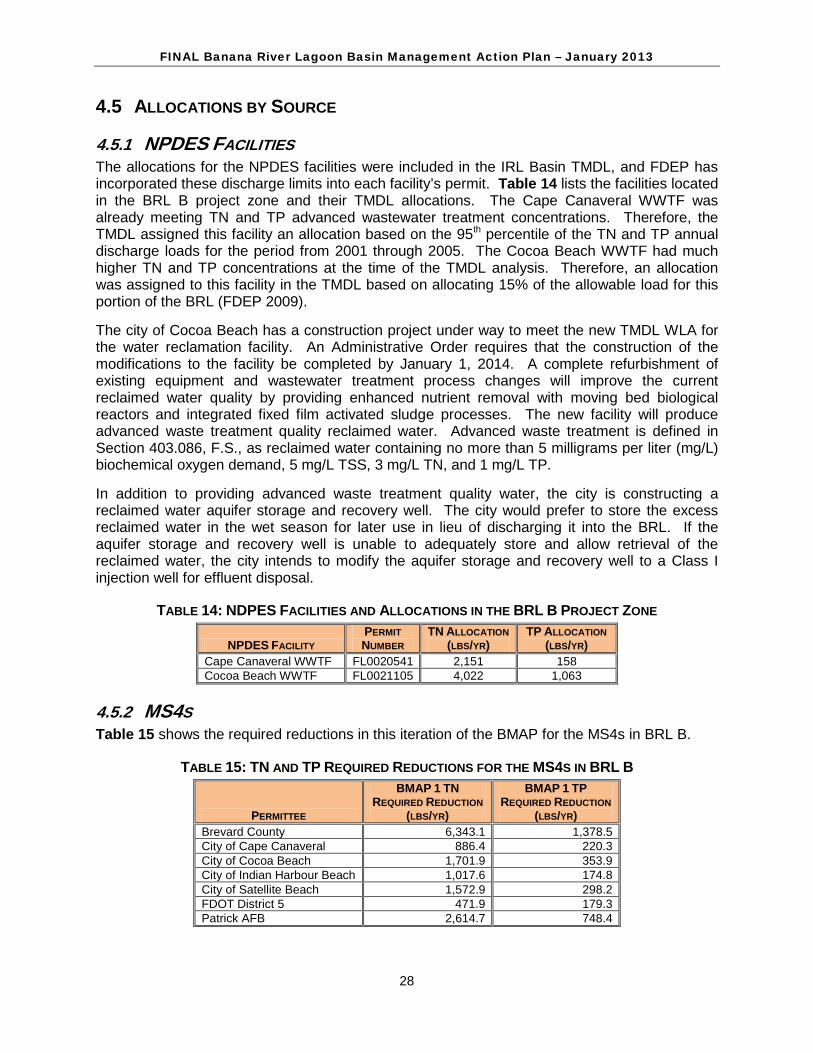
FINAL Banana River Lagoon Basin Management Action Plan – January 2013
28
4.5 ALLOCATIONS BY SOURCE
4.5.1 NPDES FACILITIES The allocations for the NPDES facilities were included in the IRL Basin TMDL, and FDEP has incorporated these discharge limits into each facility’s permit. Table 14 lists the facilities located in the BRL B project zone and their TMDL allocations. The Cape Canaveral WWTF was already meeting TN and TP advanced wastewater treatment concentrations. Therefore, the TMDL assigned this facility an allocation based on the 95th percentile of the TN and TP annual discharge loads for the period from 2001 through 2005. The Cocoa Beach WWTF had much higher TN and TP concentrations at the time of the TMDL analysis. Therefore, an allocation was assigned to this facility in the TMDL based on allocating 15% of the allowable load for this portion of the BRL (FDEP 2009).
The city of Cocoa Beach has a construction project under way to meet the new TMDL WLA for the water reclamation facility. An Administrative Order requires that the construction of the modifications to the facility be completed by January 1, 2014. A complete refurbishment of existing equipment and wastewater treatment process changes will improve the current reclaimed water quality by providing enhanced nutrient removal with moving bed biological reactors and integrated fixed film activated sludge processes. The new facility will produce advanced waste treatment quality reclaimed water. Advanced waste treatment is defined in Section 403.086, F.S., as reclaimed water containing no more than 5 milligrams per liter (mg/L) biochemical oxygen demand, 5 mg/L TSS, 3 mg/L TN, and 1 mg/L TP.
In addition to providing advanced waste treatment quality water, the city is constructing a reclaimed water aquifer storage and recovery well. The city would prefer to store the excess reclaimed water in the wet season for later use in lieu of discharging it into the BRL. If the aquifer storage and recovery well is unable to adequately store and allow retrieval of the reclaimed water, the city intends to modify the aquifer storage and recovery well to a Class I injection well for effluent disposal.
TABLE 14: NDPES FACILITIES AND ALLOCATIONS IN THE BRL B PROJECT ZONE
NPDES FACILITY PERMIT NUMBER
TN ALLOCATION (LBS/YR)
TP ALLOCATION (LBS/YR)
Cape Canaveral WWTF FL0020541 2,151 158 Cocoa Beach WWTF FL0021105 4,022 1,063
4.5.2 MS4S Table 15 shows the required reductions in this iteration of the BMAP for the MS4s in BRL B.
TABLE 15: TN AND TP REQUIRED REDUCTIONS FOR THE MS4S IN BRL B
PERMITTEE
BMAP 1 TN REQUIRED REDUCTION
(LBS/YR)
BMAP 1 TP REQUIRED REDUCTION
(LBS/YR) Brevard County 6,343.1 1,378.5 City of Cape Canaveral 886.4 220.3 City of Cocoa Beach 1,701.9 353.9 City of Indian Harbour Beach 1,017.6 174.8 City of Satellite Beach 1,572.9 298.2 FDOT District 5 471.9 179.3 Patrick AFB 2,614.7 748.4
FINAL Banana River Lagoon Basin Management Action Plan – January 2013
29
4.5.3 NON-MS4S The only non-MS4 urban stormwater source in the BRL B project zone is Port Canaveral. As a de minimus entity for this first BMAP iteration (see Section 4.2), no reductions are assigned at this time.
4.5.4 AGRICULTURE Agriculture was determined to be a de minimus nutrient source in the BRL B project zone for this first BMAP iteration (see Section 4.2); therefore, no reductions are assigned at this time. This de minimus finding does not preclude agricultural producers from implementing appropriate BMPs for their commodities.
FINAL Banana River Lagoon Basin Management Action Plan – January 2013
30
CHAPTER 5: MANAGEMENT ACTIONS
“Management actions” refers to the suite of activities that the BRL BMAP allocation entities will be conducting to achieve their required TN and TP reductions. These include both structural and nonstructural activities.
Management actions had to meet several criteria to be considered eligible for credit in the BMAP. All projects, programs, and activities were required to address nutrient loads (TN, TP, or both) to receive credit, and must be located within the appropriate BRL project zone. Projects completed since January 1, 2000, were eligible for BMAP credit because the land uses in the TMDL model are from 2000; therefore, the benefits of management actions since January 1, 2000, were not reflected in the TMDL model. Management actions were only given credit for the portion of the load reduction that was over and above any permit requirements. This criterion was needed since permit conditions are established to maintain the current condition (prevent further impacts from development) and do not contribute to the improvement of water quality in BRL.
Based on these eligibility requirements, the entities submitted structural and nonstructural projects to reduce the nonpoint source loading from stormwater. The sections below outline the projects submitted by the MS4s and non-MS4s.
5.1 MS4 PROJECTS TO MEET ALLOCATIONS All NPDES permits, including MS4 permits, must be consistent with the requirements of adopted TMDLs. Paragraph 403.067(7)(b), F.S., prescribes the criteria for TMDL implementation. In accordance with this section, the implementation of a TMDL or BMAP for holders of NPDES MS4 permits must be achieved to the maximum extent practicable (MEP), through the use of BMPs or other management measures. These management measures include, but are not limited to, the following:
• Nonregulatory and incentive-based programs, including BMPs, cost sharing, waste minimization, pollution prevention, and public education;
• Nonstructural BMPs;
• Water quality management and restoration activities;
• Public works including capital facilities;
• Land acquisition;
• Local ordinances; and
• Regulatory incentive programs. To comply with the MEP standard, the SWMP must be designed and implemented to reduce the discharge of pollutants to surface waters of the state. The implementation of BMPs consistent with the provisions of the SWMP required under an MS4 permit constitutes compliance with the standard of reducing pollutants to the MEP for discharges to unimpaired waters. However, MS4s must also continue to assess and adjust their list of approved projects (Appendix E) to achieve the greatest reduction of pollutants practicable to protect receiving waters in accordance with an adopted TMDL or BMAP.
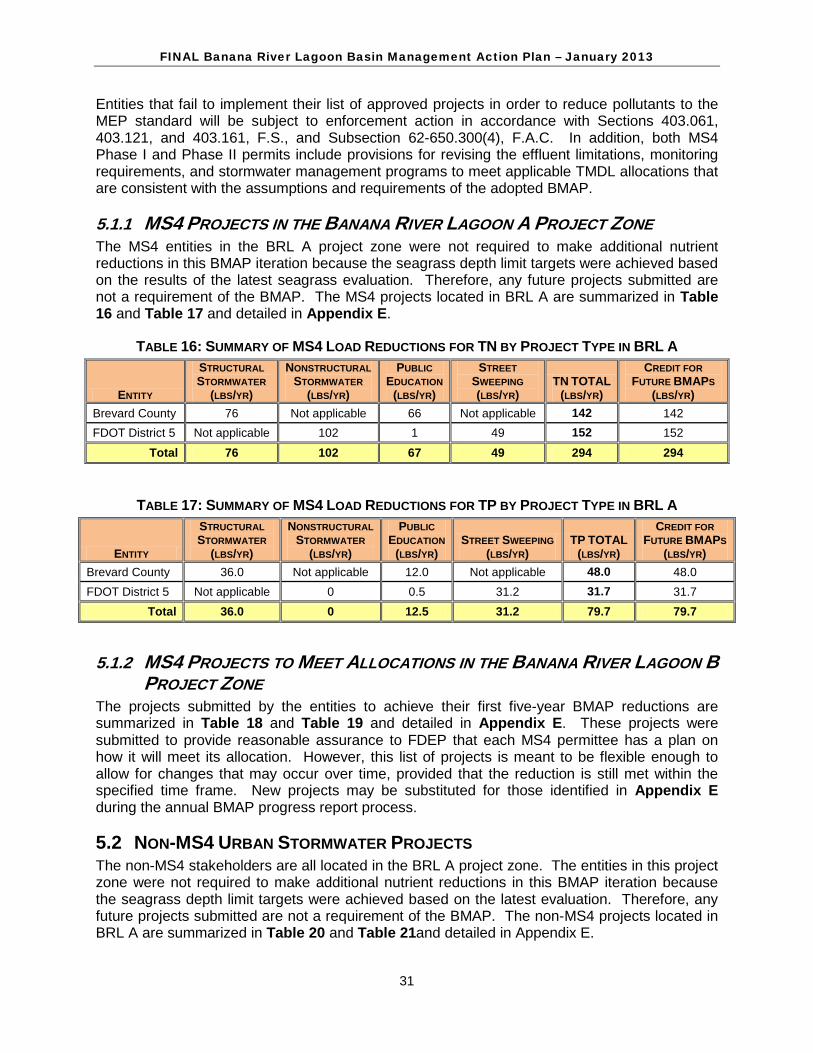
FINAL Banana River Lagoon Basin Management Action Plan – January 2013
31
Entities that fail to implement their list of approved projects in order to reduce pollutants to the MEP standard will be subject to enforcement action in accordance with Sections 403.061, 403.121, and 403.161, F.S., and Subsection 62-650.300(4), F.A.C. In addition, both MS4 Phase I and Phase II permits include provisions for revising the effluent limitations, monitoring requirements, and stormwater management programs to meet applicable TMDL allocations that are consistent with the assumptions and requirements of the adopted BMAP.
5.1.1 MS4 PROJECTS IN THE BANANA RIVER LAGOON A PROJECT ZONE The MS4 entities in the BRL A project zone were not required to make additional nutrient reductions in this BMAP iteration because the seagrass depth limit targets were achieved based on the results of the latest seagrass evaluation. Therefore, any future projects submitted are not a requirement of the BMAP. The MS4 projects located in BRL A are summarized in Table 16 and Table 17 and detailed in Appendix E.
TABLE 16: SUMMARY OF MS4 LOAD REDUCTIONS FOR TN BY PROJECT TYPE IN BRL A
ENTITY
STRUCTURAL STORMWATER
(LBS/YR)
NONSTRUCTURAL STORMWATER
(LBS/YR)
PUBLIC EDUCATION
(LBS/YR)
STREET SWEEPING (LBS/YR)
TN TOTAL (LBS/YR)
CREDIT FOR FUTURE BMAPS
(LBS/YR) Brevard County 76 Not applicable 66 Not applicable 142 142 FDOT District 5 Not applicable 102 1 49 152 152
Total 76 102 67 49 294 294
TABLE 17: SUMMARY OF MS4 LOAD REDUCTIONS FOR TP BY PROJECT TYPE IN BRL A
ENTITY
STRUCTURAL STORMWATER
(LBS/YR)
NONSTRUCTURAL STORMWATER
(LBS/YR)
PUBLIC EDUCATION
(LBS/YR) STREET SWEEPING
(LBS/YR) TP TOTAL
(LBS/YR)
CREDIT FOR FUTURE BMAPS
(LBS/YR) Brevard County 36.0 Not applicable 12.0 Not applicable 48.0 48.0 FDOT District 5 Not applicable 0 0.5 31.2 31.7 31.7
Total 36.0 0 12.5 31.2 79.7 79.7
5.1.2 MS4 PROJECTS TO MEET ALLOCATIONS IN THE BANANA RIVER LAGOON B PROJECT ZONE
The projects submitted by the entities to achieve their first five-year BMAP reductions are summarized in Table 18 and Table 19 and detailed in Appendix E. These projects were submitted to provide reasonable assurance to FDEP that each MS4 permittee has a plan on how it will meet its allocation. However, this list of projects is meant to be flexible enough to allow for changes that may occur over time, provided that the reduction is still met within the specified time frame. New projects may be substituted for those identified in Appendix E during the annual BMAP progress report process.
5.2 NON-MS4 URBAN STORMWATER PROJECTS The non-MS4 stakeholders are all located in the BRL A project zone. The entities in this project zone were not required to make additional nutrient reductions in this BMAP iteration because the seagrass depth limit targets were achieved based on the latest evaluation. Therefore, any future projects submitted are not a requirement of the BMAP. The non-MS4 projects located in BRL A are summarized in Table 20 and Table 21and detailed in Appendix E.

FINAL Banana River Lagoon Basin Management Action Plan – January 2013
32
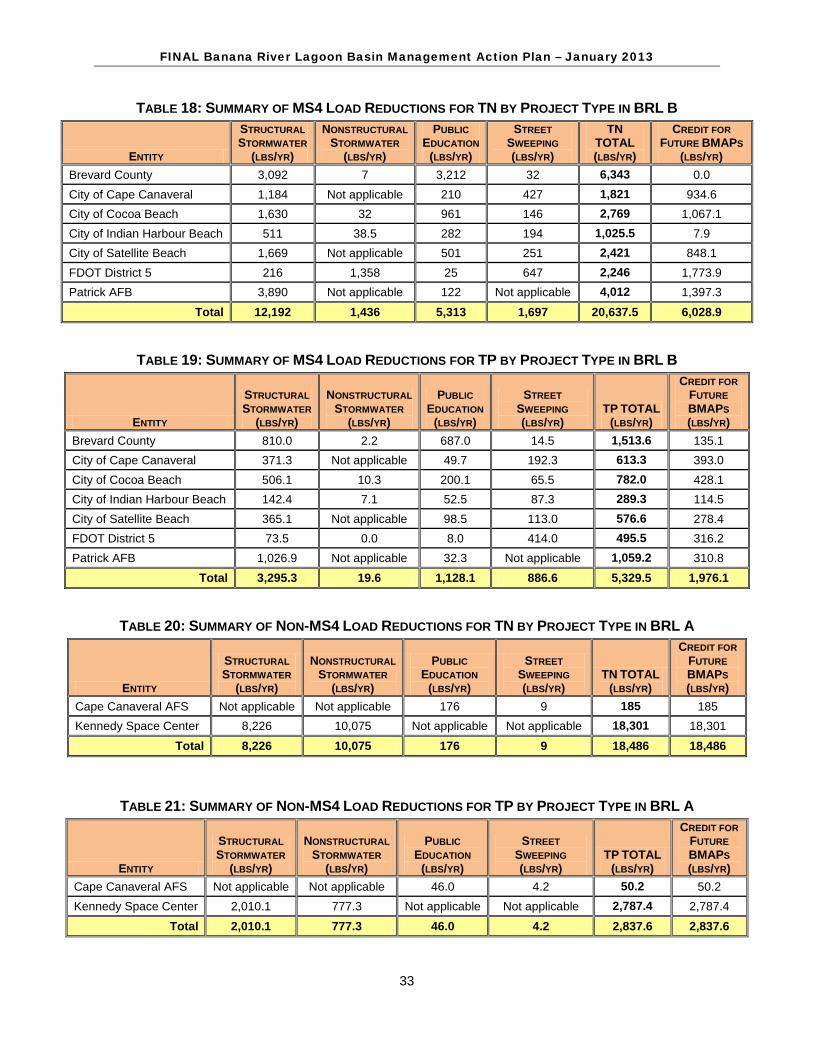
FINAL Banana River Lagoon Basin Management Action Plan – January 2013
33
TABLE 18: SUMMARY OF MS4 LOAD REDUCTIONS FOR TN BY PROJECT TYPE IN BRL B
ENTITY
STRUCTURAL STORMWATER
(LBS/YR)
NONSTRUCTURAL STORMWATER
(LBS/YR)
PUBLIC EDUCATION
(LBS/YR)
STREET SWEEPING (LBS/YR)
TN TOTAL (LBS/YR)
CREDIT FOR FUTURE BMAPS
(LBS/YR) Brevard County 3,092 7 3,212 32 6,343 0.0 City of Cape Canaveral 1,184 Not applicable 210 427 1,821 934.6 City of Cocoa Beach 1,630 32 961 146 2,769 1,067.1 City of Indian Harbour Beach 511 38.5 282 194 1,025.5 7.9 City of Satellite Beach 1,669 Not applicable 501 251 2,421 848.1 FDOT District 5 216 1,358 25 647 2,246 1,773.9 Patrick AFB 3,890 Not applicable 122 Not applicable 4,012 1,397.3
Total 12,192 1,436 5,313 1,697 20,637.5 6,028.9
TABLE 19: SUMMARY OF MS4 LOAD REDUCTIONS FOR TP BY PROJECT TYPE IN BRL B
ENTITY
STRUCTURAL STORMWATER
(LBS/YR)
NONSTRUCTURAL STORMWATER
(LBS/YR)
PUBLIC EDUCATION
(LBS/YR)
STREET SWEEPING (LBS/YR)
TP TOTAL (LBS/YR)
CREDIT FOR FUTURE BMAPS (LBS/YR)
Brevard County 810.0 2.2 687.0 14.5 1,513.6 135.1 City of Cape Canaveral 371.3 Not applicable 49.7 192.3 613.3 393.0 City of Cocoa Beach 506.1 10.3 200.1 65.5 782.0 428.1 City of Indian Harbour Beach 142.4 7.1 52.5 87.3 289.3 114.5 City of Satellite Beach 365.1 Not applicable 98.5 113.0 576.6 278.4 FDOT District 5 73.5 0.0 8.0 414.0 495.5 316.2 Patrick AFB 1,026.9 Not applicable 32.3 Not applicable 1,059.2 310.8
Total 3,295.3 19.6 1,128.1 886.6 5,329.5 1,976.1
TABLE 20: SUMMARY OF NON-MS4 LOAD REDUCTIONS FOR TN BY PROJECT TYPE IN BRL A
ENTITY
STRUCTURAL STORMWATER
(LBS/YR)
NONSTRUCTURAL STORMWATER
(LBS/YR)
PUBLIC EDUCATION
(LBS/YR)
STREET SWEEPING (LBS/YR)
TN TOTAL (LBS/YR)
CREDIT FOR FUTURE BMAPS (LBS/YR)
Cape Canaveral AFS Not applicable Not applicable 176 9 185 185 Kennedy Space Center 8,226 10,075 Not applicable Not applicable 18,301 18,301
Total 8,226 10,075 176 9 18,486 18,486
TABLE 21: SUMMARY OF NON-MS4 LOAD REDUCTIONS FOR TP BY PROJECT TYPE IN BRL A
ENTITY
STRUCTURAL STORMWATER
(LBS/YR)
NONSTRUCTURAL STORMWATER
(LBS/YR)
PUBLIC EDUCATION
(LBS/YR)
STREET SWEEPING (LBS/YR)
TP TOTAL (LBS/YR)
CREDIT FOR FUTURE BMAPS (LBS/YR)
Cape Canaveral AFS Not applicable Not applicable 46.0 4.2 50.2 50.2 Kennedy Space Center 2,010.1 777.3 Not applicable Not applicable 2,787.4 2,787.4
Total 2,010.1 777.3 46.0 4.2 2,837.6 2,837.6
FINAL Banana River Lagoon Basin Management Action Plan – January 2013
34
5.3 PROVISIONAL BMPS Several of the BMP activities included in the project lists were assigned provisional reduction estimates for this first iteration of the BMAP. These provisional BMPs are floating islands, public education and outreach efforts, muck removal, aquatic vegetation harvesting, and water control structures. Studies to estimate the efficiencies of these BMPs are currently being conducted across the state and will provide better information for revising the project reductions in the next iteration of the BMAP. If the new BMP information indicates lower efficiencies than what was estimated for this BMAP, the entities that listed these BMPs in their project tables may need to provide additional projects to make up for the difference in reductions. If the new BMP information indicates higher efficiencies, the entities will receive additional credit if they included these BMPs on their project list.
5.3.1 FLOATING ISLANDS As a treatment train feature, credit for floating islands or managed aquatic plant systems (MAPS) was assigned as a 20% reduction in both the TN and TP load remaining after treatment by a stormwater pond. Appendix E shows the entities that included floating islands in their project tables.
5.3.2 PUBLIC EDUCATION AND OUTREACH Up to a 6% reduction in the baseline anthropogenic load for both TN and TP was assigned based on the education and outreach efforts conducted by each entity. The 6% load reduction estimate was determined from the Center for Watershed Protection Watershed Treatment Model. Credit was given for the following applicable educational activities:
1. Local funding to implement the Florida Yards and Neighborhoods (FYN) program within the city or county.
2. Local land development codes or ordinances that require Florida-friendly landscaping on all new developments; require commercial landscapers to obtain training and certification through the Green Industry BMP program; require irrigation systems per Sections 125.568, 166.048, and 373.185, F.S.; specify fertilizer application rates and types; and control pet waste and require that residents pick up and properly dispose of pet waste.
3. Implementation of public service announcements (PSAs) on local cable or commercial television and radio stations.
4. Informational pamphlets on pollution prevention, fertilizer application, Florida-friendly landscaping, water conservation, septic tank maintenance, etc. Presentations on these topics to civic groups, local businesses, students, and the general public.
5. Websites to provide information on reducing nutrient pollution for homeowners and businesses.
6. An inspection program and public call-in number to address illicit discharges. Credit was assigned to the entities for the above efforts as follows:
• If an entity conducted all 6 types of activities, then the full 6% reduction was assigned.
• An entity that only had FYN received a 3% reduction credit.
FINAL Banana River Lagoon Basin Management Action Plan – January 2013
35
• An entity that only had Florida-friendly ordinances (irrigation, landscaping, fertilizer, and pet waste management) received a 2% reduction.
• An entity that only had PSAs, websites, brochures, and the inspection program received a 1% reduction credit.
• Other combinations of efforts were analyzed on a case-by-case basis for credit.
Appendix E summarizes the public education activities conducted by each entity and the associated load reductions.
5.3.3 MUCK REMOVAL A guidance document provided to stakeholders details the requirements to receive muck removal project credit. In summary, it is recommended that the muck deposit average minimum thickness must be 30 centimeters, the muck must be removed to the natural substrate, and the muck material must be stored away from surface waters so that the material cannot be washed back into the waterbody. The credit for muck removal is calculated by multiplying the area of muck removed by the difference in the nutrient flux rate of the muck and natural substrate. Stakeholders that receive credit for muck removal must measure post-project muck deposition rates every 5 years and report this information to FDEP. Project credit will be assigned for a period of up to 10 years after an area is dredged. If adequate source controls are not in place in the watershed, muck will reaccumulate at a faster rate than if the watershed loads were being controlled. As of the time of BMAP adoption, none of the BRL stakeholders included muck removal in the project tables; however, the stakeholders do have the option of adding these structures to the list of projects in the future.
5.3.4 AQUATIC VEGETATION HARVESTING A guidance document provided to the stakeholders details the requirements to receive credit for aquatic vegetation harvesting. In summary, credit is assigned based on the type of vegetation removed, the nutrient content for that type of plant, the amount of plant material removed, and the percent dry weight of material collected. Stakeholders that harvest aquatic vegetation will determine an annual average TN and TP load removal, to be included in the BMAP as credit. As of the time of BMAP adoption, none of the BRL stakeholders included aquatic vegetation harvesting in the project tables; however, the stakeholders do have the option of adding these structures to the list of projects in the future.
5.3.5 WATER CONTROL STRUCTURES Credit for certain water control structures, such as tilting weir gates, was assigned a 5% TN reduction based on the load that drains to the canal containing the control structure. Available data did not show that reductions in TP occurred with the tilting weir gates. As of the time of BMAP adoption, none of the BRL stakeholders included water control structures in the project tables; however, the stakeholders do have the option of adding these structures to the list of projects in the future.
FINAL Banana River Lagoon Basin Management Action Plan – January 2013
36
CHAPTER 6: ASSESSING PROGRESS AND MAKING CHANGES
Successful BMAP implementation requires commitment and follow-up. In the Commitment to Plan Implementation (see Chapter 7), stakeholders have expressed their intention to carry out the plan, monitor its effect, and continue to coordinate within and across jurisdictions to achieve seagrass targets. The FWRA requires that an assessment be conducted every five years to determine whether there is reasonable progress in implementing the BMAP and achieving pollutant load reductions. This chapter contains details on future seagrass evaluations, tracking implementation of efforts, adaptive management of the BMAP, water quality monitoring, and research priorities that will provide information sufficient to assess progress and make the necessary changes.
6.1 SEAGRASS TARGET EVALUATION In Year 4 of BMAP implementation, TMDL depth limit targets will be reassessed using the two-step approach (refer to Section 2.3) and 2007, 2009, 2011, and 2013 mapping data, which will likely be the latest data at that time. If at this time BRL A is still compliant, FDEP will not ask stakeholders in that project zone to make additional TN and TP reductions in the next iteration of the BMAP. If the BRL A project zone is noncompliant based on seagrass data through 2013, FDEP will ask the stakeholders in that project zone to make further nutrient reductions in a second BMAP. The BRL B project zone did not achieve the seagrass depth limit target in either 2007 or 2009; therefore, two out of the four years are already noncompliant, and a second BMAP with additional reductions will be required for this project zone.
6.2 TRACKING IMPLEMENTATION FDEP will work with the stakeholders to organize the monitoring data and track project implementation. This information will be presented in an annual report. The stakeholders will meet at least every 12 months after the adoption of the BMAP to follow up on plan implementation, share new information, and continue to coordinate on TMDL-related issues. The following types of activities may occur at annual meetings:
• Implementation Data and Reporting o Collect project implementation information from the stakeholders and MS4 permit
reporting and compare it with the BMAP schedule.
o Discuss the data collection process, including any concerns and possible improvements to the process.
o Review the monitoring plan implementation, as detailed in Section 6.3.
• Sharing New Information o Report on seagrass depth limit evaluation results compared with the TMDL
seagrass depth limit targets, using the Step 1 and Step 2 evaluations for compliance.
o Report on results from water quality monitoring and trend information.
o Provide updates on new projects and programs in the basin that will help reduce nutrient loading.
o Identify and review new scientific developments on addressing nutrient loading and incorporate any new information into annual progress reports.
FINAL Banana River Lagoon Basin Management Action Plan – January 2013
37
• Coordinating TMDL-Related Issues
o Provide updates from FDEP on the basin cycle and activities related to any impairments, TMDLs, and BMAPs.
o Obtain reports from other basins where tools or other information may be applicable to the BRL TMDLs.
Covering all of these topics at the annual meetings is not required, but they provide examples of the types of information that should be considered for the agenda to assist with BMAP implementation and improve coordination among the agencies and stakeholders. Updates on project implementation, seagrass depth limit target evaluations, and water quality data should be presented as information becomes available.
6.3 ADAPTIVE MANAGEMENT MEASURES Adaptive management involves setting up a mechanism for making adjustments in the TMDL and BMAP as new information is obtained, when circumstances change, or feedback indicates the need for a more effective strategy. Adaptive management measures include the following:
• Criteria for revising TMDL load reduction requirements based on new data and updated seagrass depth limit evaluations;
• Procedures to determine whether additional cooperative strategies are needed;
• Criteria/processes for determining whether and when plan components need revision due to changes in costs, environmental impacts, social effects, watershed conditions, or other factors; and
• Descriptions of the stakeholders’ role after BMAP completion. Key components of adaptive management include sharing information and expertise, tracking plan implementation, monitoring water quality and pollutant loads, and holding periodic meetings. BMAP execution will be a long-term process. FDEP and the stakeholders will track implementation efforts and monitor water quality to measure effectiveness and ensure BMAP compliance. The stakeholders will meet at least every 12 months to discuss implementation issues, consider new information, and, if the BRL subbasin is not projected to meet the TMDL seagrass depth limit targets, determine additional corrective actions. Information on project implementation, monitoring, and the status of other activities will be collected annually from the participating entities. The stakeholders will review these reports to assess progress towards meeting the BMAP’s goals.
6.4 SEAGRASS AND WATER QUALITY MONITORING This monitoring plan is designed to track seagrass distribution and identify long-term water quality trends in response to BMAP project implementation. Sampling stations, parameters, frequency, and other elements of this strategy may be modified as appropriate to match changing environmental conditions, funding resources, and understanding of the IRL system. However, any modifications made will not affect the ability of the monitoring network to fulfill the objectives noted below.
6.4.1 OBJECTIVES Focused objectives are critical for a monitoring strategy to provide the information needed to evaluate implementation success. The purpose of the primary monitoring is to assess progress
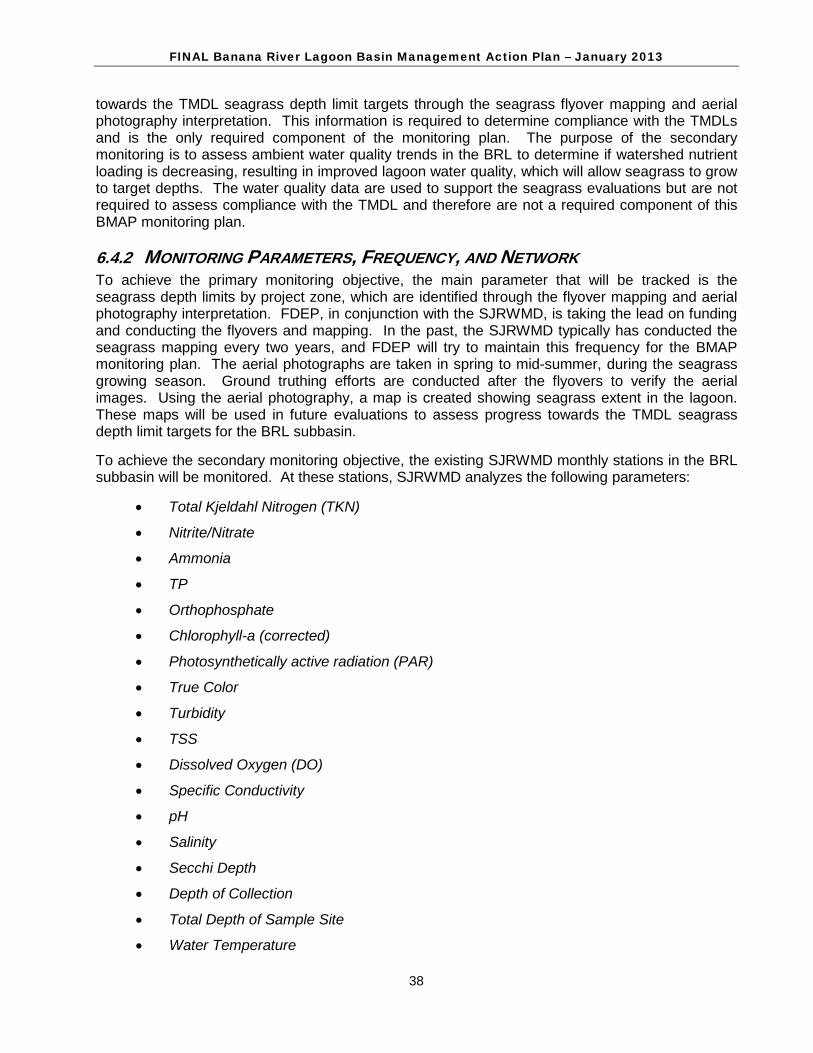
FINAL Banana River Lagoon Basin Management Action Plan – January 2013
38
towards the TMDL seagrass depth limit targets through the seagrass flyover mapping and aerial photography interpretation. This information is required to determine compliance with the TMDLs and is the only required component of the monitoring plan. The purpose of the secondary monitoring is to assess ambient water quality trends in the BRL to determine if watershed nutrient loading is decreasing, resulting in improved lagoon water quality, which will allow seagrass to grow to target depths. The water quality data are used to support the seagrass evaluations but are not required to assess compliance with the TMDL and therefore are not a required component of this BMAP monitoring plan.
6.4.2 MONITORING PARAMETERS, FREQUENCY, AND NETWORK To achieve the primary monitoring objective, the main parameter that will be tracked is the seagrass depth limits by project zone, which are identified through the flyover mapping and aerial photography interpretation. FDEP, in conjunction with the SJRWMD, is taking the lead on funding and conducting the flyovers and mapping. In the past, the SJRWMD typically has conducted the seagrass mapping every two years, and FDEP will try to maintain this frequency for the BMAP monitoring plan. The aerial photographs are taken in spring to mid-summer, during the seagrass growing season. Ground truthing efforts are conducted after the flyovers to verify the aerial images. Using the aerial photography, a map is created showing seagrass extent in the lagoon. These maps will be used in future evaluations to assess progress towards the TMDL seagrass depth limit targets for the BRL subbasin.
To achieve the secondary monitoring objective, the existing SJRWMD monthly stations in the BRL subbasin will be monitored. At these stations, SJRWMD analyzes the following parameters:
• Total Kjeldahl Nitrogen (TKN)
• Nitrite/Nitrate
• Ammonia
• TP
• Orthophosphate
• Chlorophyll-a (corrected)
• Photosynthetically active radiation (PAR)
• True Color
• Turbidity
• TSS
• Dissolved Oxygen (DO)
• Specific Conductivity
• pH
• Salinity
• Secchi Depth
• Depth of Collection
• Total Depth of Sample Site
• Water Temperature
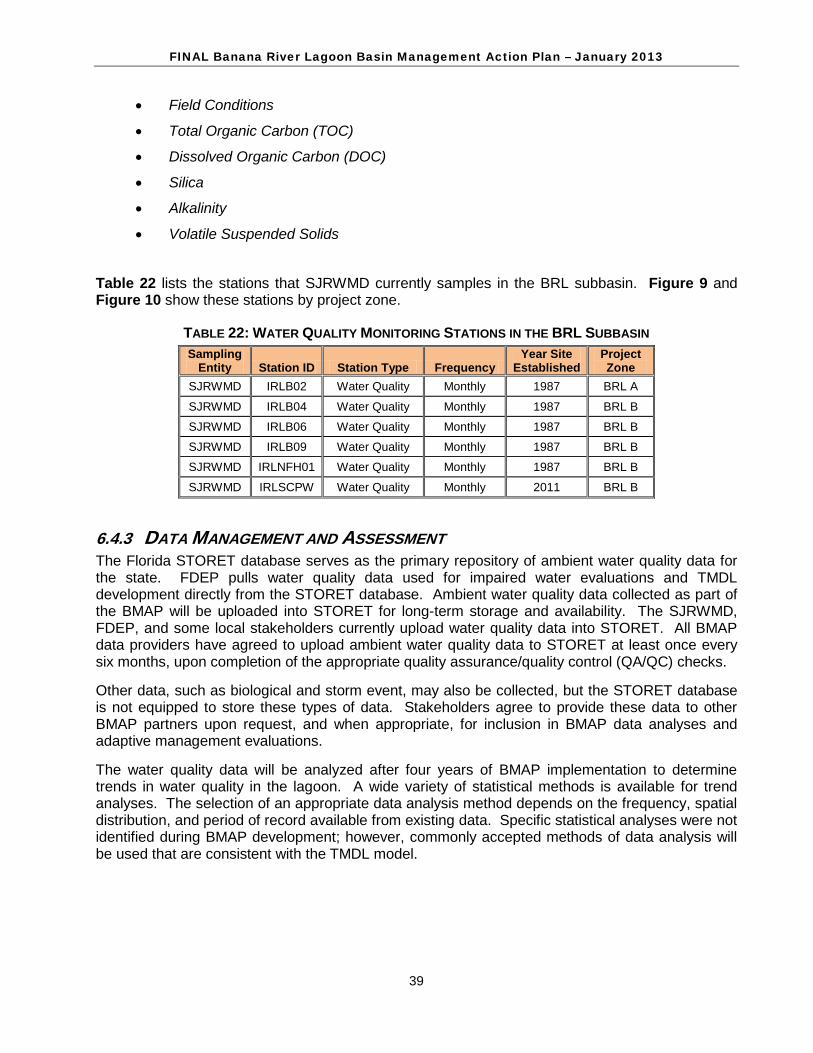
FINAL Banana River Lagoon Basin Management Action Plan – January 2013
39
• Field Conditions
• Total Organic Carbon (TOC)
• Dissolved Organic Carbon (DOC)
• Silica
• Alkalinity
• Volatile Suspended Solids Table 22 lists the stations that SJRWMD currently samples in the BRL subbasin. Figure 9 and Figure 10 show these stations by project zone.
TABLE 22: WATER QUALITY MONITORING STATIONS IN THE BRL SUBBASIN Sampling
Entity Station ID Station Type Frequency Year Site
Established Project Zone
SJRWMD IRLB02 Water Quality Monthly 1987 BRL A
SJRWMD IRLB04 Water Quality Monthly 1987 BRL B
SJRWMD IRLB06 Water Quality Monthly 1987 BRL B
SJRWMD IRLB09 Water Quality Monthly 1987 BRL B
SJRWMD IRLNFH01 Water Quality Monthly 1987 BRL B
SJRWMD IRLSCPW Water Quality Monthly 2011 BRL B
6.4.3 DATA MANAGEMENT AND ASSESSMENT The Florida STORET database serves as the primary repository of ambient water quality data for the state. FDEP pulls water quality data used for impaired water evaluations and TMDL development directly from the STORET database. Ambient water quality data collected as part of the BMAP will be uploaded into STORET for long-term storage and availability. The SJRWMD, FDEP, and some local stakeholders currently upload water quality data into STORET. All BMAP data providers have agreed to upload ambient water quality data to STORET at least once every six months, upon completion of the appropriate quality assurance/quality control (QA/QC) checks.
Other data, such as biological and storm event, may also be collected, but the STORET database is not equipped to store these types of data. Stakeholders agree to provide these data to other BMAP partners upon request, and when appropriate, for inclusion in BMAP data analyses and adaptive management evaluations.
The water quality data will be analyzed after four years of BMAP implementation to determine trends in water quality in the lagoon. A wide variety of statistical methods is available for trend analyses. The selection of an appropriate data analysis method depends on the frequency, spatial distribution, and period of record available from existing data. Specific statistical analyses were not identified during BMAP development; however, commonly accepted methods of data analysis will be used that are consistent with the TMDL model.
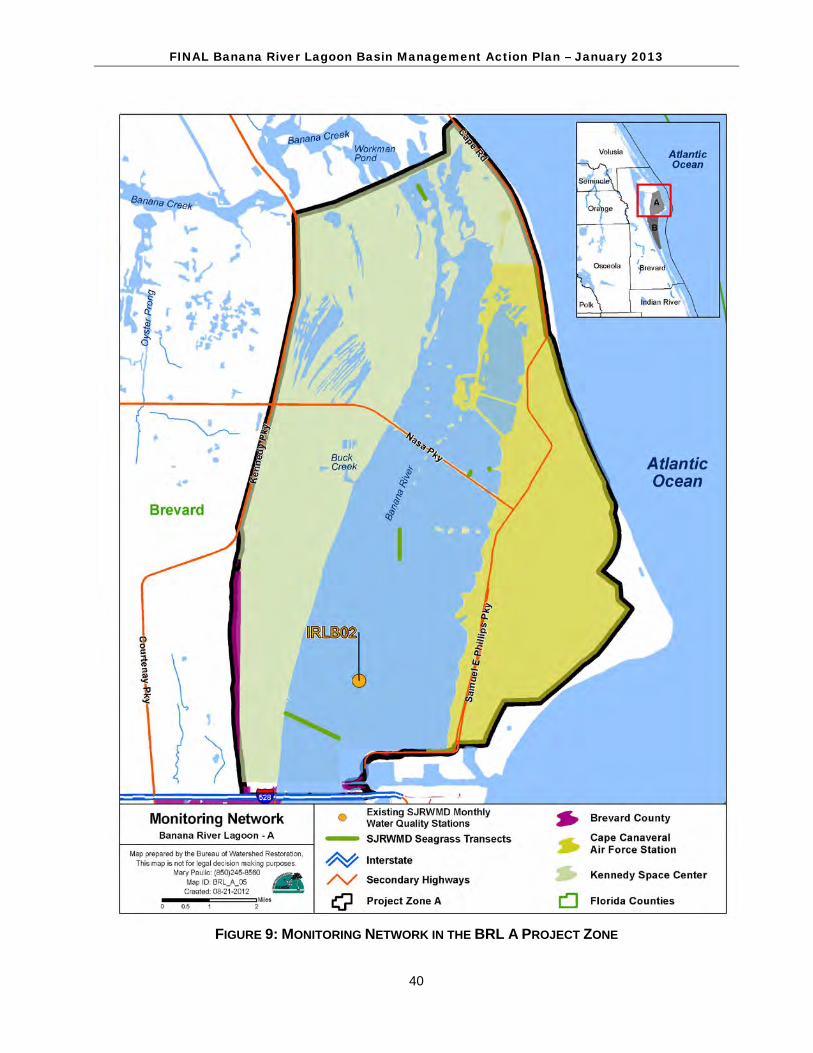
FINAL Banana River Lagoon Basin Management Action Plan – January 2013
40
FIGURE 9: MONITORING NETWORK IN THE BRL A PROJECT ZONE
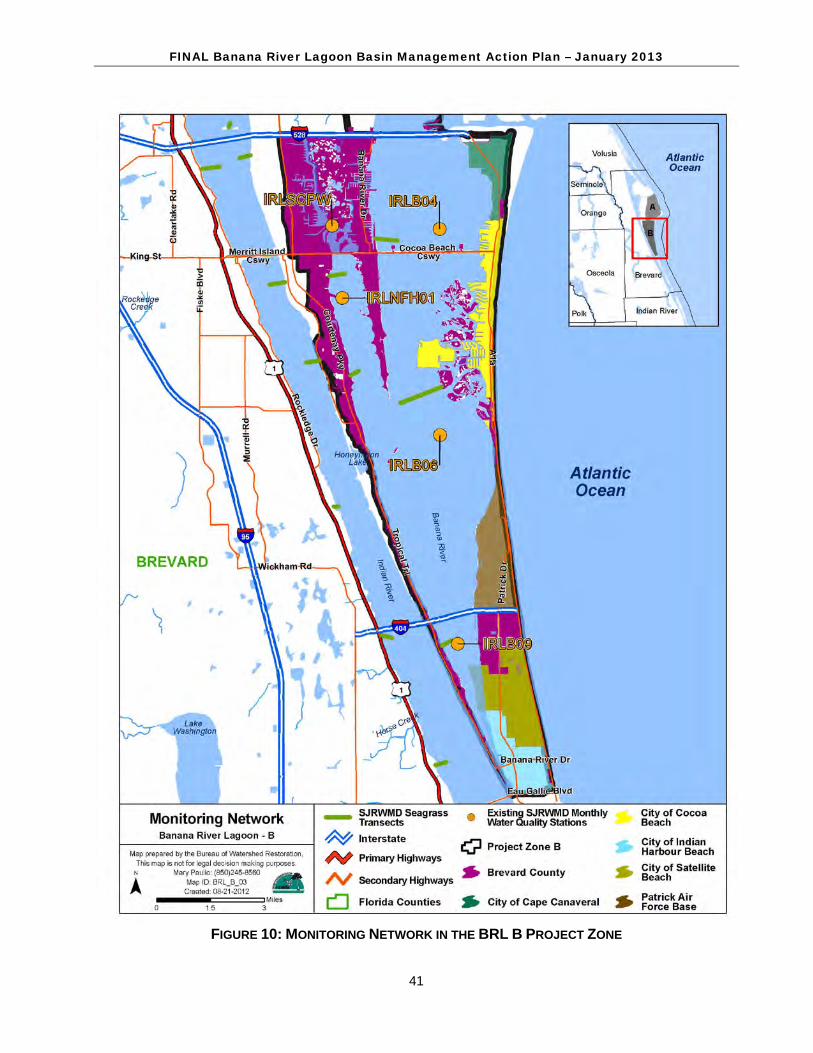
FINAL Banana River Lagoon Basin Management Action Plan – January 2013
41
FIGURE 10: MONITORING NETWORK IN THE BRL B PROJECT ZONE
FINAL Banana River Lagoon Basin Management Action Plan – January 2013
42
6.4.4 QUALITY ASSURANCE/QUALITY CONTROL Stakeholders participating in the monitoring plan must collect water quality data in a manner consistent with FDEP’s standard operating procedures (SOPs) for QA/QC. The most current version of these procedures can be downloaded from http://www.dep.state.fl.us/water/sas/sop/sops.htm. For BMAP-related data analyses, entities should use National Environmental Laboratory Accreditation Council (NELAC) National Environmental Laboratory Accreditation Program (NELAP) certified laboratories (http://www.dep.state.fl.us/labs/cgi-bin/aams/index.asp) or other labs that meet the certification and other requirements outlined in the SOPs. SJRWMD staff and contractors collect, process, and preserve samples according to the SJRWMD’s Standard Operating Procedures for the Collection of Surface Water Quality Samples and Field Data–Feb. 13, 2004. Where SJRWMD and FDEP SOPs do not correspond to one another, SJRWMD staff and contractors defer to FDEP’s SOPs.
6.5 RESEARCH PRIORITIES During the BMAP process, the stakeholders identified several research priorities they would like to pursue, if funding becomes available. The Indian River Lagoon 2011 Superbloom Plan of Investigation (SJRWMD et al. 2012) addresses or complements a number of the listed priorities. These research topics include the following:
• Collecting data to update the bathymetry for the IRL Basin, which would be used in the seagrass depth limit evaluations;
• Continuing and increasing the frequency of the monitoring along the existing seagrass transects to track seagrass composition, density, and extent;
• Implementing phytoplankton, drift algae, and macroalgae monitoring in the basin;
• Tracking watershed loads by monitoring inflow and outflow nutrient concentrations for each jurisdiction;
• Verifying the BMP effectiveness values used in the BMAP as needed;
• Testing/verifying the TN, TP, and seagrass depth regression equations using the seagrass data collected since 1999; and
• Collecting ground water load contribution data and conducting ground water modeling.
During the first iteration of the BMAP, the stakeholders will work with FDEP and IRL NEP to identify other research needs, prioritize the efforts, and develop scopes of work to address each research priority. This information will be organized in a more detailed research plan that would be used to guide future efforts, as funding becomes available. These research projects are not BMAP requirements but would provide valuable information for future assessments of the health of the BRL.
FINAL Banana River Lagoon Basin Management Action Plan – January 2013
43
CHAPTER 7: COMMITMENT TO PLAN IMPLEMENTATION
Subsection 403.067(7), F.S., lays out the mechanisms for BMAP implementation (see Appendix B). While the BMAP is linked by statute to permitting and other enforcement processes that target individual entities, successful implementation mandates that local stakeholders willingly and consistently work together to attain adopted TMDLs. This collaboration fosters the sharing of ideas, information, and resources. The stakeholders have demonstrated their willingness to confer with and support each other in their efforts.
FDEP will ask for letters of commitment or resolutions of support for the BMAP from the entities to ensure that as staff and board members change over time, each entity has documentation of its support for the BMAP and associated efforts. This process will occur concurrently with BMAP adoption, and the written statements of commitment will be added to this chapter of the BMAP as they are received.
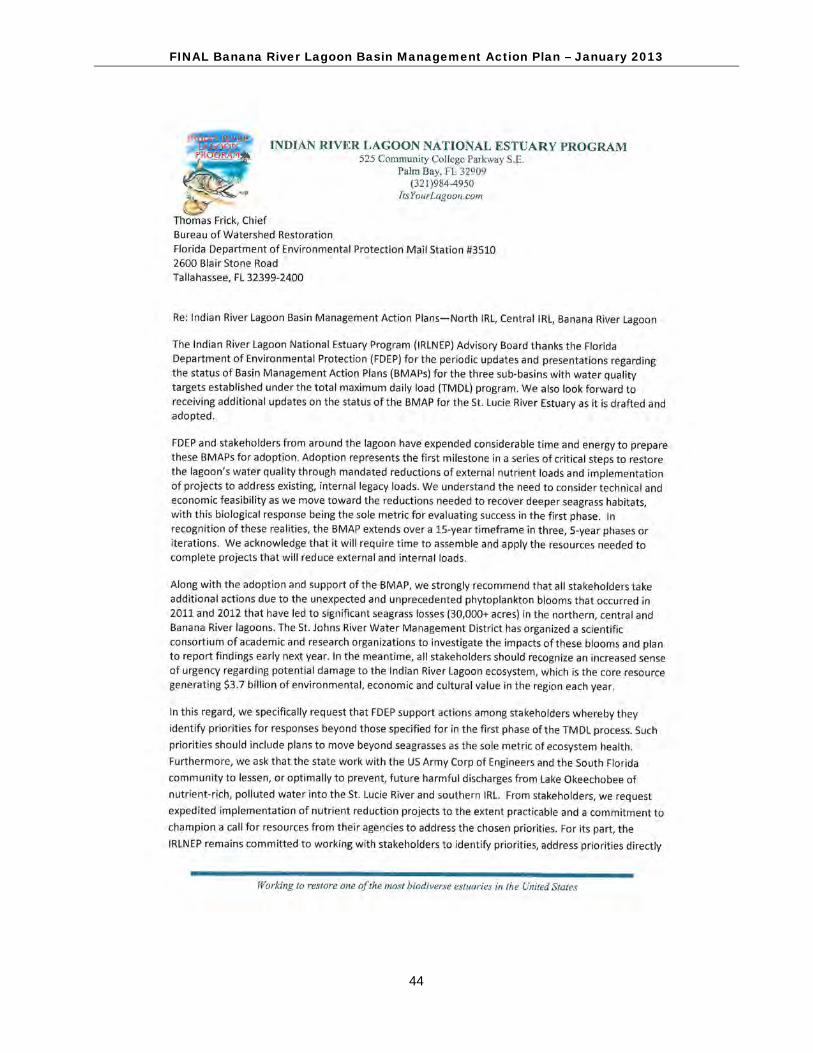
FINAL Banana River Lagoon Basin Management Action Plan – January 2013
44
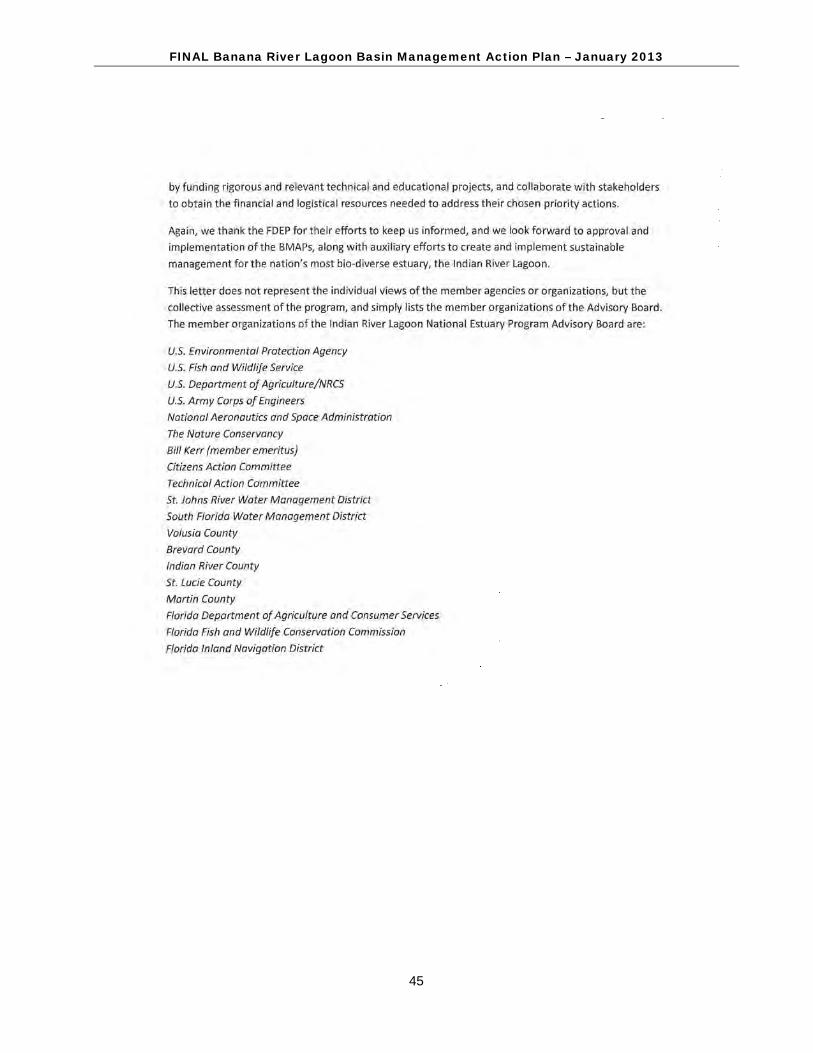
FINAL Banana River Lagoon Basin Management Action Plan – January 2013
45
FINAL Banana River Lagoon Basin Management Action Plan – January 2013
46
INDIAN RIVER LAGOON NATIONAL ESTUARY PROGRAM
525 Community College Parkway, S.E. Palm Bay, FL 32909
(321)984-4950 ItsYourLagoon.com
Thomas Frick, Chief Bureau of Watershed Restoration Florida Department of Environmental Protection Mail Station #3510 2600 Blair Stone Road Tallahassee, FL 32399-2400 Re: Indian River Lagoon Basin Management Action Plans – North IRL, Central IRL, Banana River Lagoon The Indian River Lagoon Nation Estuary Program (IRLNEP) Advisory Board thanks the Florida Department of Environmental Protection (FDEP) for the periodic updates and presentations regarding the status of Basin Management Action Plans (BMAPs) for the three sub-basins with water quality targets established under the total maximum daily load (TMDL) program. We also look forward to receiving additional updates on the status of the BMAP for the St. Lucie River Estuary as it is drafted and adopted. FDEP and stakeholders from around the lagoon have expended considerable time and energy to prepare these BMAPs for adoption. Adoption represents the first milestone in a series of critical steps to restore the lagoon’s water quality through mandated reductions of external nutrient loads and implementation of projects to address existing, internal legacy loads. We understand the need to consider technical and economic feasibility as we move toward the reductions needed to recover deeper seagrass habitats, with this biological response being the sole metric for evaluating success in the first phase. In recognition of these realities, the BMAP extends over a 15-year timeframe in three, 5-year phases or iterations. We acknowledge that it will require time to assemble and apply the resources needed to complete projects that will reduce external and internal loads. Along with the adoption and support of the BMAP, we strongly recommend that all stakeholders take additional actions due to the unexpected and unprecedented phytoplankton blooms that occurred in 2011 and 2012 that have led to significant seagrass losses (30,00+ acres) in the northern, central and Banana River lagoons. The St. Johns River Water Management District has organized a scientific consortium of academic and research organizations to investigate the impacts of these blooms and plan to report findings early next year. In the meantime, all stakeholders should recognize an increased sense of urgency regarding potential damage to the Indian River Lagoon ecosystem, which is the core resource generating $3.7 billion of environmental, economic, and cultural value in the region each year. In this regard, we specifically request that FDEP support actions among stakeholders whereby they identify priorities for responses beyond those specified for in the first phase of the TMDL process. Such priorities should include plans to move beyond seagrasses as the sole metric of ecosystem health. Furthermore, we ask that the state work with the US Army Corp of Engineers and the South Florida community to lessen, or optimally to prevent, future harmful discharges from
FINAL Banana River Lagoon Basin Management Action Plan – January 2013
47
Lake Okeechobee of nutrient-rich, polluted water into the St. Lucie Rive and southern IRL. From stakeholders, we request expedited implementation of nutrient reduction projects to the extent practicable and a commitment to champion a call for resources from their agencies to address the chosen priorities. For its part, the IRLNEP remains committed to working with stakeholders to identify priorities, address priorities directly by funding rigorous and relevant technical and educational projects, and collaborate with stakeholders to obtain the financial and logistical resources needed to address their chosen priority actions. Again, we thank the FDEP for their efforts to keep us informed, and we look forward to approval and implementation of the BMAPs, along with auxiliary efforts to create and implement sustainable management for the nation’s most bio-diverse estuary, the Indian River Lagoon. This letter does not represent the individual views of the member agencies or organizations, but the collective assessment of the program, and simply lists the member organizations of the Advisory Board. The member organizations of the Indian River Lagoon national Estuary Program Advisory Board are: U.S. Environmental Protection Agency U.S. Fish and Wildlife Service U.S. Department of Agriculture/NRCS U.S. Army Corps of Engineers National Aeronautics and Space Administration The Nature Conservancy Bill Kerr (member emeritus) Citizens Action Committee Technical Advisory Committee St. Johns River Water Management District South Florida Water Management District Volusia County Brevard County Indian River County St. Lucie County Martin County Florida Department of Agriculture and Consumer Services Florida Fish and Wildlife Conservation Commission Florida Inland Navigation District
FINAL Banana River Lagoon Basin Management Action Plan – January 2013
48
FINAL Banana River Lagoon Basin Management Action Plan – January 2013
49
FINAL Banana River Lagoon Basin Management Action Plan – January 2013
50
National Aeronautics and Space Administration Kennedy Space Center Kennedy Space Center, FL 32899
December 12, 2012 Reply to Attn of: TA-A4 Mary Paulic, Basin Coordinator Florida Department of Environmental Protection Watershed Planning and Coordination Section 2600 Blair Stone Road, Mail Station No. 3565 Tallahassee, FL 32399-2400 Subject: National Aeronautics and Space Administration (NASA) John F. Kennedy Space Center
(KSC) Commitment to Support Work on the North Indian River Lagoon and Banana River Basin Management Action Plans (BMAPs) Implementation
In an effort to improve water quality, Federal Clean Water Act Section 303(d), requires adoption of Total Maximum Daily Loads (TMDLs) of pollutants that may be discharged into impaired surface water bodies of the United States. The Florida Department of Environmental Protection (FDEP) identified waters in the North Indian River Lagoon and Banana Rive impaired for nutrients under the Florida Administrative Code, Rule 62-303. To reduce lagoon nutrient discharges and improve seagrass extent, basin stakeholders (local, regional, state, Federal, and private entities) developed BMAPs over a multiyear period for selected water bodies in impaired areas. These BMAPs provide for implementation of water quality improvement projects and strategic monitoring to assess water quality and seagrass improvement. NASA KSC is committed to the following actions to ensure the success of this endeavor: 1. Support and equitable and cost effective watershed management approach to address and
achieve TMDLs related pollutant load reductions and seagrass improvements. 2. Support the necessary approvals and funding needed to implement the NASA management
actions identified in the BMAPs and assist action implementation as required approvals and funding are secured.
3. Track implementation of management actions NASA is responsible for.
4. Identify and advise FDEP of any issues or concerns of possible obstacles to carrying out
BMAPs identified management actions, including technical, funding, and legal obstacles.
5. Continue to communicate and coordinate actions and funding across community organizations, agencies, and programs with regard to BMAPs implementation.
If you have any questions, please contact Dough Durham at (321) 867-8429. Denise R. Thaller Chief, NASA Environmental and Medical Division

FINAL Banana River Lagoon Basin Management Action Plan – January 2013
51
APPENDICES
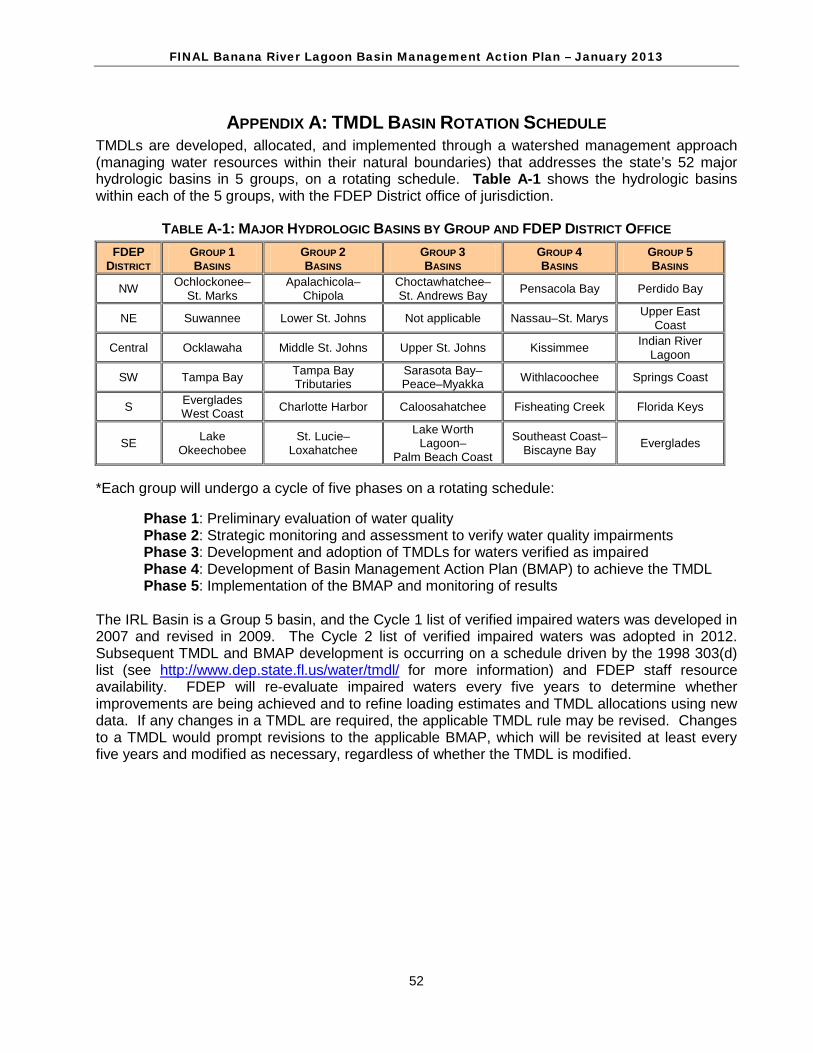
FINAL Banana River Lagoon Basin Management Action Plan – January 2013
52
APPENDIX A: TMDL BASIN ROTATION SCHEDULE TMDLs are developed, allocated, and implemented through a watershed management approach (managing water resources within their natural boundaries) that addresses the state’s 52 major hydrologic basins in 5 groups, on a rotating schedule. Table A-1 shows the hydrologic basins within each of the 5 groups, with the FDEP District office of jurisdiction.
TABLE A-1: MAJOR HYDROLOGIC BASINS BY GROUP AND FDEP DISTRICT OFFICE FDEP
DISTRICT GROUP 1 BASINS
GROUP 2 BASINS
GROUP 3 BASINS
GROUP 4 BASINS
GROUP 5 BASINS
NW Ochlockonee– St. Marks
Apalachicola– Chipola
Choctawhatchee– St. Andrews Bay Pensacola Bay Perdido Bay
NE Suwannee Lower St. Johns Not applicable Nassau–St. Marys Upper East Coast
Central Ocklawaha Middle St. Johns Upper St. Johns Kissimmee Indian River Lagoon
SW Tampa Bay Tampa Bay Tributaries
Sarasota Bay– Peace–Myakka Withlacoochee Springs Coast
S Everglades West Coast Charlotte Harbor Caloosahatchee Fisheating Creek Florida Keys
SE Lake Okeechobee
St. Lucie– Loxahatchee
Lake Worth Lagoon–
Palm Beach Coast
Southeast Coast–Biscayne Bay Everglades
*Each group will undergo a cycle of five phases on a rotating schedule:
Phase 1: Preliminary evaluation of water quality Phase 2: Strategic monitoring and assessment to verify water quality impairments Phase 3: Development and adoption of TMDLs for waters verified as impaired Phase 4: Development of Basin Management Action Plan (BMAP) to achieve the TMDL Phase 5: Implementation of the BMAP and monitoring of results
The IRL Basin is a Group 5 basin, and the Cycle 1 list of verified impaired waters was developed in 2007 and revised in 2009. The Cycle 2 list of verified impaired waters was adopted in 2012. Subsequent TMDL and BMAP development is occurring on a schedule driven by the 1998 303(d) list (see http://www.dep.state.fl.us/water/tmdl/ for more information) and FDEP staff resource availability. FDEP will re-evaluate impaired waters every five years to determine whether improvements are being achieved and to refine loading estimates and TMDL allocations using new data. If any changes in a TMDL are required, the applicable TMDL rule may be revised. Changes to a TMDL would prompt revisions to the applicable BMAP, which will be revisited at least every five years and modified as necessary, regardless of whether the TMDL is modified.
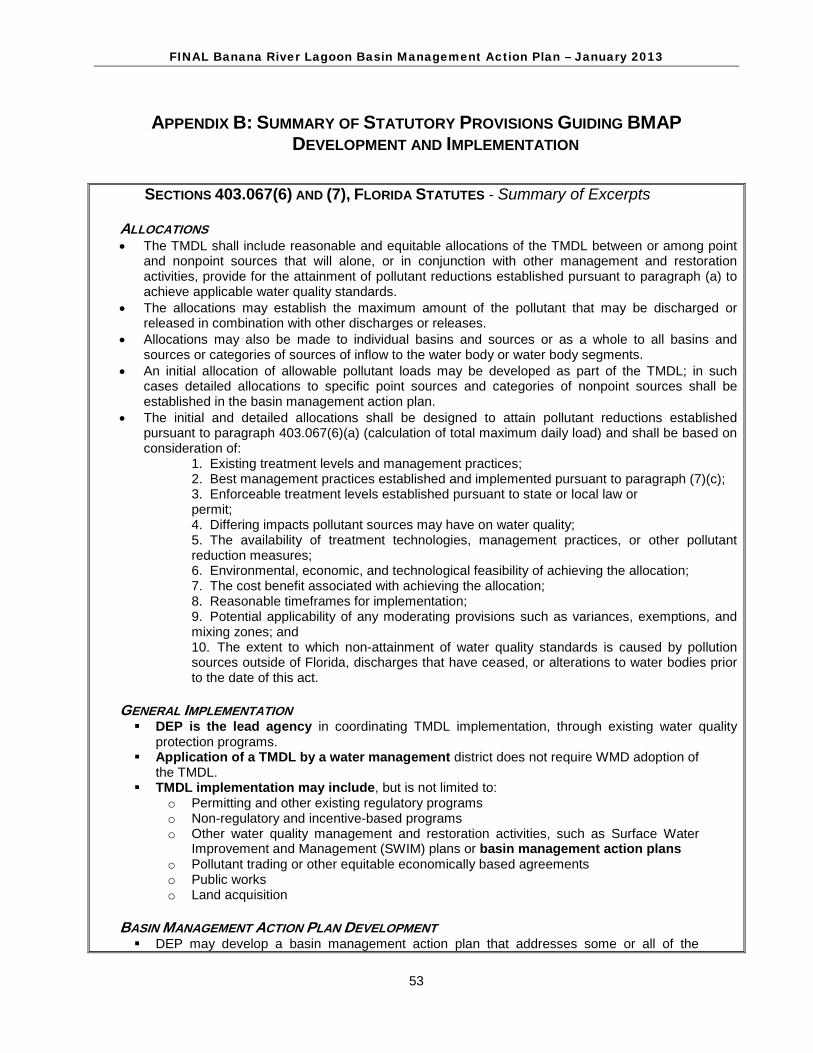
FINAL Banana River Lagoon Basin Management Action Plan – January 2013
53
APPENDIX B: SUMMARY OF STATUTORY PROVISIONS GUIDING BMAP DEVELOPMENT AND IMPLEMENTATION
SECTIONS 403.067(6) AND (7), FLORIDA STATUTES - Summary of Excerpts
ALLOCATIONS • The TMDL shall include reasonable and equitable allocations of the TMDL between or among point
and nonpoint sources that will alone, or in conjunction with other management and restoration activities, provide for the attainment of pollutant reductions established pursuant to paragraph (a) to achieve applicable water quality standards.
• The allocations may establish the maximum amount of the pollutant that may be discharged or released in combination with other discharges or releases.
• Allocations may also be made to individual basins and sources or as a whole to all basins and sources or categories of sources of inflow to the water body or water body segments.
• An initial allocation of allowable pollutant loads may be developed as part of the TMDL; in such cases detailed allocations to specific point sources and categories of nonpoint sources shall be established in the basin management action plan.
• The initial and detailed allocations shall be designed to attain pollutant reductions established pursuant to paragraph 403.067(6)(a) (calculation of total maximum daily load) and shall be based on consideration of:
1. Existing treatment levels and management practices; 2. Best management practices established and implemented pursuant to paragraph (7)(c); 3. Enforceable treatment levels established pursuant to state or local law or permit; 4. Differing impacts pollutant sources may have on water quality; 5. The availability of treatment technologies, management practices, or other pollutant reduction measures; 6. Environmental, economic, and technological feasibility of achieving the allocation; 7. The cost benefit associated with achieving the allocation; 8. Reasonable timeframes for implementation; 9. Potential applicability of any moderating provisions such as variances, exemptions, and mixing zones; and 10. The extent to which non-attainment of water quality standards is caused by pollution sources outside of Florida, discharges that have ceased, or alterations to water bodies prior to the date of this act.
GENERAL IMPLEMENTATION DEP is the lead agency in coordinating TMDL implementation, through existing water quality
protection programs. Application of a TMDL by a water management district does not require WMD adoption of
the TMDL. TMDL implementation may include, but is not limited to:
o Permitting and other existing regulatory programs o Non-regulatory and incentive-based programs o Other water quality management and restoration activities, such as Surface Water
Improvement and Management (SWIM) plans or basin management action plans o Pollutant trading or other equitable economically based agreements o Public works o Land acquisition
BASIN MANAGEMENT ACTION PLAN DEVELOPMENT DEP may develop a basin management action plan that addresses some or all of the
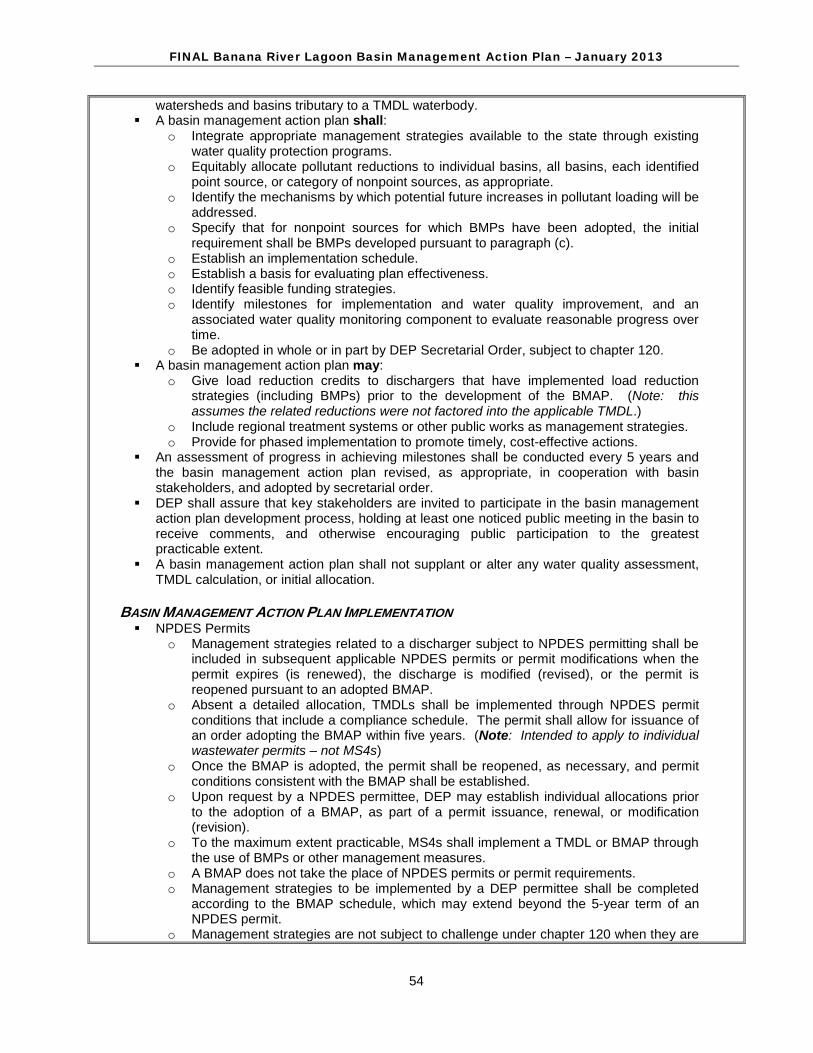
FINAL Banana River Lagoon Basin Management Action Plan – January 2013
54
watersheds and basins tributary to a TMDL waterbody. A basin management action plan shall:
o Integrate appropriate management strategies available to the state through existing water quality protection programs.
o Equitably allocate pollutant reductions to individual basins, all basins, each identified point source, or category of nonpoint sources, as appropriate.
o Identify the mechanisms by which potential future increases in pollutant loading will be addressed.
o Specify that for nonpoint sources for which BMPs have been adopted, the initial requirement shall be BMPs developed pursuant to paragraph (c).
o Establish an implementation schedule. o Establish a basis for evaluating plan effectiveness. o Identify feasible funding strategies. o Identify milestones for implementation and water quality improvement, and an
associated water quality monitoring component to evaluate reasonable progress over time.
o Be adopted in whole or in part by DEP Secretarial Order, subject to chapter 120. A basin management action plan may:
o Give load reduction credits to dischargers that have implemented load reduction strategies (including BMPs) prior to the development of the BMAP. (Note: this assumes the related reductions were not factored into the applicable TMDL.)
o Include regional treatment systems or other public works as management strategies. o Provide for phased implementation to promote timely, cost-effective actions.
An assessment of progress in achieving milestones shall be conducted every 5 years and the basin management action plan revised, as appropriate, in cooperation with basin stakeholders, and adopted by secretarial order.
DEP shall assure that key stakeholders are invited to participate in the basin management action plan development process, holding at least one noticed public meeting in the basin to receive comments, and otherwise encouraging public participation to the greatest practicable extent.
A basin management action plan shall not supplant or alter any water quality assessment, TMDL calculation, or initial allocation.
BASIN MANAGEMENT ACTION PLAN IMPLEMENTATION NPDES Permits
o Management strategies related to a discharger subject to NPDES permitting shall be included in subsequent applicable NPDES permits or permit modifications when the permit expires (is renewed), the discharge is modified (revised), or the permit is reopened pursuant to an adopted BMAP.
o Absent a detailed allocation, TMDLs shall be implemented through NPDES permit conditions that include a compliance schedule. The permit shall allow for issuance of an order adopting the BMAP within five years. (Note: Intended to apply to individual wastewater permits – not MS4s)
o Once the BMAP is adopted, the permit shall be reopened, as necessary, and permit conditions consistent with the BMAP shall be established.
o Upon request by a NPDES permittee, DEP may establish individual allocations prior to the adoption of a BMAP, as part of a permit issuance, renewal, or modification (revision).
o To the maximum extent practicable, MS4s shall implement a TMDL or BMAP through the use of BMPs or other management measures.
o A BMAP does not take the place of NPDES permits or permit requirements. o Management strategies to be implemented by a DEP permittee shall be completed
according to the BMAP schedule, which may extend beyond the 5-year term of an NPDES permit.
o Management strategies are not subject to challenge under chapter 120 when they are
FINAL Banana River Lagoon Basin Management Action Plan – January 2013
55
incorporated in identical form into a NPDES permit or permit modification (revision). Management strategies assigned to nonagricultural, non-NPDES permittees (state, regional,
or local) shall be implemented as part of the applicable permitting programs. Nonpoint source dischargers (e.g., agriculture) included in a BMAP shall demonstrate
compliance with the applicable TMDLs by either implementing appropriate BMPs established under paragraph 7(c), or conducting water quality monitoring prescribed by DEP or a WMD. (Note: this is not applicable to MS4s, as they are considered point sources under the federal Clean Water Act and TMDL Program.) o Failure to implement BMPs or prescribed water quality monitoring may be subject to
DEP or WMD enforcement action. Responsible parties who are implementing applicable BMAP strategies shall not be required
to implement additional pollutant load reduction strategies, and shall be deemed in compliance with this section. However, this does not limit DEP’s authority to amend a BMAP.
BEST MANAGEMENT PRACTICES DEP, in cooperation with WMDs and other interested parties, may develop interim
measures, BMPs, or other measures for non-agricultural nonpoint sources to achieve their load reduction allocations. o These measures may be adopted by DEP or WMD rule. If adopted, they shall be
implemented by those responsible for non-agricultural nonpoint source pollution. DACS may develop and adopt by rule interim measure, BMPs, or other measures necessary for
agricultural pollutant sources to achieve their load reduction allocations. o These measures may be implemented by those responsible for agricultural pollutant
sources. DEP, the WMDs, and DACS shall assist with implementation. o In developing and adopting these measures, DACS shall consult with DEP, DOH, the
WMDs, representatives of affected farming groups, and environmental group representatives.
o The rules shall provide for a notice of intent to implement the practices and a system to ensure implementation, including recordkeeping.
Verification of Effectiveness and Presumption of Compliance - o DEP shall, at representative sites, verify the effectiveness of BMPs and other measures
adopted by rule in achieving load reduction allocations. o DEP shall use best professional judgment in making the initial verification of effectiveness,
and shall notify DACS and the appropriate WMD of the initial verification prior to the adoption of a rule proposed pursuant to this paragraph.
o Implementation of rule-adopted BMPs or other measures initially verified by DEP to be effective, or verified to be effective by monitoring at representative sites, provides a presumption of compliance with state water quality standards for those pollutants addressed by the practices.
Reevaluation – o Where water quality problems are demonstrated despite implementation, operation,
and maintenance of rule-adopted BMPs and other measures, DEP, a WMD, or DACS, in consultation with DEP, shall reevaluate the measures. If the practices require modification, the revised rule shall specify a reasonable time period for implementation.
FINAL Banana River Lagoon Basin Management Action Plan – January 2013
56
APPENDIX C: SUMMARY OF EPA-RECOMMENDED ELEMENTS OF A COMPREHENSIVE WATERSHED PLAN
The following is an excerpt on the nine elements of a watershed plan from the EPA’s “Draft Handbook for Developing Watershed Plans to Restore and Protect Our Waters.” Additional information regarding these elements can be found in the full version of the handbook located online at: http://www.epa.gov/owow/nps/watershed_handbook/. NINE MINIMUM ELEMENTS TO BE INCLUDED IN A WATERSHED PLAN FOR IMPAIRED WATERS FUNDED USING INCREMENTAL SECTION 319 FUNDS Although many different components may be included in a watershed plan, EPA has identified a minimum of 9 elements that are critical for achieving improvements in water quality. EPA requires that these 9 elements be addressed for watershed plans funded using incremental section 319 funds and strongly recommends that they be included in all other watershed plans that are intended to remediate water quality impairments. The 9 elements are provided below, listed in the order in which they appear in the guidelines. Although they are listed as a through i, they do not necessarily take place sequentially. For example, element d asks for a description of the technical and financial assistance that will be needed to implement the watershed plan, but this can be done only after you have addressed elements e and i. Explanations are provided with each element to show you what to include in your watershed plan. NINE ELEMENTS a. Identification of causes of impairment and pollutant sources or groups of similar sources that need to be controlled to achieve needed load reductions, and any other goals identified in the watershed plan. Sources that need to be controlled should be identified at the significant subcategory level along with estimates of the extent to which they are present in the watershed (e.g., X number of dairy cattle feedlots needing upgrading, including a rough estimate of the number of cattle per facility; Y acres of row crops needing improved nutrient management or sediment control; or Z linear miles of eroded streambank needing remediation). What does this mean? Your watershed plan should include a map of the watershed that locates the major sources and causes of impairment. Based on these impairments, you will set goals that will include (at a minimum) meeting the appropriate water quality standards for pollutants that threaten or impair the physical, chemical, or biological integrity of the watershed covered in the plan. b. An estimate of the load reductions expected from management measures. What does this mean? You will first quantify the pollutant loads for the watershed. Based on these pollutant loads, you’ll determine the reductions needed to meet the water quality standards. You will then identify various management measures (see element c below) that will help to reduce the pollutant loads and estimate the load reductions expected as a result of these
FINAL Banana River Lagoon Basin Management Action Plan – January 2013
57
management measures to be implemented, recognizing the difficulty in precisely predicting the performance of management measures over time. Estimates should be provided at the same level as that required in the scale and scope component in paragraph a (e.g., the total load reduction expected for dairy cattle feedlots, row crops, or eroded streambanks). For waters for which EPA has approved or established TMDLs, the plan should identify and incorporate the TMDLs. Applicable loads for downstream waters should be included so that water delivered to a downstream or adjacent segment does not exceed the water quality standards for the pollutant of concern at the water segment boundary. The estimate should account for reductions in pollutant loads from point and nonpoint sources identified in the TMDL as necessary to attain the applicable water quality standards. c. A description of the nonpoint source management measures that will need to be implemented to achieve load reductions in paragraph 2, and a description of the critical areas in which those measures will be needed to implement this plan. What does this mean? The plan should describe the management measures that need to be implemented to achieve the load reductions estimated under element b, as well as to achieve any additional pollution prevention goals called out in the watershed plan. It should also identify the critical areas in which those measures will be needed to implement the plan. This can be done by using a map or a description. d. Estimate of the amounts of technical and financial assistance needed, associated costs, and/or the sources and authorities that will be relied upon to implement this plan. What does this mean? You should estimate the financial and technical assistance needed to implement the entire plan. This includes implementation and long-term operation and maintenance of management measures, I/E activities, monitoring, and evaluation activities. You should also document which relevant authorities might play a role in implementing the plan. Plan sponsors should consider the use of federal, state, local, and private funds or resources that might be available to assist in implementing the plan. Shortfalls between needs and available resources should be identified and addressed in the plan. e. An information and education component used to enhance public understanding of the project and encourage their early and continued participation in selecting, designing, and implementing the nonpoint source management measures that will be implemented. What does this mean? The plan should include an I/E component that identifies the education and outreach activities or actions that will be used to implement the plan. These I/E activities may support the adoption and long-term operation and maintenance of management practices and support stakeholder involvement efforts. f. Schedule for implementing the nonpoint source management measures identified in this plan that is reasonably expeditious.
FINAL Banana River Lagoon Basin Management Action Plan – January 2013
58
What does this mean? You need to include a schedule for implementing the management measures outlined in your watershed plan. The schedule should reflect the milestones you develop in g. g. A description of interim measurable milestones for determining whether nonpoint source management measures or other control actions are being implemented. What does this mean? You’ll develop interim, measurable milestones to measure progress in implementing the management measures for your watershed plan. These milestones will measure the implementation of the management measures, such as whether they are being implemented on schedule, whereas element h (see below) will measure the effectiveness of the management measures, for example, by documenting improvements in water quality. h. A set of criteria that can be used to determine whether loading reductions are being achieved over time and substantial progress is being made toward attaining water quality standards. What does this mean? Using the milestones you developed above, you’ll develop a set of criteria (or indicators) with interim target values to be used to determine whether progress is being made toward reducing pollutant loads. These interim targets can be direct measurements (e.g., fecal coliform concentrations) or indirect indicators of load reduction (e.g., number of beach closings). You must also indicate how you’ll determine whether the watershed plan needs to be revised if interim targets are not met and what process will be used to revise the existing management approach. Where a nonpoint source TMDL has been established, interim targets are also needed to determine whether the TMDL needs to be revised. i. A monitoring component to evaluate the effectiveness of the implementation efforts over time, measured against the criteria established under item h immediately above. What does this mean? The watershed plan must include a monitoring component to determine whether progress is being made toward attainment or maintenance of the applicable water quality standards. The monitoring program must be fully integrated with the established schedule and interim milestone criteria identified above. The monitoring component should be designed to determine whether loading reductions are being achieved over time and substantial progress in meeting water quality standards is being made. Watershed-scale monitoring can be used to measure the effects of multiple programs, projects, and trends over time. Instream monitoring does not have to be conducted for individual BMPs unless that type of monitoring is particularly relevant to the project.
FINAL Banana River Lagoon Basin Management Action Plan – January 2013
59
APPENDIX D: PROCESS TO CONDUCT THE SEAGRASS DEPTH LIMIT COMPLIANCE EVALUATION
The goal of the IRL Basin TMDLs is to recover the deeper seagrass habitats. The seagrass response is the most important factor to evaluate the success of the nutrient TMDLs. Even if the relationship among nutrient loads and seagrass recovery is not as predicted by the regression model, the load reduction requirements themselves will not determine TMDL success. The assessment of success is based on whether the seagrass grow at sufficient depths.
The TMDL seagrass depth limit targets are based on a union coverage of the seagrass mapping data from 1943, 1986, 1989, 1992, 1994, 1996, and 1999. This union coverage was created by the SJRWMD when it set Pollutant Load Reduction Goals (PLRGs) for the IRL Basin. The TMDL targets are not based on a full restoration of seagrass depths represented by this union coverage; instead, the TMDL targets were set at 10% less than full restoration. These targets allow for seagrass growth almost to the depths previously seen in the lagoon, while accounting for the fact that changes have been made to the lagoon system that may limit seagrass growth in some areas.
Compliance with the TMDL seagrass depth limit targets is assessed on a project zone scale using the latest four years of seagrass mapping data. For the BMAP, two separate four-year assessment periods were used in the evaluation: (1) seagrass mapping years 2003, 2005, 2006, and 2007; and (2) seagrass mapping years 2005, 2006, 2007, and 2009. In order for the assessment years to be compliant with the TMDL seagrass depth limit targets, the data must meet the requirements of the two-step evaluation process. The first step is a comparison of the TMDL union coverage cumulative frequency distribution curve to the assessment years’ union cumulative frequency distribution curve. The cumulative distribution curves show what percentage of the seagrass deep edge is located at different depths. To be compliant, at least 50% of the assessment years’ curve, including the median, must be on or to the right of the TMDL curve. The second step in the evaluation process is a comparison of the TMDL union coverage median value to each assessment year’s median value. To be compliant in the second step, at least three of the four assessment year medians must be equal to or greater than the TMDL median. If the seagrass data from the four assessment years are compliant with both steps of the test, the project zone is achieving the TMDL depth limit target.
A series of GIS steps must be conducted to obtain the data necessary to complete the two-step evaluation process, as follows:
• Start with the seagrass GIS shapefiles for the four latest assessment years and edit these files to include only Categories 9113 and 9116, which represent seagrass. Other categories in the GIS shapefiles represent algae cover, which should not be included in this assessment. The seagrass shapefiles only represent the location of the seagrass beds.
• Use the dissolve function in GIS to create the union file of the assessment years. This union file results in a coverage of where seagrass beds were located during all four assessment years.
• Transform the polygons to a polyline in the assessment years’ union file. This polyline represents the edges of the seagrass beds.
FINAL Banana River Lagoon Basin Management Action Plan – January 2013
60
• Use the erase function to remove points within dredged areas from the bathymetry shapefile. The bathymetry shapefile provides the depth information for the lagoon system. The dredged areas are removed from this coverage because seagrasses are not expected to grow in areas that have been dredged.
• Intersect the updated bathymetry shapefile with the seagrass coverage file that was transformed into a polyline. This intersection correlates the depth data with the seagrass locations so that depths along the seagrass bed edge can be determined.
• Draw a 15.8-meter buffer around the seagrass polyline that is 7.9 meters inside and 7.9 meters outside the seagrass bed. The bathymetry layer was created by the SJRWMD in 1996, and the bathymetry was measured every 15.2 meters. The 15.8-meter buffer around the seagrass polyline ensures that 1 bathymetry point will be captured in the GIS analysis.
• Remove points that fall below 0.5 meters and above 3.5 meters from the coverage. This step is needed because seagrasses growing at depths less than 0.5 meters are likely not light limited, and seagrasses are not expected to grow at depths greater than 3.5 meters.
• Remove points from the intersections of holes or bare areas, which do not represent the deep edge of the seagrass bed.
• Clip the resulting deep edge file to each project zone (BRL A, BRL B, North A, North B, Central A, Central SEB, and Central B).
These steps are also followed separately for each assessment year so that the median value can be calculated.
The final points that represent the seagrass deep edge boundary for the assessment years’ union coverage are then exported from GIS into Excel to conduct the two-step evaluation. The depths points are sorted from highest to lowest, and the count of the number of points at each depth is determined. The cumulative count is determined by taking the count for the shallowest depth and adding it to the count for the next shallowest point until the counts for all the depths are added together to yield the total number of depth points. The cumulative count at each depth is divided by the total points to determine the percentage of the seagrass points at each depth. These points are then plotted as a curve on a graph for comparison with the TMDL cumulative distribution curve. For the Step 2 evaluation, the median depth point is calculated for each assessment year using Excel. These medians are then compared with the TMDL median to determine compliance.
As noted in Chapter 2, the BRL A project zone was compliant with the Step 1 and Step 2 evaluations, and the BRL B project zone was noncompliant. Therefore, the TMDL seagrass depth limit target is being achieved in the BRL A project zone based on the latest four seagrass mapping years, and the stakeholders in that project zone do not have to make reductions in this first BMAP iteration. However, the BRL B project zone is not meeting the seagrass depth limit target, and the stakeholders in this project zone were required to make reductions in this first iteration of the BRL BMAP.
FINAL Banana River Lagoon Basin Management Action Plan – January 2013
61
APPENDIX E: PROJECTS TO ACHIEVE THE TMDL For the BRL A project zone, the projects completed by the stakeholders that helped to achieve the TMDL seagrass depth limit target are included below. Any future projects listed in the tables are not a BMAP requirement because the seagrass depth limit targets for the BRL A project zone have been achieved based on the latest seagrass evaluation. The tables provide information on the nutrient reduction attributed to each individual project, shown in pounds per year (lbs/yr).
For the BRL B project zone, the projects and time frames for implementation submitted by the entities to achieve their TMDL allocations for the first iteration of the BMAP are summarized in the tables below. The tables provide information on the nutrient reduction attributed to each individual project, shown in lbs/yr. These projects were submitted to provide reasonable assurance to FDEP that each entity has a plan on how it will meet its allocation; however, this list of projects is meant to be flexible enough to allow for changes that may occur over time, provided that the reduction is still met within the specified time frame. Notes: N/A = Not applicable O&M = Operation and maintenance - = Empty cell/no data
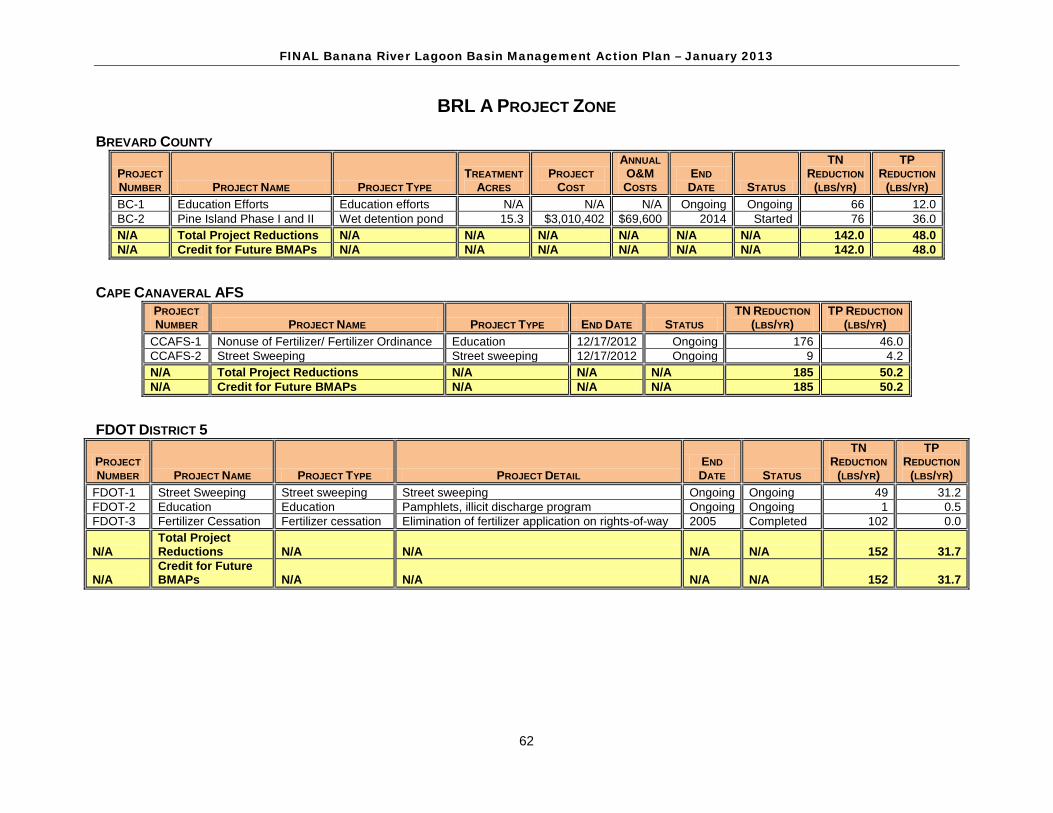
FINAL Banana River Lagoon Basin Management Action Plan – January 2013
62
BRL A PROJECT ZONE BREVARD COUNTY
PROJECT NUMBER PROJECT NAME PROJECT TYPE
TREATMENT ACRES
PROJECT COST
ANNUAL O&M COSTS
END DATE STATUS
TN REDUCTION
(LBS/YR)
TP REDUCTION
(LBS/YR) BC-1 Education Efforts Education efforts N/A N/A N/A Ongoing Ongoing 66 12.0 BC-2 Pine Island Phase I and II Wet detention pond 15.3 $3,010,402 $69,600 2014 Started 76 36.0 N/A Total Project Reductions N/A N/A N/A N/A N/A N/A 142.0 48.0 N/A Credit for Future BMAPs N/A N/A N/A N/A N/A N/A 142.0 48.0
CAPE CANAVERAL AFS
PROJECT NUMBER PROJECT NAME PROJECT TYPE END DATE STATUS
TN REDUCTION (LBS/YR)
TP REDUCTION (LBS/YR)
CCAFS-1 Nonuse of Fertilizer/ Fertilizer Ordinance Education 12/17/2012 Ongoing 176 46.0 CCAFS-2 Street Sweeping Street sweeping 12/17/2012 Ongoing 9 4.2 N/A Total Project Reductions N/A N/A N/A 185 50.2 N/A Credit for Future BMAPs N/A N/A N/A 185 50.2
FDOT DISTRICT 5
PROJECT NUMBER PROJECT NAME PROJECT TYPE PROJECT DETAIL
END DATE STATUS
TN REDUCTION
(LBS/YR)
TP REDUCTION
(LBS/YR) FDOT-1 Street Sweeping Street sweeping Street sweeping Ongoing Ongoing 49 31.2 FDOT-2 Education Education Pamphlets, illicit discharge program Ongoing Ongoing 1 0.5 FDOT-3 Fertilizer Cessation Fertilizer cessation Elimination of fertilizer application on rights-of-way 2005 Completed 102 0.0
N/A Total Project Reductions N/A N/A N/A N/A 152 31.7
N/A Credit for Future BMAPs N/A N/A N/A N/A 152 31.7
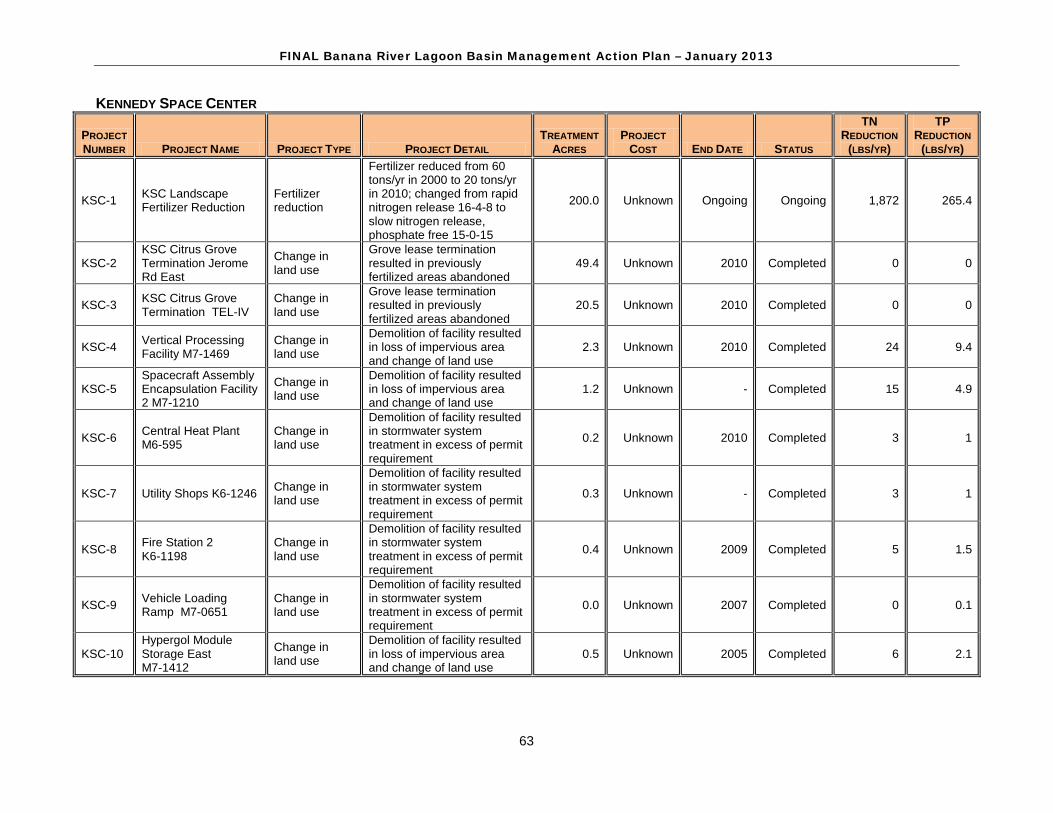
FINAL Banana River Lagoon Basin Management Action Plan – January 2013
63
KENNEDY SPACE CENTER
PROJECT NUMBER PROJECT NAME PROJECT TYPE PROJECT DETAIL
TREATMENT ACRES
PROJECT COST END DATE STATUS
TN REDUCTION
(LBS/YR)
TP REDUCTION
(LBS/YR)
KSC-1 KSC Landscape Fertilizer Reduction
Fertilizer reduction
Fertilizer reduced from 60 tons/yr in 2000 to 20 tons/yr in 2010; changed from rapid nitrogen release 16-4-8 to slow nitrogen release, phosphate free 15-0-15
200.0 Unknown Ongoing Ongoing 1,872 265.4
KSC-2 KSC Citrus Grove Termination Jerome Rd East
Change in land use
Grove lease termination resulted in previously fertilized areas abandoned
49.4 Unknown 2010 Completed 0 0
KSC-3 KSC Citrus Grove Termination TEL-IV
Change in land use
Grove lease termination resulted in previously fertilized areas abandoned
20.5 Unknown 2010 Completed 0 0
KSC-4 Vertical Processing Facility M7-1469
Change in land use
Demolition of facility resulted in loss of impervious area and change of land use
2.3 Unknown 2010 Completed 24 9.4
KSC-5 Spacecraft Assembly Encapsulation Facility 2 M7-1210
Change in land use
Demolition of facility resulted in loss of impervious area and change of land use
1.2 Unknown - Completed 15 4.9
KSC-6 Central Heat Plant M6-595
Change in land use
Demolition of facility resulted in stormwater system treatment in excess of permit requirement
0.2 Unknown 2010 Completed 3 1
KSC-7 Utility Shops K6-1246 Change in land use
Demolition of facility resulted in stormwater system treatment in excess of permit requirement
0.3 Unknown - Completed 3 1
KSC-8 Fire Station 2 K6-1198
Change in land use
Demolition of facility resulted in stormwater system treatment in excess of permit requirement
0.4 Unknown 2009 Completed 5 1.5
KSC-9 Vehicle Loading Ramp M7-0651
Change in land use
Demolition of facility resulted in stormwater system treatment in excess of permit requirement
0.0 Unknown 2007 Completed 0 0.1
KSC-10 Hypergol Module Storage East M7-1412
Change in land use
Demolition of facility resulted in loss of impervious area and change of land use
0.5 Unknown 2005 Completed 6 2.1
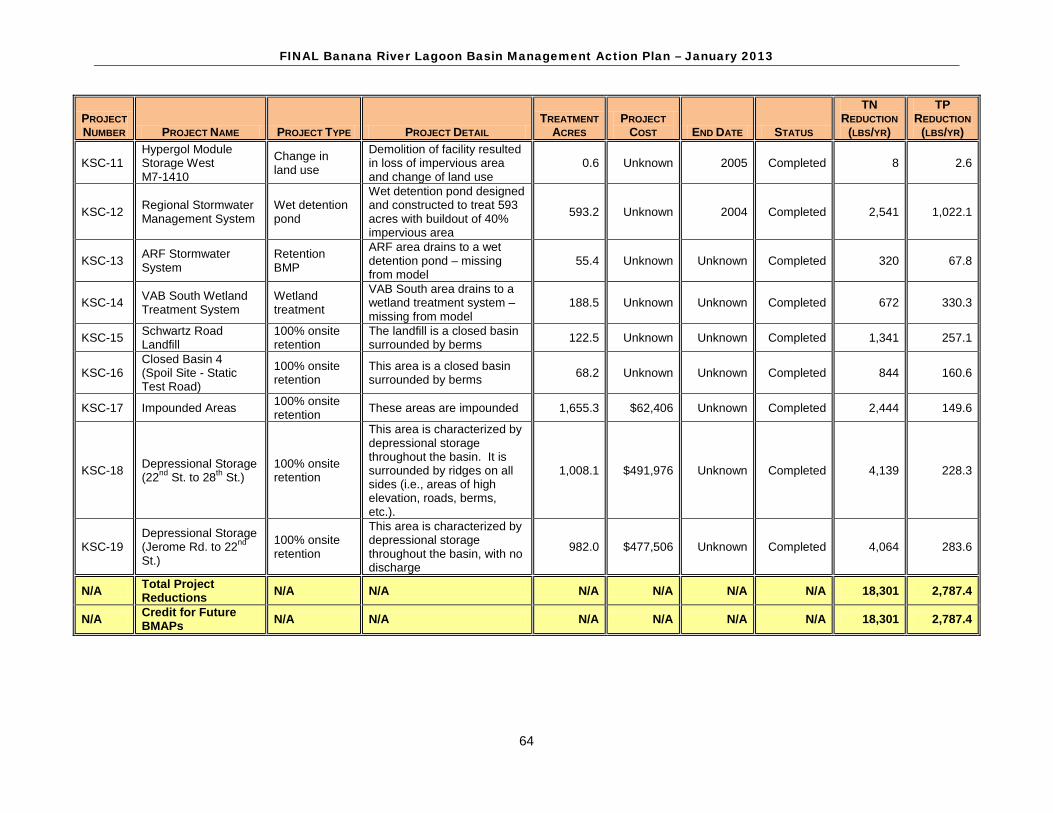
FINAL Banana River Lagoon Basin Management Action Plan – January 2013
64
PROJECT NUMBER PROJECT NAME PROJECT TYPE PROJECT DETAIL
TREATMENT ACRES
PROJECT COST END DATE STATUS
TN REDUCTION
(LBS/YR)
TP REDUCTION
(LBS/YR)
KSC-11 Hypergol Module Storage West M7-1410
Change in land use
Demolition of facility resulted in loss of impervious area and change of land use
0.6 Unknown 2005 Completed 8 2.6
KSC-12 Regional Stormwater Management System
Wet detention pond
Wet detention pond designed and constructed to treat 593 acres with buildout of 40% impervious area
593.2 Unknown 2004 Completed 2,541 1,022.1
KSC-13 ARF Stormwater System
Retention BMP
ARF area drains to a wet detention pond – missing from model
55.4 Unknown Unknown Completed 320 67.8
KSC-14 VAB South Wetland Treatment System
Wetland treatment
VAB South area drains to a wetland treatment system – missing from model
188.5 Unknown Unknown Completed 672 330.3
KSC-15 Schwartz Road Landfill
100% onsite retention
The landfill is a closed basin surrounded by berms 122.5 Unknown Unknown Completed 1,341 257.1
KSC-16 Closed Basin 4 (Spoil Site - Static Test Road)
100% onsite retention
This area is a closed basin surrounded by berms 68.2 Unknown Unknown Completed 844 160.6
KSC-17 Impounded Areas 100% onsite retention These areas are impounded 1,655.3 $62,406 Unknown Completed 2,444 149.6
KSC-18 Depressional Storage (22nd St. to 28th St.)
100% onsite retention
This area is characterized by depressional storage throughout the basin. It is surrounded by ridges on all sides (i.e., areas of high elevation, roads, berms, etc.).
1,008.1 $491,976 Unknown Completed 4,139 228.3
KSC-19 Depressional Storage (Jerome Rd. to 22nd St.)
100% onsite retention
This area is characterized by depressional storage throughout the basin, with no discharge
982.0 $477,506 Unknown Completed 4,064 283.6
N/A Total Project Reductions N/A N/A N/A N/A N/A N/A 18,301 2,787.4
N/A Credit for Future BMAPs N/A N/A N/A N/A N/A N/A 18,301 2,787.4
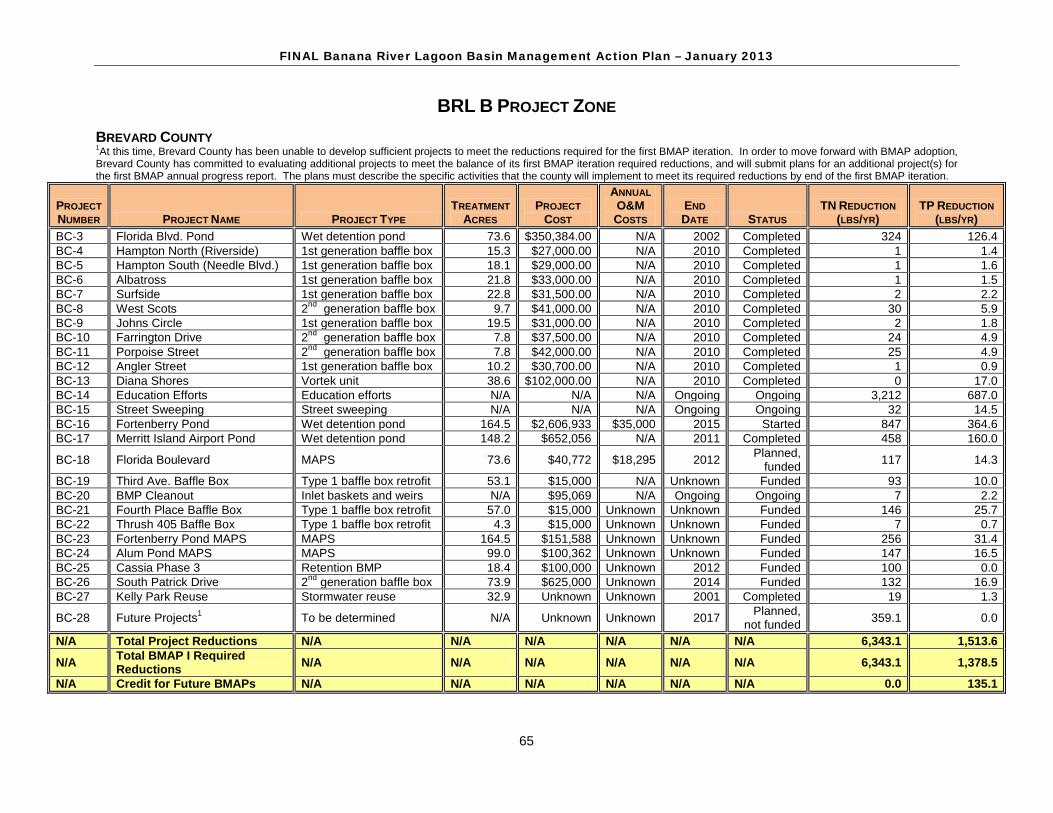
FINAL Banana River Lagoon Basin Management Action Plan – January 2013
65
BRL B PROJECT ZONE BREVARD COUNTY 1At this time, Brevard County has been unable to develop sufficient projects to meet the reductions required for the first BMAP iteration. In order to move forward with BMAP adoption, Brevard County has committed to evaluating additional projects to meet the balance of its first BMAP iteration required reductions, and will submit plans for an additional project(s) for the first BMAP annual progress report. The plans must describe the specific activities that the county will implement to meet its required reductions by end of the first BMAP iteration.
PROJECT NUMBER PROJECT NAME PROJECT TYPE
TREATMENT ACRES
PROJECT COST
ANNUAL O&M COSTS
END DATE STATUS
TN REDUCTION (LBS/YR)
TP REDUCTION (LBS/YR)
BC-3 Florida Blvd. Pond Wet detention pond 73.6 $350,384.00 N/A 2002 Completed 324 126.4 BC-4 Hampton North (Riverside) 1st generation baffle box 15.3 $27,000.00 N/A 2010 Completed 1 1.4 BC-5 Hampton South (Needle Blvd.) 1st generation baffle box 18.1 $29,000.00 N/A 2010 Completed 1 1.6 BC-6 Albatross 1st generation baffle box 21.8 $33,000.00 N/A 2010 Completed 1 1.5 BC-7 Surfside 1st generation baffle box 22.8 $31,500.00 N/A 2010 Completed 2 2.2 BC-8 West Scots 2nd generation baffle box 9.7 $41,000.00 N/A 2010 Completed 30 5.9 BC-9 Johns Circle 1st generation baffle box 19.5 $31,000.00 N/A 2010 Completed 2 1.8 BC-10 Farrington Drive 2nd generation baffle box 7.8 $37,500.00 N/A 2010 Completed 24 4.9 BC-11 Porpoise Street 2nd generation baffle box 7.8 $42,000.00 N/A 2010 Completed 25 4.9 BC-12 Angler Street 1st generation baffle box 10.2 $30,700.00 N/A 2010 Completed 1 0.9 BC-13 Diana Shores Vortek unit 38.6 $102,000.00 N/A 2010 Completed 0 17.0 BC-14 Education Efforts Education efforts N/A N/A N/A Ongoing Ongoing 3,212 687.0 BC-15 Street Sweeping Street sweeping N/A N/A N/A Ongoing Ongoing 32 14.5 BC-16 Fortenberry Pond Wet detention pond 164.5 $2,606,933 $35,000 2015 Started 847 364.6 BC-17 Merritt Island Airport Pond Wet detention pond 148.2 $652,056 N/A 2011 Completed 458 160.0
BC-18 Florida Boulevard MAPS 73.6 $40,772 $18,295 2012 Planned, funded 117 14.3
BC-19 Third Ave. Baffle Box Type 1 baffle box retrofit 53.1 $15,000 N/A Unknown Funded 93 10.0 BC-20 BMP Cleanout Inlet baskets and weirs N/A $95,069 N/A Ongoing Ongoing 7 2.2 BC-21 Fourth Place Baffle Box Type 1 baffle box retrofit 57.0 $15,000 Unknown Unknown Funded 146 25.7 BC-22 Thrush 405 Baffle Box Type 1 baffle box retrofit 4.3 $15,000 Unknown Unknown Funded 7 0.7 BC-23 Fortenberry Pond MAPS MAPS 164.5 $151,588 Unknown Unknown Funded 256 31.4 BC-24 Alum Pond MAPS MAPS 99.0 $100,362 Unknown Unknown Funded 147 16.5 BC-25 Cassia Phase 3 Retention BMP 18.4 $100,000 Unknown 2012 Funded 100 0.0 BC-26 South Patrick Drive 2nd generation baffle box 73.9 $625,000 Unknown 2014 Funded 132 16.9 BC-27 Kelly Park Reuse Stormwater reuse 32.9 Unknown Unknown 2001 Completed 19 1.3
BC-28 Future Projects1 To be determined N/A Unknown Unknown 2017 Planned, not funded 359.1 0.0
N/A Total Project Reductions N/A N/A N/A N/A N/A N/A 6,343.1 1,513.6
N/A Total BMAP I Required Reductions N/A N/A N/A N/A N/A N/A 6,343.1 1,378.5
N/A Credit for Future BMAPs N/A N/A N/A N/A N/A N/A 0.0 135.1
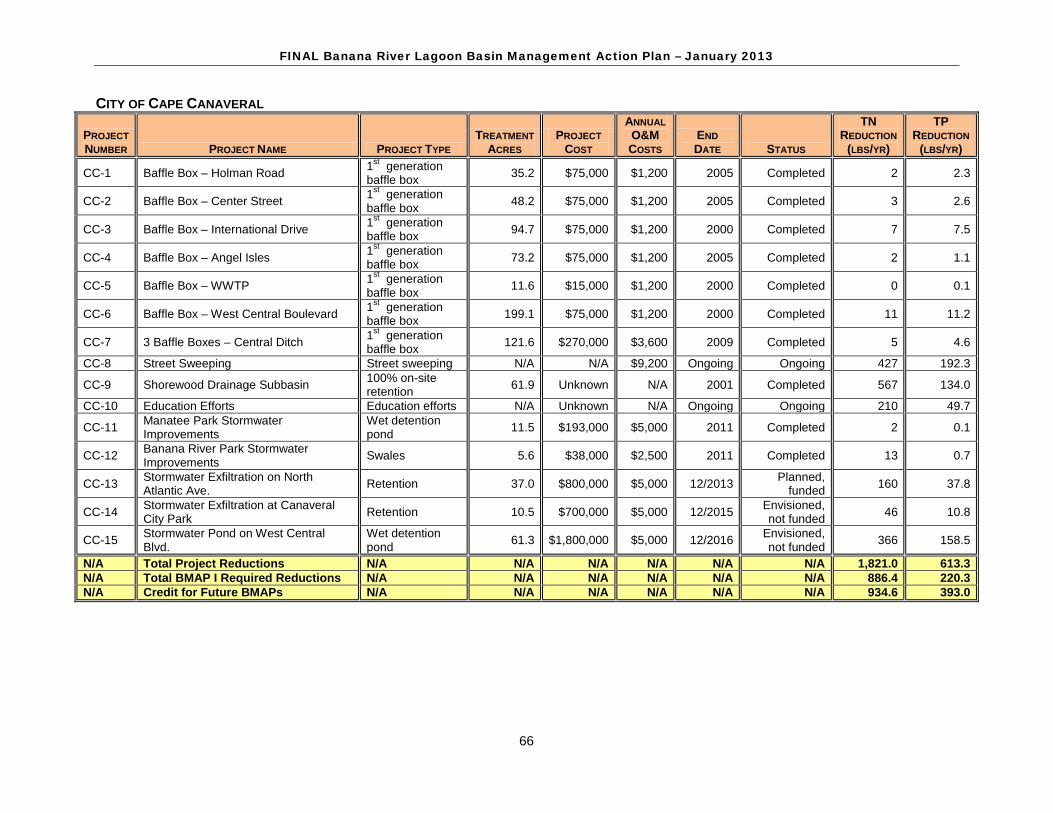
FINAL Banana River Lagoon Basin Management Action Plan – January 2013
66
CITY OF CAPE CANAVERAL
PROJECT NUMBER PROJECT NAME PROJECT TYPE
TREATMENT ACRES
PROJECT COST
ANNUAL O&M COSTS
END DATE STATUS
TN REDUCTION
(LBS/YR)
TP REDUCTION
(LBS/YR)
CC-1 Baffle Box – Holman Road 1st generation baffle box 35.2 $75,000 $1,200 2005 Completed 2 2.3
CC-2 Baffle Box – Center Street 1st generation baffle box 48.2 $75,000 $1,200 2005 Completed 3 2.6
CC-3 Baffle Box – International Drive 1st generation baffle box 94.7 $75,000 $1,200 2000 Completed 7 7.5
CC-4 Baffle Box – Angel Isles 1st generation baffle box 73.2 $75,000 $1,200 2005 Completed 2 1.1
CC-5 Baffle Box – WWTP 1st generation baffle box 11.6 $15,000 $1,200 2000 Completed 0 0.1
CC-6 Baffle Box – West Central Boulevard 1st generation baffle box 199.1 $75,000 $1,200 2000 Completed 11 11.2
CC-7 3 Baffle Boxes – Central Ditch 1st generation baffle box 121.6 $270,000 $3,600 2009 Completed 5 4.6
CC-8 Street Sweeping Street sweeping N/A N/A $9,200 Ongoing Ongoing 427 192.3
CC-9 Shorewood Drainage Subbasin 100% on-site retention 61.9 Unknown N/A 2001 Completed 567 134.0
CC-10 Education Efforts Education efforts N/A Unknown N/A Ongoing Ongoing 210 49.7
CC-11 Manatee Park Stormwater Improvements
Wet detention pond 11.5 $193,000 $5,000 2011 Completed 2 0.1
CC-12 Banana River Park Stormwater Improvements Swales 5.6 $38,000 $2,500 2011 Completed 13 0.7
CC-13 Stormwater Exfiltration on North Atlantic Ave. Retention 37.0 $800,000 $5,000 12/2013 Planned,
funded 160 37.8
CC-14 Stormwater Exfiltration at Canaveral City Park Retention 10.5 $700,000 $5,000 12/2015 Envisioned,
not funded 46 10.8
CC-15 Stormwater Pond on West Central Blvd.
Wet detention pond 61.3 $1,800,000 $5,000 12/2016 Envisioned,
not funded 366 158.5
N/A Total Project Reductions N/A N/A N/A N/A N/A N/A 1,821.0 613.3 N/A Total BMAP I Required Reductions N/A N/A N/A N/A N/A N/A 886.4 220.3 N/A Credit for Future BMAPs N/A N/A N/A N/A N/A N/A 934.6 393.0
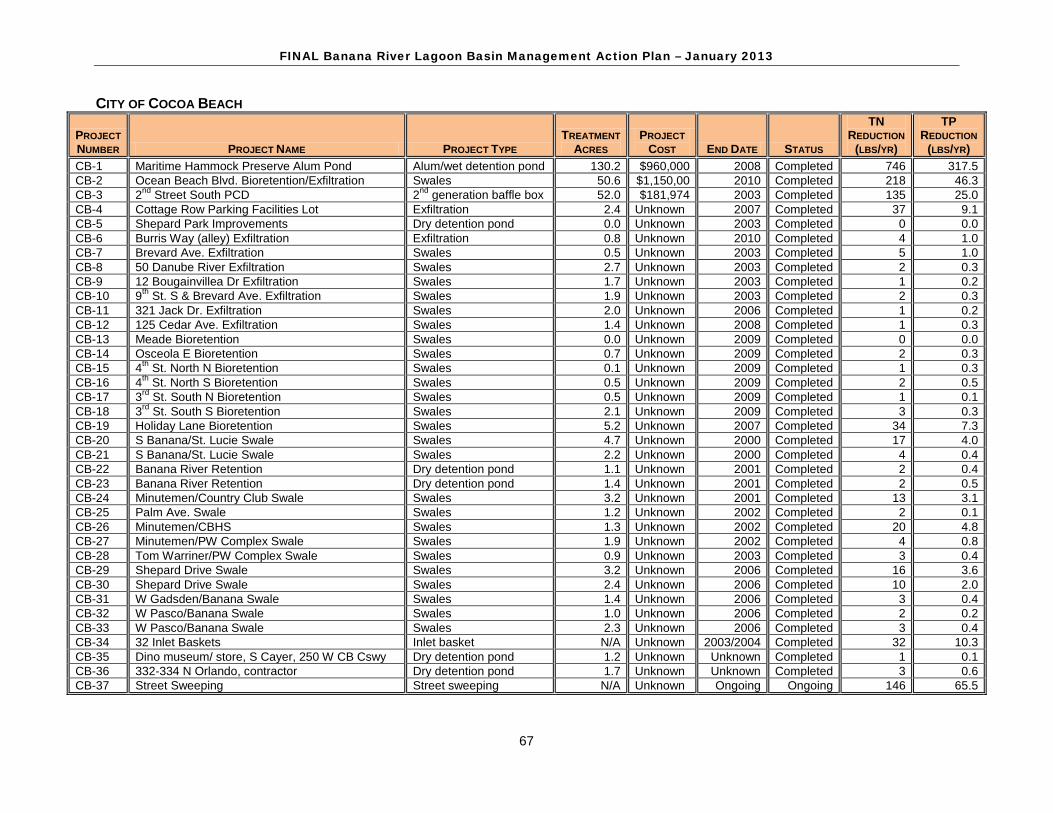
FINAL Banana River Lagoon Basin Management Action Plan – January 2013
67
CITY OF COCOA BEACH
PROJECT NUMBER PROJECT NAME PROJECT TYPE
TREATMENT ACRES
PROJECT COST END DATE STATUS
TN REDUCTION
(LBS/YR)
TP REDUCTION
(LBS/YR) CB-1 Maritime Hammock Preserve Alum Pond Alum/wet detention pond 130.2 $960,000 2008 Completed 746 317.5 CB-2 Ocean Beach Blvd. Bioretention/Exfiltration Swales 50.6 $1,150,00 2010 Completed 218 46.3 CB-3 2nd Street South PCD 2nd generation baffle box 52.0 $181,974 2003 Completed 135 25.0 CB-4 Cottage Row Parking Facilities Lot Exfiltration 2.4 Unknown 2007 Completed 37 9.1 CB-5 Shepard Park Improvements Dry detention pond 0.0 Unknown 2003 Completed 0 0.0 CB-6 Burris Way (alley) Exfiltration Exfiltration 0.8 Unknown 2010 Completed 4 1.0 CB-7 Brevard Ave. Exfiltration Swales 0.5 Unknown 2003 Completed 5 1.0 CB-8 50 Danube River Exfiltration Swales 2.7 Unknown 2003 Completed 2 0.3 CB-9 12 Bougainvillea Dr Exfiltration Swales 1.7 Unknown 2003 Completed 1 0.2 CB-10 9th St. S & Brevard Ave. Exfiltration Swales 1.9 Unknown 2003 Completed 2 0.3 CB-11 321 Jack Dr. Exfiltration Swales 2.0 Unknown 2006 Completed 1 0.2 CB-12 125 Cedar Ave. Exfiltration Swales 1.4 Unknown 2008 Completed 1 0.3 CB-13 Meade Bioretention Swales 0.0 Unknown 2009 Completed 0 0.0 CB-14 Osceola E Bioretention Swales 0.7 Unknown 2009 Completed 2 0.3 CB-15 4th St. North N Bioretention Swales 0.1 Unknown 2009 Completed 1 0.3 CB-16 4th St. North S Bioretention Swales 0.5 Unknown 2009 Completed 2 0.5 CB-17 3rd St. South N Bioretention Swales 0.5 Unknown 2009 Completed 1 0.1 CB-18 3rd St. South S Bioretention Swales 2.1 Unknown 2009 Completed 3 0.3 CB-19 Holiday Lane Bioretention Swales 5.2 Unknown 2007 Completed 34 7.3 CB-20 S Banana/St. Lucie Swale Swales 4.7 Unknown 2000 Completed 17 4.0 CB-21 S Banana/St. Lucie Swale Swales 2.2 Unknown 2000 Completed 4 0.4 CB-22 Banana River Retention Dry detention pond 1.1 Unknown 2001 Completed 2 0.4 CB-23 Banana River Retention Dry detention pond 1.4 Unknown 2001 Completed 2 0.5 CB-24 Minutemen/Country Club Swale Swales 3.2 Unknown 2001 Completed 13 3.1 CB-25 Palm Ave. Swale Swales 1.2 Unknown 2002 Completed 2 0.1 CB-26 Minutemen/CBHS Swales 1.3 Unknown 2002 Completed 20 4.8 CB-27 Minutemen/PW Complex Swale Swales 1.9 Unknown 2002 Completed 4 0.8 CB-28 Tom Warriner/PW Complex Swale Swales 0.9 Unknown 2003 Completed 3 0.4 CB-29 Shepard Drive Swale Swales 3.2 Unknown 2006 Completed 16 3.6 CB-30 Shepard Drive Swale Swales 2.4 Unknown 2006 Completed 10 2.0 CB-31 W Gadsden/Banana Swale Swales 1.4 Unknown 2006 Completed 3 0.4 CB-32 W Pasco/Banana Swale Swales 1.0 Unknown 2006 Completed 2 0.2 CB-33 W Pasco/Banana Swale Swales 2.3 Unknown 2006 Completed 3 0.4 CB-34 32 Inlet Baskets Inlet basket N/A Unknown 2003/2004 Completed 32 10.3 CB-35 Dino museum/ store, S Cayer, 250 W CB Cswy Dry detention pond 1.2 Unknown Unknown Completed 1 0.1 CB-36 332-334 N Orlando, contractor Dry detention pond 1.7 Unknown Unknown Completed 3 0.6 CB-37 Street Sweeping Street sweeping N/A Unknown Ongoing Ongoing 146 65.5
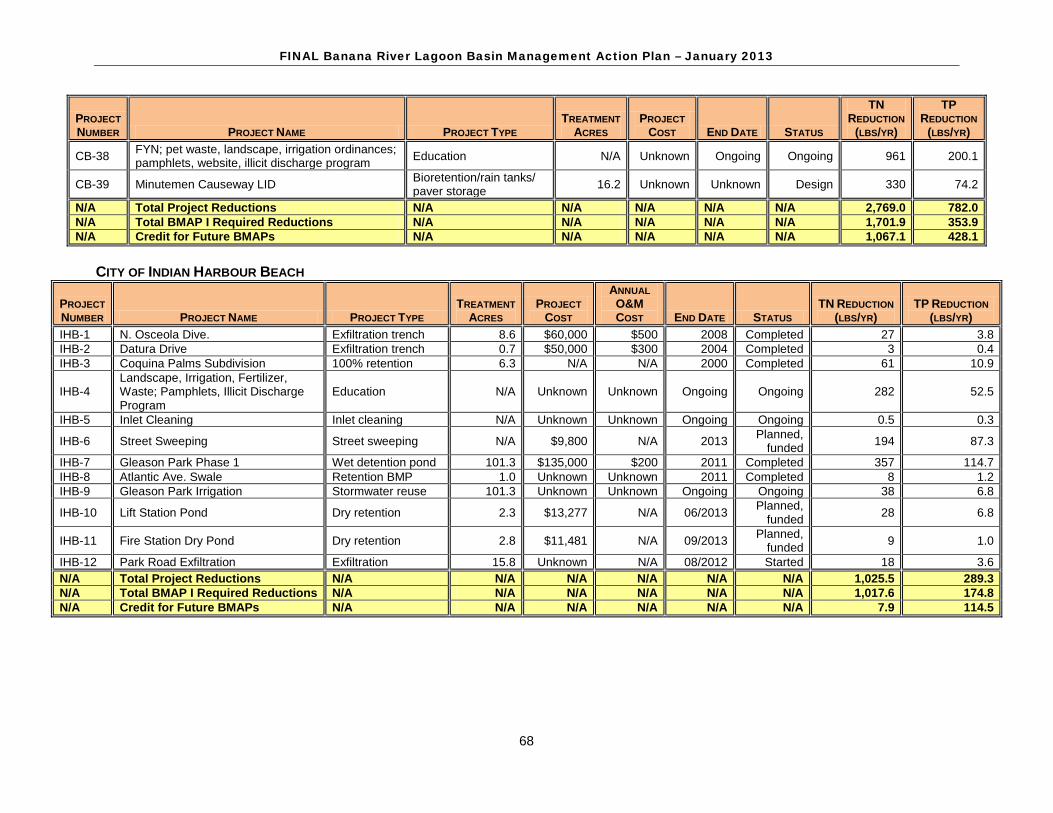
FINAL Banana River Lagoon Basin Management Action Plan – January 2013
68
PROJECT NUMBER PROJECT NAME PROJECT TYPE
TREATMENT ACRES
PROJECT COST END DATE STATUS
TN REDUCTION
(LBS/YR)
TP REDUCTION
(LBS/YR)
CB-38 FYN; pet waste, landscape, irrigation ordinances; pamphlets, website, illicit discharge program Education N/A Unknown Ongoing Ongoing 961 200.1
CB-39 Minutemen Causeway LID Bioretention/rain tanks/ paver storage 16.2 Unknown Unknown Design 330 74.2
N/A Total Project Reductions N/A N/A N/A N/A N/A 2,769.0 782.0 N/A Total BMAP I Required Reductions N/A N/A N/A N/A N/A 1,701.9 353.9 N/A Credit for Future BMAPs N/A N/A N/A N/A N/A 1,067.1 428.1
CITY OF INDIAN HARBOUR BEACH
PROJECT NUMBER PROJECT NAME PROJECT TYPE
TREATMENT ACRES
PROJECT COST
ANNUAL O&M COST END DATE STATUS
TN REDUCTION (LBS/YR)
TP REDUCTION (LBS/YR)
IHB-1 N. Osceola Dive. Exfiltration trench 8.6 $60,000 $500 2008 Completed 27 3.8 IHB-2 Datura Drive Exfiltration trench 0.7 $50,000 $300 2004 Completed 3 0.4 IHB-3 Coquina Palms Subdivision 100% retention 6.3 N/A N/A 2000 Completed 61 10.9
IHB-4 Landscape, Irrigation, Fertilizer, Waste; Pamphlets, Illicit Discharge Program
Education N/A Unknown Unknown Ongoing Ongoing 282 52.5
IHB-5 Inlet Cleaning Inlet cleaning N/A Unknown Unknown Ongoing Ongoing 0.5 0.3
IHB-6 Street Sweeping Street sweeping N/A $9,800 N/A 2013 Planned, funded 194 87.3
IHB-7 Gleason Park Phase 1 Wet detention pond 101.3 $135,000 $200 2011 Completed 357 114.7 IHB-8 Atlantic Ave. Swale Retention BMP 1.0 Unknown Unknown 2011 Completed 8 1.2 IHB-9 Gleason Park Irrigation Stormwater reuse 101.3 Unknown Unknown Ongoing Ongoing 38 6.8
IHB-10 Lift Station Pond Dry retention 2.3 $13,277 N/A 06/2013 Planned, funded 28 6.8
IHB-11 Fire Station Dry Pond Dry retention 2.8 $11,481 N/A 09/2013 Planned, funded 9 1.0
IHB-12 Park Road Exfiltration Exfiltration 15.8 Unknown N/A 08/2012 Started 18 3.6 N/A Total Project Reductions N/A N/A N/A N/A N/A N/A 1,025.5 289.3 N/A Total BMAP I Required Reductions N/A N/A N/A N/A N/A N/A 1,017.6 174.8 N/A Credit for Future BMAPs N/A N/A N/A N/A N/A N/A 7.9 114.5
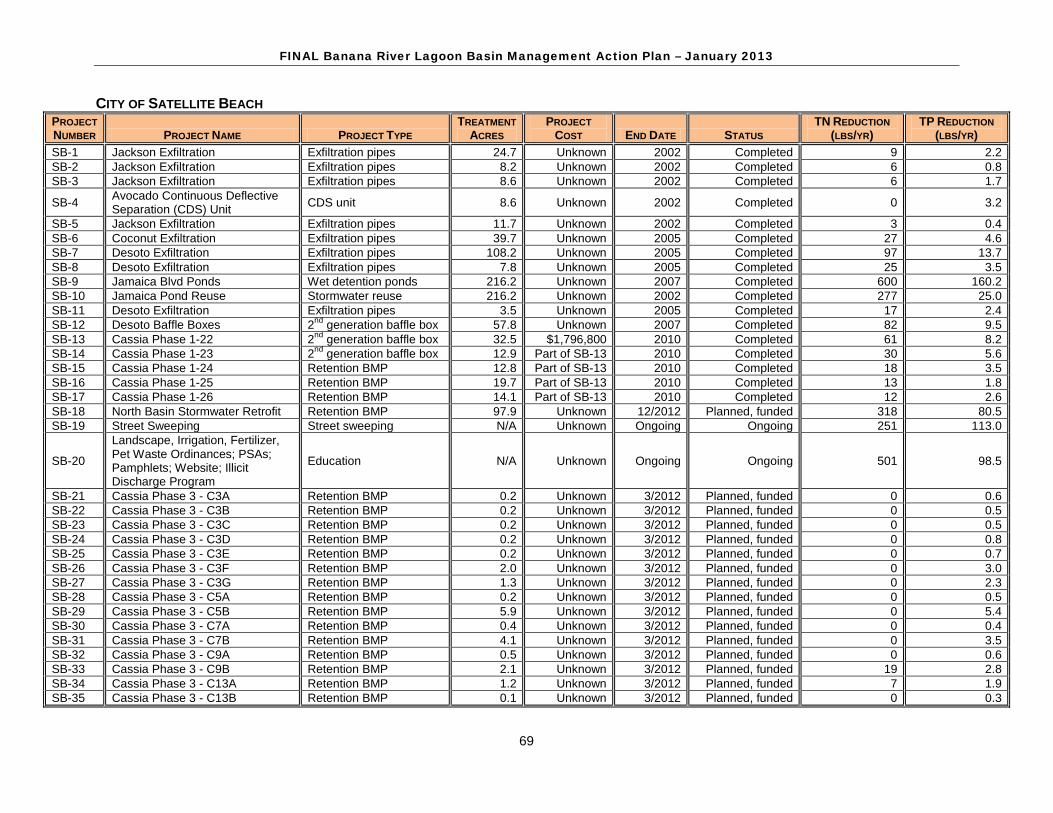
FINAL Banana River Lagoon Basin Management Action Plan – January 2013
69
CITY OF SATELLITE BEACH PROJECT NUMBER PROJECT NAME PROJECT TYPE
TREATMENT ACRES
PROJECT COST END DATE STATUS
TN REDUCTION (LBS/YR)
TP REDUCTION (LBS/YR)
SB-1 Jackson Exfiltration Exfiltration pipes 24.7 Unknown 2002 Completed 9 2.2 SB-2 Jackson Exfiltration Exfiltration pipes 8.2 Unknown 2002 Completed 6 0.8 SB-3 Jackson Exfiltration Exfiltration pipes 8.6 Unknown 2002 Completed 6 1.7
SB-4 Avocado Continuous Deflective Separation (CDS) Unit CDS unit 8.6 Unknown 2002 Completed 0 3.2
SB-5 Jackson Exfiltration Exfiltration pipes 11.7 Unknown 2002 Completed 3 0.4 SB-6 Coconut Exfiltration Exfiltration pipes 39.7 Unknown 2005 Completed 27 4.6 SB-7 Desoto Exfiltration Exfiltration pipes 108.2 Unknown 2005 Completed 97 13.7 SB-8 Desoto Exfiltration Exfiltration pipes 7.8 Unknown 2005 Completed 25 3.5 SB-9 Jamaica Blvd Ponds Wet detention ponds 216.2 Unknown 2007 Completed 600 160.2 SB-10 Jamaica Pond Reuse Stormwater reuse 216.2 Unknown 2002 Completed 277 25.0 SB-11 Desoto Exfiltration Exfiltration pipes 3.5 Unknown 2005 Completed 17 2.4 SB-12 Desoto Baffle Boxes 2nd generation baffle box 57.8 Unknown 2007 Completed 82 9.5 SB-13 Cassia Phase 1-22 2nd generation baffle box 32.5 $1,796,800 2010 Completed 61 8.2 SB-14 Cassia Phase 1-23 2nd generation baffle box 12.9 Part of SB-13 2010 Completed 30 5.6 SB-15 Cassia Phase 1-24 Retention BMP 12.8 Part of SB-13 2010 Completed 18 3.5 SB-16 Cassia Phase 1-25 Retention BMP 19.7 Part of SB-13 2010 Completed 13 1.8 SB-17 Cassia Phase 1-26 Retention BMP 14.1 Part of SB-13 2010 Completed 12 2.6 SB-18 North Basin Stormwater Retrofit Retention BMP 97.9 Unknown 12/2012 Planned, funded 318 80.5 SB-19 Street Sweeping Street sweeping N/A Unknown Ongoing Ongoing 251 113.0
SB-20
Landscape, Irrigation, Fertilizer, Pet Waste Ordinances; PSAs; Pamphlets; Website; Illicit Discharge Program
Education N/A Unknown Ongoing Ongoing 501 98.5
SB-21 Cassia Phase 3 - C3A Retention BMP 0.2 Unknown 3/2012 Planned, funded 0 0.6 SB-22 Cassia Phase 3 - C3B Retention BMP 0.2 Unknown 3/2012 Planned, funded 0 0.5 SB-23 Cassia Phase 3 - C3C Retention BMP 0.2 Unknown 3/2012 Planned, funded 0 0.5 SB-24 Cassia Phase 3 - C3D Retention BMP 0.2 Unknown 3/2012 Planned, funded 0 0.8 SB-25 Cassia Phase 3 - C3E Retention BMP 0.2 Unknown 3/2012 Planned, funded 0 0.7 SB-26 Cassia Phase 3 - C3F Retention BMP 2.0 Unknown 3/2012 Planned, funded 0 3.0 SB-27 Cassia Phase 3 - C3G Retention BMP 1.3 Unknown 3/2012 Planned, funded 0 2.3 SB-28 Cassia Phase 3 - C5A Retention BMP 0.2 Unknown 3/2012 Planned, funded 0 0.5 SB-29 Cassia Phase 3 - C5B Retention BMP 5.9 Unknown 3/2012 Planned, funded 0 5.4 SB-30 Cassia Phase 3 - C7A Retention BMP 0.4 Unknown 3/2012 Planned, funded 0 0.4 SB-31 Cassia Phase 3 - C7B Retention BMP 4.1 Unknown 3/2012 Planned, funded 0 3.5 SB-32 Cassia Phase 3 - C9A Retention BMP 0.5 Unknown 3/2012 Planned, funded 0 0.6 SB-33 Cassia Phase 3 - C9B Retention BMP 2.1 Unknown 3/2012 Planned, funded 19 2.8 SB-34 Cassia Phase 3 - C13A Retention BMP 1.2 Unknown 3/2012 Planned, funded 7 1.9 SB-35 Cassia Phase 3 - C13B Retention BMP 0.1 Unknown 3/2012 Planned, funded 0 0.3
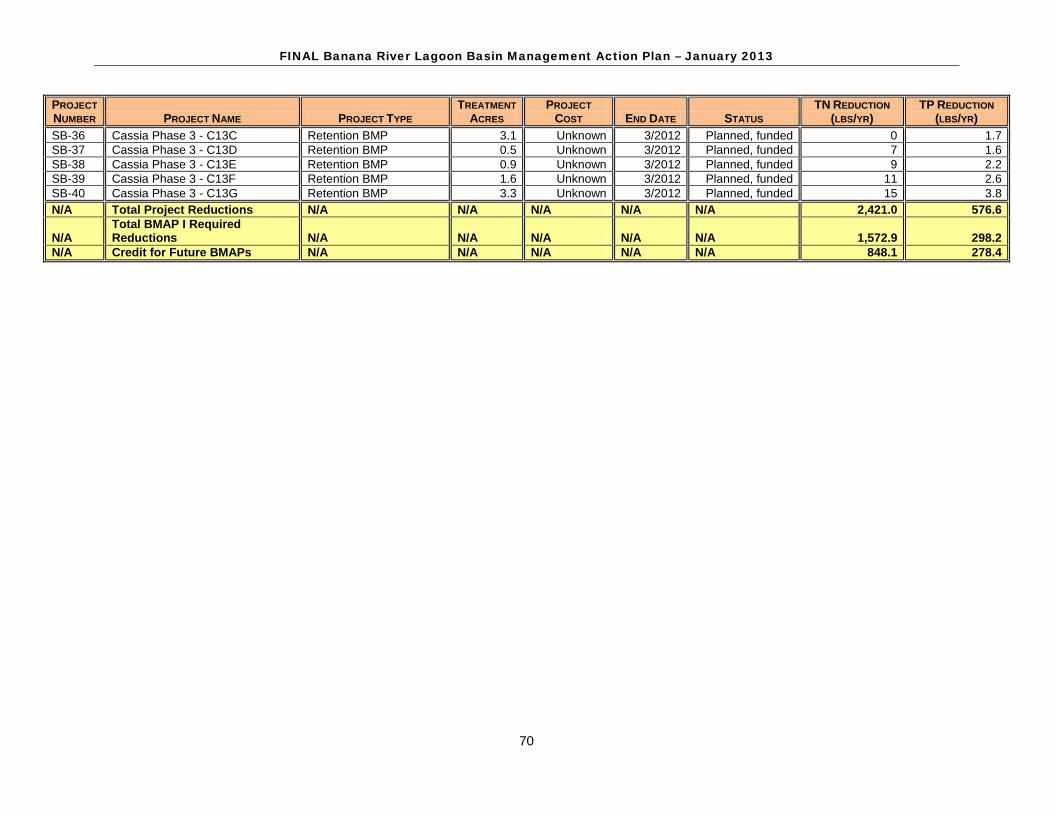
FINAL Banana River Lagoon Basin Management Action Plan – January 2013
70
PROJECT NUMBER PROJECT NAME PROJECT TYPE
TREATMENT ACRES
PROJECT COST END DATE STATUS
TN REDUCTION (LBS/YR)
TP REDUCTION (LBS/YR)
SB-36 Cassia Phase 3 - C13C Retention BMP 3.1 Unknown 3/2012 Planned, funded 0 1.7 SB-37 Cassia Phase 3 - C13D Retention BMP 0.5 Unknown 3/2012 Planned, funded 7 1.6 SB-38 Cassia Phase 3 - C13E Retention BMP 0.9 Unknown 3/2012 Planned, funded 9 2.2 SB-39 Cassia Phase 3 - C13F Retention BMP 1.6 Unknown 3/2012 Planned, funded 11 2.6 SB-40 Cassia Phase 3 - C13G Retention BMP 3.3 Unknown 3/2012 Planned, funded 15 3.8 N/A Total Project Reductions N/A N/A N/A N/A N/A 2,421.0 576.6
N/A Total BMAP I Required Reductions N/A N/A N/A N/A N/A 1,572.9 298.2
N/A Credit for Future BMAPs N/A N/A N/A N/A N/A 848.1 278.4
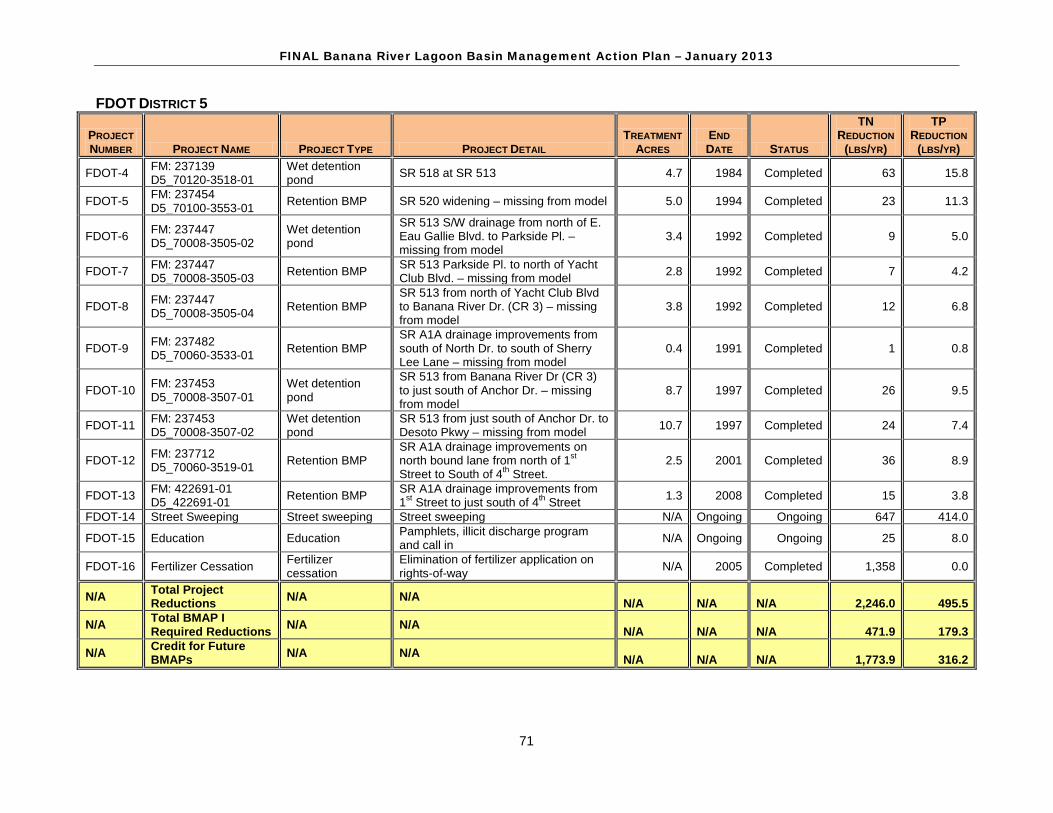
FINAL Banana River Lagoon Basin Management Action Plan – January 2013
71
FDOT DISTRICT 5
PROJECT NUMBER PROJECT NAME PROJECT TYPE PROJECT DETAIL
TREATMENT ACRES
END DATE STATUS
TN REDUCTION
(LBS/YR)
TP REDUCTION
(LBS/YR)
FDOT-4 FM: 237139 D5_70120-3518-01
Wet detention pond SR 518 at SR 513 4.7 1984 Completed 63 15.8
FDOT-5 FM: 237454 D5_70100-3553-01 Retention BMP SR 520 widening – missing from model 5.0 1994 Completed 23 11.3
FDOT-6 FM: 237447 D5_70008-3505-02
Wet detention pond
SR 513 S/W drainage from north of E. Eau Gallie Blvd. to Parkside Pl. – missing from model
3.4 1992 Completed 9 5.0
FDOT-7 FM: 237447 D5_70008-3505-03 Retention BMP SR 513 Parkside Pl. to north of Yacht
Club Blvd. – missing from model 2.8 1992 Completed 7 4.2
FDOT-8 FM: 237447 D5_70008-3505-04 Retention BMP
SR 513 from north of Yacht Club Blvd to Banana River Dr. (CR 3) – missing from model
3.8 1992 Completed 12 6.8
FDOT-9 FM: 237482 D5_70060-3533-01 Retention BMP
SR A1A drainage improvements from south of North Dr. to south of Sherry Lee Lane – missing from model
0.4 1991 Completed 1 0.8
FDOT-10 FM: 237453 D5_70008-3507-01
Wet detention pond
SR 513 from Banana River Dr (CR 3) to just south of Anchor Dr. – missing from model
8.7 1997 Completed 26 9.5
FDOT-11 FM: 237453 D5_70008-3507-02
Wet detention pond
SR 513 from just south of Anchor Dr. to Desoto Pkwy – missing from model 10.7 1997 Completed 24 7.4
FDOT-12 FM: 237712 D5_70060-3519-01 Retention BMP
SR A1A drainage improvements on north bound lane from north of 1st Street to South of 4th Street.
2.5 2001 Completed 36 8.9
FDOT-13 FM: 422691-01 D5_422691-01 Retention BMP SR A1A drainage improvements from
1st Street to just south of 4th Street 1.3 2008 Completed 15 3.8
FDOT-14 Street Sweeping Street sweeping Street sweeping N/A Ongoing Ongoing 647 414.0
FDOT-15 Education Education Pamphlets, illicit discharge program and call in N/A Ongoing Ongoing 25 8.0
FDOT-16 Fertilizer Cessation Fertilizer cessation
Elimination of fertilizer application on rights-of-way N/A 2005 Completed 1,358 0.0
N/A Total Project Reductions N/A N/A N/A N/A N/A 2,246.0 495.5
N/A Total BMAP I Required Reductions N/A N/A N/A N/A N/A 471.9 179.3
N/A Credit for Future BMAPs N/A N/A N/A N/A N/A 1,773.9 316.2
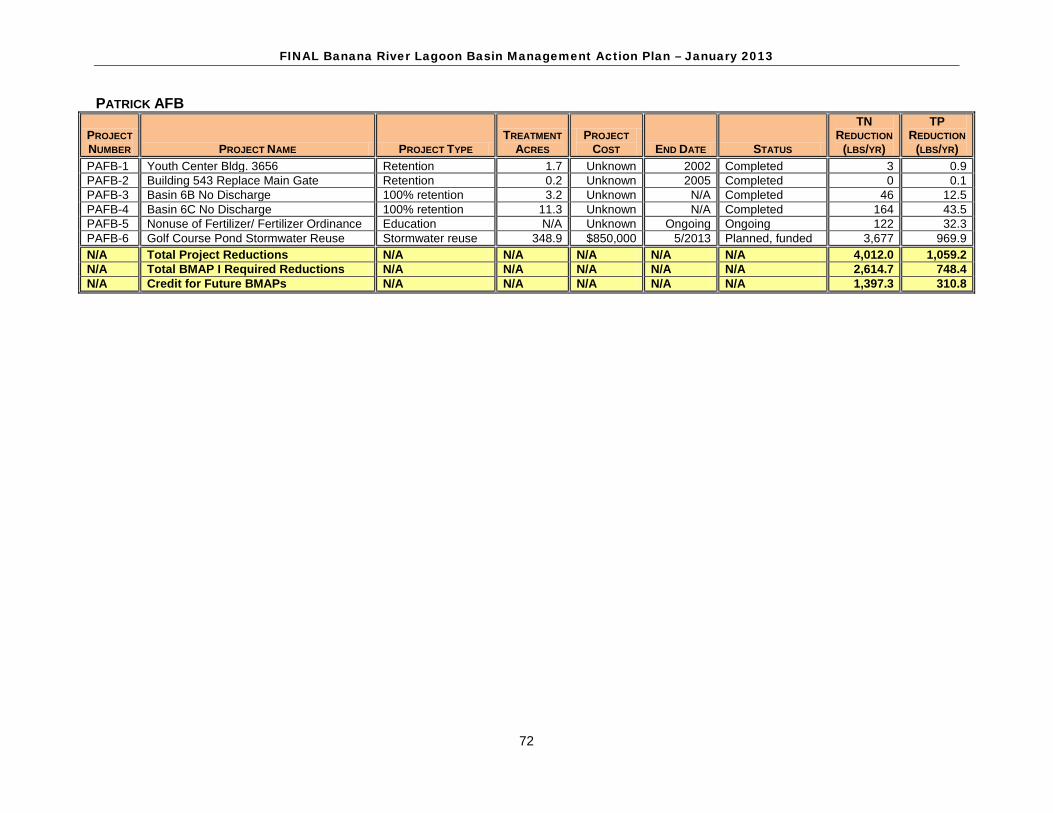
FINAL Banana River Lagoon Basin Management Action Plan – January 2013
72
PATRICK AFB
PROJECT NUMBER PROJECT NAME PROJECT TYPE
TREATMENT ACRES
PROJECT COST END DATE STATUS
TN REDUCTION
(LBS/YR)
TP REDUCTION
(LBS/YR) PAFB-1 Youth Center Bldg. 3656 Retention 1.7 Unknown 2002 Completed 3 0.9 PAFB-2 Building 543 Replace Main Gate Retention 0.2 Unknown 2005 Completed 0 0.1 PAFB-3 Basin 6B No Discharge 100% retention 3.2 Unknown N/A Completed 46 12.5 PAFB-4 Basin 6C No Discharge 100% retention 11.3 Unknown N/A Completed 164 43.5 PAFB-5 Nonuse of Fertilizer/ Fertilizer Ordinance Education N/A Unknown Ongoing Ongoing 122 32.3 PAFB-6 Golf Course Pond Stormwater Reuse Stormwater reuse 348.9 $850,000 5/2013 Planned, funded 3,677 969.9 N/A Total Project Reductions N/A N/A N/A N/A N/A 4,012.0 1,059.2 N/A Total BMAP I Required Reductions N/A N/A N/A N/A N/A 2,614.7 748.4 N/A Credit for Future BMAPs N/A N/A N/A N/A N/A 1,397.3 310.8
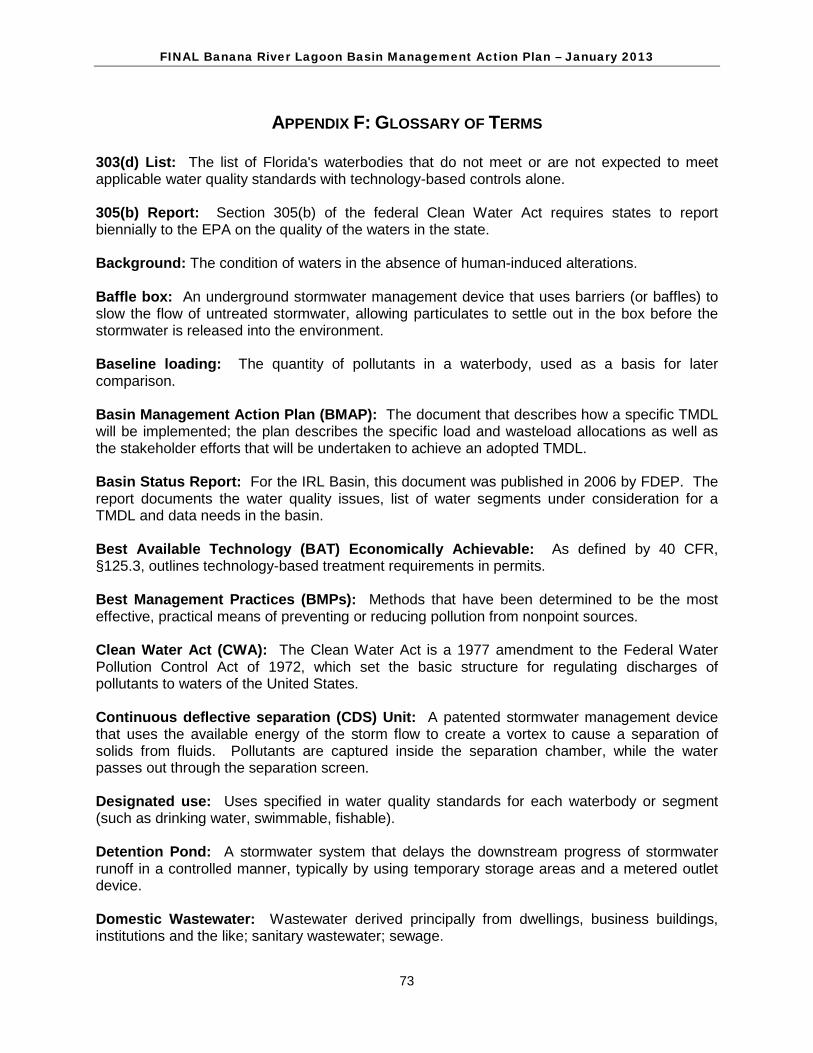
FINAL Banana River Lagoon Basin Management Action Plan – January 2013
73
APPENDIX F: GLOSSARY OF TERMS 303(d) List: The list of Florida's waterbodies that do not meet or are not expected to meet applicable water quality standards with technology-based controls alone. 305(b) Report: Section 305(b) of the federal Clean Water Act requires states to report biennially to the EPA on the quality of the waters in the state. Background: The condition of waters in the absence of human-induced alterations. Baffle box: An underground stormwater management device that uses barriers (or baffles) to slow the flow of untreated stormwater, allowing particulates to settle out in the box before the stormwater is released into the environment. Baseline loading: The quantity of pollutants in a waterbody, used as a basis for later comparison. Basin Management Action Plan (BMAP): The document that describes how a specific TMDL will be implemented; the plan describes the specific load and wasteload allocations as well as the stakeholder efforts that will be undertaken to achieve an adopted TMDL. Basin Status Report: For the IRL Basin, this document was published in 2006 by FDEP. The report documents the water quality issues, list of water segments under consideration for a TMDL and data needs in the basin. Best Available Technology (BAT) Economically Achievable: As defined by 40 CFR, §125.3, outlines technology-based treatment requirements in permits. Best Management Practices (BMPs): Methods that have been determined to be the most effective, practical means of preventing or reducing pollution from nonpoint sources. Clean Water Act (CWA): The Clean Water Act is a 1977 amendment to the Federal Water Pollution Control Act of 1972, which set the basic structure for regulating discharges of pollutants to waters of the United States. Continuous deflective separation (CDS) Unit: A patented stormwater management device that uses the available energy of the storm flow to create a vortex to cause a separation of solids from fluids. Pollutants are captured inside the separation chamber, while the water passes out through the separation screen. Designated use: Uses specified in water quality standards for each waterbody or segment (such as drinking water, swimmable, fishable). Detention Pond: A stormwater system that delays the downstream progress of stormwater runoff in a controlled manner, typically by using temporary storage areas and a metered outlet device. Domestic Wastewater: Wastewater derived principally from dwellings, business buildings, institutions and the like; sanitary wastewater; sewage.
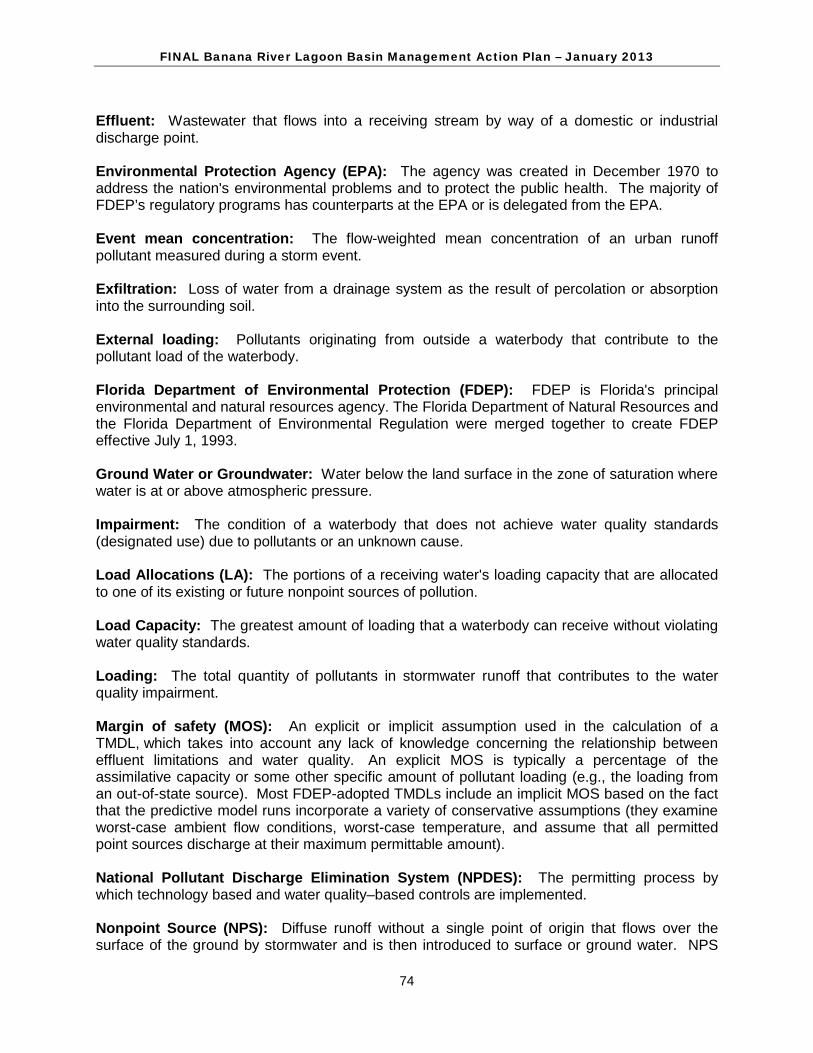
FINAL Banana River Lagoon Basin Management Action Plan – January 2013
74
Effluent: Wastewater that flows into a receiving stream by way of a domestic or industrial discharge point. Environmental Protection Agency (EPA): The agency was created in December 1970 to address the nation's environmental problems and to protect the public health. The majority of FDEP’s regulatory programs has counterparts at the EPA or is delegated from the EPA. Event mean concentration: The flow-weighted mean concentration of an urban runoff pollutant measured during a storm event. Exfiltration: Loss of water from a drainage system as the result of percolation or absorption into the surrounding soil. External loading: Pollutants originating from outside a waterbody that contribute to the pollutant load of the waterbody. Florida Department of Environmental Protection (FDEP): FDEP is Florida's principal environmental and natural resources agency. The Florida Department of Natural Resources and the Florida Department of Environmental Regulation were merged together to create FDEP effective July 1, 1993. Ground Water or Groundwater: Water below the land surface in the zone of saturation where water is at or above atmospheric pressure. Impairment: The condition of a waterbody that does not achieve water quality standards (designated use) due to pollutants or an unknown cause. Load Allocations (LA): The portions of a receiving water's loading capacity that are allocated to one of its existing or future nonpoint sources of pollution. Load Capacity: The greatest amount of loading that a waterbody can receive without violating water quality standards. Loading: The total quantity of pollutants in stormwater runoff that contributes to the water quality impairment. Margin of safety (MOS): An explicit or implicit assumption used in the calculation of a TMDL, which takes into account any lack of knowledge concerning the relationship between effluent limitations and water quality. An explicit MOS is typically a percentage of the assimilative capacity or some other specific amount of pollutant loading (e.g., the loading from an out-of-state source). Most FDEP-adopted TMDLs include an implicit MOS based on the fact that the predictive model runs incorporate a variety of conservative assumptions (they examine worst-case ambient flow conditions, worst-case temperature, and assume that all permitted point sources discharge at their maximum permittable amount). National Pollutant Discharge Elimination System (NPDES): The permitting process by which technology based and water quality–based controls are implemented. Nonpoint Source (NPS): Diffuse runoff without a single point of origin that flows over the surface of the ground by stormwater and is then introduced to surface or ground water. NPS
FINAL Banana River Lagoon Basin Management Action Plan – January 2013
75
includes atmospheric deposition and runoff or leaching from agricultural lands, urban areas, unvegetated lands, OSTDS, and construction sites. Nonpoint Source Pollution: Nonpoint source pollution is created by the flushing of pollutants from the landscape by rainfall and the resulting stormwater runoff, or by the leaching of pollutants through the soils into the ground water. Outfall (general): The place where a sewer, drain, or stream discharges. Outfall (MS4): A point source at the location where a MS4 discharges to water of the state and does not include open conveyances connecting two municipal separate storm sewers, or pipes, tunnels, or other conveyances which connect segments of the same stream or other waters of the state and are used to convey waters of the state. Particulate: A minute separate particle, as of a granular substance or powder. Pollutant Load Reduction Goals (PLRGs): PLRGs are defined as the estimated numeric reductions in pollutant loadings needed to preserve or restore designated uses of receiving waterbodies and maintain water quality consistent with applicable state water quality standards. PLRGs are developed by the water management districts. Point Source: An identifiable and confined discharge point for one or more water pollutants, such as a pipe, channel, vessel, or ditch. Pollutant: Generally any substance, such as a chemical or waste product, introduced into the environment that adversely affects the usefulness of a resource. Pollution: An undesirable change in the physical, chemical, or biological characteristics of air, water, soil, or food that can adversely affect the health, survival, or activities of humans or other living organisms. Removal efficiency: A description of how much of a given substance (metals, sediment, etc.) has been extracted from another substance. Retention Pond: A stormwater management structure whose primary purpose is to permanently store a given volume of stormwater runoff, releasing it by infiltration and /or evaporation. Reuse: The deliberate application of reclaimed water for a beneficial purpose. Criteria used to classify projects as “reuse” or “effluent disposal” are contained in Subsection 62-610.810, F.A.C. Quality Assurance (QA): An integrated system of management activities involving planning, implementation, documentation, assessment, reporting, and quality improvement to ensure that a process, product, or service meets defined standards of quality. Quality Control (QC): The overall system of technical activities that measures the attributes and performance of a process, product, or service against defined standards to verify that they meet the established data quality objectives. Septic Tank: A watertight receptacle constructed to promote the separation of solid and liquid components of wastewater, to provide the limited digestion of organic matter, to store solids,
FINAL Banana River Lagoon Basin Management Action Plan – January 2013
76
and to allow clarified liquid to discharge for further treatment and disposal in a soil absorption system. STORET: The EPA's STOrage and RETrieval database, used nationally for water quality data storage. Stormwater runoff: The portion of rainfall that hits the ground and is not evaporated, percolated, or transpired into vegetation, but rather flows over the ground surface seeking a receiving water body. Surface Water: Water on the surface of the earth, whether contained in bounds created naturally or artificially or diffused. Water from natural springs is classified as surface water when it exits the spring onto the earth’s surface. Surface Water Improvement and Management (SWIM) Waterbody: A waterbody designated by statute or by a water management district for priority management to restore and maintain water quality, habitat, and other natural features of the waterbody. The IRL Basin has this special designation. Total Maximum Daily Load (TMDL): The sum of the individual wasteload allocations for point sources and the load allocations for nonpoint sources and natural background. Prior to determining individual wasteload allocations and load allocations, the maximum amount of a pollutant that a waterbody or waterbody segment can assimilate from all sources while still maintaining its designated use must first be calculated. TMDLs are based on the relationship between pollutants and instream water quality conditions. Wasteload Allocations (WLAs): Pollutant loads allotted to existing and future point sources, such as discharges from industry and sewage facilities. Wastewater: The combination of liquid and pollutants from residences, commercial buildings, industrial plants, and institutions, together with any ground water, surface runoff, or leachate that may be present. Waterbody Identification (WBID) Numbers: WBIDs are numbers assigned to hydrologically based drainage areas in a river basin. Water Quality Standards (WQSs): (1) Standards that comprise the designated most beneficial uses (classification of water), the numeric and narrative criteria applied to the specific water use or classification, the Florida Anti-degradation Policy, and the moderating provisions contained in Rules 62-302 and 62-4, F.A.C. (2) State-adopted and EPA-approved ambient standards for waterbodies. The standards prescribe the use of the waterbody (such as drinking, fishing and swimming, and shellfish harvesting) and establish the water quality criteria that must be met to protect designated uses. Watershed: Topographic area that contributes or may contribute runoff to specific surface waters or an area of recharge. Watershed management approach: The process of addressing water quality concerns within their natural boundaries, rather than political or regulatory boundaries. The process draws together all the participants and stakeholders in each basin to decide what problems affect the water quality in the basin, which are most important, and how they will be addressed.
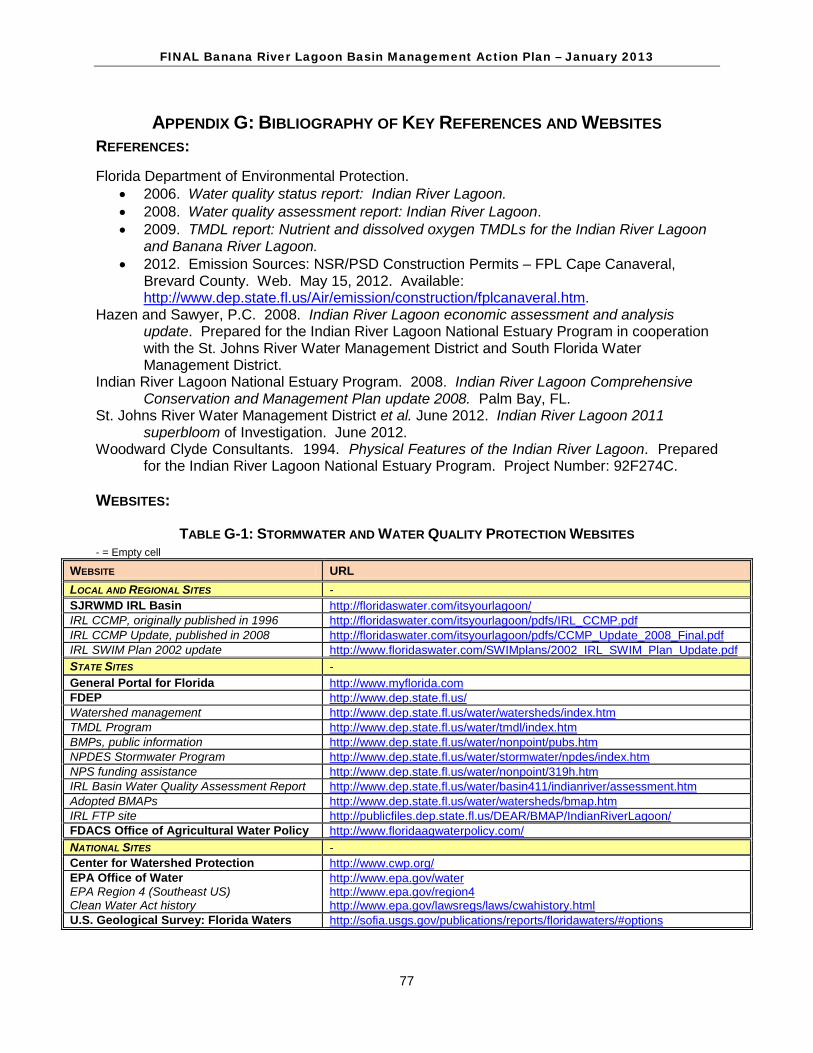
FINAL Banana River Lagoon Basin Management Action Plan – January 2013
77
APPENDIX G: BIBLIOGRAPHY OF KEY REFERENCES AND WEBSITES REFERENCES: Florida Department of Environmental Protection.
• 2006. Water quality status report: Indian River Lagoon. • 2008. Water quality assessment report: Indian River Lagoon. • 2009. TMDL report: Nutrient and dissolved oxygen TMDLs for the Indian River Lagoon
and Banana River Lagoon. • 2012. Emission Sources: NSR/PSD Construction Permits – FPL Cape Canaveral,
Brevard County. Web. May 15, 2012. Available: http://www.dep.state.fl.us/Air/emission/construction/fplcanaveral.htm.
Hazen and Sawyer, P.C. 2008. Indian River Lagoon economic assessment and analysis update. Prepared for the Indian River Lagoon National Estuary Program in cooperation with the St. Johns River Water Management District and South Florida Water Management District.
Indian River Lagoon National Estuary Program. 2008. Indian River Lagoon Comprehensive Conservation and Management Plan update 2008. Palm Bay, FL.
St. Johns River Water Management District et al. June 2012. Indian River Lagoon 2011 superbloom of Investigation. June 2012.
Woodward Clyde Consultants. 1994. Physical Features of the Indian River Lagoon. Prepared for the Indian River Lagoon National Estuary Program. Project Number: 92F274C.
WEBSITES:
TABLE G-1: STORMWATER AND WATER QUALITY PROTECTION WEBSITES - = Empty cell
WEBSITE URL LOCAL AND REGIONAL SITES - SJRWMD IRL Basin http://floridaswater.com/itsyourlagoon/ IRL CCMP, originally published in 1996 http://floridaswater.com/itsyourlagoon/pdfs/IRL_CCMP.pdf IRL CCMP Update, published in 2008 http://floridaswater.com/itsyourlagoon/pdfs/CCMP_Update_2008_Final.pdf IRL SWIM Plan 2002 update http://www.floridaswater.com/SWIMplans/2002_IRL_SWIM_Plan_Update.pdf STATE SITES - General Portal for Florida http://www.myflorida.com FDEP http://www.dep.state.fl.us/ Watershed management http://www.dep.state.fl.us/water/watersheds/index.htm TMDL Program http://www.dep.state.fl.us/water/tmdl/index.htm BMPs, public information http://www.dep.state.fl.us/water/nonpoint/pubs.htm NPDES Stormwater Program http://www.dep.state.fl.us/water/stormwater/npdes/index.htm NPS funding assistance http://www.dep.state.fl.us/water/nonpoint/319h.htm IRL Basin Water Quality Assessment Report http://www.dep.state.fl.us/water/basin411/indianriver/assessment.htm Adopted BMAPs http://www.dep.state.fl.us/water/watersheds/bmap.htm IRL FTP site http://publicfiles.dep.state.fl.us/DEAR/BMAP/IndianRiverLagoon/ FDACS Office of Agricultural Water Policy http://www.floridaagwaterpolicy.com/ NATIONAL SITES - Center for Watershed Protection http://www.cwp.org/ EPA Office of Water EPA Region 4 (Southeast US) Clean Water Act history
http://www.epa.gov/water http://www.epa.gov/region4 http://www.epa.gov/lawsregs/laws/cwahistory.html
U.S. Geological Survey: Florida Waters http://sofia.usgs.gov/publications/reports/floridawaters/#options
Recommended