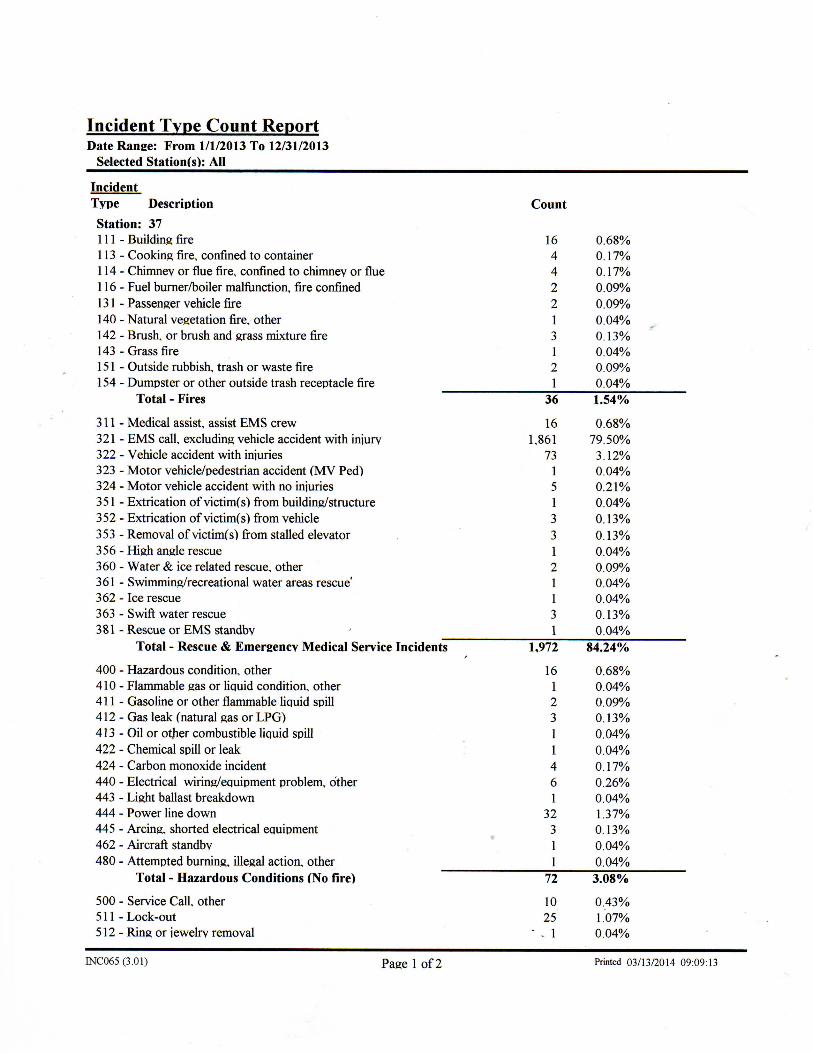
Incident Type Count Report Date Range: From 1/1/2013 To 12/31/2013
Selected Station(s): All
Incident Type Description
Station: 37 111 - Building fire 113 - Cooking fire, confined to container 114 - Chimney or flue fire, confined to chimney or flue 116 - Fuel burner/boiler malfunction, fire confined 131 - Passenger vehicle fire 140 - Natural vegetation fire, other 142 - Brush, or brush and grass mixture fire 143 - Grass fire 151 - Outside rubbish, trash or waste fire 154 - Dumpster or other outside trash receptacle fire
Total - Fires
311 - Medical assist, assist E M S crew 16 0.68% 321 - E M S call, excluding vehicle accident with injurv 1,861 79.50% 322 - Vehicle accident with injuries 73 3.12% 323 - Motor vehicle/pedestrian accident ( M V Ped) 1 0.04% 324 - Motor vehicle accident with no injuries 5 0.21% 351 - Extrication of victim(s) from building/structure 1 0.04% 352 - Extrication of victim(s) from vehicle 3 0.13% 353 - Removal of victim(s) from stalled elevator 3 0.13% 356 - High angle rescue 1 0.04% 360 - Water & ice related rescue, other 2 0.09% 361 - Swimming/recreational water areas rescue' 1 0.04% 362 - Ice rescue 1 0.04% 363 - Swift water rescue 3 0.13% 381 - Rescue or E M S standby 1 0.04%
Total - Rescue & Emergency Medical Service Incidents 1,972 84.24%
400 - Hazardous condition, other 16 0.68% 410 - Flammable gas or liquid condition, other 1 0.04% 411 - Gasoline or other flammable liquid spill 2 0.09% 412 - Gas leak (natural gas or LPG) 3 0.13% 413 - Oil or other combustible liquid spill 1 0.04% 422 - Chemical spill or leak 1 0.04% 424 - Carbon monoxide incident 4 0.17% 440 - Electrical wiring/equipment problem, other 6 0.26% 443 - Light ballast breakdown 1 0.04% 444 - Power line down 32 1.37% 445 - Arcing, shorted electrical equipment 3 0.13% 462 - Aircraft standby 1 0.04% 480 - Attempted burning, illegal action, other 1 0.04%
Total - Hazardous Conditions (No fire) 72 3.08%
500 - Service Call, other 10 0.43% 511 - Lock-out 25 1.07% 512 - Ring or jewelrv removal " - 1 0.04%
Count
16 0.68% 4 0.17% 4 0.17% 2 0.09% 2 0.09% 1 0.04% 3 0.13% 1 0.04% 2 0.09% 1 0.04%
36 1.54%
INC065 (3.01) Page 1 of2 Printed 03/13/2014 09:09:13
Incident Type Description Count
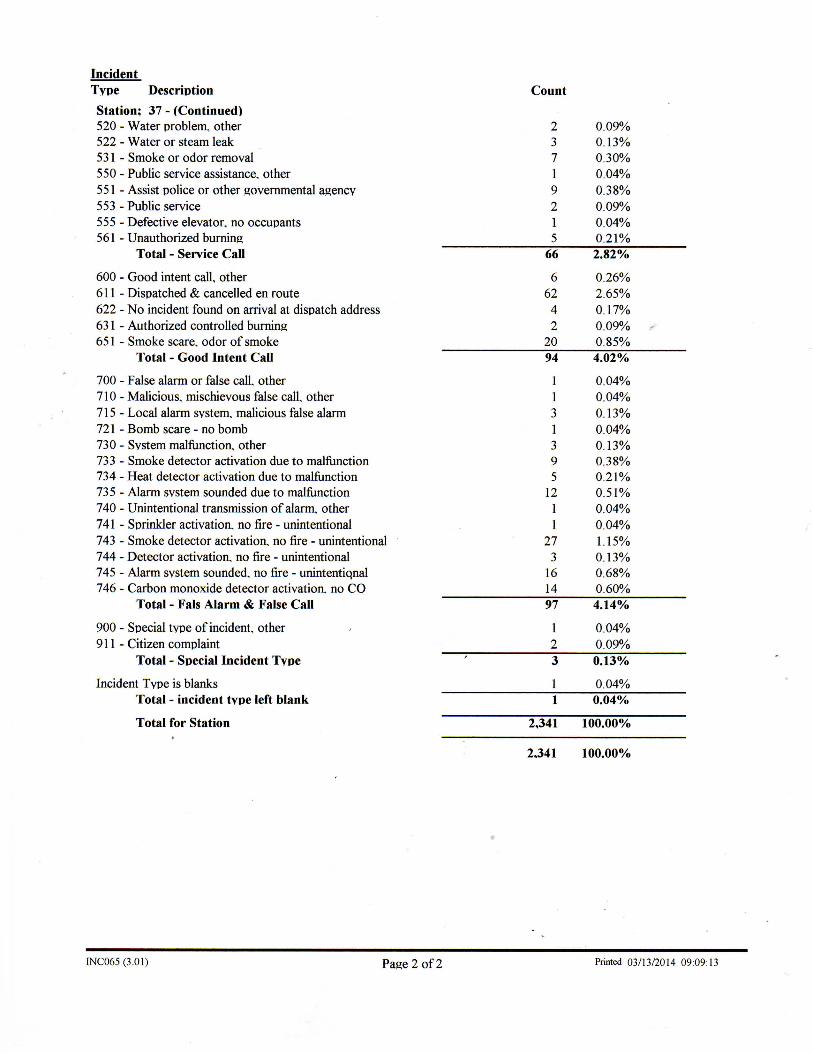
Station; 37 - (Continued) 520 - Water problem, other 2 0.09% 522 - Water or steam leak 3 0.13% 531 - Smoke or odor removal 7 0.30% 550 - Public service assistance, other 1 0.04% 551 - Assist police or other governmental agency 9 0.38% 553 - Public service 2 0.09% 555 - Defective elevator, no occupants 1 0.04% 561 - Unauthorized burning 5 0.21%
Total - Service Call 66 2.82%
600 - Good intent call, other 6 0.26% 611 - Dispatched & cancelled en route 62 2.65% 622 - No incident found on arrival at dispatch address 4 0.17% 631 - Authorized controlled burning 2 0.09% 651 - Smoke scare, odor of smoke 20 0.85%
Total - Good Intent Call 94 4.02%
700 - False alarm or false call, other 1 0.04% 710 - Malicious, mischievous false call, other 1 0.04% 715 - Local alarm system, malicious false alarm 3 0.13% 721 - Bomb scare - no bomb 1 0.04% 730 - System malfunction, other 3 0.13% 733 - Smoke detector activation due to malfunction 9 0.38% 734 - Heat detector activation due to malfunction 5 0.21% 735 - Alarm system sounded due to malfunction 12 0.51% 740 - Unintentional transmission of alarm, other 1 0.04% 741 - Sprinkler activation, no fire - unintentional 1 0.04% 743 - Smoke detector activation, no fire - unintentional 27 1.15% 744 - Detector activation, no fire - unintentional 3 0.13% 745 - Alarm system sounded, no fire - unintentiqnal 16 0.68% 746 - Carbon monoxide detector activation, no CO 14 0.60%
Total - Fals Alarm & False Call 97 4.14%
900 - Special type of incident, other 1 0.04% 911 - Citizen complaint 2 0.09%
Total - Special Incident Type 3 0.13%
Incident Type is blanks 1 0.04% Total - incident type left blank 1 0.04%
Total for Station 2,341 100.00%
2,341 100.00%
INC065 (3.01) Page 2 of 2 Printed 03/13/2014 09:09:13
Recommended


![2do Depa Pedagogia[1]](https://img.pdfslide.net/doc/110x75/56d6bea11a28ab301692efd5/2do-depa-pedagogia1.jpg)