INFORMATION Ta USERS
This manuscript has been reproduced from the microfilm master. UMI films
the tex! directly from the original or copy submitted. Thus. sorne thesis and
dissertation copies are in typewriter face. while others may be from any type of
computer printer.
The quality of this reproduction is dependent upon the qualMy of the
copy submittecl. Broken or indistinct print coIored or poor quality illustrations
and photographs. print bleedthrough. substandard margins. and improper
alignment can adversely affect reproduction.
ln the unlikely event that the author did not send UMI a complete manuscript
and there are missing pages. these will be noted. Also. if unauthorized
copyright material had ta be removed. a note will indicate the deletion.
Oversize materials (e.g.. maps. drawings. charts) are reproduced by
sectioning the original. beginning at the upper left-hand comer and continuing
tram left ID right in equal sections with small overtaps.
Photographs induded in the original manuscript have been reproduced
xerographically in this copy. Higher quality 6- x 9- black and white
photographie prints are available for any photographs or illustrations appearing
in this copy for an additional charge. Contad UMI directly ta arder.
ProQuest Information and Leaming300 North Zeeb Raad. Ann Arbor. MI 48106-1346 USA
800-521.Q600


•
•
ROCKBURST CONTROL USING DESTRESS BLASTING
By
Baoyao Tang
Department of Mining and Metallurgical Engineering
McGill University, Montreal, Canada
February 2000
A Thesis Submitted to the Faculty of Graduate Studies and Research in Partial Fulfilment
of the Requirements for the Degree of Dactor of Philosophy
Copyright © Baoyao Tang 2000

1+1 National Libraryof Canada
Acquisitions andBibliographie Services
395 Welington StreetOttawa ON K1 A ON4canada
Bibliothèque nationaledu·:anada
Acquisitions etserviees bibliographiques
395. rue WellingtonOttawa ON K1A 0N4Canada
The author has granted a nonexclusive licence allowing theNational LibraJY ofCanada toreproduce, loan, distribute or sellcopies of this thesis in microfo~
paper or electronic formats.
The author retains ownership of thecopyright in this thesis. Neither thethesis nor substantial extracts froID itMay be printed or otherwisereproduced without the author'spemusslon.
L'auteur aaccordé une licence nonexclusive permettant à laBibliothèque nationale du Canada dereproduire, prêter, distribuer ouvendre des copies de cette thèse sousla forme de microfiche/film, dereproduction sur papier ou sur formatélectronique.
L'auteur conserve la propriété dudroit d'auteur qui protège cette thèse.Ni la thèse ni des extraits substantielsde celle-ci ne doivent être imprimésou autrement reproduits sans sonautorisation.
0-612-64678-5
Canada

•
•
ABSTRACT
One of the main problems facing mining engineers when dealing with deep, hard rock
mines is to prevent and/or reduce rockburst hazard around mine openings. Rockburst is a
phenomenon which is characterised by violent rock failure. The current research focuses
on the assessment and control ofrockbursts in deep, hard rock mines.
Strainbursts, or strain-type rockbursts, occur in the vicinity of mine openings and are
generally provoked by high stress conditions in a brittIe rock mass. A new theory bas
been developed for the assessment of the potential of violent rock failure by strainburst,
in underground hard rock mines. In this theory, the mining-induced energy parameters
are used to calculate the so-called burst potential index (BPI). When the BPI reaches or
exceeds 100010, the method predicts a burst prone situation. One of the most commonly
used methods ta control strainbursts in hard rock mines is destress blasting.
Motivated by the lack ofa dedicated analysis tool to help assess destress blasting, a new,
geomechanical model was developed. The technique employs two newly introduced
parameters, a, a rock fragmentation factor, and ~, a stress dissipation factor, inside the
modelled, fraetured zone. Implemented in a J-dimensional finite element code developed
by the author, the new model simulates the damage zone induced by destress blasting of a
mining face ta help evaluate the efficiency of destress blasting. Extensive model
verification and parametric studies have been undenaken. The effects of the destress
blasting pattern, premining stresses and their orientation, and the two destress blasting
factors (rock fragmentation factor, and stress dissipation factor) are studied. The model
has been applied successfully ta Canadian mine case histories. A detailed case study of a
cut-and-fill mine stope involving crown and sill pillar destressing has been carried out. It
is shown that the new method cao he useful in the assessment ofdestress blasting in deep
drift face development and the crown/sill pillar problems in cut-and-till mine stopes.

•
•
RÉsUMÉ
Un des principaux problèmes auquel est confronté l'ingénieur des mines les mines
profondes de roches dures est la prévention et la réduction des coups de terrain autourdes excavations minières. Le coup de terrain est un phénomène qui est caractérisé par uneviolente rupture de roche. Cette recherche traite de l'estimation et du contrôle des coupsde terrain dans les mines de roches dures.
Les coups de terrain se produisent aux alentours des excavations minières et sont
généralement provoqués par des conditions de contraintes élevées dans les massifs
rocheux peu fracturés. Une nouvelle théorie a été développée pour l'estimation du
potentiel de rupture violente de la roche par les coups de terrain dans les mines
souterraines de roches dures. Dans cette théorie, les paramètres d'énergie induite dans lesmines sont utilisés pour calculer l'indice BPI (burst potential index). Quand le BPIatteint ou dépasse 100010, la méthode prédit une possibilité d'avoir une situation de coupde terrain. L'une des méthodes les plus couramment utilisées pour le contrôle des coups
de terrain dans les mines de roches dures est le tir de relaxation.
Motivé par le manque d'un outil d'analyse pour l'evaluation des tirs de relaxation, un
nouveau modèle géomécanique a été développé. La technique utilise deux nouveauxparamètres, a, un facteur de fragmentation de la roche, et ~, un facteur de dissipation de
contraintes, à l'intérieur de la zone fracturée modélisée. Introduit dans un code
d'éléments finis développé par l'auteur, le nouveau modèle simule la zone de dommage
induite par les tirs de relaxation de la face minière pour aider à évaluer l'efficacité des tirsde relaxation. Une vérification du modèle et des études paramétriques ont été menées.
Les effets du schéma des tirs de relaxation, des contraintes initiales et leur orientation, et
des deux facteurs de tirs de relaxations ( facteur de fragmentation de la roche, et facteur
de dissipation de contraintes) sont étudiés. Le modèle a été appliqué avec succès à des
analyses sur des cas d'études de mines canadiennes. Un cas d'étude détaillé de tirs derelaxation dans les ouvertures minieres de type coupe et remblai a été mené. Cela a
montré que la nouvelle méthode peut être utile dans l'estimation des tirs de relaxation
dans les problèmes de développement de face de tunnel et des piliers horizontaux dans
les ouvertures minières de type coupe et remblai dans les mines profondes.
ü

•
•
ACKNOWLEDGEMENTS
Il's a great pleasure to express my sincere gratitude to my supervisor Prof. Rani S. Mitri
for his guidance and encouragement throughout the research and his financial support;
without these supports, this thesis wouldn't have been a reality.
1 would Iike to acknowledge the warmth and fiiendship of my fiiends at McGiIl
University, specially of the numerical modelling group. Acknowledgements are
especially due to Mr. Wilfrid Comeau and Mr. Joseph Marwan for their kindness and
help during lhis project.
1 am particularly indebted to my wife Yang Xia for her understanding, love and help ail
a10ng the project. 1would also Iike ta express my special feelings ta my son, Tian Hao,
for the lime 1spent on my project which part of them should belong to him.
üI

•
•
TABLE OF CONTENTS
ABSTRACT i
RÉSUMÉ ii
ACKNOWLEDGE~NTS iii
TABLE OF CONTENTS iv
LIST OF FIGURES x
LIST OF TABLES xx
NOTATION xxii
CHAPTER 1
INTRODUCTION
1.1 GENERAL 1-[
1.2 CLASSIFICATION OF ROCKBURST MECHANI5MS 1-2
1.3 ROCKBURST ALLEVIATION AND CONTROL METHODS 1-4
1.3.1 Alternative Mining Methods and/or Mining Sequences 1-5
1.3.2 Ground Support 1-6
1.3.3 Ground Preconditioning 1-8
1.4 SCOPE AND OBJECTIVES (-1 1
1.4.1 Research Scope 1-1 1
1.4.2 Objectives 1-12
1.5 THE5IS OUTL~"E 1-12
CHAPTER2
LITERATURE REVIEW ON THE EVALUATION OF ROCKBURST
POTENTIAL
2.1 INTRODUCTION 2-1

•
•
Table a/Contents
2.2 ROCKBURST POTENTIAL EVALUATION USING ROCK MECHANICS
METHOOS 2-1
2.2.1 Stress Method 2-2
2.2.1.1 Hard rock behaviour under uniaxial compression 2-2
2.2.1.2 Brittleness of Rocks 2-3
2.2.1.3 Failure Ouration Index (Dt) 2-3
.,., 14A ... d '4_._.. ctlVlty ln ex _-
2.2.1.5 Excess Shear Stress (ESS) 2-4
2.2.1.6 Stress State 2-5
2.2.2 Energy Method 2-6
2.2.2.1 Energy Balance 2-7
2.2.2.2 Energy Parameters 2-9
2.2.2.3 Indices Based on Stored Elastic Strain Energy 2-11
2.2.2.4 Rockburst Hazard Based on 3D Stress Field Analysis 2-15
2.2.3 Stiffness Method 2-17
2.3 SEISMOLOGICAL METHOOS 2-19
2.3.1 General Overview 2-19
2.3.2 Stochastic Methods 2-21
2.3.3 Oeterministic Methods 2-21
CHAPTER3
DESTRESS BLASTING PRACTICE IN HARD ROCK MINES
3.1 DESTRESS BLASTING PRACTICE AND PROBLEMS 3-1
3.2 MINING SITUATIONS WHICH CAli FOR DESTRESS BLASTING 3-4
3.3 LITERATURE REVIEW ON REPORTED DESTRESS BLASTING 3-7
3.4 SELECTEO CASE HISTORIES 3-17
3.4.1 Star-Moming Mine. Hecla Mining Co.. Burke. Idaho 3-17
3.4.2 Macassa Mine 3-19
v

•
•
Table ofContents
3.4.3 South Africa 3-20
3.4.4 The use of destressing at Inco's Creighton mine 3-22
3.4.5 Destress blasting at Campbell Red lake mine 3-27
3.4.6 Destress blasting experiments at the Pyhasalmi mine Finland 3-28
3.5 CONCLUSION 3-29
CHAPTER4
EVALUATION BURST POTENTIAL USING MINING INDUCED ENERGY
4.1 INTRODUCTION 4-1
4.2 ENERGY RELEASE RATE (ERR) AND ENERGY STORAGE RATE (ESR) ..4-2
4.2.1 Energy Release Rate (ERR)-Advantages And Limitations 4-2
4.2.2 Present Approach 4-3
4.3 EFFECT OF MINING SEQUENCES 4-6
4.4 BURST POTENTlAL INDEX (BPn 4-10
4.5 CASE STUDY 4-12
4.5.1 Geomechanical Properties 4-13
4.5.2 ln Situ Stresses 4-l4
4.5.3 Results and Discussion 4-14
4.5.4 Conclusion 4-16
CRAPTER5
PROPOSED NUMERICAL MODEL FOR DESTRESS BLASTING
5.1 INTRODUCTION 5-1
5.2 NEW GEOMECHANICAL MODEl FOR DESTRESS BlA5TING 5-1
5.3 FINITE ELEMENT EQUATIONS 5-11
5.3.1 General 5-11
5.3.2 Element Shape Functions 5-12
5.3.3 Element Displacements and Strains 5-13
vi

•
•
Table ofContents
5.3.4 Element Stiffness Matrix and Equilibrium Equation 5-14
5.3.5.1 Consistent Load Vector Due To Initial Stresses 5-16
5.3.5.2 Consistent Load Vector Due To Body Forces 5-17
5.3.5.3 Consistent load Vector Due To Boundary Traction 5-17
5.4 FLOWCHART A!'lD NUMERICAL ALGORITHM 5-19
5.4.1 General Flowchart 5-19
-4"'Mdl' P . -"'1) .._ 0 e input arameters )--
5.4.3 Global Degrees-of-Freedom and the Size of the Stiffness Matrix 5-11
5.4.4 Element Calculation for Stiffness and Load Vector 5-24
5.4.5 Strain, Stresses and Energy Parame!ers 5-27
5.5 ISOPARAMETRIC ELEMENT TEST 5-19
5.6 MODEl FEATURES AND lIMITATIONS 5-33
5.6.1 Model Features 5-33
5.6.2 Model Limitations 5-34
CHAPTER6
\IODEL VERIFICATION AND PARAl\tIETRIC STUDY
6.1 INTRODUCTION 6-1
6.2 MODEl VERIFICATION 6-1
6.3 MODEl PARAMETRIC STUDY ON DESTRESS BlASTING PATTERNS FOR
DRIFf DEVElOPMENT 6-9
6.3.1 Problem Definition 6-9
6.3.2 Numerical Results 6-11
6.4 EFFECT OF THE ROCK FRAGMENTATION FACTOR a 6-17
6.5 EFFECT OF STRESS DISSIPATION FACTOR f3 6-27
6.6 EFFECT OF THE ORIENTATION OF THE DRIFT AXIS WITH RESPECT Ta
THE MAJOR PRINCIPAL IN SITU STRESS 6-32
VII

•
•
Table a/Contents
6.6 EFFECT OF THE ORIENTATION Of THE DllIFT AXIS WITH RESPECT TO
THE MAJOR PRINCIPAL IN SITU STRESS 6-32
CBAPTER7
CASE STUDY OF A CUT·AND-FILL MINE STOrE
7.1 PROBLEM DEFINITION 7·1
7.2 C~BELL RED LAKE MINE 7-2
7.2.1 Rockburst lIistory 7-3
7.2.2 Mine Geology 7-4
7.3 GEOMECHANICAL DATA, PRELIMINARY ANALYSIS AND MaDEL
P~TERS 7·7
7.4 NUMERICAL MODELLING PROCEDURES 7-9
7.5 DISCUSSION OF THE NUMERICAL MODELLING RESULTS 7-11
7.5.1 Destress Blasting ofthe 1802E Sill and 1902E Crown PilIars 7-13
7.5.2 Modelling the Destressing of 1902E Crown Pillar Only 7-23
7.5.3 Modelling the Destressing of 1802E Sill Pillar Qnly 7-27
7.5.4 Discussion 7-31
CBAPTERI
CONCLUSIONS
8.1 SUMMARY ANDCOCLUSIONS 8-1
8.2 RECOMMENDATIONS FOR FURTHER RESEARCH 8-2
STATEMENTS OF CONTRIBUTIONS 8-3
REFEUNCES R-l
APPENDIXA
viü

•
•
Table ofContents
USERS GUIDE TO e-z tools 3D B-l
A.l STRUCTURE Of THE INPUT DATA FD...E B-l
B.2 SCENARIO fOR THE GLOBAL STIFFNESS MATRIX B-4
APPENDIXC
POTENTIAL ENERGY C-I
ix

•
•
LIST OF FIGURES
Figure 1.1 Flowchart illustrating the classification of rockburst mechanisms 1-3
Figure 1.2 6600 Ievel plan showing destress siot mining sequence at Creighton Mine
(After Landriault et al., 1992) 1-9
Figure 2.1 Schematic stress-strain curve of low porosity, brittle rocks under uniaxial
compression (after Bieniawski, (967) 2-2
Figure 2.2 Mining configuration and notations in the reference state, i.e. in state 1(a) and
after additional mining, i.e. in state II (b) (after Salamon, 1984) 2-8
Figure 2.3 Mining-induced Strain Energy (after Mitri et al., 1996a) 2-10
Figure 2.4 Application of the Concept of Change of Potential Energy(Mitri. 1996a) .. 2-11
Figure 2.5 Calculation of W~l index From a uniaxial compression stress-strain curve (after
Kidibinski, 1981) 2-12
Figure 2. 6 A schematical representation of the BIM value determination from a uniaxial
compression test results (after Aubertin and Gill, 1988) 2-13
Figure 2. 7. Mode of failure determined by comparison between sample and testing(after
Cook, 1965) 2-18
Figure 2. 8 Diagram showing the methodology to evaJuate the rockburst potential (after
Gill and Aubertin, (988) 2-18
Figure 3.1 Stress profile ahead of a destressed face 3-2
Figure 3.2 Sorne mining situations, which may benefit from destress blasting 3-5
Figure 3.3 Locations of Destress Blasting, Level 7700, Star-Moming Mine. Hecla Mining
Co. (after Karwoski et al., 1979) 3-17
Figure 3.4 Destress blasting drillholes and loading patterns for the 7700 level, Star-
Moming (after Karwoski et al., 1979) 3-18
Figure 3.5 Layout of destress holes in the 58-40 crown pillar at the Macassa Mine (after
Hanson et al., 1987) 3-19

•
•
List of Figures
Figure 3.6a Face-parallel destress blasting al Blyvooruitzicht Gold Mine, South Africa
(after Lightfoot et al. 1996; Toper et al., 1998) 3-20
Figure 3.6b Face-perpendicular destress blasting at Blyvooruitzicht Gold Mine, South
Africa (after Lightfoot et al. 1996; Toper et al., 1998) 3-21
Figure 3.7a: Section 4400, indicating the proposed mining methods at Inco's Creighton
(after Q'Donnell, 1992) 3-22
Figure 3.7b: Sill-cut MC&F units on 2073m level at Inco's Creighton Mine (O'Donnel1,
1992) 3-23
Figure 3.7c Blasthole drifts on 2073m levellost Mine owing to bursting at Inco's
Creighton (after O'Oonnel1, 1992) 3-24
Figure 3.8a Destress patterns of MC&F units on 2073 m level
(after O'Oonnell. 1992) 2-25
Figure 3. 8b Drift destressing patterns, 2195m Ievel. Creighton mine (after Q'Donneil.
1992) 3-26
Figure 3.Sc Development heading destressing at Inco (after Dickout. 1963) 3-27
Figure 3.8d Development heading destressing at Inco (after Oliver et al..198?) 2-27
Figure 3.9 Layout of distress holes in the 1902 and 1802 crown and sill pillars at the
Campbell Mine (after Makuch et al.. 1987) 3-28
Figure 4.1 Variation of energy released with the number of mining steps (after Salarnon
1983) 4-3
Figure 4.2. Definition of mining-induced energy components
(after Mitri et al., 1999) 4-4
Figure 4.3 Energy components when mining in sequences (after Mitri et al.. 1999) 4-7
Figure 4.4 Reduction of energy released when mining in sequences (after Mitri et al..
1999) 4-8
F 4 5 E & ·th .. f M" al 999 919ure. nergy components lor 1 mlOlng step (a ter ltn et . 1 4-
Xl

•
•
List of Figures
Figure 4.6 Definition of critical energy stored in a uniaxial test. 4-10
Figure 4.7 Cross-section of a cut-and-fill stope 18-1361 Goldcorp's Red Lake Mine 4-12
Figure 4.8 First three layers of elements 4-15
Figure 5.1 Finite element for a drift development 5-2
Figure 5.2 Steps for modelling destress blasting and face advance 5-3
Figure 5.3 Relationship between the fixed global co-ordinates and those related to
orientation of a local plane of isotropy 5-6
Figure 5.4 Definition of elastic constants for the case of orthotropy in terms of stresses
and both normal and shear strains in a three-dimensional element (after Wittke. 1990)
................................................................................................................................... 5-7
Figure 5.5 Definition of elastÎC constants for the case of transverse isotropy and planar
fabric in terms of stresses and both normal and shear strains in a three-dimensional
element (after Wittke. (990) 5-9
Figure 5.6 Flowchart of the model procedure for destress blasting 5-10
Figure 5.7 Element numbering 5-13
Figure 5. 8 General tlowchart of e·z tools 3D 5-20
Figure 5. 9 Flowchart details of Step 1 for e-z lools 3D 5-22
Figure 5.10 Flowchart details for Step2 in e·z tools 3D 5-23
Figure 5.11 Aowchart for the element stiffness matrix calculation 5-25
Figure 5.12 Aowchart of element load vector due to gravity and initial stresses 5-26
Figure 5.13 Flowchart for the stresses and energy parameters 5-27
Figure 5.14 Possible ESR reduction and increase from the initial state of stress aD 5-28
Figure 5.15 Fixed-end beam with a uniform load 5-29
Figure 5.16 Finite element mesh for the tested beam with 64 20-node elements 5-31
Xli

•
•
List of Figures
Figure 5.17 Vertical displacement distribution along the fixed-end beam under a unifonn
load 5-31
Figure 5.18 Stress distribution along the fixed-end beam under a unifarm laad 5-32
Figure 5.19 Horizontal displacement distribution along the fixed-end beam under a
uniform load applied in x direction 5-32
Figure 5.20 Stress distribution along the fixed-end beam under a uniform load applied in
x direction 5-33
Figure 6.1 Circular opening in a biaxial stress field 6-3
Figure 6.2 Tangential and radial stress distribution around the circular opening at <t> =90°.
under hydrostatic pressure of 70 MPa 6-2
Figure 6.3 Tangential and radial stress distribution around a circular opening under
hydrostatic pressure of 70 MPa at <t> =0° 6-6
Figure 6.4 Tangential and radial stress distribution around the circular opening under
vertical pressure of 70 MPa with k = 0 at <t> =90° 6-7
Figure 6.5 Tangential and radial stress distribution around the circular opening under
vertical pressure of 70 MPa with k = 0 at <t> = 00 6-8
Figure 6.6 The demonstration of the results repetition due to six face advances 6-10
Figure 6.7 Destress blasting patterns 6-11
Figure 6.8 Burst potential index (BPI) behind the face-initial configuration 6-13
Figure 6.9a Major principal stress distribution in the face before destressing 6-14
Figure 6.9b Major principal stress distribution in the face after destressing 6-15
Figure 6.10 Major principal stress distribution for blasting pattern 1 6-16
Figure 6.11 Major principal stress distribution after destress blasting 6-16
Figure 6.12 Major principal stress distribution after face advance 6-17
Figure 6.13 Finite element mesh for the parametric study 6-18
xiii

•
•
List of Figures
Figure 6.14 Feature points definition for the drift development 6-19
Figure 6.15 Major principal stress distribution along the line passing by points Bi before
destress blasting 6-20
Figure 6.16 Major principal stress distribution along the line passing by points Cl before
destress blasting 6-21
Figure 6.17 Major principal distribution along the line passing by points Al before
destress blasting 6-21
Figure 6.18 Major principal stress contours just in front of the drift initial face before
destress blasting 6-22
Figure 6.19 Variation of the major principal stress along the line passing by points Bi
with a 6-22
Figure 6.20 Variation of the major principal stress along the line passing by points Cl
with a 6-23
Figure 6.21 Vmation of the major principal stress along the line passing by points AI
with a 6-23
Figure 6.22 Variation of the major principal stress along the [ine passing by points AI
with a after two face advances 6-26
Figure 6.23 Variation of the major principal stress along the line passing by points Bi
with a after two face advances 6-26
Figure 6.24 Variation of the major principal stress along the line passing by points Cl
with a after two face advances 6-27
Figure 6.25 Major principal stress contour just in front of the drift face after two face
advances 6-27
Figure 6.26 Variation of the major principal stress along the line passing by points Ai
with ~ after two face advances 6-29
Figure 6.27 Variation of the major principal stress aJong the fine passing by points Bi
with ~ two face advances 6-30xiv

•
•
Lis, of Figures
Figure 6.28 Variation of the major principal stress along the line passing by points Ci
with ~ after two face advances 6-30
Figure 6.29 Effect of ~ on stress reduction in the drift corner 6-31
Figure 6.30 Definition of the angle e in the drift plan view 6-32
Figure 6.31 Definition of the drift deformation 6-33
Figure 6.32 Vertical convergence one round behind the face before destress and al'ter two
face advances while destressing 6-34
Figure 6.33 Horizontal closure one round behind the face before destress and after two
face advances white destressing 6-35
Figure 6.34 Variation of major principal stress distribution vs. strike angle ealong the
right corner of the drift 6-35
Figure 6.35 Variation of major principal stress distribution vs. strike angle ealong the
left corner of the drift 6-36
Figure 6.36 Variation of major principal stress distribution vs. strike angle ealong the
roof centre of the drift 6-36
Figure 6.37 Variation of major principal stress distribution vs. strike angle ealong the
left-side centre of the drift 6-37
Figure 6.38 Variation of major principal stress distribution vs. strike angle ealong the
right-side centre of the drift 6-37
Figure 6.39 Variation of major principal stress distribution vs. strike angle ealong the
right corner of the drift after two drift face advance 6-38
Figure 6.40 Variation of major principal stress distribution vs. strike angle ealong the
right corner of the drift after two drift face advance 6-38
Figure 6.41 Variation of major principal stress distribution vs. strike angle ealong the
roof centre of the drift after two drift face advance 6-39
xv

•
•
List of Figures
Figure 6.42 Variation of major principal stress distribution vs. strike angle ealong the
right side centre of the drift after two drift face advance 6-39
Figure 6.43 Variation of major principal stress distribution vs. strike angle e along the
left side centre of the drift after two drift face advance 6-40
Figure 6.44 Major principal stress contour in front of the initial drift face before
destressing for e=00••••.••.••.••.•..•••••••.•...•.••...•..••.•..•..•.•.....•..••••••..•••••.•.....•...•........... 6-41
Figure 6.45 Major principal stress contour in front of the drift face after two face
advances while destressing for e= 00 6-41
Figure 6.46 Major principal stress contour in front of the initial drift face before
destressing for 9 =450•••••.••.•.•••••••••••••••••••••••••••••••••••••••••••.•.••.••••••••••.•••••••.••••••.••••••• 6-42
Figure 6.47 Major principal stress contour in front of the drift face after two face
d · . h'l d' . ~ e- .t -0 6 1")avances w 1 e estressmg lor -""t~ •••••••••••••••••••••••••.•.•.••••••••••••••••••.•••••••••••••••••• -"'t_
Figure 6.48 Major principal stress contour in front of the initial drift face before
destressing for 9 =90° 6-43
Figure 6.49 Major principal stress contour in front of the drift face after two face
advances while destressing for 8 = 90° 6-43
Figure 6.50 Major principal stress at the feature points one round behind the drift face
before destressing 6-44
Figure 6.51 Major principal stress at the feature points one round behind the drift face
after two face advances while destressing 6-44
Figure 7.1 Campbell Mine location map (afterCullen, 1988) 7-2
Figure 7.2 Longitudinal section of 'A' ore zone (after Makuch et al. 1987) 7-6
Figure 7.3 Orientation of the premining principal stresses adopted in the case study .... 7-8
Figure 7.4 Numerical modelling zoning for mining sequence 7-9
Figure 7.5 Definition of the feature points on the sill and crown pillars 7-11
xvi

•
•
List of Figures
Figure 7.6 Major principal stress distribution in the crown pillar near the hanging wall
before destressing 7-14
Figure 7.7 Major principal stress distribution in the centre of crown pillar before
destressing 7-14
Figure 7.8 Major principal stress distribution in the crown pillar near the footwall wall
before destressing 7-15
Figure 7.9 Burst potential index (BPI) distribution in the crown pillar near hanging wall
before destressing 7-15
Figure 7.10 Burst potential index (BPI) distribution in the centre of crown pillar before
destressing 7-16
Figure 7.11 Burst potential index (BPI) distribution in the crown pillac near footwall
before destressing 7-16
Figure 7.12 Major principal stress distribution in the sill pillar near the hanging wall
before destressing 7-17
Figure 7.13 Major principal stress distribution in the centre of sill pillac before
destressing 7-17
Figure 7.14 Major principal stress distribution in the sill pillar near the footwall wall
before destressing 7-18
Figure 7.15 Burst potential index (BPO distribution in the sill pillar near hanging wall
before destressing 7-18
Figure 7.16 Burst potential index (BPI) distribution in the centre of sill pillac before
destressing 7-19
Figure 7.17 Burst potential index {BPn distribution in the sill pillar near footwall before
destressing 7-19
Figure 7.18 Major Principal stress distribution in the crown pillac near hanging wall after
destress _ _7-20
xvii

•
•
List of Figures
Figure 7.19 Major Principal stress distribution in the centre of the crown pillar after
destress 7-20
Figure 7.20 Major Principal stress distribution in the crown pillar near footwall after
destress 7-21
Figure 7.21 Major Principal stress distribution in the sill pillar near hanging wall after
destress 7-21
Figure 7.22 Major Principal stress distribution in the centre of the sill pillar after destress
.................................................................................................................................7-22
Figure 7.23 Major Principal stress distribution in the sill pillar near footwall after
destress 7-22
Figure 7.24 Major principal stress distribution in the crown pillar near hanging wall after
destress the crown pillar 7-24
Figure 7.25 Major principal stress distribution in the centre of the crown pi llar after
destress the crown pillar 7-24
Figure 7.26 Major principal stress distribution in the crown pillar near foot wall after
destress the crown pillar 7-25
Figure 7.27 Major principal stress distribution in the sill pillar near hanging wall after
destress the crown pillar 7-25
Figure 7.28 Major principal stress distribution in the centre of the crown pillar after
destress the sill pillar 7-26
Figure 7.29 Major principal stress distribution in the crown pillar near foot wall after
destress the crown pillar 7-26
Figure 7.30 Major principal stress distribution in the crown pillar near hanging wall after
destress the sill pillar 7-28
Figure 7.31 Major principal stress distribution in the centre of the crown pillar after
destress the sill pillar 7-28
XVIII

•
•
List of Figures
Figure 7.32 Major principal stress distribution in the crown pillar near foot wall after
destress the sill pillar 7-29
Figure 7.33 Major principal stress distribution in the sill pillar near hanging wall after
destress the sill pillar 7-29
Figure 7.34 Major principal stress distribution in the centre of the sili pillar after destress
the siii pillar 7-30
Figure 7.35 Major principal stress distribution in the sill pillar near foot wall after
destress the sill pillar 7-30
xix

•
•
LIST OF TABLES
Table 2.1 Indicative values for the Dt index (after Wu and Zhang, (997)
Table 2.2 Rockburst potencial classes (after Tao, 1988)
Table 2.3 Indicative values of BIM as related to bursting Iiabilities (after Aubertin ec al..
(994)
Table 3.1 Summary of reported destress blasting studies
Table 3.2 Detailed information of reported destress blasting studies
Table 4.1 Model sequences
Table 4.2. Geomechanical Properties
Table 4.3: ESR and BPI values in the stope back after each eut
Table 4.4. ESR and BPI in the crown pillar for eut 4. 5 and 6
Table 6.1 Parametric values for the model sensitivity analysis
Table 6.2 Peak stress comparison of circular opening (K =1. a =2.5m)
Table 6.3 Peak stress comparison of circular opening (K =O. a =2.5m)
Table 6.4 Maximum face stresses before and after destressing
Table 6.5 Major principal stress at feature points before destress blasting
Table 6.6 ~Iajor principal stress changes at feature points vs. rock fragmentation factor a
just after two face advances while destress blasting
Table 6.7 Major principal stress changes at feature points vs. stress dissipation factor ~
just al'ter two face advances while destress blasting
Table 6.8 Major principal stress changes vs. angle eon the feature points before destress
blasting
Table 6.9 Major principal stress changes vs. angle eon the feature points after two face
advances

•
•
List afTables
Table 7.1 Mine levels and elevations (Cullen, (988)
Table 7.2 Results of laboratory test (after Makuch, 1987)
Table 7.3 Field stresses (in MPa), Campbell Red Lake Mine (CRLM) (after Makuch.
1987)
Table 7.4 Description of the numerical modelling sequence
Table 7.5 Major principal stresses at the feature points on 1902E crown pillar (MPa)
Table 7.6 Burst potential index (BPI) at the feature points on 1902E crown pillar (%)
Table 7.7 Major principal stresses at the feature points on 1802E sill pillar (MPa)
Table 7.8 Burst potential index (BPI) at the feature points on IS02E sill pillar (%)
Table 7.9 Major principal stresses at the feature points on 1902E crown pillar (MPa) after
modelling step 5 (MPa)
Table 7.10 Major principal stresses at the feature points on 1802E sill pillar (MPa) after
modelling step 5 (MPa)
Table 7.11 Major principal stress distribution in the 1902E crown pillar after its destress
blasting (MPa)
Table 7.12 Major principal stress distribution in the 1802E sill pillar after destressing the
1902E crown pillar (MPa)
Table 7.13 Major principal stress distribution in the 1902E crown pillar after destressing
the 1802E sill pillar only (MPa)
Table 7.14 Major principal stress distribution in the 1802E sill pillar after destressing the
IS02E siii pillar only (MPa)
XXI

• NOTATION
a Radius of the circular opening e4 Total mining-induced strain
Coefficient matrixenergy calculated at the
[Alboundary of the opening
AI. A2 Areaec Critical strain energy
B Element strain-displacementEnergy dissipated in the cycleEornatrix
Eo Energy generated by the trernor
in the rock rnassBI, 82 Brittleness
Ej Isotropie elastic modulus{B} Known vector
{Eo} Elastic modulus in theBer Burst-efficiency ratio
destressed zone
B~( Brittleness Index NloditïedEk Energy accumulated in the rock
BPI Burst Potential Index mass
c Cohesion EO Energy necessary for initiatingt
[0] Stress strain relationship matrix rockburst
[Dol Stress strain relationship matrix er Seismic energy released
of aIl elements in the destressede~ Seismic energy released in the
zonefirst mining sequence
Dl Failure Duration IndexSeismic energy releascd in thee;
E Elastic modulussecond mining sequence
el Stored strain energy due to ER Elastic energy recovered during
induced stresses unloading
el steain energy caused by in situ El Elastic modulus in xoy plane
stresses (j0 in the surrounding E2 Elastic modulus in xoz plane• rock mass

Lisr ofNorations
• E3 Elastic rnodulus in yoz plane [Km] Stiffness rnatrix of aIl elements
ERR Energy release rate in the zone which is mined out
ESR Energy storage rate klm Mine stiffness
ESS Excess shear stress criterion kpp Local stiffness
{Pl Element load vector due to k:\ Horizontal (x direction) to
body force vertical stress ratio
{FI} Element load vector due to the ky Horizontal (y direction) ta
surface traction vertical stress ratio
{Pl Element load vector L Length
{F* } Concentrated forces applied on li Directional cosine for x-
the surface direction
{Fa,,} Load vector due to the initial Lz.~ Work used for breaking and
stresses crushing rock mass volume
{FB} Initial stress ratio vectordischarged to an opening
Gl Shear modulus in xoy planeM Bending moment
G2 Shear modulus in yoz planemi Directional cosine for y-
directionG3 Shear modulus in zox plane
[N] Element shape functionMoment of inertia
[Nt] Array consists of the eight[J] Jacobian matrix nodes shape function on the
K Horizontal to vertical stress element side subjected to
ratio boundary traction
KI Stiffness matrix of elements in nj Directional cosine for z-
the surrounding rock mass direction
[KC] Element stiffness matrix Nj(x,y,z) Element nodal shape function
• Ki The stiffness at the immining P Vertical initial stress
sequencexxiii

List ofNotations
• ~ External loading representing Um Stored strain energy in the
body forces in the rock mass mined rock.
pz lnitial vertical stress in the v Displacement in y direction
elementary volume V Volume of the modelied
{q} Distributed surface traction domain
Q Shear force V~ Strain energy of the rock mass
r Distance from the calculated in the elementary volume
point to the centre of the Vc Elastic energy accumulated in
opening the broken rock mass during
R One round of the face advance rockburst
Ra Constraint supportVI Initial strain energy of the rock
Rb Constraint supportmass in the elementary volume
RMR Rock mass ratingVm Volume of rock mass (0 be
minedS Modelled domain boundary
surfaceVu Strain energy of volume change
Sm Boundary surface area of theVo Mine openings' volume
rock mass to be rnined Vp Strain energy of distortion
Sa Mine openings' boundary w Displacement in z direction
surface area W work (or the variation of the
[Tl Transformation matrices potential energy in the
T~ Energetic rockburst indicatorsystem) done by the shifting of
external and gravitationalu Displacernent in x direction
forces working on the
li l Displacements convergence and deformation
U Strain energy stored in the rockof the rock mass
...
mass surrounding the W· Integration weight factor1
• excavation WeI Burst Liability Index
xxiv

List ofNotations
• ~~ Kinetic energy {SC} Element nodal displacements
~ The amount of the releasedvector
energy E Strain
~~ Energy dissipated through {E' } Strain tensor related to the local
supporting system co-ordinate system
Wt Potential energy ê l Major strain
x Global co-ordinate Er Deformation at failure
{x} Unknown vector for linear <P Dip
equation grooupsQ> Shear angle taken from the
y Global co-ordinate failure surface in Mohrts
z Global co-ordinate diagram
x local co-ordinate (I)' Angle from the vertical radial
y local co-ordinate direction c10ckwise to the
calculated radial directionz local co-ordinate
Q>, Energy of particle ejected at~p Load vector
failure in a uniaxial compression
~Wk Change in seismic energy test
~Wr Change in potential energy Q>o Maximum energy stored in
Coefficient of vertical stressloading
a
concentration ~s Static friction angle
{a} Rock fragmentation factors P,r Average density of broken rock
p Coefficient of energymass (assumed to be 2.5 tlm3
)
concentration ç Local co-ordinate
{~} Stress dissipation factors Çà, Local co-ordinate at integration
6 Strikepoint
• Tl Local co-ordinate:<xv

List ofNotations
• l1J Local co-ordinate at integration O'e Uniaxial compressive strength
pointO'n Normal stress at the slipping
ç Local co-ordinate point
Çk Local co-ordinate at integration 0'0 Mean applied stress
pointCfl Uniaxial tensile strength
cr StressNormal stress in x directionCfx
d Stress at the i1h miningNormal stress in y directionay
sequence
az Normal stress in z direction{Cf' } Stress tensor related to the local
co-ordinate system0'0 Initial normal stress in xx
directional) Initial (in situ) stresses
cryO Initial normal stress in y[O'OC] Element initial stress matrix
direction
al Major principal stress O'zn Initial normal stress in z
a. Intermediate principal stress direction
a\ Minor principal stress t~y Shear stress on xoy plane
0'0 Post destress remaining stresst yz Shear stress on yoz plane
0'01 Stress tensor in the destressedt lx Shear stress on zox plane
zone Jls Static friction factor
O'mu Mining induced stress y Body force per unit volume
O'r Radial stress around the circular te Shear stress available to
opening produce a seismic event once
<it Tangentiai stress around the failure has started
circular opening t Shear stress at the initiation
O'l(X,y,Z) Vertical stress in the point
• elementary volume tu Dynamic resistance at this point
X.XVI

v Poisson ·s ratio
•
•
J.l
u
Dynamic friction factor
Bearn detlection
List ofNotations
Va
xxvii
Average velocity of broken rock
mass ejected to an opening
during rockburst
•
•
•
CHAPTER 1
INTRODUCTION
1.1 GENERAL
Rock mass instabilities have always been a safety hazard in underground mines.
Underground rock mass instabilities are of many types. Among those are the weU known
rockburst phenomena that cao have severe consequences such as damage to the
underground workings, equipment, and as a result cao cause long delay of the mining
operation. But most of aU, the occurrence of rockburst in underground mines can cause
injuries and even fatalities among the mine workers. Today, mining engineers are able to
design different mine support systems against ground fall with a relatively high degree of
confidence. Unfortunately, this has not been always the case when dealing with rockburst
prone ground.
The tirst report about rockburst seems to have emerged trom Kolar Gold Field in Iodia at
the end of the 19&h century, where the mining depth wu still under 500 m (Morrison,
1942; Blake, 1972). The problem started to be noticed in the Witwatersrand mines in
South Africa a few years later (Cook et al., 1966). Sorne East European countries such as
Russia, Chechslovk also faced the problem (petukhov, 1987, 1990). China also reported
the rockburst phenomenon as early as 1933 at the SL Coal Mine and more than 2000
rockbursts had taken placed since 1949 (Tan, 1986; Mei and Lu, 1987; Lu et al, 1993). In
the United States, the first rockburst seems to have occurred in 1904 at the Atlantic Mine
in the copper district in Michigan (Boistad, 1990).
Detailed records of rockburst incidents in Canadian mines including related damage,
injuries and fatalities are best illustrated by the records of the Ontario Ministry of Labor.
From 1928 to 1990, nearly 4000 rockbursts and 57 associated fatalities were reported ta
the Ministry or ils predecessor, the Department of Mines (Hedley, 1992). There bas been

•
•
Chapter 1 Introduction
less documentation of rockbursts in Quebec mines although incidents of rockbursts and
related fatalities are probably no less frequent than in Ontario mines.
With the persistence and (sometimes) growth of the problem, research efforts were made
worldwide and principally in the regions touched by rockbursts. The analytical studies
originally frorn South Africa set the paces on subsequent rockburst research. The post
failure studies on rocks, stress analysis. and the energy approach in the unstable
equilibriurn analysis (Cook, 1965; Diest. 1965; Cook et al., 1966; Salarnon 1970.1974)
are important notions that are still in use in present research investigations.
1.2 CLASSIFICATION OF ROCKBURST MECHANISMS
Rockbursts and other seismic events that may oceur within rock masses due to mining
activities are associated with unstable equilibrium states that may involve one of two
fundamental mechanisms (Brown. 1984):
• slip on pre-existing discontinuities; or
• fracturing of intact rock.
Ortlepp ( 1992) suggested the classification of main rockburst mechanisms as follows:
• Strainbursting
• Buckling
• Pillar or face crushing
• Shear rupture events
• Fault-slip events
Hedley (1992) classified rockbursts into three categories:
• Inherent hursts to emphasize the pre-mining stresses were high enough to cause
failure when the initial development openings were driven,
• Induced bursts to represent pillar and crush bursts caused by mining operations
transferring and concentrating stress on the remaining structures such as pillars.
• Fault-slip burst represent slippage suddenly occurring along a geological
weakness plane.
1-2

•Chapter J Introduction
In the present thesis, rockburst mechanisms are grouped ioto three broad categories as
shown in Figure 1. 1. They are:
• straiobursts and
• fault-slip bursts
• combined mechanisms.
It is noted that the majority of rockbursts are of the strainburst type. which appears to be
of great significance for deep hard rock mines.
1 Due to the exis tence 0 fi
: structural featureslfaults. dykes. i1 shears. contacts) 1
~1
1
Due to the existence of mine 1
1
openings. pillars. abutments !
RockburstMechanisms
Strainburst Fault-slip~---:i-'--c-o-m-b-in-a-t-jo-n-...;...I;'i--~'
1 1 1 1 .
~ /Dan2er to man at the face'"""\4 ~~ dange; to equipment. delays to~~ mine operation /'
Figure 1.1 Flowchart illustrating the classification of rockburst mechaoisms
•
Strainbursts are associated with the release of strain energy in the fonn of seismic energy
in highly stressed volume of brittle rock around mine openings. and are therefore related
to the creation of an adverse geometry in areas that are prone to rockbursting (Mitri et al.,
1993). Thus. the problem is dependent on the size. shape and the location of a mine
•Chapter J Introduction
opening or a pillar as weil as the mining induced stresses and mining sequences. The
significant amount of energy stored in highly stressed, brittle rock surrounding an opening
or within a pillar can result in the sudden creation of fractures within the intact rock and
explosive displacement of large portions of rock mass into underground openings. For the
fault-slip burst. shearing on distinct geological features (i.e. faults. dykes, and shears) is
usually considered to be the mechanism associated with the problem. It is expected that.
in general terms, the magnitude of fault-slip type seismic events (ranging from 2.5 to 5.0)
is larger than the strainburst type events (ranging l'rom -0.2 to 2.5) (Ortlepp. 1994).
Nevertheless. this has no relevance to the amount of damage that can result l'rom either
type of rockburst. since this is a function of the distance between the seismic event and
the opening, the extent of local rock mass fracturing, and the pre-installed support. Thus.
both types of rockburst are of equal significance in terms of the potential danger to the
mineworkers at the face. damage to equipment and delays to the mine operation.
A statistical analysis of the relationship of geologic features to seismic events was carried
out for Lucky Friday Mine. Idaho (Scott. 1990). A set of 746 events that occurred from
1982 to 1986 at depth 1600 to 1800m was analysed together with geologic information
about each event. Preliminary results indicated that 29% of the seismic events occurred
on strike-slip or bedding plane faults. whereas 71 % of the evenls were not associated \Vith
identified faults.
Although strainbursts generally involved ooly small amounts of rock. they accounted for
the great majority of rockburst accidents at relatively shallow depth at which mining then
took place (Ortlepp, 1982. 1983). Examples of such phenomena are crown pillar bursts in
overhand cut-and-fill mining, face bursts at development headings at depth. and tloor
bursts commonly encountered with shaft sinking.
1.3 ROCKBURST ALLEVIATION AND CONTROL ~IETHODS
ln general. there are three principal methods of controlling rockbursts. as follows:
• • Artificial ground support
14

•
•
ChQpt~r Ilnl1'tHhlction
• Alternative mining methods and/or mining sequences, and
• Ground preconditioning
Theses approaches can be classified into two broad categories: 'strategie' and 'taetical'
(Salamon, 1983). The strategie approach is to try to diminish the possibility of
encounterlng rockburst-prone ground, or to reduce the severity of the rockbursts. The
available techniques include optimizing the shape and orientation of the development
openings, layout of permanent piUars and the use of bacldill. The taetical approach is ta
accept sorne rockbursting is inevitable, but seeks to limit the extent of the damage or to
control the timing ofa rockburst.
1.3.1 Alteraative Mininl Metbodsandlor Mining Sequences
Although rockbursts have been known to mining engineers since the beginning of the
century and considerable research into their occurrence, mechanisms and behavioural
characteristics has been undertaken, there seems that no certain method of prediction or
prevention of rockbursts has yet emerged. Early experiences in combating rockbursts were
gained primarily in South Africa (Whittaker et QI., 1992).
Mining and excavating in the rockburst prone area cao be made less cumbersome by
changing the geometry and orientation of the openings, layout of the pillars and the stope,
mining sequences and use ofbacldill, etc (Hedley, 1992).
Efforts have been made to reduce the hazardous occurrence of rockbursts. These have
relied on the traditional approaches of engineers: observations, experiences and reasoning
foUowed by praetical trials (Salarnon, 1983). The application of the longwall mining
method in deep hard rock mines prone to rockbursts might be considered a result of these
efforts. This method not only allows more minerai to be recovered, but aise considerably
reduces high stress concentrations induced by mining due to its simple layout and hence
reduces the possibility of rockbursts in comparison to the room and pillar mining approach
(Salamon, 1993). The introduction of stablizing pillars large enough to reduce
1-S

•
•
Chopter J Introduction
convergence of the mined-out area has reduced the total seismicity and the occurrence of
rockbursts in South African gold mines (Ortlepp, 1984).
Sorne notable studies have been reported on the phenomenon ofrockbursts (Cook et al.,
1966; McGarr and Wiebols, 1977; Robson, 1940; Morrison, 1942; Dickout, 1972).
Although considerable attention was devoted to coUating observed data on rockbursts,
particularly during the early stages of research into rockbursts, il was appreciated that
more detailed investigations were necessary in arder ta identify and clarify the role of the
principal factors.
1.3.2 Ground Support
In sorne cases, it is impossible to prevent rockbursts trom occurring, either because of
very high stress conditions or past mining praetices that may have created a layout, which
is rockburst prone. Under rockburst conditions, it becomes increasingly important for the
support system ta provide and maintain complete area coverage of the retainingl holding
funetion, in arder to avoid violent unravelling of the rock mass. Based on South Afiican
experience, it is DOW clear that mine openïngs cao he designed to survive fairly large
rockburst events, using cable lacing support systems (McCreath et al., 1992). Designing
of support systems for burst-prone ground has three components. It is important to
understand what the demand on the support systems is likely to be, ta know what the
capacity of difTerent support systems are and ta assess the hazard that is posed by the
potential for rockbursts. The support system firstly should reinforce the rock mass in arder
to control the failure of the rock. When this is not successful, it then has ta hold the failed
rock and control the amaunt of the displacement that accurs. And finaUy, it has to retain
the failed rock and absorb the energy with which this material is being forcibly driven. The
first two functions, reinforcing and holding, are accomplished within the volume of the
rock mass, usuaUy by bolts or rebars or cables, while the third funetion is accomplished
ooly on the surface of the rock mass, usually by mesh or increasingly by shotcrete
(McCreath et. al. 1992).
1-6

•
•
Chapeer 1 Introduction
There have been many publications on ground support in burst prone conditions in the
last two decades. Among them the followings may be the representatives: Blake and
Cuvelier (1988); Davidge. et al. (1988); Hedley. et al. (1983); Roberts and Brummer
(1988); McCreath and Kaiser (1992); Ortlepp (1992); Brummer and Kaiser (1995);
Stacey. et al. (1995). Sorne traditionaI support systems were ineffective in controlling
rockburst damage, such as concrete lining and conventional timber posts and beams. The
installations of stronger and more rigid systems. such as mechanicaI bolls and rebar, were
successful in controlling damage from smaller magnitude roekbursts. but were ineffecti ve
against larger events. It was realized that the rigidity of support \Vas contributing to the
problem. This Ied to the introduction of supports with yielding characteristics. for
example. the friction type supports. steel mesh. steel or plastic fibre shotcrete. yielding
bolts. etc.
Jeager (1992) reported two new support units for the control of rockburst damage: rapid
yield hydraulic prop and cone boit tendon. The prop. which yields at 3 mis. has a 3090
lower mass than existing props and a variable yield force. can be blasted-on and be used
in support systems which are always close to the stope face where most of the casualties
and dilution oceur. The cone boIt tendon is used for the support of tunnels under
rockburst conditions. The cone boit tendon can yield more than 0.5 m at a force of 80 kN.
Il was found that the cone bolts were no more difficult to install than other full column
grouted tendons. The cone bolts fulfil a long realized need for the better control of
rockburst damage in tunnels.
Stacey et al. (1995) reported their test results based on the static tests on the energy
absorbing capacity of reinforced shotcrete. The mesh-reinforced shotcrete has sufficient
energy-absorbing capacity to contain rockbursts of significant magnitude. Even a 50-mm
thick mesh-reinforced shotcrete layer has greater energy-absorbing capaeity than fully
grouted 16-mm rebar. Fibre-reinforced shotcrete has energy absorbing capacities of the
same order as, or better than, those of 16-mm rebar. However. the perfonnance of the
1-7

•
•
Chapter 1 Introduction
fibre-reinforced shotcrete is erratic. CRRP (1996) stated from actual observations that
both mesh and fibre-reinforced shotcrete can survive ground motions of I.S-2.0m/sec.
But even the best support systems based on optimal combinations of holdinglreinforcing
and tough-retaining elements will he Iimited to energy absorption capacities of roughly
SOKJ/m2 (CRRP. 1996). In sorne situations. rockbursts may be so severe that they
generate violent ejection of rock despite any reasonable support system (i.e.. exceeding
50KJ/m2). In these cases the maximum practical support limit is reached and a
combination of strategie mine-design measures such as modified destressing must be
adopted to alter the conditions leading to rockbursts.
1.3.3 Ground Preconditioning
The development of local stress concentrations. increasing the potential of the rockburst
hazard. requires the use of temporary preventive actions. These actions are connected
with a particular location and lime of their realisation. The task relies upon changing the
physical-mechanical properties (first of ail the strength) of the rock environment. usually
through weakening (failure) of its structure. The basic preventive techniques used for this
purpose are destressing and torpedo blasting (blasting in roof strata with large charges of
explosives) (Adams. et al.. 1993: Landriault and Oliver. 1992: Lightfoot. 1993: Lightfoot.
et al.. 1996; Toper. et al.. 1997: Soler and Swanson. 1993).
1-8

•Chapter J Introduction
Landriault et al. (1992) reported destress slot concept for bulk mining at depth. The
conceptual solution consisted of creation of a destress envelope in the orebody large
enough to allow the drilling and blasting of VRM panels to be conducted in a stress
relaxed section of the rock mass (See Figure 1.2). The destress or relaxation envelope
4~OO
M.c.F.
--ll ~
1loi~o.,"
•
Figure 1.2 6600 level plan showing destress slot mining sequence atCreighton Mine (After Landriault el al.. 1992)
would be created through a combination of rock mass failure around the excavation
perimeter and stress shadowing brought about by the changing excavation geometry
resulting from the mining. They utilized this concept on an actual production scale in 400
orebody at Creighton ~Iine between 6600 and 6800 levels. The concept accompanied by
proper sequencing of the panels mined. will allow the relaxation zone to be passively
extended as mining progresses without bursting problems generally associated with
unfavourable geometry of an excavation at depth.
ln addition to reducing the stress in a particular mine structure, a weil designed destress
blasting aIso results in modifying the rockmass properties of the structure 50 that its mode
of faHure is changed. Since rockburst is a1most exclusively associated with brittle rocks
1-9

•
•
Chapter 1 Introduction
that behave elastically and which have the potential to fail violently when their strength is
exceeded. it is obvious that by destress blasting of such a rock mass. one attempts to
change its failure mode from briule to ductile. Thus destress blasting should not only
result in the reduction of stress in the zone but should also promote yield type of failure.
The first documented experiments undertaken into the use of explosives for destressing
the rock ahead of a deep level mine face in South Africa were at ERPM in the 1950's
(Roux. et al.. 1957. and Hill and Plewman. (957). This involved a system of 3m long
holes of a normal diameter drilled at regular intervals into the stope face. The
preconditioning holes were drilled approximately once every week in replacement of the
normal 1m long production holes. A considerable reduction in face bursting and
subsequent accident statistics was reported. In the late 1980s destress blasting was again
re-evaluated for the South African gold mines (Rorke and Brummer. 1988; Rorke et al.
1990: Adams. et al.. 1993: Lightfoot et al.. 1996: Toper. et al.. 1997).
In North American mines. destressing is more widely practiced and apparently more
successful (Hedley. (992). Detressing of sill pillar was done on a regular basis in the
mine Coeur d'Alene district of northem ldaho. Blake (1972) and Board and Fairhurst
( (983) reported instrumented field trials. lt \Vas reported that preconditioning
significantly reduced seismic activity during mining (Blake. (982).
In Canadian mines, destressing is normally practiced in sill pillars in thin. steeply-dipping
orebodies such as those at Campbell Red Lake Mine. Dickenson Mine (now Red Lake
Mine). Falconbridge Mine (Moruzi and Pasieka. (964), and Kirkland Lake (Cook and
Bruce, 1983: Hanson. et al, 1987). At [nco' s Creighton Mine. destress blasting is in
regular use in driving development openings, and in pillars which is a form of
preconditioning (Oliver. et al.. 1987; MacDonald. et al.. 1988: O'Donnell. (992).
Mitri et al. (1988) used a series of finite element numerical simulations to address the
issue of the optimum design and location of a destress blast. and the volume of the
blasted rock in overhand cut-and-fill in typical Canadian Precambrian Shield conditions.
They reported the results of six different models in which sequential mining was done
1~1O

•
•
Chapter 1 Introduction
from the premining state to the stage where critical safety levels were detected in the
stope back. at which stage, destress blasting was modelled. These results. taken in
context. show that destress blasting can be modelled using numerical procedures. Mitri et
al. (1990) adopted Salamon's energy approach to calculate mining-induced strain energy
in the rock mass using finite elements. The technique was applied to Campbell Redlake
mine, Balmetown, Ontario. to evaluate the effectiveness of destress blasting by
examining mining induced energy changes before and after the blasting (Mitri et al.,
1993).
1.4 SCOPE AND OBJECTIVES
1.4.1 Research Scope
As described in section 1.3. in sorne mining situations. the only way which could reduce
the risk of rockburst is to transfer the high stresses in a mine face abutment to a relatively
far area ahead of the face. This can be achieved by destressing the adjacent surrounding
rock. such as for the mine drift. ramps. crosscut. and shafts development. etc. through
destressing the crown/sill pillars in stope.
Despite the apparent success of the destress blasting technique there appears to be a
fundamental absence of dedicated design-analysis method and modelling technique. It is
therefore essential to develop an analytical tool for quantifying the effects of mining
openings geometry and mining sequence on the burst potential. At what kinds of
situations should the destress blasting method be used to control the rockburst? And what
kind of destress blasting pattern is more suitable for the specifie situation? And what is
the effectiveness of a destress blasting'? Why are sorne of the destress blasting practices
successfuI. but sorne others are not?
Tc address the above questions is the target of this doctoral research. Knowledge of the
exact mechanism of a rockburst-related seismic event is often difficult to obtain. and it is
still the subject of extensive research. Current models in both seismology and rock

.'
•
Chapeer 1 Introduction
mechanics consider simplitïed mechanisms for the unstable release of energy (Mandl.
1988).
Trying to mode1 the detailed process of failure at a mining face. or along a structural
feature according to a proposed mechanism would be very complex, and possibly scale
dependent, with only limited practical applications. A simple representation of the
rockburst mechanism, which makes mechanical sense. but avoids detail. is usually a more
sound approach to the problem.
The current research will focus on the assessment and control of strainbursts using
destress blasting method in the deep. hard rock mine environment.
1.4.2 Objectives
The main objective of this research project is to develop a dedicated method for the
simulation and evaluations of destress blasting to help better understanding rockburst
control using destress blasting. More specitïcally. this research aims to:
• Develop a methodology to identify mining situations which cali for the use of
destress blasting.
• Develop a new geomechanical model to simulate the destress blasting.
• Develop a 3-dimensional finite element madel to implement the new methodology
and geomechanical model.
• Perform model veritication and parametric study.
• Use the new developed model to do back analysis
1.5 THESIS OUTLlNE
Chapter 1 discusses the scope and objectives of the thesis.
Chapter 2 presents the literature review on the evaluation of rockburst potential.
Chapter 3 reviews destress blasting practice in hard rock mines. The geomechanical
effects of destress blasting are discussed.
1-12

•
•
C/zapter J introduction
Chapter 4 presents the new methodology to evaluate the burst potential using mining
induced energy
Chapter 5 presents the proposed numerical model for destress blasting. A finite element
model e-z tools3D is developed by the author. This chapler explains the modelling
procedure of the rnining sequences and destress blasting. The rock failure is also
discussed with the newly introduced energy parameters. The element isoparametric test is
presented in the chapter.
Chapter 6 deals with the model verification and parametric sludy. The effects of varying
destressing patterns. rock fragmentation factor. stresses dissipation factor. and the initial
stresses are studied in detail.
Chapter 7 gives a detailed description of destress blasting case studies; namely of a cut
and-fill mine stope as weIl as the discussion of the whole model and its results.
Chapter 8 presents the general conclusions of this doctoral thesis as weIl as the
recommendations for the further research.
1-13

•
•
CHAPTER2
LITERATURE REVIEW ON THE EVALUATION OFROCKBURSTPOTENTIAL
2.1 INTRODUCTION
Rockburst may cause damage to underground openings and equipment. This results in a
cost increase and a loss of productivity for the operator. Blâha (1990) reported that the
production cost in coal mines in the Ostrava-Karvinâ region in Poland increased by 100%
when the rnined area became burst-prone. On the safety issue. Salamon (1983) noted that
in 1979. 62% of fatalities in South African mines could be attributed to rockburst and
rockfalls.ln the first halfof 1996 only. there were more than 35 fatalities associated with
rockbursts in South African mines (Ryman-Lipinsky and Bakker, 1997).
As stated in Chapter 1. before any action is taken to fight rockburst. the first thing is to
recognize the rockburst potential. Many different methods are utilized for the
estimation/prediction of rockburst hazard. Generally these methods may be described as
seismological and rock mechanics methods. The literature review aims to screen the
different tools available for the evaluation of rockburst potential in underground mines.
2.2 ROCKBURST POTENTIAL EVALUATION USING ROCK l\IECHANICSMETHOOS
In the case of rockbursts. the engineer can examine various alternative sequences or
designs by comparison of the relative seismic potential of each design. Stress. energy and
stiffness approaches can be applied using numerical models for the determination of this
seismic potential. Critical values of the model output parameter can be obtained using
back-analysis and forward modelling can then be conducted with a higher degree of
confidence. The results can be applied for the selection of mining method, excavation
sequence, access to the stopes and identification of areas with hazard for rockburst
(CRRP, 1996).

•Chaprer 2 Literaturt Revie~ ...· ofRockburst Phenomella
2.2.1 Stress Method
2.2.1.1 Hard rock behaviour under uniaxial compression
Extensive laboratory research work was undertaken which was aimed at clarifying the
behaviour of rock under stress and in particular, identifying and examining the
defonnation characteristics and the mechanism of failure of briule rocks (Cook,1965;
Cook et (ll.~ 1966: Hoek and Bieniawski: 1965a and 1965b; Martin, 1996: Shao et al..
1996: Tang, 1997, Chen et al., 1997: Wu, et al., 1997).
Figure 2.1 shows a typical stress-strain relationship for a rock specimen subjected to
uniaxial compression. Sorne phase boundaries are added. The first phase, curved upward.
is associated with the reversible closure of rnicrocracks: in dense rocks with very low
Axial •Stress
Axial stress
acousticemlSSlons
, 3 4 5
Dilatancy
Strain
•
Figure 2.1 Schematic stress-strain curve of [ow porosity. brittle rocks underuniaxial compression (after Bieniawski, 1967)
porosity. this phase is almost non-existent. Then follows a [inear phase due to the elastic
response of the rock, which extends up to the microfracturing threshold where stable
crack propagation starts. The onset of microcrack growth. which precedes the peak
strength. commonly begins above 50% of the ultimate load, as shown by studies on
volumetrie measurements, acoustic emissions, wave velocity. etc. (e.g.• Paterson. 1978:
Hakami, 1988; Cox and Meredith, 1993: Chen et al .. 1997). When approaching the peak
2-2
Chapter 2 Literature Review ofRockburst Phenomena
strength, the size and density of cracks increase, and cracks interaction becomes more
important. and unstable crack propagation cao be initiated.
Damage accumulation during crack propagation leads to a rapid increase in dilation and
eventually to strain localisation. It is known that. for brittle materials such as rocks,
localisation associated with loss of homogeneity of strain field, usually occurs in the
vicinity of the peak load (e.g., Wawersik et aL, 1990). In the post peak phase, localisation
phenomena become more important, and usually produce a graduai reduction of the
sample cohesion with increasing inelastic strain. This causes a pronounced softening of
the material, which is a progressive decrease of strength as strain accumulates.
One important aspect of the rock behaviour, used with several indices. is that inelastic
strain can develop in the pre-peak regime and can dissipate energy by microcracking.
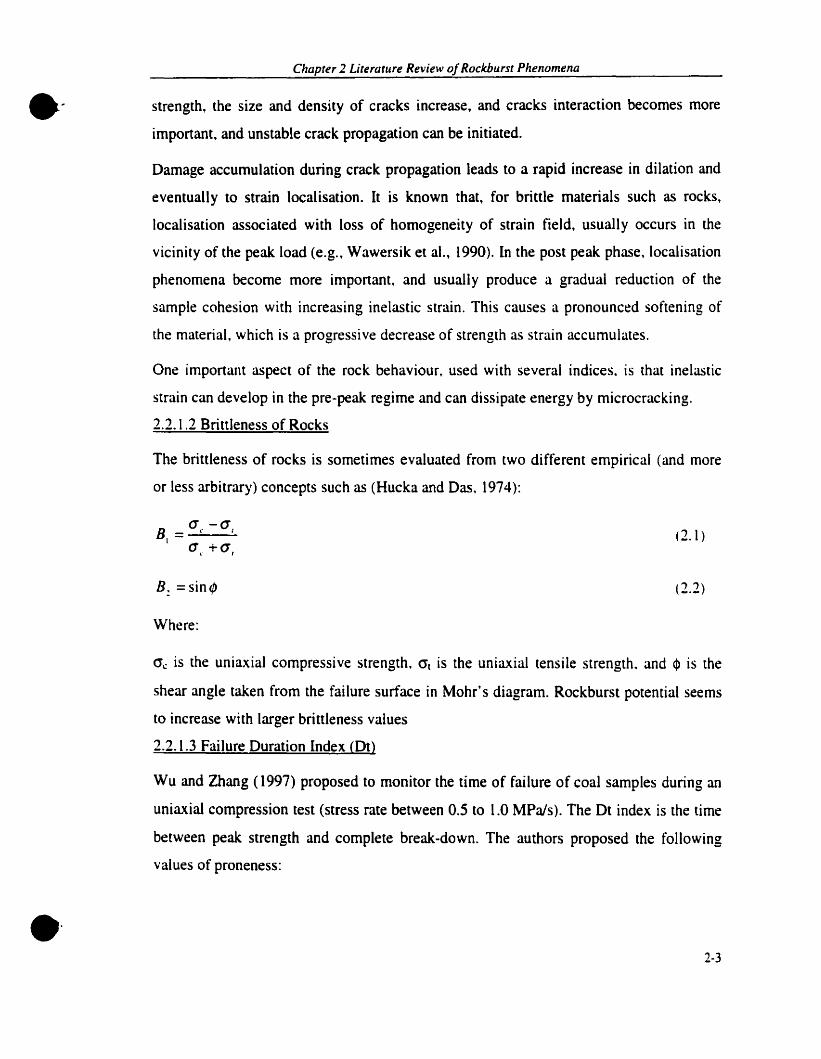
2.2.1.2 Brittleness of Rocks
The brittleness of rocks is sometimes evaluated from two different empirical (and more
or less arbitrary) concepts such as (Hucka and Das. 1974):
B =(j~-(jl
1 (j +(j, ,
Where:
(2.1 )
(2.2)
.'
0'1: is the uniaxial compressive strength. O'l is the uniaxial tensile strength. and q> is the
shear angle taken from the failure surface in Mohr' s diagram. Rockburst potential seems
to increase with larger brittleness values
2.2.1.3 Failure Duration Index (Dt)
Wu and Zhang (1997) proposed to monitor the time of failure of coal sarnples during an
uniaxial compression test (stress rate between 0.5 to 1.0 MPals). The Dt index is the time
between peak strength and complete break-down. The authors proposed the following
values of proneness:
2-3

•Chapter 2 Literature Review ofRockburst Phenomena
Table 2.1 Indicative values for the Dt index (after Wu and Zhang, 1997)
Dt value Bursting proneness
Lower than 50 ms Strong
Between 50 and 500 ms Medium
Larger than 500 ms None2.2.1.4 Activity index
Tao ( 1988) proposed an index that considers the uniaxial compressive strength (Je and the
major principal stress 0"1 in the region of the opening. His experience in Chinese mines
led to the following classification of risk:
Table 2.2 Rockburst potential classes (after Tao, 1988)
Ctass O"Ja\ Bursting activity Comments
1 >13.5 No No acoustic emission
2 13.5-5.5 Low Weak acoustic emissions
3 5.5-2.5 Average Loud acoustic emissions
4 <2.5 High Very toud acoustic emissions
Where (JI is the major principal stress, cre is the uniaxial compress strength.
2.2. 1.5 Excess Shear Stress CESS)
The South Africao experience shows that the notion of energy release rate (ERR) is not
suited for fault-slip type rockbursts. Ryder (1987) proposed a similar criterian, the
excess shear stress criterian (ESS), that could be applied to this type of rockbursts. This
criterion is based on the energy available when passing from statÎC resistance (before slip
movement) to the dynamic resistance (during slip).
The statÎC resistance t s of the discontinuity cao be estimated with a Mohr-Caulomb
criterion such as:
• with J.L s =tan tPJ
(2.3)
(2.4)
2-4

•Chapler 2 Lireralure Review ofRockhursl Phenomena
where c is the cohesion, Ils is the statie friction factor, an is the normal stress at the
slipping point, and ct>s is the statie friction angle. Once the motion has started. the value of
ESS is given by:
(2.5)
where te is the net shear stress available to produce a seismic event once failure has
started, t is the shear stress at the initiation point, and td is the dynamie resistance at this
point and given by:
with f.I. = tanq.
(2.6)
(2.7)
where f.I. is the dynamic friction factor. and q. is the dynamic friction angle. Ryder (1987)
suggested these average values of tl: to produce significant seismic events:
te == 20 MPa
for an unstable movement along a pre-existing discontinuity;
for a shear failure of intact rock.
•
In theory, the larger ESS value brought by the progression of the opening towards the
discontinuity, the larger surface of the discontinuity would he involved, and the larger
would be the seismic event produced. In practice however. back analyses performed
showed that not ail positive ESS situation yielded seismic events. This couId be due to
lack of accuracy on the data and/or stress involved (Ryder. 1987). Gill and Aubertin
(1988) note that this absence of rockbursts for positive ESS confinns the fact that the
discontinuity post-peak stiffness and the rock mass stiffness on both sides of the
discontinuity may play a major role in the process, or maybe te should not be assumed;
rather il should be assessed by laboratory testing.
2.2.1.6 Stress State
The rockburst potential can be estimated based on the relative stresses in the rock mass.
These stresses can be examined with the speed of acoustic waves. Mining can induce
conditions whieh promote rockbursting by inducing high stress level due to the geometry
of openings and the mining sequence. This technique can then be used to monitor the2-5

•
•
Chapter 2 Literalure Review ofRockhurSl Phenomena
conditions which promote rockbursting by inducing high stress level due to the geometry
of openings and the mining sequence. This technique can then be used to monitor the
stress state induced by mining (5ingh. (989). The continuous monitoring of the electric
resistance changes in the rock mass has been used to predict the frequency of
rockbursting (Stopinski and Dmowska. 1984). This monitoring facilities the observation
of the effects of tectonic stresses and mining induced stresses. These observations can
also indicate the location and necessity for applying a destress blasting technique to the
rock mass (5ingh, 1989).
2.2.2 Energy Method
As mining is a progressive activity. the excavations are modified in shape and enlarged
with lime. It is logical, therefore. to examine the strain energy changes resulting from
specifie changes in the mining geometry (Srinivasan et al.. 1997). Since rockbursts are
the result of a violent release of energy it is natural that an analysis of energy be used to
explain the mechanics of violent rock faHure. Initially only the energy stored within the
rock was considered as the source of the Iiberated energy. Later it was realized that there
was a change in potencial energy of the surrounding rock mass because of mining
operations.
Cook (1963) was the first ta point out the significance of energy changes in the rock
masses in deep underground mines due to mining, and the link between excess potential
energy and the damage due to rockbursts. Following Cook's contributions. several
researchers investigated the link between energy release rates and rockburst hazards. In
the meantime. theoretical studies were carried out by Salamon (1964a. 1964b. 1964c. and
1984) who successfully applied the theory of elasticity to the simulation of the behaviour
of the rock mass surrounding mining excavations. His theory provided a sound
foundation for the energy approach to mine design and furnished rockburst research with
an acceptable theoretical basis. He assumed that the rock mass surrounding mining
excavations behaved as a linear elastic salid but was not necessarily homogeneous or
isotropie. Based on the theory, Mitri et al. (1993) introduced the concept of mining
induced strain energy, which provided an efficient method for the study of the stress
configuration around underground openings induced by mining and made a detailed
2-6

•
•
Chapter 2Lit~ratllre Review 0/RocJcburst Phenonwna
study of the energy balance resulting ftom progressive mining aetivity ln deep
underground bard rock mines.
2.2.2.1 Enerav Balance
Since 1960, many measurements of rock displacement have been performed and they
sugest that the rock mass mechanical behaviour in rockburst situation is essentially of
elastic nature (Ortlepp, 1983). Then the energy balance is usually perfonned using elastic
laws. It could be shown that using elastic laws to evaluate the energy available for
rockbursting is a conservative approach since the energy dissipated by micro ftaeturing in
the pre-peak range is negleeted, hence, the stress and energy concentration around
opening is overestimated.
Onlepp (1983) and Oben and Duvall (1967) discussed the importance of mining-induced
strain energy in the context of rockbursts in South Afriçan hard-rock tabular mining.
Recognizing that energy is required to cause rockburst damage and to generate the
associated seismic waves, Ortlepp (1983) proposed a study of the energy balance in the
rock mass during mining as a means of gaining insight into sorne of the fundamental
aspects ofthe problem. Some ofthe questions he proposed are: What is the source of the
energy? How is it stored? Why is it liberated sporadically when stoping is a regular
cyclic process? How is it triggered? His theoretical developments follow the same trend
as those ofBlake (1972).
When an opening is created or modified, the stored strain energy equilibrium is changed.
Let stage 1be the initial situation before the creation of the opening: the stage following
the creation (or modification) of the opening will be called stage n, as shown in Figure
2.2. The energy balance is concemed with the transition between stage 1and stage II.
When an opening is created, energy becornes available and is provided from two sources.
The first one is the work W (or the variation of the potential energy in the system) done
by the shifting of extemal and gravitational forces working on the convergence and
defonnation of the rock mass. The second source is the stored strain energy UIII in the
mined rock. The sum of these energies (W + UIII) is the total energy available when
passing trom stage 1to stage ll.
2·7

•Chapter 2 Literarure Review ofRockbllrst Phenomena
This energy can be dissipated in two ways. A portion of this energy will be dissipated
S
State [
v
(a)
v
State II
(b)
•
Figure2.2 Mining contïguration and notations in the reference state. i.e. in state 1
(a) and after additional mining, i.e. in state II Cb) (after Salamon. 1984)
with an increase in the strain energy U, stored in the rock mass surrounding the
excavation. It is also possible that the pressure on support elements surrounding the
opening increase: this work ~~ is the second way of energy dissipation.
If the rock mass is considered as an ideal elastic continuum, then no energy is dissipated
through fracturing of inelastic deformation of the rock. With this simplification in mind.
the sum (U.. + "'r) is the total energy dissipated during the mining of the opening.
It is obvious that the total energy dissipated cannat be larger than the energy available
(W + Um)' Considering that the stored strain energy in stage 1 in the rnined rock (Um) is
not available anymore and since Um>O' then (Salamon. 1984)
:!-s

•Chapter 2 Literatllre Review ofRockbursr Phenomena
W +Um>U.. +"': (2.8)
This inequality implies the existence of an excess of energy that must be dissipated when
passing from stage 1 to stage Il. This energy is referred to as the released energy W,.
Then. one can write:
and
~ = (W +Um)-(U" +~) > 0
~Vr~Um>O
(2.9)
(2.10)
t2.11)
(2.12)and
The amaunt of the released energy ~. when larger than the stored strain energy in the
rnined rock (U Ill) in stage I. produces a wave (kinetic energy) that propagates from the
new limits damped by minor tlaws in the rock mass (the latter not being perfectly elastic).
This kinetic energy ~ will be dissipated by the damping process. Since there is no other
way to dissipate the energy. then:
~Vr = U". + ~~
~ =W -(U, +W1
) ~ 0
2.2.2.2 Energv Parameters
•
The change in potential energy W is the driving force behind the other energy
components. If il can be reduced the other energy camponents are correspondingly
reduced. Support. such as backfill. has two beneficial effects. It will reduce the change in
patential energy by reducing volumetrie c10sure in the excavations: and by absorbing
energy. less energy is available to be released as seismic energy. There are sorne other
energy terms in common use. Based on the energy balance. an incrernental approach can
be used ta follow the changes due to rnining. The mining of an underground orebody
usually implies the widening of excavations by increments. This leads to an energy
release rate by unit surface. used when the opening geometry is regular (or two
dimensional analysis). or a volumetrie energy release rate. used for irregular geometry
openings (or three-dimensional analysis).
Stacey and Page (1986) provided a way to evaluate, in a preliminary manner. this energy
release rate (the symbol ERR is commonly used in the literature). This ERR has become
a rockburst prediction tool in South African gold mines (Salamon. 1993). Spottiswoode
2-9

•Chapter 2 Lileralllre Review ofRockburSI Phenomena
(1990) notes that ERR is one of the most used p;rrameters for stope design In deep
underground South African mines. Ryder (1987. 1988) in introducing the notion Excess
Shear Stress ESS for the prediction of fault-slip rockburst observed that ERR has been
found to correlate weIl with depth of face fracturing. hangingwall conditions. and the
decrease in seismicity observed after the introduction of stabilizing pillars in a number of
deep mines. It is the preferred criterion used in current designs of stabilizing pillar and
backfill systems. Energy release rate (ERR) is now a very useful measure for the design
of stope face shapes and investigation of stope interaction and the design of stabilizing
pillars for tabular orebodies in South African mines. lt has been found (Ortiepp. 1983)
that the energy release rate and incidence of seismic activity are statistically associated.
although they are not mechanistically related. Experience shows that continuum
mechanics. even when applied to discontinuous material. often provides correct results.
and it is mathernatically rnuch simpler than the theory of discontinua (Gibowicz et al.
(994). There is also evidence to suggest that in sorne cases. under the sarne rockmass
conditions. rockbursts will occur with machine excavation but not with drill and blast
excavation (Ortlepp et al.. 1994).
This can be attributed to the increased ERR associated with blasting thus rel ieving the
excavation boundary of sorne of the strain energy in the rock. The need to better
situ stresses 0 ..
Figure 2.3 Mining-induced Strain Energy (atler Mitri et al.. 1996a)
Strain energy caused by in
E
Strain energy duemining·induced
stresses o.
o 1a
a1
Afterexcavation
ao
~.~.....~ .......
:...... ...\
( \: :: :\ j
\ .......---.-.-••••.ri
Beforeexcavation
• 2-10

•Cltap~r 2 LiteralU" Rwiew 01Rockbrust Pltenomena
as shown in Figure 2.3 (Mitri et al, 1996a). The idea is based on the assumption that
rockburst phenomena can be attributed to the sudden release of energy in a volume of
highly stressed rock Thus, mining-induced strain energy may serve as an indicator of
rockburst potential, rather than simply relying on mining-induced stress concentration.
The concept is graphically illustrated in Figure 2.4.
Later, Mitri (1996b) explained how the mining-induced strain energy is related ta the
•
ERR
nergy Storage Rate
ESR
--W=ERR+ESR
Work done by body
Forces: W
e-~
•
Figure 2.4 Application ofthe Concept ofChange of Potential
Energy(Mitri, 1996a)
energy starage rate (ESR) and the energy release rate (ERR) using a finite element
modelling approach. Simulation of a crown-pillar case study showed that strainburst
phenomena could he examined with this approach.
2.2.2.3 Indices Based on Stored Elastic Strain Ener&y
2-11
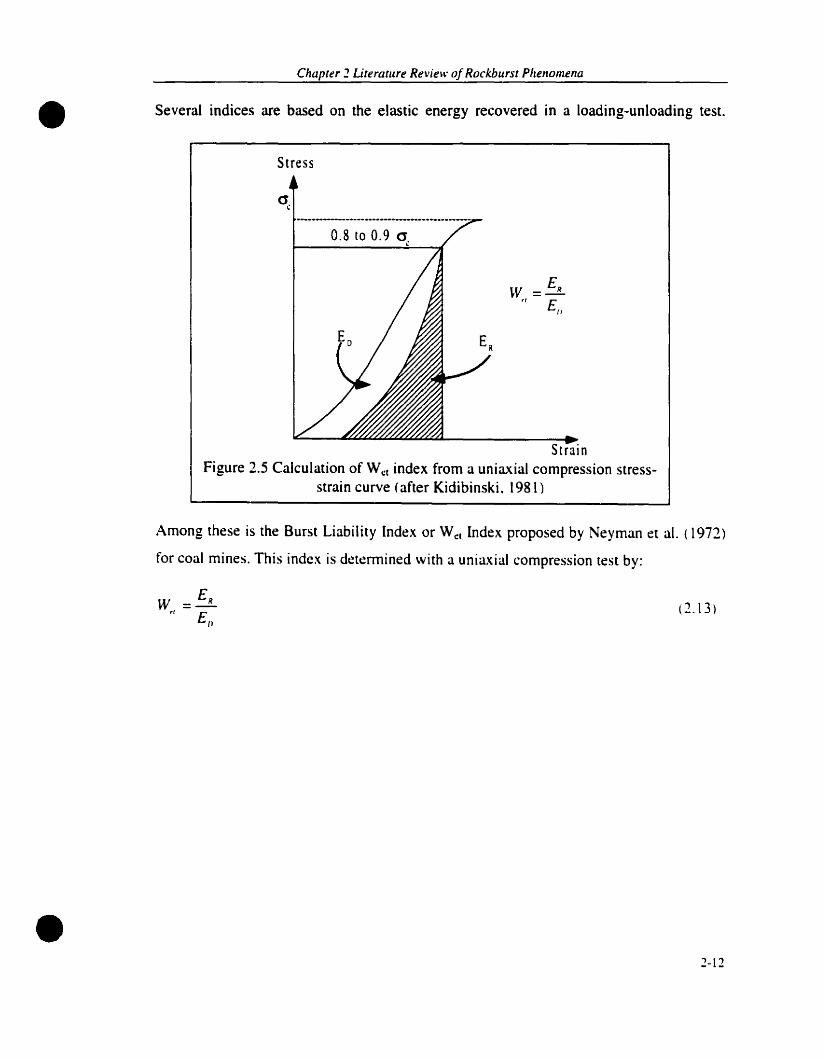
•Chapter 2 LiteratLlre Revie\,,· ofRockburst Phenomena
Severa! indices are based on the elastic energy recovered in a loading-unloading test.
Stress
0.8 [0 0.9 ~
\V = ERri E
Il
Strai nFigure 2.5 Calculation of Wcc index from a uniax.ial compression stress
strain curve (after Kidibinski. 1981)
Among these is the Burst Liability Index or Wcc Index proposed by Neyman et aL (1972)
for coal mines. This index is determined \Vith a uniaxial compression test by:
•
w = ER'1 E
U
(2.13 )
:!-12
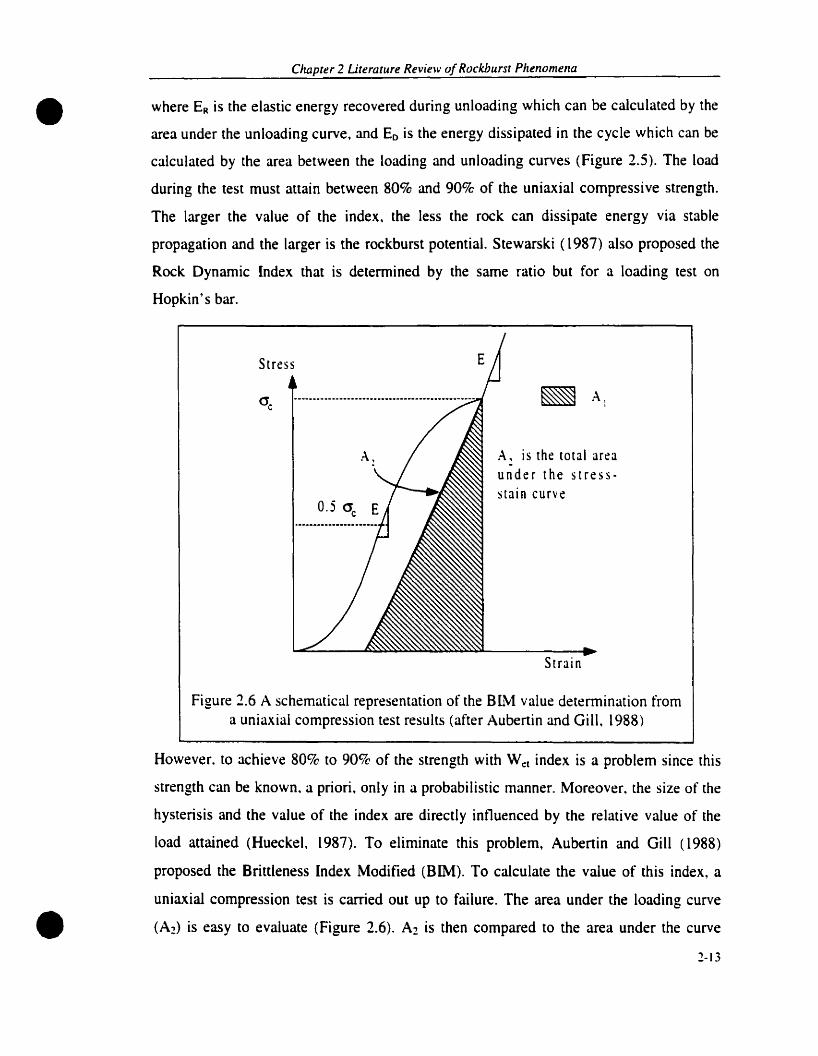
•Chapter 2 Literawre Review ofRockburst Phenomena
where ER is the elastic energy recovered during unloading which can be calculated by the
area under the unloading curve. and Eo is the energy dissipated in the cycle which can be
calculated by the area between the loading and unloading curves (Figure 2.5). The load
during the test must attain between 80% and 90% of the uniaxial compressive strength.
The larger the value of the index. the less the rock can dissipate energy via stable
propagation and the larger is the rockburst potential. Stewarski (1987) also proposed the
Rock Dynamic Index that is determined by the same ratio but for a loading test on
Hopkin' s bar.
Stress
A, is the total areaunder the stressstain curve
•
Strain
Figure 2.6 A schematical representation of the BL\1 value determination froma uniaxial compression test results (after Aubertin and Gill. 1988)
However. to achieve 80% to 90% of the strength with W~t index is a problem since this
strength can be known. a priori. only in a probabilistic manner. Moreover. the size of the
hysterisis and the value of the index are directly intluenced by the relative value of the
load attained (Hueckel, 1987). To eliminate this problem. Aubertin and Gill (1988)
proposed the Brittleness Index Modified (BIM). To calculate the value of this index, a
uniaxial compression test is carried out up to failure. The area under the loading curve
(Aû is easy to evaluate (Figure 2.6). A2 is then compared to the area under the curve
2-13

•Chapter 2 Literature Review ofRockburst Phenomena
corresponding to the deformation modulus of the rock (AI) taken at 50% of the peak
strength. The value of this index is then determined by (Aubertin and Gill, 1988):
A.BIM =-- > 1.0
i\1(2.14)
The smaller the value of the BIM. the higher is the rockburst potential. Aubertin et al
( 1994) also proposed a classification of the proneness of the rock for rockbursting:
Table 2.3 Indicative values of BIM as related to bursting liabilities (after Aubertin et al..1994)
BlM Bursting Iiabilities
Between 1.0 and 1.2 High
Between 1.2 and 1.5 Moderate
Above 1.5 Low
The BlM has also been related to the ratio of pre-peak modulus to the post-peak modulus
and can be used to find the post-peak modulus when it was not determined in laboratory
testing.
Motyczha (see Kidybinski. (981) proposed a Burst-efficiency ratio which is gi ven by:
(2.15)
where ~I is the energy of particle ejected at failure in a uniaxi,l compression test. and $0
is the maximum energy stored in loading and given by (also, Mitri, 1996a):
, cr El1ll - - ,IV ---,II 1
where (j,; is the uniaxial compressive strength. and Er is the deformation at failure.
(2.16)
•
Hou and Jia (1988) presented a factor that combines drilling observations with in situ
stresses. The mean length of drilling core is associated ta the in situ stress and then
classified. The rockburst potential is evaluated from this class.
2-14

•Chapler 2 Lileralure Review ofRockburSl Pltenomena
Mitri (1996a) suggested the calculation of pillar skin strainburst using an index based on
strain energy which is given by:
e~S.L.=-
e,(2.17)
Where eol is the total mining-induced strain energy calculated at the boundary of the
opening (pillar skin) and ec is the critical strain energy given by equation 2.16.
2.2.2.4 Rockburst Hazard Based on 3D Stress Field Analysis
Tajdus et al. (1997) proposed several rockbursts indicators for the evaluation of rockburst
potential for Polish underground coal mines:
a). Coefficient of vertical stress concentration
C1.(x. v.:)a = -P:
(2.18)
where criX.Y.Z) is the vertical stress in the elementary volume. Pl is the initial vertical
stress in the elementary volume.
b). Coefficient of energy concentration:
(2.19)
where Vc is the strain energy of the rock mass in the elementary volume and V' is the
initial strain energy of the rock mass in the elementary volume. with:
•
Where Vo is the strain energy of volume change given by:
1- 2v ~. . . ]V =-- a- +<1- +0'- +2(a cr +<1 (j +<1 <1 )lJ 6E l ,,= 1 r \': :. r
and Vp is the strain energy of distortion given by:
(2.20)
(2.21 )
(2.22)
1-[5

CJUlprer 2 Lireralllre Review ofRockbllrst PheIJomena
• The initial elementary strain energy of the rock mass can be obtained by
V' = p~(l-V -2v~)<' 2E(I -v)
where E is the elastic modulus and v is the Poisson' s ratio.
c). Ratio of effective stress to rock strength:
w = U ub
(1 orG, r
(2.23)
(2.24)
where Go is the mean applied stress. a~ is the uniaxial compressive strength and al is the
uniaxial tensile strength.
d}. Energetic rockburst indicator:
(1.25)
where Ek is the energy accumulated in the rock mass and E:' is the energy necessary for
initiating rockburst. Based on the energy balance. Ek is given by:
E 4 =Vc + E /) - L 1.V
where Vc is the elastic energy accumulated in the broken rock mass during rockburst.
which is a SUffi of initial and induced stresses. Eo is the energy generated by the tremor in
the rock mass and Lz:-; is the work used for breaking and crushing rock mass volume
discharged to an opening. The minimum energy necessary for initiating a rockburst E:'
cao be estimated by
(2.16)
Eu 1 ~=-p Vk 1 Ir "
(2.17)
•where PIT is the average density of broken rock mass (assumed to be 2.5 tlm3
) and Va is
the average velocity of broken rock mass ejected to an opening during rockburst
(estimated at 10 mis by Filcek, 1980). Thus. E:'= 1.25x10~ 11m J• Then. the energetic
rockburst indicator is given by:
2-L6

•
•
Chapter 2 Literature Review ofRockburst Phenomena
(2.28)
If Te< 1. then the rock mass is not capable of rockbursting: if Tr ~ 1, then a rockburst is
possible (the probability of occurrence increases with the value of Tl:)' From their
experience in Polish coal mines. Tajdus et al (1997) have combined the preceding indices
to provide the following limits:
• When in a given region the following conditions are fulfilled: a.~ 1.5: ~ ~ 1.5: rock
mass is close to failure Wh ::: 1 and Te <1. then the probability of rock tremors
occurrence is very high.
• If the following conditions are fulfilled: a.~ 2: ~ ~ 3: rock mass is close to failure
W" ::; 1 and Tl: ~ 1. then there is a probability of rockburst occurrence.
2.2.3 Stiffness Method
An analogy based on stiffness difference between the rock sample and the loading system
was used to explain the rockburst mechanisrn. This analogy has been integrated in the
local mine stiffness coefficient approach for predicting stability of mine pillars (e.g..
Starfield and Fairhurst. 1968: Starfield and Wawersik. 1968: Salamon. 1970: Zipf. 1996).
Gill et al. (1993) and Simon et al. (1995) devised a methodology for evaluating rockburst
potential of highly stressed pillars. which included the use of numerical stress analysis.
intact rock properties, geomechanical classifications of rock masses and other site
investigation data. The methodology is based on the comparison of post-peak stiffness (or
unloading stiffness) of the pillar in question with that of the hast wall rock (see Figure
2.7). It includes up ta four steps: zoning, identification of vulnerable rock structures.
stability analysis and a stiffness comparison when a strain or pillar burst is expected as
shown in Figure 2.8. A similar approach has been adopted by Zipf (1996) to examine
cascading pillar failure in room-and-pillar mines using the boundary element method.
2-17

Chaprer 2 Lirerature Review ofRockbursr Phenomena
l,klt~~
Mine'" Localsli ffness stiffness
\~~~klmkpP~ ~~ ~ine
stiffnessLocalstiffness
•
Axial displacemenl Axial displaccrncnl
(a) Violcnl fallure (b) Graduai failure
Figure 2.7. Mode of failure determined by comparison between sample andtesting(after Cook. 1965)
ZONING1,1
[DE~T1FICATION OF VUL~ERABLE
ROCK STRCCTURES
•
f
GRADUALFAILURE
•
INSTABILlTY !
STIFFNESS! COMPARISON !
,.f
ROCKBURSTPOSSIBLE
• •STABILlTY 1 STABILlTY
ANALYSIS FOR TYPE! ANALYSIS FOR TYPE:1 ROCKBURST Il ROCKBURST
i --"""i'"",-----~
1 i 1
'1 ."- --....- --J~ ,- t>t4 -
1 •
1
INSTABILlTY ; lNSTABIUTY iROCKBURST 1 ~O !
POSSIBLE : ROCKB URST :
•Figure 2.8 Diagram showing che methadalogy ta evaluate the rackburst potencial
(after Gill and Aubertin. 1988)
2-18

•
•
Chapter 2 Literarure Review of Rockburst Phenomena
2.3 SEISMOLOGICAL METHOOS
2.3.1 General Overview
The seismological techniques that were developed to study global earthquakes have
obvious application to rockbursts and mining-induced seismicity. A major portion of
rockburst research was directed to establish what these techniques could bring to the
understanding of the rockburst problem. The primary objective was to use seismology to
provide an insight into the behaviour of the source of the seismic events and to provide
three-dimensional information about the conditions and properties of the rock mass
through which the seismic signais pass. The secondary objective was to contribute [0
support design and numerical modelling. Through identifying the parameters that control
the magnitude, frequency and direction of the energy generated by the events, one can
anticipate the severity of damage to excavations and so can be designed appropriate
support systems. The properties of the rock mass identified by the seismological analysis
could be used to help calibrate numencal models and provide an independent
corroboration of modelling results.
[n addition to the improvement in event location. accuracy and the ability to improve the
design of the sensor array, the application of full waveform seismic monitoring has
provided two important benefits. Firstly. it has indicated that large seismic events accur
on pre-existing structures and secondly. it ha..; allowed the classitïcation of rockbursts and
seismic events by magnitude. This allows the use of the changing distribution of small
and large events to indicate the variations in the stress regime and to track these changes
in space and time.
[n many cases, particularly close to the surface of excavations~ mining-induced seismic
events generate a dramatic loss of cohesion and shear failure on a multiplicity of planes.
50 that the failure of the rock mass is better described as a function of a volume of the
rock mass than as a failure of a single discontinuity within the rock mass (CRRP, (996).
Rockburst research has focused basically on two fields - prediction and control. The rïrst
studies on prediction focused on acoustic and microseismic emission monitoring. The
relation between microseismic emission rate and stress state was first verified in 1938 in
2-19

•
•
Chapter 2 Literalun Review ofRockburst Pheno".na
the United States (Bolstad, 1990). However, it is with the work of Obert and Duvall in
the 1940's (see Obert and Duvall, 1967) that this technique really staned.
ln a stable elastie homogeneous and isotropie domain, no acoustic or microseismic
emission should theoretically OCCUf. Daihua and Miller (1987) note that there is little
acoustie emission in an uniaxial compression test until the load reaches a certain level,
that is 75% to 8()OJO of the peak strength (50010 for Paterson, 1978), which shows that the
rock specimen hu an elastie behaviour. However, heterogeneity and anisotropy in rock
masses will ereate some local instabilities (Salamon, 1974; Jaeger and Cook, 1976).
Mine microseismieity is highly influenced by local geology and tectonies • i.e., by
heterogeneity and discontinuities, and the interaction between gravitational, tectonic and
induced stresses at a local and regional scale (Gibowicz, 1990). Il is usually assumed
(see for example Blake, 1982) that at the scale of rock masses, one finds the same
phenomenon as in laboratory tests.
Microseismic events ean he recorded by sensors strategically located in a mining regian
and conneeted ta a data acquisition system. During an event, the computer program
locates the position and the amplitude of the event by analysing arrival times at each
sensor. It is then possible to locate regions where there is strong microseismic activity.
These regions are then considered as burst-prone (Blake, 1972).
Microseismic monitoring can also be used for other purposes tban localization.
Experience showed that microseismic aetivity couId he related to the ERR and bursting
activity; an increase in ERR will usually produce an increase in microseismic aetivity
(Gay et al., 1982), and in periods preceding rockbursts, there is aften a high increase of
number of seismic events (Iaeger and Cook, 1976). For example, a 17 month experiment
in a South Afiican mine where a warning wu issued for an increased seismicity sbowed
an 800.!ct suceess in predieting rockbursts (Glazer, 1997). However, half of these
rockbursts occurred more than 4 days after the waming was issued (ooly 27% occurred
within 24 hours).
Microseismic monitoring in tbe mining industry bas been used widely in Canada and
worldwide. Canada in particular has spent a lot of efforts in that field (Calder et al.,
2·20

•
•
Chaprer 2 Lirerarure Re\!iew ofRodbursr Phenomena
1986; Daihua and Miller~ 1987; Hedley and Udd, 1987; Hasegawa et al., 1989, 1990:
Young et al., 1989, 1990; Hedley, 1991, 1992; Plouffe et al., 1993; Beghoul et al, (996).
Nevertheless, the relative high cast for the purchase, installation~ maintenance and use of
this technique makes it a tool that is not easily available for small mines like ~everal in
the province of Quebec. Moreover, it is hardly a predictive method but rather a
monitoring tool (Simon, (999).
2.3.2 Stochastic Methods
Kijko( (997) demonstrated the power of statistical tools in describing. analyzing and
predicting seismic activity induced by mining. Although the occurrence of mine tremors
is not strictly a random process. a statistical approach to the analysis of seismic events in
mines provides a reasonable basis for seismic-hazard assessment. Essentially two types of
approaches are possible:
• The first approach is the assessment of seismic hazard. understood as an estimation of
the mean probability (over space and time) of the occurrence of a seismic event with
a certain magnitude within a given lime interval.
• The second approach is a continuous evaluation of hazard as a function of lime or the
amount of extracted rock.
2.3.3 Deterministic Methods
Chavan. et al. (1993) reported their new concept and method of analysis for predicting
rockbursts based on the data obtained through mine closure measurements and seismic
network. The method involves recognition of simple regularity patterns. qualification of
closures. delineation of stopes prone to bursting and arriving at the date of occurrence of
the event. The technique has been tried a number of limes and is found to be very
successful. It is an alternative theory for the prediction of rockbursts from the mine
closure measurements with respect to the location, intensity, and day of the burst. They
found that ground movements caused due to stoping activity are not unifonn but erratic in
nature. The method permits an estimation of the intensity of the rockburst being
predicted.
1-21

•
•
Chapter 2 Literature Review ofRockburst Phenomena
Srinivasan. et al. (1997) established Iinear empirical relations relying on correlation seen
between the seismic energy released due to rockbursts. total tonnage of ore rnined out and
total nurnber of rockbursts. as well as seismic events in sorne shallow and deep workings
currently active at Kalar Gold Field. This deterministic model. although not free from
certain limitations at present. has been applied to predict rockburst activity with sorne
success. lts major limitation is the inability to describe the exact location of a predicted
irnpending seismic event.
2-22

•
•
CIL~PTER3
DESTRESS BLASTING PRACTICE IN HARD ROCK MINES
3.1 DESTRESS BLASTING PRACTICE AND PROBLEMS
Destress blasting was conceived as a rock fracturing technique to stress-relieve potential
rockburst zones in deep mines. It was first developed and widely used in the
Witwatersrand gold mines in South Africa in the 19505 (Roux et al.. 1957: Gay et al..
1982: Salamon, 1983). The concept of destress blasting evolved from the observation
that the zone of highly fractured rock immediately surrounding sorne deep underground
openings seenled to offer sorne shielding to bath the occurrence of and damage from
rockbursts. By extending and maintaining this zone of fractured rock ahead of a face. it
was argued that bath the occurrence and effects of rockbursts should be reduced (Figure
3.1 ).
The effectiveness of the concept was tested in the tïeld and involved destress blasting 32
stopes over a 19 month period at the East Rand Proprietary Mines Ltd. The results were
encouraging. Among the pararneters monitored before and after the destress blasting were
the incidence of rockbursts. severity of bursts, lime (relative to shifts), and casualties.
Improvernents ranged from 34% for the first parameter to 100% for the last (Roux et al..
1957).
Although this initial success was repeated in other parts of the world. it was noticed that
rockbursts continued to occur as mines got deeper. This was the immediate reason for
stopping these costly and massive destress blasting programs. For the South African
mining environment at least, it became obvious that maintaining a 3m thick fractured or
destressed zone ahead of an advancing face of kilometres in extent did not provide a large
enough buffer against the occurrence of and damage from large close-by rockbursts.
AIso, there was no reai advantage in extending the fracture zone by a few meters either
economically or in terms of safety.

•
•
Chapter 3 Destress Blasting Practice in Hard Rock Mines
However, successful destress blasting programs have been reported over the years
(Dickhout, 1962; and Moruzi and Pasieka. (969). The Coeur d'Alene mining district of
Idaho reported successful destress blasting program (Blake. 1972; Blake. 1971). It seems
that cooperative effort by the US Bureau of Mines and the mining companies has shown
that for certain mining geometry. sill pillars in particular. destress blasting could be
effective in improving rockburst control.
Beforedestressi ng
Afterdestressing
Preminingstresses
Distanl.:e fromface
Fractured destressingzone
Figure 3.1 Stress profile ahead of a destressed face
Although destress blasting is one of the best techniques of controlling rockbursts. (Blake.
1982: Roux et aL. 1957: William and Cuvellier. 1988: Oliver et al.. 1987 etc). it has
received rnixed success in its application mainly because of the following factors:
1. There is a wealth of information about the topie world-wide: however. this
information is scattered and is not easily available to the mine site engineer in a
coherent forma
3-2

•
•
Chapter 3 Destress Blasting Practice in Hard Rock Mines
2. While the principle of destress blasting is weil understood, its successful
application is hampered by the lack of a dedicated design tool that is readily
capable of simulating the mine conditions before and after destress blasting.
3. In the absence of a better understanding, destress blasting can be unnecessarily
costly due to excessive number of drill holes, too much explosives and tao many
interruptions to the mining cycle.
In addition to reducing the stress in a particular mine structure. successful destress
blasting should also result in modifying the material properties of the structure so that its
mode of failure is changed. Since rockbursting is almost exclusively associated with
brittle rocks. that behave elastically and show a potential for violent failure when their
strength is exceeded. it is obvious that by destress blasting of such a rock mass. one is
attempting to change its failure mode From brittle elastic to ductile plastic. Thus destress
blasting should not only result in the reduction of stress in the zone but should also
promote yield type of failure.
Destress blasting in mine development has been applied in zones of high stress and brittle
rock. The driving of development headings - drifts. raises and shafts is often
accompanied by popping. rock spalling and occasionally face ejection rockbursts. This is
often caused by high stress concentrations ahead of the face. The problem is usually
alleviated by drilling and blasting long hales ahead of the face and in the pillars between
multiple headings. Many variations of the procedure exist as will be seen in the review of
case histories to follow.
Destress blasting of crownlsill pillars has been tried in several mining areas of the world
but has been most successful in the Coeur d'Alene district of Idaho (Karwoski et al..
1979) where the narrow steeply dipping Ag-Pb-Zn veins are mined by an overhand
horizontal cut-and-fill method which results in the creation of rockburst prone pillars.
Pillar stresses do not usually approach critical 1evels until pillar heights have been
reduced to about 15 m. at which lime, destress blasting is carried out if it is felt that
further mining would result in rockbursts. The destressing procedure for stope faces and
rib pillars during silling operations was described by Oliver (Oliver et al .. 1987). Sorne
uncertainties and constraints about pillar destress blasting are:
3-3

•
•
Chapter .3 Dest1'ess Blasting Practice in HardRockMines
• The use ofhand held drilling equipment Iimits the size and length ofdestress holes.
• The usual praetice of waiting for the pillar to be as small as possible before destress
blasting can result in increased exposure time to possible on-shîft bursting.
• Any misfires occurring during destress blasting could prove hazardous during
subsequent mining. The time and eare necessary ta ensure that there are no misfires
or ta take eare of any, constitute expense and delay which can be costly.
• Timing is critical. Oestress blasting carried out too early May allow stresses to rebuild
to the extent of causing on-shift bursting; carried out too late, it may result in
increased exposure time to possible on-shift bursting.
• Destress blasting procedures cause production delays, which have to be balanced
against the cost ofsafety ofthe mining operation.
• Il is difficult to assess the quantity of explosives required for adequate destress
blasting.
In the study condueted by Ineris-École Des Mines, Nancy, France, (Al-Heib et al., 1994,
Bigarre, 1996), a review of the various destressing methods, and useful monitoring
methods presently available was made. It is pointed out that fracture patterns around fully
confined blastholes are dependent on the orientation of the major principal stress (Rorke
& Brummer, 1990). A useful part of this report is the appendix eontaining non-critical
resumés of signifieant reports of destress blasting. In a complementary report a
mechanical method used in a French coat mine is described and results analysed.
Simon et al. (1998) presented the main results of numerical and experimental
investigation on the etTeet of destress blasting on the rockburst potential of an horizontal
pillar below a stope (sill pillar) at Sigma Mine, Val d'Or, Quebec.
3.2 MINlNG SITUATIONS WHICH CALL FOR DESTRESS BLASTING
In general, destress blasting can be regarded as a tactic measure of strainburst control in
ail mining situations, which lead to the creation of high stresses in stift: briule rock at the
boundary of mine openings. With this notion in mind, several mining situations cao
3-4

•Chapte,. .3 Dennss Blasting p,.actice in HardRockMines
benefit from destress blasting as a means for the control or even elimination of rockburst
hazard. Sorne ofthose situations are illustrated in Figure 3.2.
1
Ovahand eut-and-tiU miniq
Shaft sinkins
Hipty lIraIcdzone
Unden:ut-and-fill minins
Plan view of. wieleLonpall minin& eut"»OO..
Figure 3.2 Sorne mining situations, which may benefit trom destress blasting• 3-5

•
•
Chaprer 3 Desrress Blasring Pracrice in Hard Rock Mines
Drifting at depth- Ramps, drifts and cross cuts developed at depth in hard rock mines may
be prone to face bursts, f100r bursts or a combination thereof. The presence of high
mining-induced stresses in a brittle rock mass makes it more likely for rockburst to occur.
Detsress blasting can result in shifting the high stresses away from the face and drift
corners.
Shaft sinkin~ at depth-Floor burst. wall spalling and spitting are among the commonly
observed strainbursts in deep shaft sinking in hard rock. The integration of floor
destressing in the mining cycle can have beneficial effects on the reduction of on-shift
seismic events. and the conditions of the walls and noor.
(rown pillar destressing- In conventional eut and tïll. upward mining of small lifts of 2-3
m eventually leads to the development of high stresses in the crown pillac particularly. at
the skin. i.e. immediately above the working area.
Sill pillar destressing- Several mining methods rely on sill pillars to keep the integrity of
the mine structure. Examples of sill pillars are found in cut-and-fill stopes. shrinkage
stopes and sublevel stoping. In the latter. regional sill pillars are found between the main
levels.
Undercut and tïll mining- In this method. mining progresses downwards. v.hile the stope
back is backfilled and supported by a timber frame. As the ore vein becomes thinner
under the stope. high stresses develop in the tloor. and the situation becomes prone to
floor bumps.
Longwall mining- Mining of large. relatively fiat tabular ore deposits. by longwall
methods inevitably leads to high mining-induced stresses at the working face. The
method relies on external supports such as cribs and packs to help control the roof to
floor convergence. Nevertheless. high stresses still occur at the face. The severity of face
rockburst will depend primarily on the depth and overburden pressure. but other factors
like length of unsupported span. rock type, and the strength of the support will aIso play
an in important role.
3-6

•
•
CJzaprer 3 Destress Blasring Practice in Hard Rock Mines
3.3 LITERATURE REVIEW ON REPORTE0 DESTRESS BLASTING CASE
STUDIES
A comprehensive survey of destress blasting trials to control hazards associated with
rockbursts was conducted. This covers papers on rockbursts and destress blasting practice
in hard rock mines. Most of the literature deals with metal mines in Northem Ontario,
South African gold mines. the Kolar Gold Fields in India. and the Coeur d'Alene mining
district in Idaho. United States.
Table 3.1 reports the list of mines which practiced destress blasting. The collected
information include a wide range of information l'rom the name and location of the
mines, to the specific details of destress blasting. As can be seen from the Table 3.2.
considerable amount of blasting related data is not reported. such as the type and quantity
of explosive. A more detailed review of selected case studies is described in the
following section.
3-7

•Table 3.1 S f id hl
('IUlpll'" 3 J)".\""l'.U III(I.Hjll.L: l'mt'lin- jll liard Rock Milu'J
d'
•" ...
Company Mine Location Minerais Ore type Dimensions Host rockrecovcred
Goldcorp CRLM Balmcrtown, ON Gold, AU QUilrtz sulphide Vilriable Andesiteveins
Kinross Gold Macassil Kirkland Lake, ON Gold, AU Si liccous Syenite
Falconbridge Strathcoml Onaping, ON Coppcr-Nickcl- Massive Sulphide 1600x 1600x GneissLtd cobalt Yeins 2000
Falconbridge Fillconhridgc Sudbury, ON Zinc-coppcr-Ltd silvcr
Hcela Lucky FridilY Idaho, USA Lcad-silvcr Lcad-silver
Heela Star Burke, Idaho Lcad-zinc-silvcr Sulphaleritc and Rcvcttegaleml quartzite
CMC and GalclHl Wal blC, Idaho Mineralized QuartziteASARCO quartzite
Inco Crcighton Copper Cliff, ON Nickcl-coppcr- Massive Sulphidecohalt
LKAB Maltnhcrgct Swedcn Iron Reddish GreyLeplite
Boliden Laisvall Swedcn Lcal1 Lead ore
SUllltOlllO Bcsshi Niihalna, Japlan Coppel' Cupriferous 1300nlx2.5mCorp. Pyritc
3·8

•(,Iwp,c'" 3 /k.\'I,.C'.\".\"lIll1.Hi"g /'1"(1.-1;('(' ;" liard Rock Millc'.\"
•Continued for Table 3.1
McWattcrs Siglna Quartz- Dioritetouflnal ine
Beijing Mentougou Beijing. China Coal
Fushun Longfeng Fushun, Chilm Coa)
Kailuan Tangshan Tangshan. China Coal
Deyang Tianchi Deyang. China Coal
Bolidcn Pyhasalmi Finland Iron
Lake Shore USA Gold
Kerr Addison Kirkland Lake, ON
ERPM ERPM South Africa Gold
VRRE Vaal Rcefs S. Africa Gold
WDL South Mine S. Africa Gold
KGM Libanon S. Africa Gold
DeL WOOM S. Africa Gold
DRD Blyvooruilzich S. Africa Gold
3-9

• •l'IUlI''''I' 3 /)t'.\' ("".\".\' Illa.will}.: PmclÎC(' i" /lard Rock Mim'.\'
d'blddfTable 3.2 Dclailcd inf . ..Dcstress Blasting (DB)
MiningM. Classi fication Layout ExplosivesMine
Level Depth Date N.H H.D H.L S TypePRE ZoneP.P E.M
(m) (mm) (m) (m)(kg/m (Kg)3)
CRLM C&F C. PillaI" II02E'B' 450 45 I.K ANFD 0.2
CRLM S.1l (Km) ('hules 1421W 45 ANFD n.09
CRLM Drift 1470 45 2.5 0.3- AMEX1.2
CRLM C&F C. PillaI" 1t)()2- KIO 44 6 I.K ANFO n.2IK02
CRLM 10 m stopes Vein 1604 45 1.4 n.7
CRLM O.H. C&F RD Sill Pillar IKfH) I3(H) It)KO 2K 44 6 I.K ANFD 0.2& U.H.C&F
Macassa O.H. C&F Footwull IKon 14CH)- 14 63.5 16. ANFD U.142150 K
Macassa O.H. C&F Ex Slwh 3 1524 6 5n.M 27. Primancx43
Mm:assa O.H. C&F Ex Shah J 1524 4 35 .t6 Powcrmex6 5OCH)
Macassa O.H. C&F Ex C. PillaI' 1524 1962 2 p). 7.6 AMEX Il5+3 22.3
3-10

•CJWI"t'" 3 /)t·sln· ...... Hlll.\'Ii,,~ PlC/cIÎn' in Il,,,-d Hock !t1Î1/t·.'i
Continued for Table 3.2
•Slmlhenna C&F ACl:~SS 25-32-C9 2:n5· 66 76.'2. 5.5 2.1 M.F 30(K) 0.115
Ramp 25-]4- 25()() 3 -DO O.13K
Falconhridg C&F EX I-J.W JH50 1174 1963 3 9.K-19.6~ (r<lisc)
Fulcnnhridg C&F EX H.W JH50 1174 IlJtlJ '2. 50.X 16. ANFOe (mis~) X
Gulenu C&F EX F.W J70() 112X )970 -IX 6 1.5 ANFD
Gulena C&F Ru 4.l()()- 1;00 IlJlJO Il 4· 1.5 ANFD 12546()O 10
Lucky U.H.C&P EX C. Pillar 4lJ(K) 162() 5X 24 J Apex l40 0.6 6.4FridilY
Slur O.H.C&F EX # 7,10 77()O 2J50 102 JO 2.J
Slar O.H.C&F EX # H, lJ, 12 7l)(K) 24(K) 102 30 2.3 Tnvex S(M)
Slilf O.H. C&F EX Gmuse 7700 2050 2lJ-57 S·K 2·J ANFO
Term Tek U.H. C&F 19 57 1n. J7
Creigillun MC&F RO ('mss- 54(K) 1645 1960 1 67 14 -MC&F CUl
,s
Creigilion MC&F RU Cmss- 60()()- 1K2()- 4 32-41 J- ANFOCUI 7(}(}() 21JO 5.5
Creighlun VRM RO Drift 2010 4 ANFO
Creighlun VRM RU Drift 21JO 6 32-41 3.6 ANFO
Crcighlon Sill Drifling RO Drift 2()7J 2 ·n J.tl- ANFO6
J-II

•CIUI/'f,',. 3 J)".w·".,ü ll/tl.\li".~ l'ractin' in lIa,.d Rock Mi",'.\'
Conlinucd for Table 3.2
•Crcigtuon Sill Drifling RD Drih 2073 -1 -13-54 .l.6- ANFD
7.J
Crcighlnn VRM RD Drift 21]-1 h ·U 3.6- ANFD7.3
Crcighlnn VRM RO Drift 21lJ5 JO 43 ANFO
Crcscnt RD Sill .md 31OC) 10. 3.1- DynamilcC. Pillar 7 1.5
Crescnt RO Sill und :nou 10. J.I-C. Pillllr 7 1.5
Crcscnt RU Sill .nul 3500 1n. 3.1-e. Pillar 7 1.5
Malmhcrgct D..ihing EX Drift KI5 1 6-7 BOImgcl 1
Luisvall
Pyhiisalmi C&F EX Pilh,r 645-660 Kt) 10 .H TNT 1460
Pyhiisulmi C&F EX Pillar 615-6JO 60l 10 .5 TNT 1460
G RD RmulwllY 12(K) 42-50 3M
G RD Roadway 7 32-35 2.5- 103 m
Bcsshi Footwall 2H IlJ6t) 64 10 3 12K
Sigmu l'&F EX Sill Pilla.. J400 15(K) I~N6 15 3K.1 K.5 1.2 ANFD n.1510.2
Lungfcng Longwall F;ll.:C 4-6 3-5
Lake Shorc C&F EX Raisc J950 1204 1961 2 JH.I 16. 2.4H
--
3-12

•l'/UlI'I"" 3 /)('.\'Irt'.\'.\' HItI.\'I;"~ l'mcli('(' i" /lord Rock Mi"t'.\'
Continued for Table 3.2
•Kerr .'\ 1.5 ANFO
Addison
ERPM Longwull EX I)riftFm.:c
Vau,1 Rccfs Longwull EX Fuuh 075 12 60 12
Vaal Rccfs Longwall EX Faull 2500 ] 60
WDL Longwull RO WDLS ]M-42 2- ANFDX7-49W 2.2
5
Lihanon Longwall RO Pillar 25-55W ANFO
WDOM Longwall RU Siope J2-12W 76 ],5- M ANFO5
DOM Longwull RO Slupe IK-I]W 70 .'\() ANFO
DOM Longwall RD Pilh'r ]()·24W 76 10 ANFO
DOM Longwull RD Slope 17-24W 1t)(K) X9 IX ANFO
BOM Brensl M. RO hu.:e 17-24W 19(X) 09N 17. ANf0 150:2 ()
DOM Brensl M. RO Fm:c 17-24W 19lX) ION 17. EMUL 1252 0
BGM Brensl M. RO Filce 17-24W IlJ(K) liN 22. ANFO 150:2 0
llOM Brc&lsl M. RU Filce 17-24W 19lX) 1119 14. ANFU 752 ()
DOM Brensl M. RO h,cc 17-24W IlJlK) 1219 22. ANFO ISO:2 0
3-13

•ClllIplt·,. 3 /J".Hrt'.\".\" /lltHIÙIK "rac'lice ill liard Rock Mill,'.\"
Continued for Table 3.2
•BOM Brcust M. RD Faœ 17-24W IlJOO 0119 15. ANFO 75
.1 0
DUM Breast M. RD Face 17-24W 19(H) 0119 IH. ANFü IIK1 0
nGM nrcast M. RO Face 17-24W 19lH) oIll) 10. ANFO 503 0
DriM Brcast M. RD Face 17-24W 19(H) 0219 15. ANFO 753 0
BOM Breast M. RD I;ace 17-24W IlJOO 031lJ 15. ANFO 953 0
BGM Longwall RD Face 17-24W Il)OO (J.~/l) 1n. ANFO 751 0
BGM Breast M. RD Face 11-24W 19(H) 0319 17. EMUt. KI3 ()
DGM Dreast M. RD Face 17-24W 1l)(H) 0419 15. ANFû KI3 n
DGM Brcast M. RD Face 17-24W 19lH) 0519 14. EMUt. 933 ()
DOM Breast M. RD Filce 17·24W 19fH) 0619 16. ANFO IO()3 0
BGM Breusi M. RD Fm:c 17-24W 19fH) n619 14. ANFO HM)3 .5
DGM Brcasl M. RO Face 17-24W 19lH) n719 10. ANFO 433 0
HOM BrCilst M. RD Face 17-24W IlJlH) OXI9 11. ANFO 1003 5
-
3-14

•C/lapln 3 J),'sln',\'s Ill(uli,,~ J1mcIÎn' i" liard Rock Mimis
Continued for Table 3.2
•DOM
DGM
DGM
Company
Brcast M,
Breast M.
Breast M.
RO
RD
RO
Faœ
Face
Face
17-24W 190() 09/9 IH. , , ANFO ,1 125
] 0
17-24W 1900 1119 13. EMUL 100] 5
17-24W 1 Il)OO 1 12N Ill. ANFO UN)] 5
MininJ! Melhods
KGM=Kloof Gold Mining Co. Limited
CMC=Coeur d'Alcne Mines Corporation
ERPM=East Rmul Propriet~lfY Mines Ltd
VRRE=Vaal Recfs Reefs Exp!. & Mining Limitcd
DCL=Dricfontein Consolidaled Lilllited
DRD=Durban Roodepoort I)eep Linlitcd
Mine
BGM=Blyvooruilzichl Gold Mine
CRLM=Campbeli Red Lake Mine
ERPM=East Rand Proprict&lry Mines
LGM=Lihanon Gold Mine
WDGM=West Dricfontcin Gold Minc
U.H. C&F=Undcrhand Cut-and-fiU
O.H. C&F=Ovcrhand Cut-and-fill
S.B= Shrinkage boxholes
DB Classification
Zone
H.W=I-Ianging wall; F.W=Footwall; S.&C. P.=Siii and Crown Pillar
FRE=Frequency
EX=Experinlcnlill; RO=Routinc
Zone
C. Pillar=Crown Pillar
Explosives
]·15

•(""'PI('/" 3 IkMrt'.'il IIIt1llit,): l'radia in /lard Rock Mint','i
Continued for Tahle 3.2
•
WDLS=Western Deep Levels South Mine
WDL=Westcrn Deep Levels
M. F=Magnafrac
S = Hole spacing; P.F. = Powder factor; N.H =Numbcr of holes;
H.D = Hole diamcter; H.L = Hole length
J·16

•Chaprer 3 Desrress Blasring Pracrice in Hard Rock Mines
3.4 SELECTED CASE HISTORIES
3.4.1 Star-Moming Mine, Becla Mining Co., Burke, Idaho (Karwoski et al., 1979 ),(Figures 3.3, Figure 3.4 )
ln this case. the destress blasting trial was done in and near a sub-verticat, narrow, ore
vein, rnined using a timbered. overhand, eut and fill mining method. The test zone was
divided into two adjacent test panels totalling 79.24 meters long and 24.38 meters high
(12.19 m above and below the access level). In one panel (half the total area i.e. 39.62 m
mm 510,114 10""
.. 1t0'M\l1l StftIOt'MIIl
- --OC-:::.:=..-.:...--_-_10
Vii" ".c3~di"o,."
~ 100l ,
CO"'pl'led llefOftprtcendiliQIIln,
•
Figure 3.3 Locations of Destress Blasting, Levet 7700. Star-Moming Mine.
Hecla Mining Co. Cafter Karwoski et al.. 1979)
x 24.38 m) the destress blasting was done outside the ore vein. while in the other panel
the destress blasting was carried out in the ore vein. Seismic tests showed that the wall
rock had a higher P-wave velocity (han the ore. In general it was found that the best
results occurred where the destress blasting was done in the ore vein. This was
determined by monitoring the seismic activity during mining of the vein.
Destress blastholes of 102 mm and 92 mm diameter were drilled in a fan pattern covering
the panel area around access crosscuts either in rnid plane of the ore or paratlel to the
3-17

•
•
Chapter 3 Destress Blasting Practice in Hard Rock Mines
vein. Explosives used were TROJAN slurry (1400 kg/m3) and pourable gel (1470 kg/m3
),
and ANf0 (770 kg/m). Ignition of the blastholes was at 1DOms intervals and 42.69-gr.lm
detonating cord was used as a tracer in the blastholes. This tracer cord was detrimental as
it ejected the stemming. The in vein panel consumed about 2141.52 kg of explosive
(2.199 kg/m2) while the out of vein consumed about 1916.8 kg (1.1955 kg/m:!). Drilling
and blasting the destress holes was carried out over a six month period in the latter half of
1976.
o 10 ::'0
L..-..L......JS~.at~. Il
Figure 3.4 Destress blasting drillholes and loading patterns for the 7700 level.Star-Morning (after Karwoski et al.. (979)
Mining the destressed vein. l'rom the 3rd tloor for the out of vein panel and from the 1sI
tloor for the in vein panel out a total of 10 floors. was carried out to September~ 1977.
Mining the in vein panel disclosed that the destress blastholes had increased in diameter
to 203 mm (a 51 mm wide halo representing rock completely powdered and removed by
the blast) with a 152 mm wide halo of crushed rock about the enlarged hale. No radial
cracking around the blastholes was observed in the ore but it showed signs of being
fractured and fissured by the blasting possibly by extension of existing defects.
3-18

•
•
Chapter 3 Destress Blasting Practice in Hard Rock Milles
3.4.2 Macassa Mine, (Hanson et al., 1987), (Figure 3.5)
This trial concems a stope crown pillar, in a steeply dipping ore vein. where a line of
destress blastholes are drilled on the mid-plane of the pillar. This was done after about
5725 L.".'
1:J. AoclLburat
Figure 3.5 Layout of destress holes in the 58-40 crown pillar at the Macassa Mine
(after Hanson et al.. 1987)
600/0 of the stope being mined by the cut-and-fill method. Stress measurement indicated
that the vertical stress was equal to the overburden pressure more or less. i.e. 0.026
MPaim. The maximum and minimum horizontal stresses were 1.62 and 1.14 times the
vertical stress respectively. Stress on the pillar was so high that sorne blastholes could not
be loaded with explosives. The blastholes were fired on separate delays with about 45
kg/deI. Seismic event location and convergence. before and after the destress blast. were
used to monitor the results. Simulation of the process was done using linear and non
linear NFOLD numerical simulations.
Pillar failure was noted to progress from the edges towards the centre. Post blast seismic
activity was located mainly in the destressed (presumably failed) part of the pillar. which
is inconsistent with CUITent thought on the operating mechanism. Only part (SO%±) of the
pillar was destressed. When the numerical model is weil calibrated by the failure
3-19

•Chapte, 3 Destress BIDSttng hactice in HardRock Mines
observations and convergence measurements it correctly predicted the results. This
requires material properties such u a 60 degree angle of internai friction and a cohesion
of 50 MPa. The numerical model predicts load transfer to adjacent bacldilled stopes
which is not confirmed by the convergence measurements.
3.4.3 South Arrie., (Lilhtfoot et al. 1996; Toper et al., 1998), (Figure 3.6)
These repons concem destress bluting in the sub-horizontal, deep, gold reef ores in
South Afiica. The trials reported on, which are presently being incorporated ioto the
operational procedures, were done on border pillars surrounding a reef being mined,
probably already preconditioned by mining induced stresses. Two types of drilling
geometry were evaluated:
1. Oestress blasthole drilled paraileI to the advancing face, and
2. Oestress blastholes drilled perpendicular to the advancing face.
Proper tamping of the destress blastholes wu found to be very important and somewhat
difficult to obtain in the short, face-perpendicular, sub-horizontal holes. Monitoring of
results included convergence and horizontal displacements, seismic event location,
tomographyand ground penetrating radar. Numerical modelling was used to analyse the
collected data.
Figure 3.6a Face-parallel destress blasting at Blyvooruitzicht Gold Mine, SouthAfiica (after Lightfoot et al. 1996; Toper et al., 1998)
•13m
Minedout
• 3-20

•Chaprer 3 Desrress Blastitlg Pracrice in Hard Rock Mines
No new fracture planes were observed after destress blasts. Displacement on existing
geologic planes showed-up as crushing or gouge of varying thickness. The destressing
mechanisms proposed are: shake-up of existing stressed planes causing slip by shearing
of locked-up protuberances. and gas penetration of existing stressed planes reducing the
effective stress and thus the shear resistance. Seismic events after destressing migrated
away from the destressed area which is consistent with the currently held. basic,
destressing mechanism. lt was found that destressing should not be carried out tao far
ahead of the mining face as the load may revert ta the destressed rock in the face with
undesirable results. It was also found that tao long a delay in resuming mining after
destressing allowed the stresses to build up again in the destressed rock. i.e. evidence of
consolidation of fissured but otherwise strong rock.
Mined out
~Iining
Direction DSBHolCsNell DSB Straggcn:d lm afr.:r
Hole~ 1 each advance (4Omm.)
\ __r1J O l __. lm
t"":.~~t~:-:::~~~"~~.:'~~3~'~~,';~~:'3~~;~=::::~~~~~'''.~~~~·~·-~.~~::~:::·~:~~;;,;~".~:·:''''~.:~':':'.";~~:-.':':,~~.~~~::~~:'~.~.~.,.~...~....~...~~~..~."_!"""•.. -...•.. Advance
f:~ Face
J~~-'>:
•
Figure 3.6b Face-perpendicular destress blasting at Blyvooruitzicht Gold Mine.South Africa (after Lightfoot et al. 1996; Toper et al., 1998)
Ground penetrating radar showed that the damage zone around destress blastholes
extended for a radius of 1.5 meters. This helped in optimising the blasthole layout. No
description of the damage zone around destress blastholes was given. Modelling used
step functions of 500 and 1000 MPa explosion gus pressures injected into the fractures. A
rating system was devised relating immediately recorded seismic energy to quantity of
explosives used, number of post blast seismic events. largest magnitude of post blast
3-21

•
•
Chapter 3 Destress Blasting Pracriee in Hard Rock Mines
events, spatial migration of seismic events and convergence. This rating system also takes
into account whether production blasts occur on the same day in another panel.
3.4.4 The use of destressing al Inco's Creighton mine, (O'Donnell, 1992), (Figures
3.7, Figure 3.8)
This section describes the problems, the methods and the results achieved while
preparing to mine the 400 orebody, a massive sulphide deposit dipping at 65 degrees.
with a strike length of 183 meters and a thickness of 122 meters. Three mining methods
were envisaged for this orebody: sub-vertical blasthole mining on the hangingwall side.
cut-and-fill in the centre and undercut-and-fill on the footwall. The stopes were originally
aligned along the strike for the blasthole mining and changed to across the strike for the
cut-and-fill mining. The VRM method was introduced to negate the undesirable effects of
cut-and-fill mining in burst prone ground.
c~o Il m Level
\IC .t F
t-----'-,..,~~,..,,~...o--,-__• ..._....:--~ ~~_07_} m...::;.Lc: \' d_L_, _"'.'
Figure 3.7a: Section 4400. indicating the proposed mining methods al
Inco's Creighton (after Q'Donnell, 1992)
3-22

•
•
Chapter 3 Destress B/asting Practice in Hard Rock Mines
The section describes three cases where destress blasting was applied during excavation
of the sill drifts in preparation for mining the ore blocks. Sill drifts were 4.3m wide and
3.7 meters high with variable spacing as Iow as 3 meters. The first case described is on
the 2073 Ievei (2073 meters below surface), the second on the 2134 levei and the third on
the 2195 level, where the VRM mining was introduced increasing the height of the sill
drifts to 4.6 meters. Far field stresses were: 100 MPa in the E-W direction. 79 MPa in the
N-S direction, with a vertical stress of 62 MPa. The unia"<ial compressive strength of the
footwall rock varied from 175 to 250 MPa while that of the hangingwall rock was
approximately 160 MPa, no value was given for the ore. Primary support was supplied by
1.8 m x 15 mm mechanical bolts and nurober 4 gauge. 10 cm x 10 cm welded wire mesh
to mid-wall. Destress blastholes were generally 43 mm diameter. Long destress
blastholes were started at 54mm diameter and completed at 43mm. ANf0 was used as
the explosive at the bottom of the destress blastholes in lengths of 0.9 and 1.5 meters and
were always fired on the first delay of the round. Figure 10 shows the layout of the drifts
which are relatively close together giving extraction rates of 67 to 75% in the si II.
i
,>G:~-----~. i
>;éf=' == => 1
,<---..... -------------~, '-
Figure 3.7b: Sill-cut MC&F units on 2073m level at Inco'sCreighton Mine (O'Donnell. 1992)
3-23
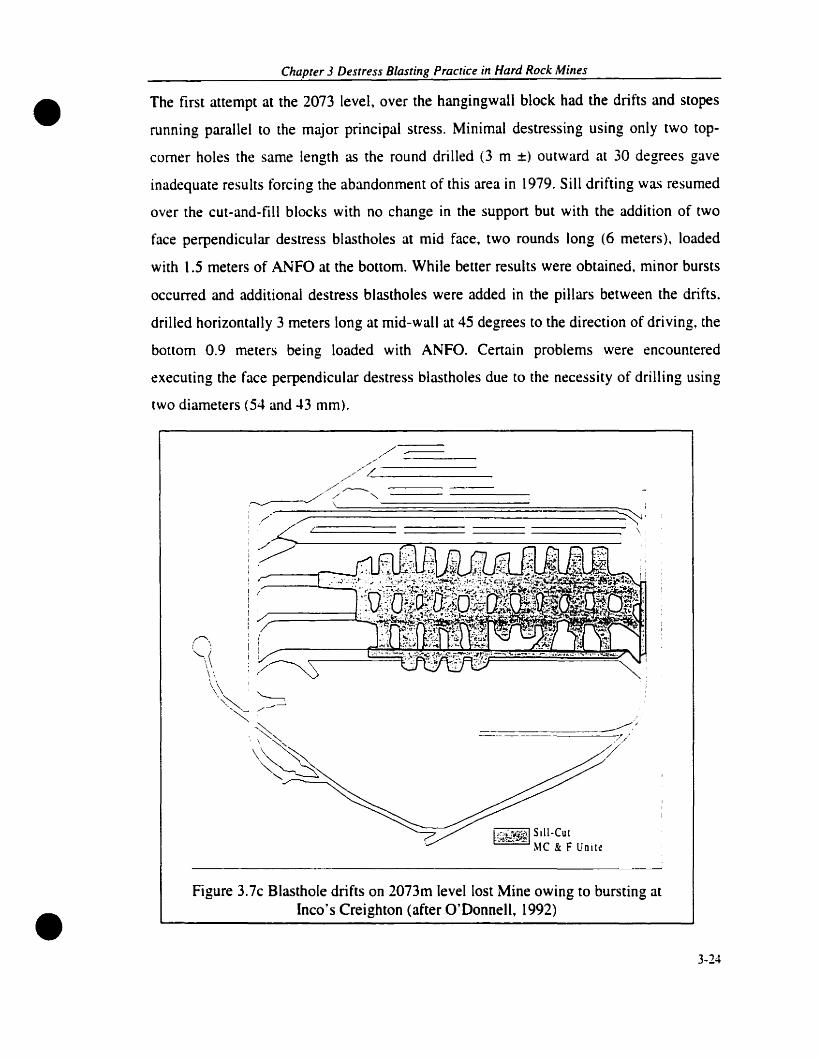
•
•
Chapter 3 Destress Blasting Practice in Hard Rock Mines
The first atternpt at the 2073 level, over the hangingwall block had the drifts and stopes
running parallel to the major principal stress. Minimal destressing using only two top
corner holes the same length as the round drilled (3 m ±) outward al 30 degrees gave
inadequate results forcing the abandonment of this area in 1979. Sill drifting was resumed
over the cut-and-fill blocks with no change in the support but with the addition of two
face perpendicular destress blastholes at rnid face. two rounds long (6 meters), loaded
with 1.5 meters of ANFO at the bottom. While better results were obtained, minor bursts
occurred and additional destress blastholes were added in the pillars between the drifts.
drilled horizontally 3 rneters long at mid-wall at 45 degrees to the direction of dri vingt the
bottom 0.9 meters being loaded with ANFO. Certain problems were encountered
executing the face perpendicular destress blastholes due to the necessity of drilling using
two diameters (54 and 43 mm).
.../.,-//
///-----~
./
./ -----,~ ( '",/ /' ~:
L:.(========= ======= --- ==========-: \
Figure 3.7c Blasthole drifts on 2073m level lost Mine owing to bursting at{nco's Creighton (after Q'Donnell, 1992)
3-24

•
•
Chapter 3 Destress Blasting PrClctice in Hard Rock Mines
Bursting continued, 14 bursts releasing 210 tons of failed ore and causing delays.
subsequent to further production development in the drifts (mining footwall slots and
tram drifts) so the support was increased. The mesh was carried to the floor and the
mechanical bolts were replaced with 1.7-meter split sets and 1.8-meter resin grouted
rebars. This combination of increased destressing. pillars considered not destressed
enough being reblasted. and increased support finally gave very good results with most of
the bursts occurring with the blasts.
Plan SIII Cut
Figure 3.8a Destress patterns of ~1C&F units on 1073 m level (after O'DonnelI.(992)
The same procedure was adopted for the 2134 lever sill drifting. In addition. the mining
of the stope drifts would proceed en echelon and the additional development and pillar
isolation would be done at the end of the week to allow a weekend for stress readjustment
and bursting. During 2134 lever sill mining only one of eleven bursts releasing 114 tons
of failed ore. occured during working hours. Cut-and fill stope mining was carried out to
crown pillar failure and VRM mining used to mine the crowns. The 2195 level sill
mining followed the 2134 level procedures with adjacent drift faces en echelon being
carried three rounds (3 x 3.6 meters) apart. Four additional destress blastholes for a total
of 10 per round were used. [WO for the bottom face corners and two in the pillars due to
the increased pillar height. ANFO [oading in the corner and pillar holes was reduced From
0.9 to 0.6 meters. Support was also increased in two stages using mechanical bolts
3-25

•Chapler 3 Deslress BJasling Practice in Hard Rock Mines
(backs) and split sets (ribs) in the first stage (1.2 x 0.6 meter pattern) and, when
convergence had stabilized, stiffer resin grouted rebar on a 1.2 meter square pattern in the
backs. Large back spans and high ribs were cable bolted.
c
c
r-.----F
c c
w W ewW Side View
W ew
C
WF~ F1.:w~ \lilll
C~CMn:r
Figure 3.8b Drift destressing patterns, 1195m level. Creighton mine (afterO'Donneil. 1992)
VR.~ mining, to June 1991. was used exclusively for the 2134 - 2195 stopes with the
center stope being first and the only one having a crown pillar. These latest procedures
resulted in no lost time due to bursts and 85% occurring with the blast. Breakthrough
destressing, when drift faces from opposite ends of a drift are four rounds (14.6-meters ±)
apart. was used. This involves drilling 7.3-meter face perpendicular blastholes in each
drift face and blasting the bottom 3.7-meters in each.
• 3-26

•
•
Chapte, 3 fJesl1'ess B/lISting Practice in HardRock Mines
Figure 3.8c Development beading destressing atInco (after Dickout, (963)
Unloaded
DrillingLimitsfor next round
Longitudinal View
Figure 3.8d Development heading destressing at Inco (after Oliver et al., 1987)
3.4.5 Datress blastin.at Campbell Red lake mine, (Makuch et al., 1987), (Filure
3.9)
This report is mainly conc:emed with the mathematical analysis of a destress blast similar
to the previous trial. Monitoring methods are similar with the addition of blast vibration
monitoring. Ail destress blastholes were fired on the same delay using a powder factor of
0.7 kglm3 as opPOsed to the 'normal' production powder factor of 2.1 kglm3. Blastholes
were 4Smm diameter on 1.4 meter centres with I.S meters of stemming. Analysis
neglects the gas energy of the explosive and uses a constant power law to establish stress
wave energy attenuatioR. It was proposed that destress blasting is most effective when the
pillar is close to failure or in other wards preconditioned.
3·27

•
•
C/tapte, 3 fJestnss Blasting P,acnce in Hard Rode Mines
Figure 3.9 Layout ofdistress holes in the 1902 and 1802 crown and sill pillars atthe Campbell Mine (after Makuch et al., 1987)
3.4.6 Destress blastinl experimenu at the Pybisalmi mine Finland, (Hakami et al.,
1990)
This report describes three tests of destress blasting done on the center plane of stope
pillars some 10 m truck by 5 m wide, between levels 645 and 660 for the first two tests
and levels 615 and 630 for the third test. The first two tests used 89 mm diameter
blastholes about 10 meters long while the third used 64 mm blastholes about Il m long.
The blastholes broke through from level to level. The explosive used was a cap sensitive
TNT sentisized slurry of 1460 kglm3 and 7200 mis velocity. In the tirst two tests it was
poured into the blastholes while the third test used eartridges of a similar explosive. Blast
hole spacing for the first test wu 0.8 m and 0.5 m for subsequent tests.
Instrumentation used included rock boit load cells, vibrating wire strain cells,
extensometers, an endoscope and a seismograph for the third test. Diamond drilling was
used ta sample the rock adjacent to the tests before and after the blasting. RQD values
were calculated for these test hales. Inspection hales were included along with the
blastholes and in the same plane.
Results of these tests were considered inconclusive but promising. While there were
Many instruments installed, little data from these are given in the report. The reader is
referred ta other internai reports by one of the authors. Modulus and strength data, which
3..28

•
•
Chapter 3 Desrress Blasting Pracrice ill Hard Rock Milles
show significant destressing effect~ is given for the first test taken from the diamond drill
core but not fit the other tests. Serious damage was done to the drift floors and backs
(cratering) because no stemming was used in most of the blastholes. The endoscope
inspection results are given in detail but it seerns this was not done before-and-after.
While it seems that cracking extended between the blastholes (not confinned)~ cracking
was also noted perpendicular to the plane of the blastholes. This confinns the beliefs of
this author as weIl as those expressed by INERIS in France. Inspection holes in the test
plane showed damage and breakouts after the blasts. [n the second test. which was more
extensive as ail holes were not fired at once. the holes were blocked and required
redrilling after the tïrst blase It was felt that the test zone was not as highly stressed as
other area of the mine due to the fact that breakouts did not occur in the test blastholes as
is common in other areas. This may have had a signitïcant effect on the possibility of
getting reliable results from the instrumentation. RQD values generally but not always
showed deterioration after blasting.
3.5 CONCLUSION
Of ail the case histories the South African-SIMRAC trials appears to be the most
carefu Il Y executed and monitored. Observations of damage around fully charged and
fully confined blastholes show that considerable powdery tïnes are produced which will
inhibit gas tlow. Gas expanded fractures around blastholes should also show signs of
propping by fine particlt:s swept iota the fracture by the gas tlow. Crushing and
powdering of the rock has been definitely observed as reported by the USBM report.
One thing c1early identified in the SIMRAC report is the displacement on existing,
appropriately oriented. fracture planes which coincides with modulus softening and
convergence measurements. Understanding how to create [his condition using explosives
may weil be the key to the success of destress blasting.
The mental picture one has of the destress blasting effect on rocks is that they are
·softened'. Practically. this refers to a reduction of the modulus so that the blasted rock
can only support a reduced load with respect to the neighbouring rock. The SIMRAC
3-29

•
•
Chapter 3 Destress Blasting Practice in Hard Rock Mines
report states that these failure planes exhibited gouge zones after destress blasting when
no gouge existed before.
The principal monitoring methods are visual observation of fracture patterns.
convergence and seismic event measurement and location. In addition. blasting
vibrations. measurement of absolute stress and stress change. ground penetrating radar.
tomography and the usual geomechanical rock properties have ail been proven useful in
preparing and analysing destress blasting trials. Digital recording of seismic events
should be carried out at the highest sampling rate possible so as to be able to evaluate the
seismic energy content of the event.
Destress blasting is considered successful when it succeeds in triggering a major seismic
event in or near the destressed area immediately after the blast and/or no important
seismic events causing delays occur during the mining process. The magnitude of the
seismic event recorded at the time of the blast should be at least equal to the explosive
energy in the blast. The results reported by INCO. gained over twel ve years of mining.
confirm the previous comments and conclusions that a better understanding of the
mechanisms involved in bursting and destressing will lead to better numerical modelling
and the prediction of the most cost effective solution.
3-30

•
•
CHAPTER4
EVALUATION BURST POTENTIAL USING MININGINDUCED ENERGY
4.IINTRODUcnON
Before a destress blasting program is commissioned, it is important first to assess the
need for it. As a strainburst control technique, destressing can only be useful and
effective if the miniRg zone in consideration was highly prone to burst. As mentioned
earlier in Chapter 3, several techniques and methods have been developed since the
sixties in an attempt to assess rockburst patential of underground rock structures. Several
of these techniques are based on the energy balance around excavations. Among those is
the Energy Release Rate (ERR) that was developed in South Afiica (Cook et al., 1966).
With the evolution of numerical modeling tool5 over the past decades, this technique,
along with similar concepts, has been often used in the assessment of rockburst potential
(e.g., Cook, 1978; Bolstad, 1990, Mitri et al., 1993; Mitri, 1996a).
A simple methodology to assess strainburst potential using a finite element modeling
approach is presented in this Chapter. It leads ta the calculation of the ERR and another
index called the total mining induced energy storage rate or ESR. The calculations take
ioto consideration the geomechanical properties of the rockmass, in situ stress conditions
as weil as the mine geometry. Such energy parameters cao help identify areas of higher
energy release and/or storage due ta mining activity, and hence the location and potential
of strainbursts. Based on the energy balance approach reviewed in detail by Salamon
(1970, 1974, 1983, 1984), as weil as by Budavari (1983), Walsh (1977), Brady and
Brown (1985), and Hedley (1992), the current methodology is developed ta assess the
rockburst potential of underground openings before and/or during the mining aetivities.
The methodology follows these steps:
1. Determine in situ geomechanical data
2. Laboratory testing to determine the rock mechanical properties such as E, v, Ge, ec
3. Energy analysis with the help ofa numerical modeling tool.

•Chapter 4 Evaluale Burst Potential Using Mining lnduced Energy
4.2 ENERGY RELEASE RATE (ERR) AND ENERGY STORAGE RATE (ESR)
4.2.1 Energy Release Rate (ERR)-Advantages And Limitations
Based on the energy balance. an incremental approach can be used to follow the changes
due to mining. The mining of an underground orebody usually implies the widening of
excavations by increments. This leads to an energy release rate by unit surface (dWIdS).
used when the opening geometry is regular. or a volumetrie energy release rate (dWr/dV).
used for irregular geometry openings. Stacey and Page (1986) provided a way to
evaluate. in a preliminary manner. this energy releuse rate (the symbol ERR is commonly
used in the literature). Observations of the incidence of violent rock failures at two South
African mines (5000' and 9000' deep) indicated that such failures increase with the spatial
rate of energy release or ERR (Hodgson and Joughin. 1967). Salamon (1974) showed that
for elastic conditions the relations among the energy components apply to any mining
configuration. Also. when mining takes place in very smail steps. the limiting conditions
are:
(4.1 )
•
The above relations imply that when mining takes place in very small steps. no or liule
seismic energy (~~Vk ) is released. Furthermore. Salamon (1983) demonstrated this point
by considering a case of a circular opening subject to hydrostatic field stress: refer to
Figure 4.1. As can be seen from the tïgure. the kinetic energy released decreases as the
number of mining steps increase.
As a result. ERR became one of the most used parameters for stope design in deep
underground South African mines (Cook. 1978. Spottiswoode. 1990). Although the ERR
has gained wide acceptance in South Africa, Salamon (1993) pointed out that it must be
used with caution. and that it can be only of limited value in combating the rockburst
hazard. because:
(1) the magnitude of ERR only depends on the virgin field stress, the elastic properties of
the rocks and the layout of the mining excavation, i.e. it is independent of the
4-2

•
•
Chapter.J Evaluate Burst Potenlial Using Mirring Induced Energy
geological structure, the presence of flaws (discontinuities) in the rock mass and the
potential instability of these flaws,
(2) ERR alone is unable to recognize failure. The latter reason has been a motivating
factor for the present development of a new theory for the calculation of the so-called
Burst Potential Index (BPI), based on energy considerations, which is described
herein.
100
~ 80 li /wm r
r...~~ 60=~§
40...~~
~ 20
08 16 32
~umber Of Mining Steps
Figure 4.1 Variation of energy released with the number of mining steps(after Salamon 1983)
4.2.2 Present Approach
The need to better understand rockburst phenomena, particularly pillar and strainbursts.
has motivated the researchers to expand on the concept of mining-induced strain energy
density around mine cavities (Mitri et al., 1993). Referring to Figure 4.2, the premining
state of stress before any excavation is made is 0'0. These stresses are in balance with the
initial extemalloading Po representing the body forces in the rock mass, or simply its own
weight in this case. The loarling of the problem is initiated by the unbalance created by
the removaJ of the rock mass inside the boundary. The initial stresses stored in the
excavated volume disappear (due to mining) and as a result, an out-of-balance load.
4-3

Chaprer.J Evaluare Bursr Potential UsÏfrg Mining Induced Energy
This induced load causes displacements U1 • strains• lM' = ~ - JBr GodV, is induced.
El' and stresses 0'1 around the excavation in arder to reach state of equilibrium as per the
following relation:
Preminîngstresses
Cfa ..
Mine opening
..
a Seismic energy releaseddue to mlntng
Straî n ~nergystored ln tnerock mass
due lo mining
oE
(b) stress relief
o E
(a) Stress concentration
Figure 4.2. Definition of mining-induced energy components (after Mitri et al.. (999)
•
where, in finite element terms.
~ = external loading representing body forces in the rock mass
KI = stiffness matrix of elements in the surrounding rock mass
B =element strain-displacement matrix
(j0 = initial (in situ) stresses
(4.2)
4-4

•Chaprer -1 El/a/liale Bursl POlential Using Mining lnduced Energy
When equilibrium is reached, the external load ~ becomes in balance with the induced
internai stresses O'rnJ =0', - 0'0' i.e.
(4.3)
Multiplying both sides of Equation (4.3) by the displacements lI l , one obtains the work
done by induced toad ui ~, or W in Equation (2.8). Thus the work done by the extemal
loarl is
(4.4)
Part of the work is stored as strain energy due to induced stresses. el' in the surrounding
rock mass. This can be easily shown to be given by:
(4.5)
As appears l'rom Equation (4.4). the strain energy caused by in situ stresses (j0 in the
surrounding rock mass. e~. can be expressed as
(4.6)
Hence the total energy stored in the surrounding rock mass. U(Equation 2.8), due to
mining. is el + e: and the storage rate. ESR. is
dESR=-(e. +e,)
dV -(4.7)
•Since body forces existed before any excavation took place. the kinetic energy released,
~Vl.' in this process must cause a seismic effect, and thus be referred to as '~seismic
energy release". Applying Equation (2.12) can fonn this:
(4.8)
4-5
•Chapler 4 Evaluate Bursl POlelllial Using Mining Induced Energy
which, after substitution gives
(4.9)
Thus the seismic energy release rate. ERR, can be obtained from
(4.10)
To summarize, the total strain energy stored in the surrounding rock mass due to a mining
step, Ul
• is equal to el + e;!, while the seismic energy released, er. is given by Equation
(4.8). The summation of aIl energy components is then el + e2 + er as illustrated in Figure
4.2. This can be shawn ta be equal to the work done by the body forces or the own
weight of the surrounding rock mass. W. which is calculated l'rom:
(4. 11)
where y is the body force per unit volume.
4.3 EFFECT OF l\'IINING SEQUENCES
Let us now suppose that the excavation of Figure 4.2 is to be created in two steps. as
illustrated in Figure 4.3. Since the behaviour of the rock mass is linear elastic, the state of
stress and strain at the end of the two mining steps must be the same as when mining in
one step. Moreover, the total strain energy stored in the rock mass should he the same.
However. the amount of seismic energy released is significantly smaller when mining in
two steps. From Equation (4.9). it can he seen that the seismic energy released in the tïrst
mining step is:
(4.12)
•whereas mining in the second step results in the release of:
..-6

•Chaprer.J Eva/ume Bursr Porential Using Mining lnduced Energy
Eo
,nd mlnlng sequence
1sI mining sequence
Figure 4.3 Energy components when mining in sequences (after Mitri et al.. (999)
~ J1 ,~ = -(cr, -0"1 )E,d'.tr 2 - - (4.13 )
•
Adding the above tWQ quantities, it can be seen that there is signitïcantly Jess seismic
energy released when mining in two steps tÎlan in one step. It can be shawn that the
reduction in seismic energy release when mining in two steps. instead of one, is given by
JEl (0":2 - <1 1 )dV .
~-7
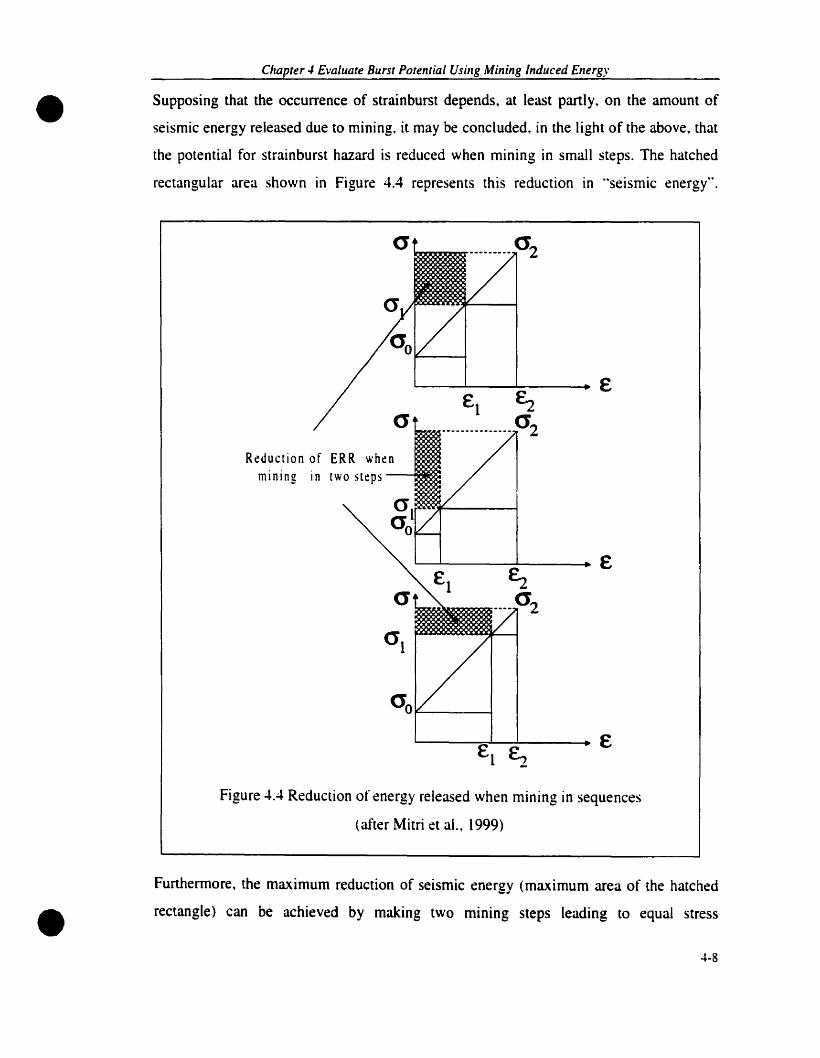
Reduction of ERR whenml nI ng 1n [WO steps
•Chapter -1 Evaluate Burst Potential Usillg Mining lnduced Energy
Supposing that the occurrence of strainburst depends, at Ieast partiy, on the amount of
seismic energy released due to mining, it may be concluded. in the light of the above, that
the potential for strainburst hazard is reduced when mining in small steps. The hatched
rectangular area shown in Figure 4.4 represents this reduction in "seismic energy".
E
•
Figure 4.4 Reduction of energy released when mining in sequences
(after Mitri et al.. 1999)
Furthennore, the maximum reduction of seismic energy (maximum area of the hatched
rectangle) can he achieved by making two mining steps leading to equaI stress
4-8

•Chapter'" Eva/uate Burst Potential Using ~'ining Induced Energy
increments, Le. the optimum mining sequence would be the one which sarisfies the
condition (refer to Figure 4.4):
(4.14)
Since mining is a continuous process, it is possible to design the mining sequences to
satisfy the above condition. It should be noted that mining in equal size lifts does not
necessarily result in equal stress (and energy) increments. In general. when mining in
sequences, three strain energy components can be calculated after each mining step.
These are illustrated in Figure 4.5 for ith mining step of a given mining sequence.
E5R1
mining mloingstep stepNo.2 ~o.i
'--'----......-l''''-----+E
minings[ep~o.l
0"
la)
(b)
(c)
Figure 4.5 Energy components for ilh mining step tafter Mitri et al. 1999)
•ESR j = mining-induced strain energy in the rock mass after a given mining step, =
d-(el +e.,) ~dV -
4-9

•
•
Chapter 4 Evaluate Burst Potenrial Using Mining lnduced Energy
ERR, = energy release rate after a given mining step;
ESR :: total mining-induced strain energy stored in the rock mass from the beginning of
the mining process.
4.4 BURST POTENTIAL INDEX (BPI)
The present approach permits the calculation of mining-induced energy stored in the rock
mass. Following the line of thought that rockburst is due ta sudden release of energy from
a volume of highly stressed rock. it can be supposed that violent failure will take place
when the encrgy stored in the rock mass exceeds a critical value. thus rendering the rock
material to its post-peak (unstable) range. [n a uniaxial test the recoverable energy. ER, is
determi ned by the triangu lar area defined by î(CT. + CT" ) "(10 '" - 10" ). where E is the
tangent modulus. The critical energy. ec • is then defined by the portion of the recoverable
0'.~
0' .......-----4-.....
o
E
Figure 4.6. Definition of critical energy stored in a uniaxial test
energy which is bounded by the initial stress 0'0 and the peak stress <1c, as shown in Figure
4.6. Thus:
~-10

• ., .,a: -a~e =-"---
" 2E
Chapler 4 Eva/uate Burst POlenlial Using Mining lnduced En,'rgy
(4.15)
where Ep• is the uniaxial peak strain. and Eo. is the premining strain. A burst potential
index (BPO. can then be defined as.
BPI = ESR x 100%e...
(4.16)
•
lt may be argued that the above burst potential index calculation is limited in its
application to the uniaxial loading condition. which is not the case inside the rock mass
surrounding the mine stopes. While this is theoretically true. strainburst problems in
reality are often associated with failure which takes place at the pillar skin. or at least is
triggered at the skin. where stress concentration. as weil as energy stored are the highest.
In such cases. the state of stress at the skin is biaxial. and violent failure will be
controlled by the major principal stress, cr" parallei to the excavation boundary (since the
stresses normal to the boundary must be zero). Also. it is to be noted that equations (4.15)
and (4.16) consider not only the strength of the rock (a, ). but aiso its ability to deform
(E); and hence its "strain energy storage capacity". This aspect is thought to be important
in the assessment of rockburst potential. and in effect. more representative than
conventional rock failure criteria. which consider only the rock strength parameters.
Ali the equations deduced in the model are based on linear elastic rock behaviour.
Actually. around mine openings. there exist naturally fractured zones as shown in Figure
3.1. Part of the E5R in Figure 4.4 will be released through l'racturing the surrounding
rock. which actually is a time-dependent phenomenon (COMRO.I988). The fracturing
leads to the increase of energy released, but the seismic released energy has not been
changed. That means the formation of the fractured zone in computing the ERR can be
neglected. The computed E5R value in this model is higher than the value in reality. and
so is the BPI. i.e. it is conservative from design point of view.
4-11

•Chapter 4 Evalume Burst Potential Using Mining lnduced Energy
4.5 CASE STUDY
The BPI theory described above has been implemented in 2-dimensional and 3
dimensional finite element codes. The 3-dimensional code is new, and is developed by
the author. This is described, together with a new theory for destress blasting in Chapter
5. An existing 2-dimensional code called e-z tools/2D, has been developed to implement
the BPI theory. e-z tools/2D perform static analysis of linear elastic materials. Il has been
used exclusively in rock mechanics applications. Detailed information on the e-z too/sl2D
is available elsewhere (Mitri. 1993).
[n the following. a case study is presented to demonstrate the application of the BPI to
underground opening. The 2-dimensional code is used herein. Figure 4.7 shows the
vertical section of a cut-and-fill stope in a Canadian mine. The mine uses conventional
and mechanized cut-and-fill methods. and also does sorne long hole mining. In the eut
and fill method. ore is removed in small lifts of approximately 1.80 fi and the stope is
Hangm~ walllAnesul:)
Values reponl:d IR
Table :!
fIlili[;J!L0
EOICh cut n:presenlSJ actuaJ mlOing
sequences
FootwalltAneSlle)
•Figure 4.7 Cross-section of a cut-and-fiU stope 18-1361 Goldcorp's Red Lake
Mine
4-12

•Chapter 4 Eva/uate Burst Patencia/ Using Mining lnduced Energy
then filled with hydraulic backfill. The mine reponed a crown pillar failure shortly after
the removal of the last (18[h) mining lift. Production was stopped subsequently and the
stope was abandoned.
a e o e sequences
First Static analysis of the model with no excavations.
Second The overeut and the two footwall drifts.
Third First mining eut simulated. The farst eut of the stope is mined.
Founh Second mining eut simulated. The second eut of the stope is mined.
Fifth Third mining eut simulated. The third eut of the stope is mined.
Sixth Fourth nlining cut simulated. The forth eut of the stope is mined.
Seventh Fifth mining cut simulated. The tïfth eut of the stope is mined.
Eighth Sixth mining eut simulated. The sixth eut of the stope is mined.
The geology of the section analysed comprises the ore body. a mineralized sulphide vein,
which is 6-feet wide. dipping at 75°. Both the footwall and hanging wall are andesite.
Although there are 18 mining lifts that took place in the stope. numericaI modeling was
carried out by simulating eight mining steps as follows: six mining steps representing 18
lifts by grouping every 3 lifts into one mining step, plus two other mining steps to
simulate the initial conditions and aecess drifts. These are presented in Table 4.1
T bl 4 1Mdl
At each step of the analysis. stresses. displaeements and strain energy parameters (ERR.
ESR) are computed at the centre of each element in the mesh. A graduaI inerease in the
strain energy storage rate around the excavation is expected between excavation step 1
and step5. the change in ESR between step 6 and step 8 is expected to be signitïeantly
greater as we reach the Iower skin of the crown pillar.
4.5.1 Geomechanical Properties
The relevant geomechanical properties of the rock masses used in this analysis are shownin Table 4.2.
Table 4.2. Geomechanieal Properties
Andesite1 0.029 MN/m3
0.2880GPa
174 MPa
0.027 MN/m3
0.2076Gpa
180 MPa
Mineralized sulphide veinPropertiesUnit weight y
Poisson's ratio vElastic modulus E
Uniaxial strength (Jp• 4-13

•
•
Chapter 4 Evaluate Burst Potential Using Mining Induced Energy
4.5.2 In Situ Stresses
The principal stresses at the Red Lake Mine are summarized below. The strike of the ore
is generally N 126°E and dips 64° SW.
• <1, =8.80 + 0.0422 MPa lm of depth perpendicular to strike of the ore body
• <11 = 3.64 + 0.0276 MPa lm of depth parallel to strike of the ore body
• <13 =0.029 MPa lm depth
Thus. the naturai stress tensor at depth of 981 m cao be calculated as:
• C1~ =31.83 MPa
• C(I = 52.00 1 MPa
• cr:' =33.779 MPa (out of plane of the section)
The material properties for both types of rock In the model were considt:red
homogeneous. isotropie and linearly elastic. The intluence of hydraulic backtïll was
assumed to be negligible. This is a reasonable assumption as already stated by others
(e.g. Mitri. 1996a: Lu et al.. 1993). From the above data. the critical strain energy storage.
ec• (Equation 4.15) is calculated for each mining step in the analysis.
4.5.3 Results and Discussion
ESR and BPI results at 6 monitoring levels L, to 4 along the stope successive backs
were monitored as shown in Figure 4.8. Level 4, is the centre of the skin element at the
bottom of the final crown pillar and lever L, is the centre of the skin element at the top of
eut # 1. The intennediate levels. Ll • L3• L~. and Ls are located at the centre of the upper
skin element of cuts # 2.3.4.5.
The values of ESR and BPI at these points are shown in Table 4.3 for the four finite
elements spanning the stope back. It can be seen from Table 4.3 that the values of the
monitored locations rise gradually as the excavation approaches the final crown pillar•
and substantially after cuts #5 and #6. The increase of the ESR and BPI values at
4-14

•
•
Chapter 4 E\laluate Burst Potenrial Using Mining lnduced Energ)'
monitoring points at the lower end corner of the crown pillac is noteworthy. ESR and
BPI values have been used to study the failure mechanism of the crown pillar as shown in
Figure 4.8 and the results are listed in Table 4.4. Considering the limitation that the
present analysis is only linear elastic. and stress redistribution due to skin fracturing is not
accounted for, it may be more realistic to consider the average results for the first two
rows of elements in the immediate back after each cut. From Table 4.4. it can be shown
that the average BPI for the entire stope back rises substantially from 102% after eut #5
to 13690 after cut#6. at which point. the pillar is reported to have failed by a rockburst.
Table 4.3: ESR and BPI values in the stope back after each eut
Element 1 i Element :2 Element 3 Element 41
Cut ! Level ESR BPI E5R BPI ESR BPI E5R BPI
Mj/m-' % Mj/m3 % Mj/m-' % Mj/m3 %
L, 0.08 39.94 i 0.067 33.45 0.092 45.92 0.105 52.421
1
2 L1 0.1301
64.80 1 0.110 54.83 0.150 74.76 0.170 84.73i
3 L 3 0.220 i 109.50 1 0.187 93.10 0.187 93.10 0.286
4 ~ 0.2211
0.188 93.30 0.254 126.10 • 0.287i 109.70
5 Ls 0.290 143.70 1 0.333 165.01 0.333 1 165.01 0.376 ' 181.90 i
6 4 0.373 184.60 ' 0.318 157.35 i 0.318 157.35 0.482 238.50 ;
Figure 4.8 First [hree layers of elements
4·15

•Chapter 4 Eva/ume Burst Patentia/ Using Mining lnduced Energy
4.5.4 Conclusion
A simple numerical modelling technique is presented and employed to assess the
strainburst potential in a cut-and-fill mine stope. From the results obtained. it can be seen
that the BPI is a useful tool in predicting crown pillac strainburst in cut-and-fill mining. It
was shown that as the mining sequence progresses upwards thus reducing the size of the
pillar. the magnitudes of ESR and BPI increase. Those were particularly highest at the
corners of the stope back. which indicates a possible shear failure mechanism. The
average burst potential index (BPI) in the bottom two rows of elements in the crown
pillar is 136%. after eut #6. when it actually failed by a rockburst. The present analysis
is only linear elastic. A more realistic approach is to consider a time-dependent analysis.
which will consider the progressive development of skin extension fractures at the stope
back.
4 5 d 6li ~a e an an t e crown pl ar or eut . an
PI P:! P3 Pol
Cut Layer E5R BPI E5R BPI ESR BPI E5R BPI
Mj/m3 9c Mj/mJ % ~lj/mJ 90 ~tj/m' %
3 0.060 29.80 0.060 29.80 0.028 13.90 0.028 13.90
4 2 0.093 46.10 0.093 46.20 0.060 19.80 0.093 46.10
1 0.222 110.20 0.190 94.30 0.255 126.60 0.287 142.40
3 0.092 45.60 0.092 45.60 0.090 44.60 0.052 25.77
5 2 0.133 65.90 0.133 65.90 0.114 56.50 0.133 65.90
1 0.295 146.20 0.214 106.10 0.254 125.90 0.376 186.32
3 0.066 32.66 0.118 58.390 0.118 58.390 0.066 32.66
6 2 0.158 78.18 0.158 78.180 0.104 51.460 0.158 78.18
1 0.381 l88.52 0.330 163.29 0.431 213.30 0.482 238.50
T bl 44 ESR d BPI' h
• 4-16

•
•
CHAPTER5
PROPOSED NUMERICAL MODEL FOR DESTRESSBLASTING
S.lINTRODUCTION
This chapter describes a 3-dimensional numerical modeling technique for the simulation
of destress blasting in hard rock mining operations at depth. The technique employs two
newly introduced parameters. Ct. a rock fragmentation factor. and ~. a stress dissipation
factor. inside the modeled. fractured zone. The model is based on the theory presented in
Chapter 4 ta help assess strainburst potential and hence. the need for a remedial solution
such as drift destressing. Basically. when the burst potential index (BPI) approaches or
exceeds 100%. the method suggests that rockburst is imminent and destress blasting may
be required. Destress blasting is simulated by modifying the defonnation properties of the
rockmass and the post-blast state of stress in the destressed zone using the above
mentioned parameters Ct and ~. The technique. based on incremental analysis. pennits the
simulation of actual mining activities. i.e. mining and destressing.
5.2 NEW GEOMECHANICAL l\'IODEL FOR DESTRESS BLASTING
Destressing is a technique that aims to reduce the stress field in the rock mass
immediately ahead of the mining face to reduce the potential of face burst. This is
achieved by blast-induced fractures resulting in a release of strain energy in the fractured
zone.
Destress blasting in mine development has been applied in zones of high stress in brittle
rock. The driving of development headings, raises and shafts is often accompanied by
rock noise due to popping, spalling and occasionally face ejection rockbursts. This is
often caused by high stress and energy concentrations in the face. The problem is usually
alleviated by drilling and blasting long holes ahead of the face and in the pillars between
multiple headings.

•Chaprer 5 Proposed NumericaI Model for Destress Blasring
Deslresszone
~AR R
• •• .,1 1 1 J " \ 1 /
1 1 / i'-\ ilM1 1'f'.,
f'\-. \ \t / i'-" , / / 1
"" 1 1 !Drift Dcvclopmcnl...
1 1
vnl\\"'~1 ",V V
1 1 V / 1 \ \ "J 1
1 1 1 1/ / \ \ ",""Î1 , 1 1 1 1 \ "-
l--+ ASCl:lIon A·A
Figure 5.1 Finite element mesh for a drift development
Figure 5.1 shows the finite element mesh of a drift development in elevation and cross
section. The tïrst step required is to calculate the stress and energy parameters for the
initial conditions (Figure 5.2a). If the initial conditions indicate the need for destressing.
then destress blasting will he carried out. To model the destressed area. based on the idea
that the rock is to be ·softened'. we introduce the rock fragmentation factor {a}. which
ranges from 0 to 1. This means that the rock property in the destressed zone is reduced
from Ei to EOi
(5.1 )
or {E/)}={aY ·[/]·{E}Where {a} T = {Cl.c. Cty, az}, {E} T ={E~,Ey,Ez },[I] is the 6x6 unit matrix.
The stress dissipation factor {~} in the destressed zone is also introduced. It represents
the instantaneous drop in stresses due to blasting. Thus. the residual stress in the
destressed zone immediately after blasting, cro. can he expressed as:
(5.2)
•
or {a0 } ={l - f3Y.[/]. {CT}
where {ay=p{,a ,. ,(j: ' r 0- ' r ,-: ' r:I } is the mining induced stress before destressing,
and {l- /3Y ={o- /31 ),(1- /3.),(1- /3: ),(1- f3o- ),(1- /3,-: ),(1- /3:'>}
5-2
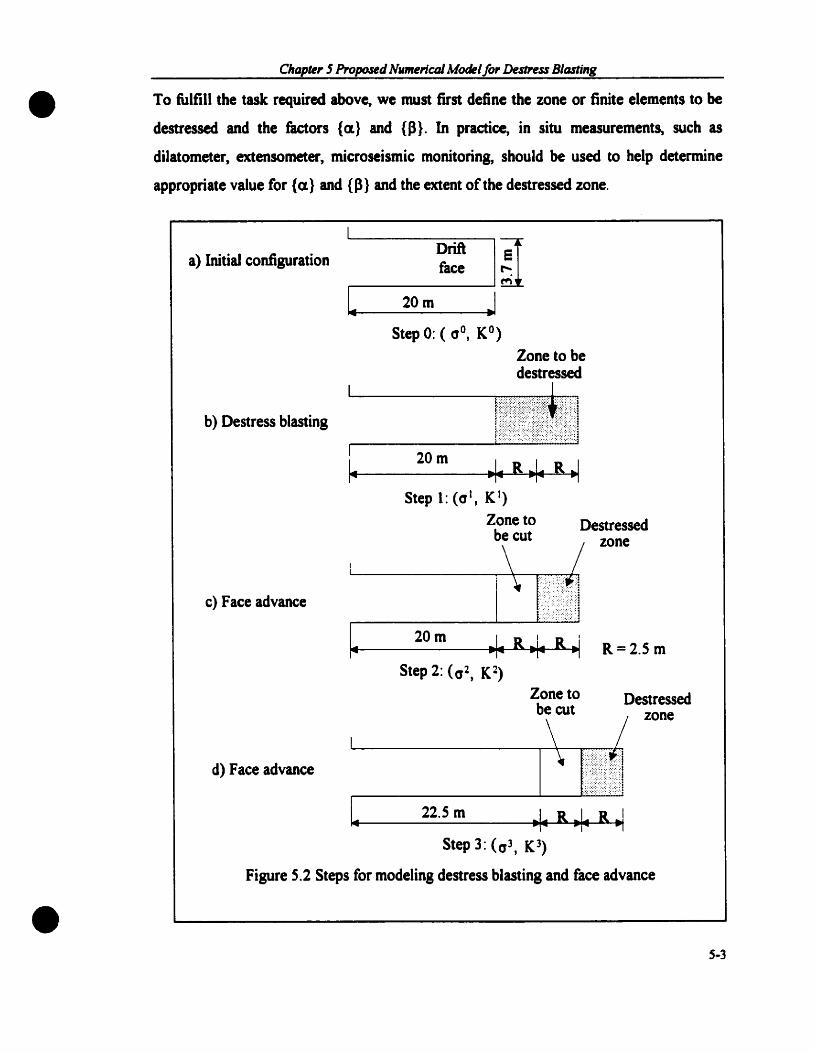
•Chapte, 5 Proposed NumerlcaJ Madelfor Destnss Blasting
To fulfill the task required above, we must first define the zone or finite elements to be
destressed and the factors {a.} and {P}. In practice, in situ measurements, such as
dilatometer, extensometer, microseismic monitoring, should be used ta help determine
appropriate value for {a.} and {P} and the extent ofthe destressed zone.
a) Initial configuration
b) Oestress blasting
Drift ET,..-- fa_c_e_-J~
20m
Zone ta bedestressed
1!lfll!!!!11!~IÎ~20m
c) Face advance
Step 1: (al, KI)
Zone tobecut
Destressedzone
R=2.5 m
d) Face advance
Zone tobecut
Destressedzone
22.5m
•Step 3: (0 3, K3)
Figure 5.2 Steps for modeling destress blasting and face advance
S-3

•Chapter 5 Proposed Numerical Model for Destress Blasling
Based on the modified rock properties and stresses, we can reconstruct the global
stiffness matrix [K l] and the load vector {&P}. The element stiffness matrix of the
destressed zone is reduced to:
(5.3)
where [Do] is the stress strain relationship matrix of aIl elements in the destressed zone
and the load vector {Ml} is ca1culated from the followi ng equation:
(5.4)
As shawn in Figure 5.2e. the next step is to model the face advance. The stiffness matrix
is updated aecording ta the following equation;
(5.5)
where [Km] is the stiffness matrix of ail elements in the zone which is mined out. The new
laad vector resulting from the removal of e1ements in the zone mined out is solved by
f[N f .{y}. dV <5.6)
When carrying out analysis. a global co-ordinate system (x, y. z) is generally adopted.
This does not usually coïncide with the coordinate system (x'. y'. z') introduced in Figure
5.3. The linking of the global coardinate system with the coordinate system related to the
orientation of the anisotropy may be achieved using two angles. These describe the
direction of a contour (strike e) and the slope of the line of dip (dip <p) to the global
coordinate system.
The stress {Cf'} and the {E') in the eoordinale system related to the orientation of the
local coordinate (x', y'. z') may be computed from the stresses and strains in the global
coordinate system with the aid of the transfonnation matrices [T] and [T-] respectively
(Lekhnitskii. 1963):
•{cr'}= [T J. {a} (5.7)
5-4

• {e '}= lr- j. {e}
Chapter 5 Proposed Numerical Model for Deslress Blasring
(5.8)
The components of the vectors {a} and {E} may aiso he related in a similar manner to
Equation 5.9 with the aid of a matrix in the case of transverse isotropy.
(5.9)
Such a matrix is initially only valid in the chosen coordinate system (x.'. y', z'), and
should therefore also be denoted by " as are the stress and strain vectors in this system.
Thus
{a r}= [D l {E'}
The matrices contains the angles eand <p in the following form:
(5.10)
[r]=
rII).
l~
I~
Ill:
1~ L,l,II
m~m,
m,ml
o,
fl!,
n~
o
o
21;111;
l,m~ + l:nl l
l~m; + l,m~
l,ml + llm~
o1.m,n,
ml").
m~fl, + m,ll~
min.;
(5.11 )
•
1:' ..0 flmt 0 0m-
I t
f; .. ../1 m: n2/Zm~ n1 mZn2
[1 , ..r.m~ Tl}/}[r- ]= mj n- m}n.13 J
(5.12)2ll/~ 2mlml 0 Ii m l + /lmt mln l Tl)12/1/ 3 2ln l m:. 2n l n:. l1m3 + lJm:. m'Zn} +mjn:. Tl z/} + n3l~
2l:.11 2m jml 0 l,ml +llm} mIn:, n}f,
in which
Il =sine. ml =cose. ni =0,
1:: =cosq> cose. m! =. cos<p sine. nz =-sin<p
b =-sin<p cose. fi] =sinq> sine, n3 =-cos<p.
Equation 5.7, and Equation 5.8 may be substituted in to 5.10:
5·5

•Chapter 5 Proposed Numerical Model for Destress Blasting
(5.13)
l
l, y. z global ~oordinatc systemeangle of slTIke: Ou 'S 8 < 360"wlth respect tG y axiS
<9: angle DI' ~hp: _90U~ qJ < 90'1
Figure 5.3 Relationship between the fixed global coordinates and those related toorientation of a local plane of isotropy
Multiplication by [Tri gives
{cr}= [T ri [Dl [T"]. {e}
Since [Tri = [T· r'the l'ollowing is thus obtained l'rom equation 5.10:
Where [D'] is given as:
{cr}= [D l {e }
in which
(5.14)
(5.15)
(5.16)
Equation 5.15 describes the relationship between stresses and strains in an arbitrary
global coordinate system which fonns the angles q> and <p defined in Figure 5.3 with the
coordinate system (x', y', z') related to the local. In certain circumstances the inverse of
equation 5.15 is also of interest. Appropriate rearrangement yields
(5.17)
•where for the case of orthotfopy in terms of stresses and both normal and shear strains in
a three-dimensional element (referring Figure 5.4), [D't l is defined as Equation 5.18.
5-6
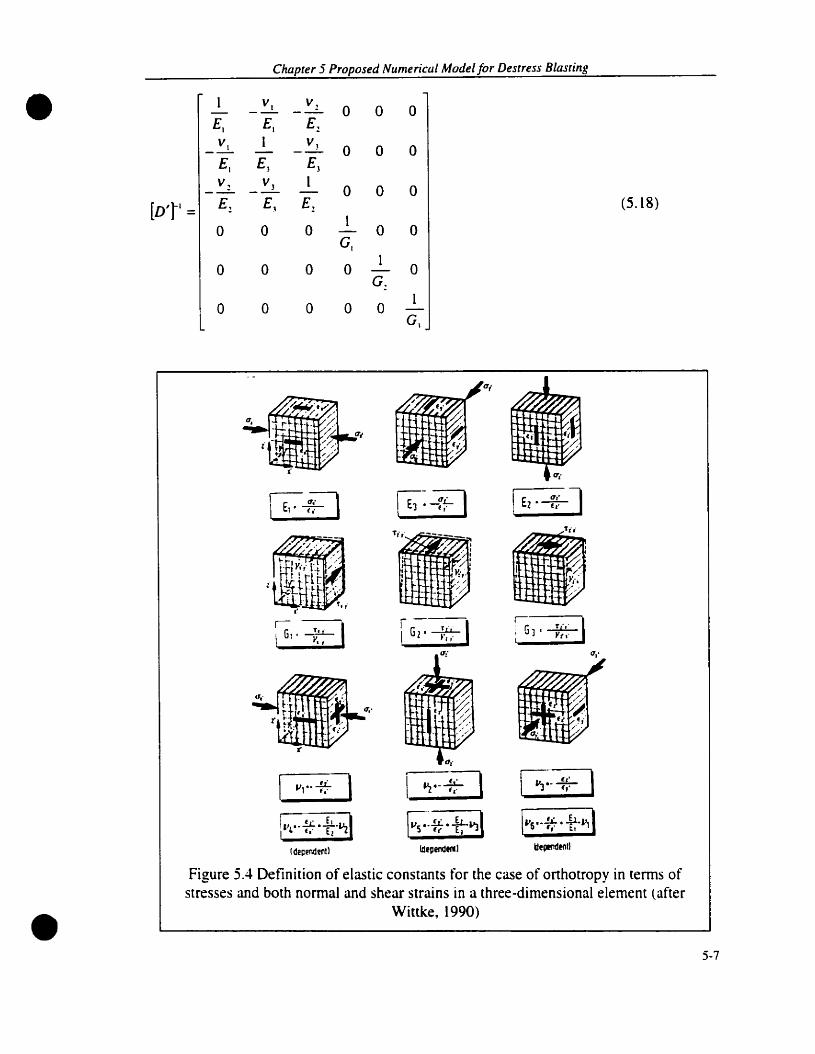
Chapeer 5 Proposed Numerical Madel for Deseress Blaseing
• -~ -~ 0 0 0El El E"!
_2 1 v!0 0 0
El EJ EJ
-~v3 1
0 0 0-[D'jl = E"! E~ E1
(5.18)
0 0 0 0 0G1
0 0 0 01
0-G.
0 0 0 0 0G 1
!E2·~J
IITti
,1
, /.
. ~
ldtpendtnllldepende"tl
•Figure 5.4 Definition of elastic constants for the case of orthotropy in terms ofstresses and both normal and shear strains in a three-dimensional element lafter
Wittke, (990)
5-7

•
•
Chapter 5 Proposed Numerical Mode/for Destress Blasting
A further simplification in the [D'ri matrix arise when the rock mass has only one
dominant joint set. In this case there is a symmetry of elastic properties about an axis
(parallel to the normal to the joint set), say the x direction. The six elastic constants of
transverse isotropy are defined as follows (see Figure 5.5). For the case of transverse
isotropy and planar fabric in terms of stresses and both normal and shear strains in a
three-dimensional element, the stress strain relationship can he defined as follows:
-~_ v1 0 0 0
El El E~
1 _ v~0 0 0
El E1
10 0 0-
[D']-I = E,(5.19)
0 0G1
0G,
1-Gz
E I-nvî.,
E VI +nv1' E v 1 0 0 01 1 1(l +vl)m (l +vl)m m.,
E I-nv;E VI +nv; E V! 0 0 01 (l +vl}m 1 1
(l +vl)m ln
[D']= E v! E v 1 E.. I-VI 0 0 0 (5.20)1 1m m m
0 0 0 El0 0
2(1 +V 1 )
0 0 0 0 G.. 0
0 0 0 0 0 G..
where n=~" m=(1-v, -2nv;l
Once the global system of equilibrium equations is solved for the displacements {dU1 },
strain, stresses and energy parameters E5R, ERR, and BPI cao ail be computed.
5-8

Chapeer 5 Proposed Numerical Model for Desrress Blasring
•
lu... -..!!:. • .lLou..11- J E,' El - t. ,
(à~endenll
•
Figure 5.5 Definition of elastic constants for the case of transverseisotropy and planar fabric in terms of stresses and both normal and shear
strains in a three-dimensional element (after Wittke. 1990)
To recap. referring to Figure 5.6. the suggested procedure for numerical modelling of
destress blasting in mine drift developments is described as follows:
• model the initial drift configuration (Figure 5.2a) 10 assess the potential for face
burst using the burst potential index (BPI). and hence determine the need for
destress blasting,
• model destress blasting for a given {ex} and {~} (Figure 5.2b), while varying the
blasting pattern. Assess the effectiveness of each pattern through comparison of
post-blasting stress distributions,
5-9

•Chapœ, j Propos~dNlIIIterical Modelfo, Destnss Blasting
• model face advance (Figure S.2c), while examining the post-blast stresses, both
ahead and behind the face,
• model face advance (Figure S.2d), while destress blasting one round ahead of the
drift face.
/ MineGeomctry /Geomecbanical propertiesIn situ stresses
Initial modelling
l--... Calcu1ate dcsplacemen~ stresses and
and euergy parameters
Burst potentialBPI> 100%
Yes•Modclling oC
destress blastiDg
lReduce rock stiffness in destressed zone {œJReduce rock stresses in destressed zone {~t}
1
No
•
L.....-----i ModcUing oC mining Jie'-----.....sequences ...
Figure S.6 Flowchan ofthe model procedure for destress blasting
5-10

•
•
Chapt" 5 Proposed NumericaJ Madel Fo, Desl1'ess Blasting
5.3 FINITE ELEMENT EQUATIONS
5.3.1 GeDenl
Based on the numerical algorithm for destress blasting as weil as the rock mass
constitutive law described in the last section, a finite element model e-~ 'ools 3D has been
developed by the author. In this section, the details of the finite element formulation are
presented. The model employs piece-wise linear elastic algorithm. e-~ 100& 3D uses the
8-node and the 20-node isoparametric brick elements (Figure 5.7).
Underground openings in rock, 5uch as cavems, drifts, and shafts, represent a
considerable ponion of the construction volume in this field. The three dimensional state
of stress and strain in the vicinity of a temporary working face is in most cases of
important, a1though a cavity is nonnally supported. In the cases of both shaft5 and drifts,
the stresses due to the dead weight of the overburden and any tectonic loading in the rock
mass have to be diverted around the opening. This stress redistribution takes place largely
in the rock, which consequently experiences deformations due to the alterations in stress.
As a rule, the support and lining, consisting of anchors, shotcrete, reinforced concrete
etc., plays ooly a secondary raie (Wittke, 1990). It is for tbis reason that a knowledge of
states of stress and strain in the rock mass is of the utmost importance when assessing the
stability of underground openings and an appropriate description of the rock mass stress..
strain behaviour is indispensable.
Computation procedures to assess the stability of underground opening5 must therefore
he able ta handle general three-dimensional states of stress, and anisotropic rock mass
charaeteristics. In this context, the finite element method bas come very much to the
forefront in rec:ent years (pande et al., 1990; Wittke; 1990, Beer, 1992; Mitri, 1993,
1996a; Yu et al., 1996). 5uch a computational procedure bas been developed and will be
presented in this Chapter.
S-ll

•Chap.,. j P1'oposed NumerlcaJ Moœl Fo,. Dest1'ess Blasling
5.3.2 Element Shape FUDCtiODI
As discussed earlier, the displacements are calculated at the nodes. Displacements at any
point within the element are related to the displacements of the nodes (u, v, w) through
shape funetion as in Equation 5.21.
(5.21)
III
W ="i Ni (,;, 11, '). W 1,=1
where m is the number of nodes for each element which is 8 or 20.
The determination of these funetions is based on the faet that the coordinates of certain
points are known in bath coordinate systems. This is the case for the nodal points of the
element (Figure 5.6).
• Linear shape function for 20-node for corner nodes, or the shape funetion for 8-node
NL j =.!.(1 + ';,';)(1 + 11,11)(1 + (,() , i=I,88
• Shape funetion for mid-side nodes:
• For the nodes on the paine ';011
(5.22)
•
N j = NA,; NA j = ~ (1- ~1 )(1 + '1; '1)(1 + "') , j=I,4; î=13,16 (5.23)
• For the nodes on the plane T/o'
Ni =NBj ; NB j =.!..(l- 11%)(1 + ~,~)(1 + (,Ç) , j=I,4; i=IO, 12,20,18 (5.24)4
• For the nodes on the plane ~ oç
1Ni = Ne}; Ne} = 4(1- (2)(1 + ~';)(l + '1111) ,j=I,4; i=9,11,19,17 (5.25)
• For each corner node the final shape funetion is
S-12

•Chaprer 5 Proposed Numerical Model For Desrress Blasting
1NI = NL, - T(N(NK(i,l) + N(NK(i,2» + N(NK(i,3») (5.26)
O· :'~(------;l 4. Va
3 _1-------7
8·node brick element
O·~O
'18161 ~8
: / 19
:./3--~--~-715
20·node brick element
Figure 5.7 Element numbering
5.3.3 Element Displacements and Strains
Referring to Figure 5.7. Equation 5.21 can be expressed as follows:
• (5.27)
5-13

•Chapter 5 Proposed Numerical Madel For Destress Blasting
where m equais to 8 or 20 respectively for 8-node and 20-node element.
The sum of this equation may aiso be represented by the product of a matrix [N] and a
vector {ôe:}. the components of which are formed from the displacements of ail the
element's nodal points:
(5.28)
The matrix [N] contains the known shape functions and consists of a series of m
matrices:
(5.29)
[1 0 0]
in which. [,V, ]= ,Vi' 0 1 O.
001
So Equation 5.34 can be presented in the following form:
(5.30)
Further more the strain vector can be written in the following way:
au ~ aN- r-'uax ,=1 ax 'av ," aN
E - r-'vay .=1 av .E aw ~ aNE a:: r-'w
{E }= ,=1 a: i
= au av =III aN aN (5.31 )
Yn -+- L(-' LI +-'v)
('ay ax ,=\ ay J ax 1
av aw '" aN aN-+- ~(-'v +-'w)I..Y.:t az ay '=1 az · ay ,au aw m aN aN-+- L<aLl, +-'w, )a: ax .=1:: ax
• 5-14

•Chapter 5 Proposed Numerical Model For Desrress Blasting
A matrix [B] is introduced to simplify the forro of Equation 5.38, this resulting from the
series of matrices [Bil:
(5.39)
The following is valid for [Bil, i =1. m at the same time:
aN,0 0
ax
a aN,0ay
0 0aN,
[B,l= az (5.32)aN, aN,0av ax
0aN. aN,
a: ayaN,
0aN,
d: dX
Then Equation 5.31 can be expressed in the following format:
<5.33)
Replace Equation 5.33 into 5.9 can be written into Equation 5.34. expressing the stress
vector within the element in terms of nodal point displacements:
(5.34)
5.3.4 Element Stiffness ~Iatrix and Equilibrium Equation
It can be shown that the element stiffness matrix is given by
(5.35)
•in which
(5.36)\.,
5-15

•Chapter 5 Proposed Nllmerical Model For Destress Blasting
{F t } = J[B f {a Il }Iv + f[Nf {p}. dV + j {N' y{q}. dS + {F· }~., ~,' s'
(5.37)
Transforming the variables from global coordinates (x, y, z) into local coordinates (Ç, 11,
Ç) with the relationship
dV = dx dy dz = det[J] dç d" dÇ
aN, aN aN,L aÇ x, L ' \' Iarz,ar·;
[1]= LaN, x l aN, \' aNlIaçz,al1 ' ary . 1
aN, aN aNL-r l ary/ YI L aç' :/a; "
Equation 5.36 becomes:
[K']=! f f[Br[Dl·[B].det[Jl·d~.dT].dç-1 -1 -1
This integration can be implemented using Gauss Quadrature.
(5.38 )
(5.39)
(5.40)
•
where for the 20-node element (n =3), the 3x3x3 integration points are located at Çl' T1j,
Çk = .JO.6 . 0, -~0.6 , and the weighted factors at each integration point are W., WJ• Wk=
585 'h"k -13-.-,- \VIt 1. J. . = ..999
And for the 8-node element (n = 2), 2 x 2x 2 integration points are located at ;;1' 11J' Çk =
± 0.57735, and the weighted factors at each integration point are W i , WJ, Wk =1.0 with
i.j,k=1,2.
5.3.5.1 Consistent Load Vector Due To Initial Stresses
A numerical integration is also necessary to detennine the first three members of the
element load vector.
5-16

•Chapler 5 Proposed Numerical Model For Deslress Blasring
{Fa')}= f[Bf pu}JV = f J J[Bf[a llr ].{Nll}.det[J].dC;dTJdÇ~,' -1 -1 -1
(5.42)
where {Nu}= {Nt N~ N, N~IIY
cr: (1~ (j~ r l ri rin 1: .:.(
(1~ (1~ (1~ r~\ r- r-\: .:.r
[a ur] = (5.43)
am a~ a; rm r: r:( n
50.
{Fa
.I }= t i î[B(C;,.rl/.Çt )t[allr ].{NIl(C;,.'7/,Çt )}ctet[J].~W/Wt (5.44),=1 i=l 4=1
5.3.5.1 Consistent Load Vector Due To Bodv Forces
{FI'}== ,[lNFl:}v = t f, f,lN Fl~fdetlJ J. dl; d1]dÇ
== t. t. ~ [N(I;, ·1]I·Ç, lt ·l~fdet[J(I;,,1],.ç, l]'W,W, W,
where the [N] matrix is defined by Equation 5.29.
(5.45)
5.3.5.3 Consistent Load Vector Due To Boundary Traction
The consistent load vector due to boundary traction is computed along each side of the
element using the following formula:
(5.46)
• in which
5-17

•Chapter 5 Proposed Numerical Model For Destress Blasting
iw is the weight factor for 20-node is 2.0 and for 8-node is 1.0
[Nl] is the array consists of the eight nodes shape function on the element side subjected
to boundary traction,
{q} is the array consists of the eight nodal pressures,
H is the average thickness on the boundary traction direction.
ri. Sj. tif. will take the value of ça. 111' Çk respectively depending on the direction of the
boundary traction. one of the three will take the value ± 1. the rest will be the same as
before.
Up to now. the consistent Joad vectors due to body forces. initial stresses and boundary
tractions can aIl been numerically computed. The concentrated forces can be directly
added to the globalload vector.
•
(5.47)
5-18

•Chapler 5 Proposed Numerical Mode1for Destress Blasling
5.4 FLOWCHART AND NUMERICAL ALGORITHM
In this section. the programming technique and structure of the e·z tools 3D program is
described through several tlowcharts. First. the main structure of e·z tools 3D is divided
into 5 steps. Then the detail of programming for each step is discussed and its tlowchart
is presented.
5.4.1 General Flowchart
The computation process in e·z tools 3D follows into tïve basic steps. They are:
•
•
•
•
•
Data reading and preparation (calculation of the global degree-of-freedom and the
global stiffness matrix):
Calculate the element stiffness matrix and load vector. then assemble them into their
respective global arrays:
Solve the system of equations to determine the nodal displacements:
Calculate stresses and energy parameters. and hence the Burst Potential Index (BPI)
ta determine if destress blasting is needed:
Safety level ca1culation and transfer of data into postprocessor required format ta
view the results.
•
Figure 5.8 presents the general tlowchart of e·z tools 3D which illustrates the above
mentioned steps. Referring to Figure 5.2. if destress blasting is needed. the program will
repeat the five steps based on the stress state after the initial configuration. Since the
commercial software HyperlVlesh is used as the pre- and post-processor. the translation of
files. l'rom and to HyperMesh. before and after each computation of e-z rools 3D is
needed. For the different purpose of analysis. e·z rools 3D employs 2 sets of equation
solvers: Gauss Seidel and Gauss Elimination. When the problem to be analyzed is
relatively large the former equation solver (define lOS = 1) is recommended. And when
the problem is relatively small (define IGS =2) and with predicted large deformation. the
latter one is recommended.
5-19

•Stage 1
Stage 2
Stage 3
Stage 4
Stage 5
Chapeer 5 Proposed Numerical Madel for Deseress Blaseing
,1 Real! ria file /"
*Calculate the global degrees-of-freedom andthe stiffness matrix size
11
1
1•i Calculate the element stiffness matrix and load ;1
: vector then assemble them into global arrays
,: Solve the equation [A]{x} = {B} for the
nodal displacements {Ô}
11
tCalculate stresses and energy parameters for
each element( <1. ESR. ERR. BPI)
,Safety level calculation
Yes
•
No,: Output !~---.J
!1
@
Figure 5. 8 General tlowchart of e-z taols 3D
A complete description of (he input data is given in the Appendix.
5-20
•
•
Chaprer 5 Proposed Numerical Mode/for Destress Blasling
5.4.2 Model input Parameters
Except for the graphie information of the finite element model from the preprocessor. [0
carry on the calculation. the following data are needed for the input data file of e·z tools
3D:
Materials properties which include elastic modulus {E}, Poisson' s ratio {v}, unit weight
{y}. uniaxial compressive strength {cre}. coherent force of the material C. geomechanical
constant m for RMR. geomechanical constant s for RMR. friction angle <j>.
[n situ stress data which include initial stresses array at the original point of the model
{crû}, initial stresses angle 9 (strike 0° to 360°), <p (dip -900 to 90°, referring to Figure
5.3), initial stress ratio {FB}.
5.4.3 Global Degrees-of·Freedom and the Size of the StitTness ~Iatrix
Figure 5.9 gives the detailed tlowchart of the first model step. whereas Figure 5.10 gives
the second step tlowchart. Since the three-dimensional analysis makes the problem much
larger than the two-dimensional analysis. optimizing the global stiffness matrix storage
becomes very important for the efficient computation. [n e·z tools 3D. for the different
equation solvers, the global stiffness will be stored into two forms: upper skyline format
for Gauss Elimination and lower skyline format for Gauss Seidel.
5-21

•C/rapler.5 Proposed Numerical Modelfor Destress Blasting
r<1=l.nnd>1
-No--<
,1 JDINKI=Q
: --;-~--
l-.--.........--0~
>---y es ---,1i,
M=M+l
i,JDINKI=M
1
~I=UIM> • •
-<É3> Nu-
,Cali Subroutlne
ELCON
Yc:s1
1
~Yc:s~o
1 1
* ~ICal1 Subroulinel ICall Subroutlnc:1
, 1
COLDP 1 ~ COLDT i
~11
• 1
••
Figure 5. 9 Flowchart details of Step 1 for e-z tools 3D
5-22

•Chapeer 5 Proposed Numerical Madel for Destress Blaseiltg
1
1t
:4'!..-----« 1= 1. MM>>-------------~---N°~I,
Cali SubroutincIPESTF
1,Cali Subroutinc:
IPLOAD
IN 0 ---<<;!;>---VC:S l1 1, ,
Cali Subroutlnc: Cali Subroutinc:SETVP6 SETUP~
y ~s
1
1
No
'11i
,Cali Subroutlne
PSURFACE
•
•Figure 5.10 Flowchart details for Step2 in e·z toots 3D
5-23

•
•
Chapter 5 Proposed Numerical Model for Destress Blasting
5.4.4 Element Calculation for Stiffness and Load Vector
The calculations of the stiffness matrix and load vector are carried on any single element
and setup the global stiffness matrix and load vector. Figure 5.10 shows the general
tlowchart of step 2 in e-z tools 3D. Subroutine IPESTF (refer [0 Figure 5.(1) gives the
element stiffness matrix for both isotropie and anisotropie materials. Inside the subroutine
IPESTF~ subroutine ANIDMAT, which is a routine to calculate the stress-strain
relationship matrix, and subroutine IPLQBJ, which is used to calculate the shape
function. strain-displacement relationship matrix and Jacobian matrix. are ealled. The
subroutine IPLOAO (refer to Figure 5.(2) calculates the load veetor due to gravity and
initial stresses. For the different equation solver the subroutine SETUP4 is used for the
Gauss Seidel and the subroutine SETUP6 is used for Gauss Elimination. If any of the
elements is subjected to the surface traction. the subroutine PSURFACE will be called to
calculate the load vector due to surface traction. Theses operation will be repeat until all
the clements have been calculated.
5-24

Chapler 5 Proposed Numerica/ Mode/for Deslress Blasling
• //
/
Input:~I~ml:nt conn~ClIVlly
nodal 'oordln;ll~s
Sumbl:r oi l:lsatlC conslanlsDl:SIr~ss (aclors
EI:l$llC conSlo1nl \'~clor
•
Ddln~ GJusslan IOI~grJtlon pOInls ln nJIUro1l.:oordlno1l~ Jnd W~lgtll Ïolclors
C.lII IPLl,JJJ ltl g<:l th<: 1J1:001.1n JnJ Ils J<:I'rman.1nl
'S<:l CIIJ:pLll.llll.~ll.l=p<:llJI J1.lc:U=PZl:IJI i; Il
1
1,CJII IPLQBB 10 gellhe Bm.llrt\
; sel CIL1=pC 1l~111."to1=p~llJI J1. leU: PUI;U k 1)
1
i,CJII ASIDMAT 10 gellhe eJ.1S11C mml\ lOI
1i1
•
,CJI! TR-\:'\S ttl ~el thl: tnt<:grJlIon lunLtlon
- ------------.••IIio-'..-------------,~ \"
SummJlhln JI Eksll\ Il.JJ l=d~Slilll.JJ I+KIII.J] 1
y~s
Yes
Y,s
•Figure 5.11 Flowchan for the element stiffness matrix calculation
5-25

Chapter 5 Proposed Numerical Modelfor Destress Blasting
•/
Input::lOdll ~onnl:'t1Vlly
nodl1 Œordum\tmml prOpWll:S /
1
i..,1,
D~iID~ lh~ pus5I1n Inlcgr1tlOn pOlnls' DllUrll 'oordlnll~
11,
CJII IPGRAV 10 gel lhe guvl!Y JOld "eelor 1I11~grallon iuncuon ud :h~
InIlIJI ilr~S5 Illld UClor Inl~grll1on fun'lIon~o
1,.ldd (he lnl~grmd iunc\lon lnto 10Jd ,'wor EFL
------~---.;~~~
y~s
y~s
•
for 8·node elementitp=2~
for 20·node elementitp=60
•Figure 5.12 Flowchart of element Ioad vector due to gravity and initial stresses
5-26

•Clzapter 5 Proposed Numerical Model for Deslress Blastiflg
5.4.5 Strain, Stresses and Energy Parameters
After solving the equation [Al (x} = (B}. a vector of unknowns is obtained. But they
need to be translated into the nodal point displacements. The subroutine NDISP is called
to implement this task. With the known nodal displacements, the strains distribution and
the stresses increments in the current mining sequence inside the elements can be
calculated on the designated integration points, which is carried out by calling subroutine
STRENG. Then subroutine ENGPRT is called to calculate the energy parameters ESR
and ERR and the total stress on the designated integration points (see Figure 5.13). If
there are sorne elernents belonging to the destressed zones. the subroutine UPDESR and
GETESR are called to calculate the energy parameters' changes which just follows the
detïnition shown in Figure 5.14 as for the possible changes in the destressed zone.
!....i.. ------« 1= I.MM ~i1
~Y~s--~
: Input E5R. ERR. lnd Initial Stresses!
Yes
----~_._-.
(JII SubrlluttneUPDESR
--:>---N 0 -----1
*! Set E5R and ERR lS O.
So
•
CalI SubroullneGETESR
Calculate [he total stressesfor [he element
i1
1•Figure 5.13 Flowchart for the stresses and energy parameters
5-27
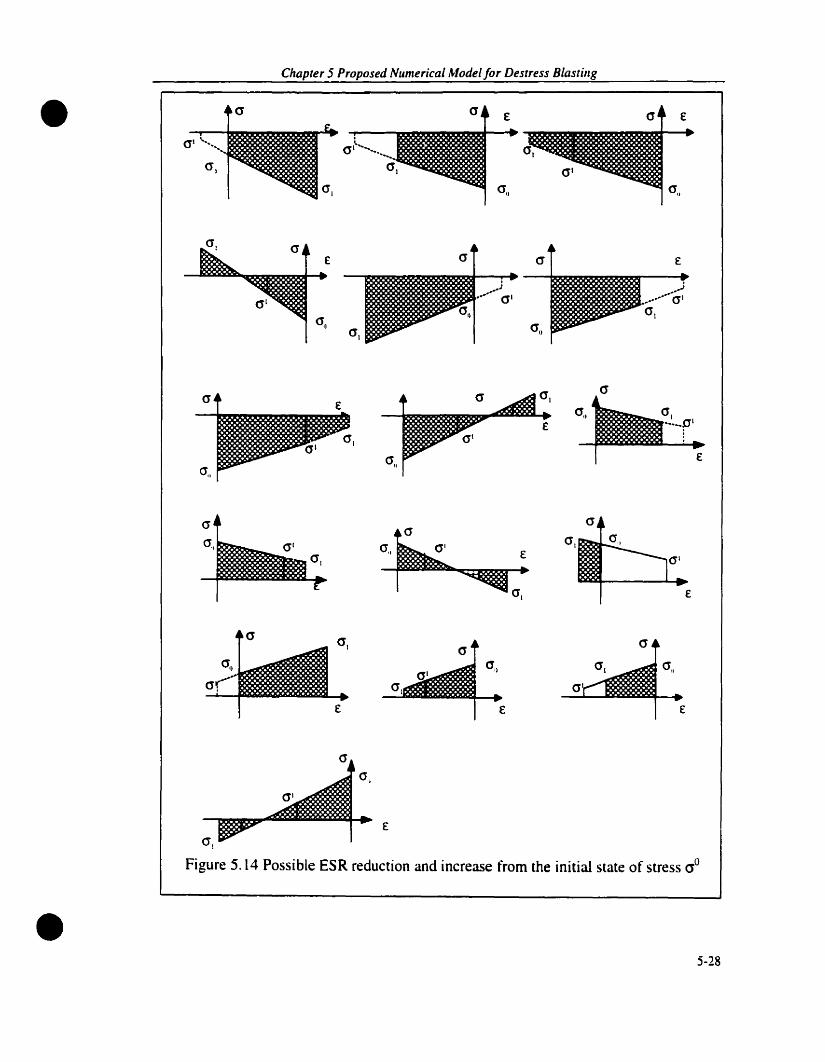
•Chapter 5 Proposed Numerical Model for Deslress Blaslillg
E
O'I ~
cr" 1 ~(jl
E
0"1
cr Ë
,~J ....,J..... a· ~.~ crI
ail 0'1<1,)
E
•Figure 5.14 Possible ESR reduction and increase from the initial state of stress aO
5-28

•Chapter 5 Proposed Numerical Mode1for Destress Blasting
5.5 ISOPARAMETRIC ELEMENT TEST
In this section, a test of the isoparametric element for e-z tools 3D is described. A fixed
end beam subjected to uniformly distributed load is compared with the analytical results.
The load is applied to the different directions to test the element isoparametric.
For a fixed-end beam subjected to uniform load over the entire span (Figure 5.15a), the
reactions yield:
q
MdC )M ba) :\ B
Rd ~ L { Rh
_1M,Cbl :\
~Rd f.. X ..1
Figure 5.15 Fixed-end beam with a uniform load
qL: LNt =M =- R =R =L" /, 12 .1 " 2 (5.48)
50 the bending moment at any point along the beam is detïned ao,; follows <Figure 5.15b):
•
1~f =R v-M --qv
". "2·
The differential equation of the detlection curve becomes
Elu" =-M =M +.!.qv: - R v" 2· ".
(5.49)
(5.50)
5-29

•Chaprer 5 Proposed Numerical Model for Desrress BJasring
After integration and applying the boundary condition (when y =0, v =0, and when y =L. v =0), this equation yields
qL1• qv.l qL
Elv=-v~+_·_--v324 . 24 12-
The normal stress in the beam are expressed as
1\1 . :(j ---\ 1
(5.51 )
(5.52)
•
in the above equations 1 =f.::dA is the moment of inertia of the cross-sectional area with
respect ta y axis. that is the neutral axis.
Mi!' Mb, M are the bending moments at end A. end B, and at any point,
Ra. Rb are the vertical reactions of the supports at end A and end B,
z is the vertical distance l'rom the axis of the beam ta the calculated point.
q is the uniform load acting on the beam.
L is the span of the beam.
u is the beam detlection.
Based on Equation 5.51 and 5.52. the deflection and normal stress along the beam are
plotted in Figure 5.17 and 5.18 with the data input as follows:
E =78 GPa, v = 0.15, L = 25m, b = lm, h = lm, y=O.028MN/m.3.
For the same problem, a file is prepared for e-z tools 3D as shawn in Figure 5.16) with
distributed load in z-direction. The model results of the vertical displacements and
normal stresses are plotted in Figure 5.17 and Figure 5.18 also. For the condition that
load is applied in the x direction. the results are presented in Figure 5.19 and Figure 5.20
respectively for displacement and normal stress which are plotted together with the
analyticaI resuIts. Comparison between the analytical and numerical model results under
different loading directions for the vertical displacements and the normal stresses show
excellent agreement.
5-30

•C/rapter 5 Proposed Nll1nerical Modelfor Destress B/astilIg
Figure 5.16 Finite e1ement mesh for the tested beam with 64 20-node elements
~ Analytical rcsuhs. O' Modelled rcsults
0.000
-~
-0.001
g~
~ -0.002ë..,.~:;.~ -0.003i:~
>-0.004
-0.005a 5 10 15 20 25
•
Horizontal distance (m)
Figure 5.17 Vertical displacement distribution along the tïxed-end bearn undera unifonn load
5-3l

Chapter 5 Proposed Numerical Model for Destress Blasting
~ Analytkal resultsO· e-z tools 3D results
• 4:;-c..~- 2
§,..
0-~
.J::;
:J-2oS-
.""-:J
·4...~
=;;·6i
-8
0 5 10 15 20 25
Horizontal distance (m)
Figure 5.18 Stress distribution along the fixed-end beam under a uniform load
-.- Analytical results.. -O· - Modelled results
0.000
-"- -0.001ë:J=;j:.J
-0.002=:ë..:!:~
.g -0.003ti>
-0.004
-0.005
a 5 la 15 20 25
•Horizontal distance (m)
Figure 5.19 Horizontal displacement distribution along the fixed-end beamunder a unifonn load applied in x direction
5-32

Chaprer 5 Proposed Numerical Mode1for Desrress Blasring
-e- Analytical results.. O' . e-z too/s 3D results
• 4
~~- 2---.E. 0--~
~
~
·2=.::1::1:~
-4..~
-a=S ·6i
-8
0 5 10 15 20 25
Horizontal distance (ml
Figure 5.10 Stress distribution along the tïxed-end beam under a uniform Ioadapplied in x direction
S.6 1\'IODEL FEATURES AND LIMITATIONS
S.6.1 Model Features
• 8-node or lO-node isoparametric brick elements
• 100.000 8-node elements or 15.000 2ü-node elements
• Up to 16 geomateriaIs
• Isotropie 1orthotropic materials
• Modelling of initial stresses. body forces and surface traction loarling
Computation of energy release and storage parameters (ERR. ESR)
Modelling of mining sequences (piecewise linear)•
•
• CaJculation of burst potential index (BPO
• Modelling of destress blasting• 5-33

•
•
Chaprer 5 Proposed NlImerica! Modelfor Desrress 81asting
• Modelling of ground support (backfill, props, cribs)
• Safety level calculation (Mohr-Coulumb, Hoek-Brown)
• Mesh generation and data visualization using HyperMesh®.
5.6.2 Model Limitations
• Number of elements handled is limited by the computer hardware (speed, memory
and hard disk storage)
• Static analysis only
• Linear elastic analysis only
• No time-dependent behaviour
5-34

•
•
CHAPTER6
MODEL VERIFICATION AND PARAMETRIC STUDY
6.1 INTRODUCTION
In this chapter, the verification and sensitivity analysis of the finite element model, e-z100& JD, developed by the autbor, are described. The model verification involves two
tests. For the model sensitivity analysis, four aspects are considered.
In the first verification test of the model, the modeUed stress results calculated around the
circular opening are compared with those obtained from the classical method with the
hydrostatic loading condition. The second verification a horizontal-to-vertical ratio k=O.
For the pararnetric study, a typical Canadian bard rock drift configuration is adopted.
First three destress blasting patterns are analyzed and compared. The destressing pattern
No. 2 is then chosen for subsequent, detailed pararnetric study on the destress model
parameters {a}, {J3}, the angle between major principal horizontal initial stress and the
development direction 9. A summary of the model parametric study and parametric
values is shown in Table 6.1 .

al .
Chapter 6 Madel Verification and Parametric Study
Table 6.1 Parametrie values for the model sensiuvltv an lVSlS
Purpose mode1 a ~ Pattern 9 kx ky
Study the effeet of the 1 0.4 0.4 1 90° 2.0 1.4different destress 2 0.4 0.4 2 90°blasting patterns
3 0.4 0.4 3 90°
Study the effeet of 4 0.05 0.4 2 90° 1.8 1.4
change of a 5 0.1 0.4 2 90°
6 0.15 0.4 2 90°
7 0.2 0.4 2 90°
8 0.4 0.4 2 90°
9 0.6 0.4 2 90°
10 0.8 0.4 2 90°
Study the effeet of Il 0.4 0.1 2 90° 1.8 1.4
change of ~ 12 0.4 0.2 2 90°
13 0.4 0.3 2 90°
14 0.4 0.5 2 90°15 0.4 0.8 2 90°16 0.4 1.0 , 90l)
Study the effect of 17 0.2 0.6 2 0° 1.8 lA
change of 8 18 0.2 0.6 2 30°
19 0.2 0.6 2 45°
20 0.2 0.6 2 60°
21 0.2 0.6 2 90°
•
6.2 MODEL VERIFICATION
•
One of the earliest analytical solutions for the two-dimensional distributions of stresses
around an opening in an elastic body was published in 1898 by Kirsch (Hoek & Brown,
(980) for the simplest cross-sectional shape, the circular hole. Jeager and Cook (1976)
fully discussed the Kirsch equations. as they are known torlay. The final equations
(Equation 6.1) presented using a system of polar coordinates in which the stresses are
defined in terms of the tractions acting on the faces of an element located by radius r and
a polar angle 4>. Although t·% tools 3D is a three-dimension model, the two-dimensional
6-2

•Chapter 6 Madel Verification and Parametric Study
analytical solutions cao still he used to verify the model when a circular drift is modelled
without considering the face affection which cao he approximated as plane strain state.
.-------K p
..._.._..-
K p
11 .. · ,
1 P , ·~
·· .+ + + + + ,
----., ...__._-------
-----., B
---------.
----.
._-----. .-------_._..-
p
Figure 6.1 Circular opening in a biaxial stress field
(6.1 )
•
where Or is the radial stress around the circular opening.
Ol is the tangential stress around the circular opening.
K is the horizontal [0 vertical stress ratio,
p is the vertical initial stress,
a is the radius of the circuIar opening,
6-3

•Chapter 6 Model Verification and Parametric Study
r is the distance from the calculated point to the centre of the opening,
<P' is the angle from the vertical radial direction c10ckwise to the calculated radial
direction.
252015
-.- Cfr analyticaJ
o. Q... Cft anaJytical
--.- Cfr e-z tools 3D
~.. - Cf e-z tools 3Dt
105
140
120
100
--0:: 80~
"J'."J'.~ 601--~
40
20
0
0
Distance from the boundary of the tunnel (m)
Figure 6.2 Tangential and radial stress distribution around the circular opening at(\> =90°. under hydrostatic pressure of 70 MPa
•
To compare with the model results. the analytical calculation points are coïncident with
the element integration points in the radial direction, but there is a slight difference in the
tangential direction as shows in. Figure 6.2 and 6.3 present the stresses distributions
along the radial line at ~ = 90° (vertical direction) and ~ = 0° (horizontal direction)
respectively with hydrostatic stress condition (K =1). And Figure 6.4 and 6.5 show the
stress distributions when K = O. The results near the opening boundary aJso are presented
in Table 6.2 for K =1 and Table 6.3 for K =O. These results show excellent agreement
between the analytical and e-z tools 3D solutions. When k =l, the difference between the
6-4

•
ChapMr 6Moœl Verification andPaI'amelric Shldy
Table 6.2 Peak stress comDarison ofcircular ooenina (K = l, a = 2.5m)
Calculate oJp oJpd position
(rIa)Analytical e-:too&JD Analytical e-:tooIs3D
Point A 1.0348 1.9338 1.9214 0.066 0.0848
Point B 1.0348 1.9338 1.9270 0.066 0.0854
stress concentration factors for tangential stress at point A is 0.0124, and at point B is
0.0068. For radial stress the difference at point A and B are 0.0188 and 0.0194
respectively. These ditTerences are mostly affected by the finite element mesh density.
Through the model verification, sorne basic conclusions on the tinite element model e-:'ools 3D cm be obtained. They are:
• The model is mathematically correct,
• Physically true, i.e., it retleets the elastic behaviour orthe structural materials.
Based on the two conclusions drawn above, the next important step is ta perform the
parametric study ta better understand the model response ta variation of input parameters.
Table 6.3 Peak stress comparison ofcircular opening (K =0, a =2.Sm)
Calculated aJp aJpposition
(rIa)Analytical e-:tools 3D Analytical e-: 'ools 3D
Point A 1.0348 2.7751 2.7215 0.0926 0.13574
Point B 1.0348 -0.8412 -0.8023 -0.0265 -0.OS071
6-5

Chapter 6 Model Verification and Parametric Study
• 25
-~c-1) --+- (JI analytical= 20a ···0··· (Jr analytical~
-5 -.- (Jl e·z tools 3D'-0
-:'J. .• (J e-z tools JD>. 15"- r::s~
§c
J:,
==10
~c0:..::~
§ 5-:;;C
a 20 40 60 80 100 120 140
•
Stress (MPa)
Figure 6.3 Tangential and radial stress distribution around a circular opening underhydrostatic pressure of 70 MPa at cp =0°
6-6
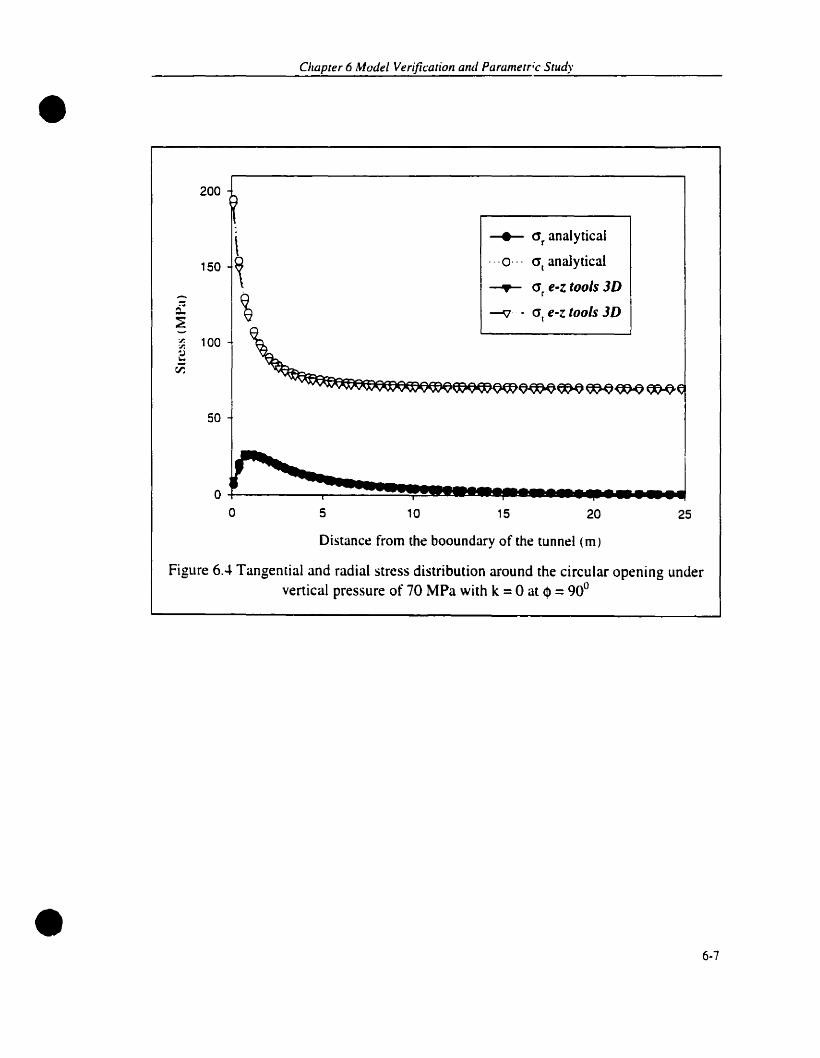
•CJrapter 6 Model Verification and Parametr'c Study
200
150
c:~
:r. 100:r.':,)'-~
50
___ (Jr analytical
... Q' .. (JI analytical
--.-- (Jr e-z tools 3D
~ - crI e-z tools 3D
252015105
oL--=~~!!!!!~IIHI..................Ja
Distance from the booundary of the tunnel (m)
Figure 6.4 Tangenlial and radial stress distribution around the circular opening undervertical pressure of 70 MPa with k =0 at cp =90°
• 6-7

•Chapter 6 Model Verification and Parametric Study
O~--u-~=-:.:.-=~----::~-__r_---.~---_r_---_r_---_r_--
25 ...------------------Illl'r------------.........,
-~c: -e-- (jr analytical-ü(jl analyticalc: 20 ··0···-.:: -.- (jr e-z tools 3D
~
'- -JV .- crt e-z tools 3Dc~ 15~~::0~
~ 10.c--§1-'-~u 5~:.r.
C
-60 -40 -20 o 20 40 60
Stress (MPa)
Figure 6.5 Tangential and radial stress distribution around the circular opening undervertical pressure of 70 MPa with k =0 at If) =0°
• 6-8

•
•
Chapter 6Moœ/ Verification andParame,,;c SlUdy
6.3 MODEL PARAMETRIC STUDY ON DESTRESS BLASTING PATl'ERNSFOR DRIFT DEVELOPMENT
6.3.1 ProblelD Definition
In this section, numerical model .: 'ools JD is applied ta the problem of drift
development at depth in hard rock mining; refer to Figure 5.2 and Figure 5.6. This
problem is commonly found in Canadian mines. The drift is 4.3m wide by 3.7m high and
is situated 2156m (7000 ft) below surface. A case study is carried out using different
destress blasting patterns for a given a and Ji. The finite element mesh is shown in Figure
6.13.
Referring to Figure 6.6, after the second face advance, the rests of the face advances are
just the repetition of the second face advance. So in the following parametric study, the
results will be ooly presented for the initial configuration and the situation after two face
advances.
The rock mass is assurned to be homogeneous, isotropie and linear elastic. The relevant
geomechanical parameters are:
Unit weight y = 0.028 MN/m3
Poisson's ratio v =0.15
Elastic modulus E =78 GPa
Uniaxial compression strength Oc= 180 MPa
Rock fragmentation factor a =0.4, 1.4
Stress dissipation factor ~ =0.6
The horizontal to venical in situ stress ratios are:
Kxx = 2 and Kyy = 1.4
The natural stress tenser al depth of2152m (7000 ft) is:
0°'1 = 120.52MPa

•Chapœ, 6 MotJ./ V"ijicalion llIfd P.amelrlc Study
OOx = 84.36MPa
0°z =60.26MPa (Vertical)
Three different destress blasting patterns have been seleeted for the simulation; they are
shown in Figure 6.7. The selection of such blasting patterns is based on the literature
survey of destress blasting praetice in hard rock mines (Chapter 3). The destress patterns
used are:
• AlI·perimeter destressing (pattern 1)
• Full·face-and-comer destressing (pattern 2)
• Wall -and-corner destressing (pattern 3)
350
-4- Initial configuration
300 .. 0 .. After the initial destress--..- After the filst face advance
.-.. -9 .. After the second face advanceco
! 250 ~ After the third face advance~ ." Aftcr the forth face advance
~ -+ "After the fi.fth face advanœ~
0~ 200 -<>- After the sixth face advance-~-;c..
'CS150"2
'Cc..~
0100';r
::E
50
015 10 5 0 ·5 ·10 -15 -20 -25 -3D -35 -40 -45
Distance from the initial drift face (m)Figure 6.6 The demonstration ofthe results repetition due to six face advances
• 6-10

Chapter 6 Model Verification and Paramerric Sllldy
• T
C+T C C
Panern # 1 S S S
C+BC C
B
C C C
FPattl:rn " 2 F
CC C
Panern # 3
c
s
C
c
S ---+-4
C
C
......-5
c
Side VICW Cross section Modded destressedzone
F=tJce S=slde \\t'ails T=root B=î1oor C=corner
Figure 6.7 Destress blasting patterns
6.3.2 Numerical Results
•
Modeling of the initial drift configuration (Figure S.2a) shows that the Burst Potential
Index (BPn is quite high, and can be as much as 174 % in the drift corners sorne distance
behind the drift face; see Figure 6.8. This suggests that destress blasting is required. The
computations were done for the four modeling sequences depicted in Figures 5.2a, 5.2b,
S.lc. 5.2d, i.e. before destressing, after destressing, and after one face advance. after two
face advances respectively.
6-11

•
•
Chapter 6 Model Verification and Parametric Study
The major principal stress contours in the drift face before and after destressing are
shawn in Figure 6.9a and 6.9b for blasting pattern 1. As can be seen, destressing has
caused stress reduction in the face. Also, it is observed that the maximum stress is found
in the drift corners. A comparison of the major principal stresses along the drift corners,
before and after destressing is shawn in Figure 6.10. Il is evident that the principal stress
drops significantly ahead of the face. Table 6.4 summarizes the results of maximum face
stresses for ail three patterns. It is found that the maximum face stress is nearly horizontal
and is reduced from 248.83 MPa to 153.21 MPa for blasting pattern 1, 156.29 ~IPa for
pattern 2, and 180.29 MPa for pattern 3.
Furthermore, it appears from the numerical modeling results that the maximum stress in
the drift is found along the corners behind the face. The major principal stress protiles
along the longitudinal axis of the drift are computed for the corner stress in the drift back.
both behind and ahead of the drift face. The results are shown in Figures 6.11 and 6.12.
As is evident from the results. blasting pattern 1 appears ta be more effective in tenns of
reducing the stresses ahead of the face.
Table 6.4 Maximum face stresses before and after destressing
Pattern Maximum face stress
Before (MPa) After (MPa)
Pattern 1 248.83 153.21
Pattern 2 248.83 156.29
Pattern 3 248.83 180.29
6-12

•Chapter 6 Model Verification and Parametric Study
160
120
80
~o
20 15 10
Distance: bc:hind the: face:
5 o
•
Figure 6.8 Burst potential index (BPI) behind the face-initial configuration
6-13

Chapter 6 Madel Verification and Parametr;c Study
240
220
1l240
220 ~"-200
160140
140
•
•Figure 6.9a Major principal stress distribution in the face before destressing
6-14

130
~11
430
)140
~140 140
A140
j.130l "'TV
120 ~" 130130 ~
\...120
110
80
Chapter 6 Model Verification and Paramerric Study
70
"-90
____----90
i--------8 l---~
•
•Figure 6.9b Major principal stress distribution in the face after destressing
6-15

Chaprer 6 Madel Verification and Paramerric Study
- Iwu.1 .:ualiVllnu"n-\na .kmeul na:
• ",1 l.~ III1III 1
1
1
l~1 i1
1
:~ll ~1
i
~,., 1
e-; ",JI "1a
1~
1- IIIlI~~.i~ 1",)
MIl
-Il ~
Distillee from the f3œ
o -~ -III ·zu
Figure 6.10 Major principal stress distribution for blasting pattern 1
- P~ttern 1Pattern :
-- P:mcrn3
~-·-=------1
'00 1~:o
:llO
.. :.10
~c-
~ :00~
t 100
1,- 1
L 1:0 ii1
so ~
J1
o .1:0 I~ 10
--,\\
~
·10 -IS
•Distance from the face
Figure 6.11 Major principal stress distribution after destress blastin~
6-16

Chapter 6 Model Verification and Parametric Study
-- Pattern 1P'.mern 1
-- Pauem 3
j\\\
~~
• .lOO
360
310 J
1!l0::=;c:: :"0
~ 100
1-~
160
~ii'~
110
!l0
"0
01
i
:0 15 10
v
o ·10 ·15 ·:0
•
OISlanl:e t'rom the face:
Figure 6.12 Major principal stress distribution after face advance
6-17

40m
z
~X Y
•
•
Chapte,. 6Madel Verification and Parametric Study
6.4 EFFEcr OF THE ROCK FRAGMENTATION FACTOR a
As destress blasting is aimed ta reduce the field stress around mining openings, lhis is
achieved by blast-Înduced fractures resulting in a release of strain energy in the fraetured
zone. The brittle to ductile transition is accomplished through fundamental changes in
both inelastic behaviour and failure mode. The micromechanical processes are extremely
complex, involving the interaction of a multiplicity of defects (e.g., microcracks, voids,
dislocations, and mechanical twins) (Evan, et al., 1990). Although one cannat expect any
theory to model exaetly the destress blasting mechanisms, there are al least some
empirical models that can approximate the process. The rock fragmentation factor {a} is
one of them abstracted tram our current understanding to the destress blasting. In this
section the effect of the various values of {a} is presented using the same drift problem
described in section 6.3. Due to the symmetry of the problem, half of the opening is
40m ~om~
~23.6mFigure 6.13 Finite element mesh for the parametric study
6-18
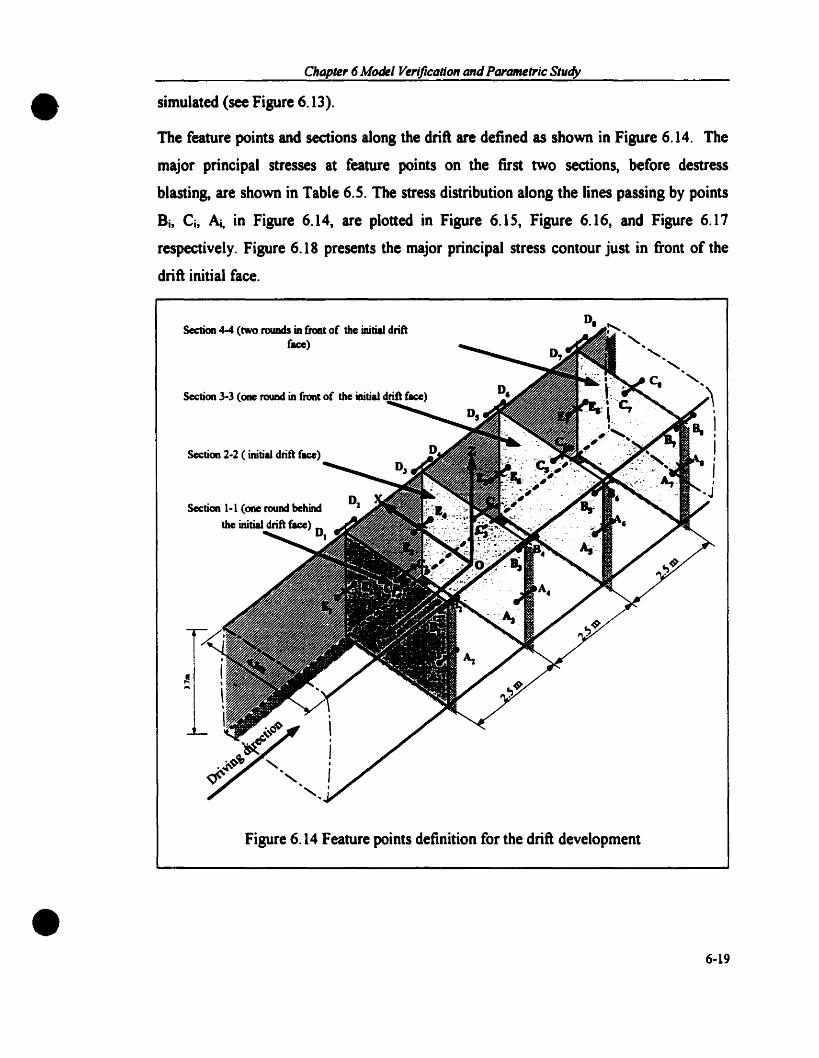
•
•
Chapter 6 Model Verification andPtII'amelric SlIIdy
simulated (see Figure 6.13).
The feature points and seàions along the drift are defined as shown in Figure 6.14. The
major principal stresses at feature points on the first two sections, before destress
blasting, are shown in Table 6.5. The stress distribution along the lines passing by points
Bi, Ci, Aï. in Figure 6.14, are plotted in Figure 6.15, Figure 6.16, and Figure 6.17
respectively. Figure 6.18 presents the major principal stress contour just in front of the
drift initial face.
Section 4-4 (IWo rounds in front of the initial driftface)
Section 1-1 (one round behind
the initial drift face) 01
Figure 6.14 Feature points definition for the drift development
6-19
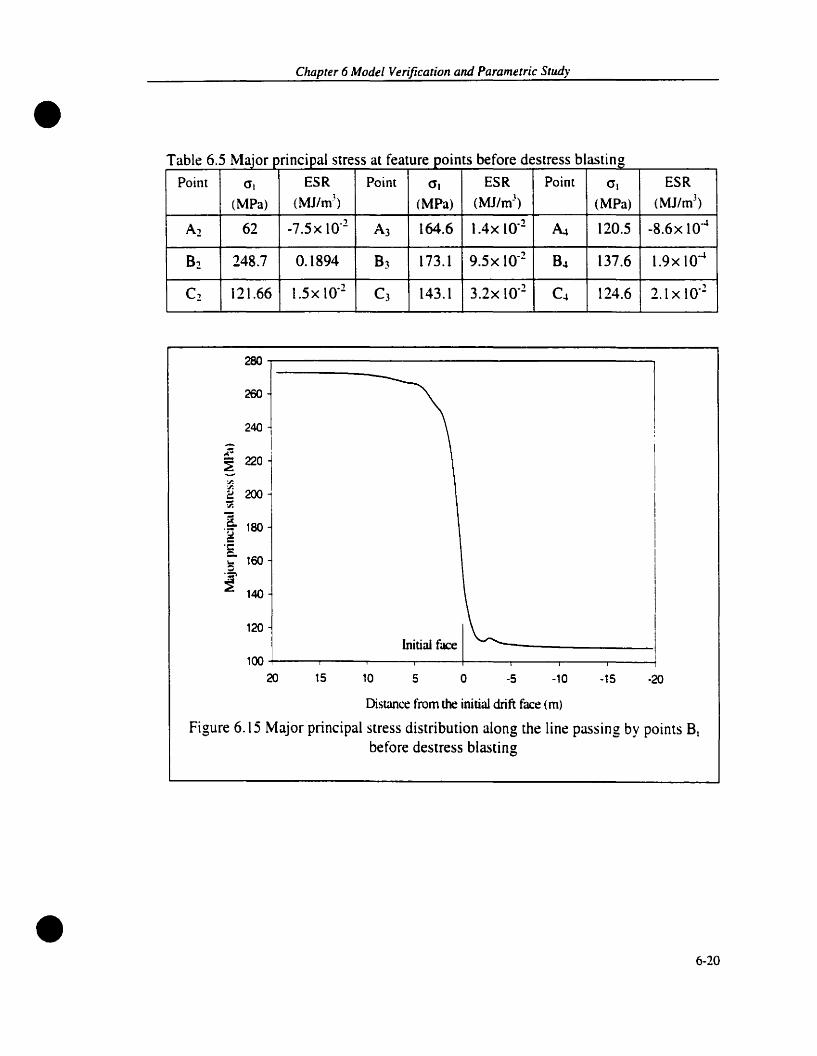
•Chapter 6 Model Verification and Parametric Sludy
blb ~ d. 1T bl 6 - ~I .a e .':' aJor pnnclpa stress at eature pomts e ore estress astlng
Point (JI E5R Point <1, E5R Point <1, E5R
(MPa) (Ml/m3) CMPa) (Ml/m) (MPa) (Ml/m3
)
A2 62 -7.5x 10⁻²A3 164.6 1.4x 10.2 ~ 120.5 -S.6x 10-l
82 248.7 0.1894 B3 173.1 9.5x 10.2 B4 137.6 1.9xl0-l
Cl 121.66 1.5 x 10.2 C3 143.1 3.2x 10.2 C4 124.6 2.1 X 10.2
280
260
240
,.(...
~1~-:r.:r.~ 200~
a 180.~
·2c.
160...~
~ 140
120Initial face
10020 15 10 5 0 -5 -'0 ·15 -20
Distance from the initial drift face (m)
Figure 6.15 Major principal stress distribution along the fine passing by points Bibefore destress blasting
• 6-20

•Chapter 6 Madel Verification and Parametric Study
150
145
140
l 135~a~ 130~
â. 1250goc::c.
120...."="
115 1~
Initi~ drili f~110 1
tOJ20 15 10 5 0 ·5 -10 -15 -20
Distance from the initial drift face (m)
Figure 6.16 Major principal stress distribution along the line passing by points Clbefore destress blasting
1~ ]
1601
1- 140 1
c:~-"J'.
"J'. 120oS"J'.
2."tj 100°2c..~
~
80.:'1
~
60
Initial drift face40
20 15 10 5 0 -5 -10 -15
•Distance from the initial drift face (m)
Figure 6.17 Major principal distribution along the line passing by points Al beforedestress blasting
6-21

Chapter 6 Model Verification and Parametric Study
140/120 140
160===------------------:::::==---,
120 140
r----140~
u~
=.~ 1,..
- 3=
•
·2
o 160==-------...,...------------::::::--or---l
o
DIstance: irom th~ center oi the: dnft lm 1
Figure 6.18 Major principal stress contours just in front of the drift initial face beforedestress blasting
300 -r----------------------------.,
250
-~~- 200:.r.
:or. ~ a=O.OSë~ O' a=O.lâ
~ a=O.2'u'C 150 -ç a=OAc.. -...0 -. a=O.5~ -G- a=O.6
100 -. - a=O.8
--<>- a=l.
-20-10-5o51015
5O+----r----,...-----r-----r----.....-----r-----r------1
20
•Distance from the drift face (m)
Figure 6.19 Variation of the major principal stress along the line passing by points Biwith a
6-22

Chapeer 6 Model Verification and Parametric Study
-+- a=O.OS---o' 0 a=O.l
---.- a=O.2--v. - a =0.4
~ a=O.5-0- a=0.6
-.- a=0.8
-<>- Ct= 1.0
• 135
130
~125
~- 120~
~
M:Il
"'3 115c..~
::'1: 110c.~.~
~
~ 105
100
9520 15 la 5 o ·5 -la -15 -20
•
Distance from the drift face (m)
Figure 6.20Variation of the major principal stress along the line passing by points CIwith ct
10011
140 i ~ a=O.OS·0 a=O.1
120 j --.- a=O.:!....-V0 - a=O,~
~- -. a=O.5'r.~
1~
,~.- a=O.6...~
100 l 1~- a=O.82- 1.~ 1-0- a=1."§.~
80'::'1
~
60
40J20 15 la 5 a ·5 ·10 ·15 -20
Distance from the drift face (m)
Figure 6.21 Variation of the major principal stress along the line passing by points AIwith a
6-23
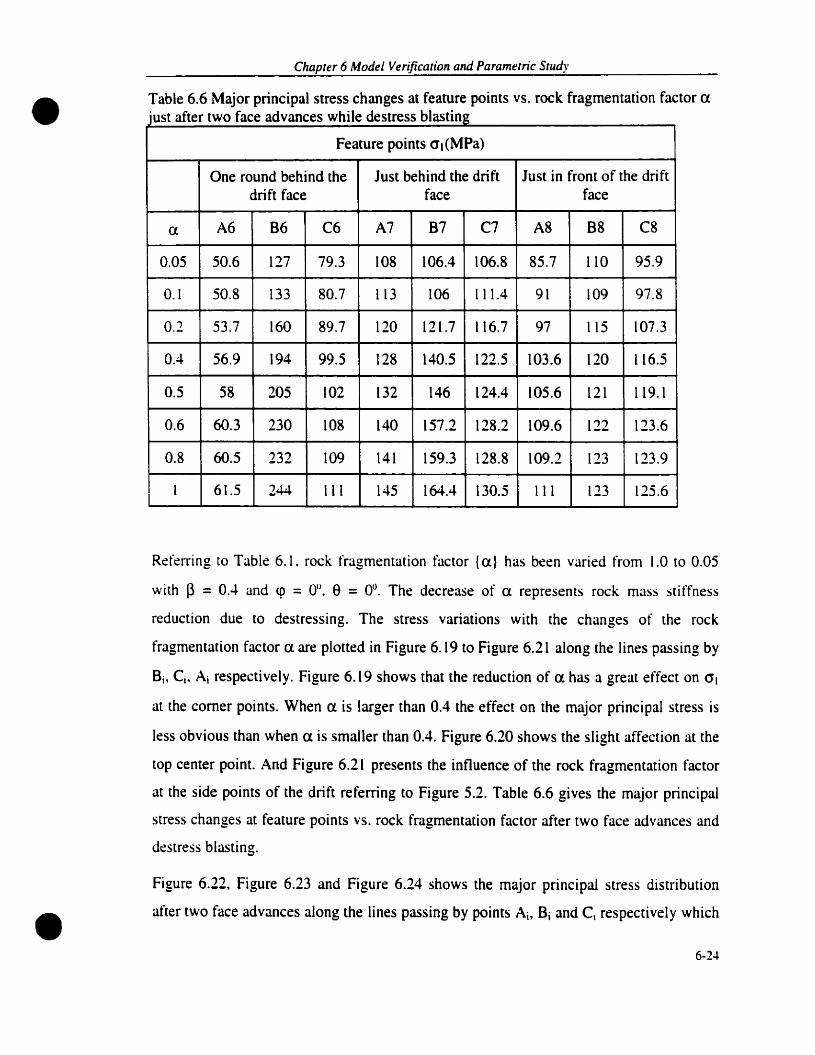
Chapter 6 Madel Verification and Parametric Study
Table 6.6 Major principal stress changes at feature points vs. rock fragmentation factor ex.. f f: d h'l d bl'Just a ter two ace avances W 1 e estress astlng
Feature points (JI (MPa)
One round behind the Just behind the drift Just in front of the driftdrift face face face
a A6 86 C6 A7 B7 C7 A8 B8 C8
0.05 50.6 127 79.3 108 106.4 106.8 85.7 110 95.9
0.1 50.8 133 80.7 113 106 111.4 91 109 97.8
0.2 53.7 160 89.7 120 121.7 116.7 97 115 107.3
0.4 56.9 194 99.5 128 140.5 122.5 103.6 120 116.5
0.5 58 205 102 132 146 124.4 105.6 121 119.1
0.6 60.3 230 108 140 157.2 128.2 109.6 122 123.6
0.8 60.5 232 109 141 159.3 128.8 109.2 123 123.9
1 61.5 244 111 145 164.4 130.5 111 123 125.6
•
Referring to Table 6.1. rock fragmentation factor {a} has been varied l'rom 1.0 to 0.05
with ~ = 0.4 and <p = Ou. e =0°. The decrease of a represents rock mass stiffness
reduction due to destressing. The stress variations with the changes of the rock
fragmentation factor a are plotted in Figure 6.19 to Figure 6.21 aJong the lines passing by
Bi, Ci. Ai respectively. Figure 6.19 shows that the reduction of ex. has a great effect on (JI
at the corner points. When ex. is larger than 0.4 the effect on the major principal stress is
less obvious than when ex. is smaller than 0.4. Figure 6.20 shows the slight affection at the
top center point. And Figure 6.21 presents the influence of the rock fragmentation factor
at the side points of the drift referring to Figure 5.2. Table 6.6 gives the major principal
stress changes at feature points vs. rock fragmentation factor after two face advances and
destress blasting.
•Figure 6.22, Figure 6.23 and Figure 6.24 shows the major principal stress distribution
after two face advances along the lines passing by points Ai, Bi and Ci respectively which
6-24

•
•
Chapter 6 Model Verification andPtuanretric SlUdy
show the decrease of the principal stress behind the drift face. However, on section 4-4,
the variation of the rock fragmentation factor a has much more influence on the major
principal stress at the top and side than at the corner. This can also be seen from Figure
6.19 to Figure 6.24 that the major principal stress has a downward trend with the decrease
ofŒ. Comparing Figure 6.18 and Figure 6.25, a substantial reduetion is seen in the major
principal stress in front ofthe drif~ face after destressing.
6-25

•Chapter 6 Model Verification and Parametric Study
160
.....- a=0.05140 ·0··· a=O.1
'2 -..- a=0.2c..:E 120 -v... a=0.4-:r. --. a=0.5:r.':J= ~.- a=0.6:r.:; 100 -.- a=0.8.S-! --0- a =1.0.~
~
: 80.~
~
60
4025 20 15 10 5 0 ·5 ·10 ·15
Distance from the driti face (m)Figure 6.22 Variation of the major principal stress along the line passing by points
At with a after two face advances
-+- a=0.05. O· a. = 0.1
-..- 0.=0.2-v... a. =DA
--- a. =0.5-0.- a = 0.6
---. - a. = 0.8
-<>- a. = l.
400
350
-.."" 300-~
..,.."J'.':J 250...~
a..~
200=.~
...0.~ 150:0:
~
100
5025 20 15 10 5 o ·5 -10 -15
•Distance from the drift face (m)
Figure 6.23 Variation of the major principal stress along the line passing by pointsBi with a after two face advances
6-26

Chapeer 6 Model Verification and Parametric Study
----e- a =0.05. 0 a =0.1
-.- a=0.2---v - a =0..+~ a=0.5~.- a=0.6
--. - a=0.8-0- a= 1.0
• 140
130
-~c.. 120~
'J:'J:':J 1101-
~
ë...~
100=occ..1.00.~ 90~
~
80
7025 20 15 10 5 o ·5 -15
Distance from the drift face (m)
Figure 6.24 Variation of the major principal stress along the line passing by pointsCI with a after (WO face advances
100
100
·1
\ i
--;~!o T(:t1 I.oc
120110 Il1
1160
ao 120\0&0 \i, \ \
80 100 \
o
•D,stan!,;r: from lhr: .;r:nlr:r orthe: dnft Iml
Figure 6.25 Major principal stress contour just in front of the drift face after twoface advances
6-27
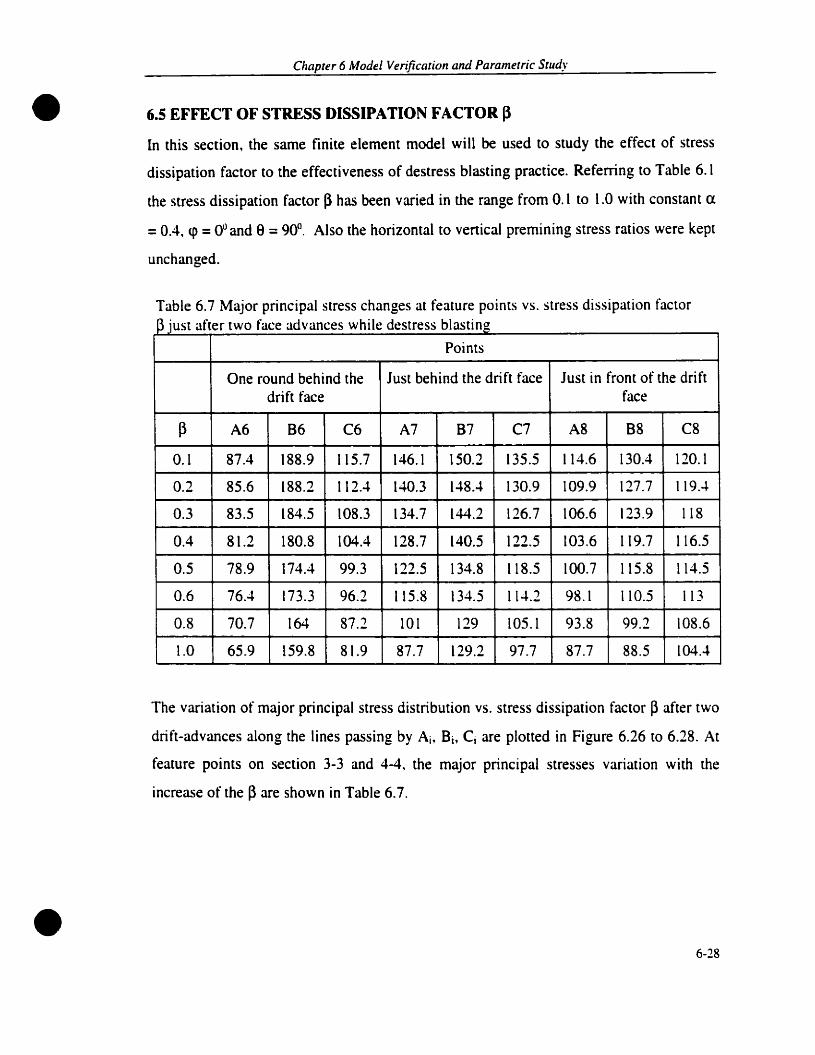
•
•
Chapter 6 Model Verification and Parametric Study
6.5 EFFECT OF STRESS DISSIPATION FACTOR 13
In this section, the same finite element model will he used to study the effect of stress
dissipation factor to the effectiveness of destress blasting practice. Referring to Table 6.1
the stress dissipation factor ~ has been varied in the range From 0.1 to 1.0 with constant Ct
=0.4, <p =0° and 8 =90°. Also the horizontal to vertical premining stress ratios were kept
unchanged.
Table 6.7 Major principal stress changes at feature points vs. stress dissipation factor~ just after two face advances while destress blasting
Points
One round behind the Just behind the drift face Just in front of the driftdrift face face
~ A6 B6 C6 A7 B7 C7 A8 B8 C8
0.1 87.4 188.9 115.7 146.1 150.2 135.5 114.6 130.4 120.1
0.2 85.6 188.2 112.4 140.3 148.4 130.9 109.9 127.7 119.4
0.3 83.5 184.5 108.3 134.7 144.2 126.7 106.6 123.9 118
0.4 81.2 180.8 104.4 128.7 140.5 122.5 103.6 119.7 116.5
0.5 78.9 174.4 99.3 122.5 134.8 118.5 100.7 115.8 114.5
0.6 76.4 173.3 96.2 115.8 134.5 114.2 98.1 110.5 113
0.8 70.7 164 87.2 101 129 105.1 93.8 99.2 108.6
1.0 65.9 159.8 81.9 87.7 129.2 97.7 87.7 88.5 104.4
The variation of major principal stress distribution vs. stress dissipation factor ~ after two
drift-advances along the lines passing by Ai, Bi, Ci are plotted in Figure 6.26 to 6.28. At
feature points on section 3-3 and 4-4, the major principal stresses variation with the
increase of the ~ are shown in Table 6.7.
6-28

•Chapter 6 Madel Verification and Paramerric Study
Referring to Table 6.7. the major principal stress at the feature points on the section 3-3
and section 4-4 have the same trends. and they decrease with the increase of stress
dissipation factor ~. Figure 6.26, 6.27, and 6.28 show that the value of ~ has a larger
effect on the major principal stress along the corner of the drift when it is larger than 0.4
than when it is less than 0.4. From the major principal stress distribution along the chosen
lin~s, the numerical results show that the stress dissipation factor ~ has the same
important role to the evaluation of the effectiveness of destress blasting as the rock
fragmentation factor o.. does. Figure 6.29 shows clearly that the stress at three feature
points 86, B7. 88 are decrease with the increase of ~.
160
--+- ~ =0.1140 --0-- ~ =0.2- ~ =0.3ci: -.-
~ 120 ~._. ~=0.4
'J':~ ~ =0.5'J':
u...~ =0.6~ ~.-
8- 100 --. - ~ =0.8'~
-0- ~ =1.0='i:Co.
~ 80.~
~
60
-15-la-5a5la1520
40 +----r----,-----,-----,-----~--r___--r__-____l25
•
Distance from the drift face (m)
Figure 6.26 Variation of the major principal stress along the line passing by points Aiwith ~ after two face advances
6-29

Chapter 6 Madel Verification and Paramerric Sludy
400
350
-;- 300Q.,
:E-"" 250""~-7i: ~ ~=0.8::; 200c. Q.. ~ = 0.2 .:~ -..- ~ =0.3 1~ 150
-ç.. ~ = 0.4 1::.!-a
~ ~ =0.5~ 100 1-0 - Il =0.6
50---. - ~ = 0.8
~ ~= l.0
025 20 15 10 5 a ·5 -10 ·15
•
Distance tram (he drift face (m)
Figure 6.27 Variation of the major principal stress along the line passing by points B,with ~ two face advances
140
130
~ 120
.", ~~=O.l.,..:J 110 0 .. ~=O.2...~
c. -.- ~ =0.3'g 100 ~.• ~=0.4'C
41- ~=O.5c..: ~.- ~=O.6.~
90~ --. - ~=O.8
-0- ~= 1.080
7025 20 15 la 5 0 ·5 ·10 -15
Distance from the drift face (m)
•Figure 6.28 Variation of the major principal stress along the line passing by points CI
with B after two face advances
6-30

Chapter 6 Model Verification and Paramerric Swdy
• ~oo
180
l! 160
VIVI~...;::; lolOCo'~
c::'i:Co
~ 110.~
~
100
O,···. O,·····0· ..
'0 .."'0· ·····0 ...
I.U0.9O.S0.70.60.5OA0.30.10.1
so +----,---~---r---,._-~--r___-__r_--r___- ......-__1
0.0
Stess dissipation factor ~
Figure 6.29 Effect of ~ on stress reduction in the drift corner after two face advances
• 6-31

•Chapter 6 Madel Verification and Parametric Study
6.6 EFFECT OF THE ORIENTATION OF THE DRIFfAXIS W1TH RESPECTTO THE MAJOR PRINCIPAL IN SITU STRESS
In the previous analyses, the major horizontal in situ stress was assumed to be in a
direction perpendicular to the drift longitudinal axis, i.e. in the x-direction. This is not
always the case in practice, whereby access ramps, drifts and cross cuts may be driven in
different directions thus making an angle with the major horizontal principal in situ
stress, a,. In this section, the effect of the orientation of the drift axis with respect to a, is
examined. For this purpose, the angle a is defined as the clockwise angle between the
drift longitudinal axis (y-axis) and the major horizontal in situ stress al in its local
coordinates (x'); refer to Figure 6.30. Accordingly, the previous analyses were conducted
for e= 90°. In this section, the values of 0°, 30°,45°, 60° and 90° will be analysed.
Right corn~r
Ldt ..:orn~r
ey
............---_.....__.......------------..-*"
Figure 6.30 Definition of the angle e in the drift plan view
•
The problem analysed is the same as before, i.e. the same geometric properties of the
drift, and the same material properties are adopted. Due to the unsymmetrical loading
condition from in situ stresses on the drift in this case. a new finite element mesh of the
entire drift has been constructed. In previous analyses, only half of the drift needed to be
modelied due to symmetry.
6-32

•
•
Chapter 6Mocal Verification and Parametric Shldy
Modulus ofelasticity
Poisson's ratio
Unit weight ofthe rock mass
Depth below surface
Horizontal-ta-vertical ratio, I(x'
Horizontal-ta-vertical ratio, Ky'
A total of five models were construeted for 9 = 0,30, 45, 60, and 90 degrees. For each
model, four mining sequences were simulated, as depieted in Figure 5.2. As mentioned
earlier, the comparison of results is made between the first (initial) sequence before
destress blasting and the fourth sequence, representing the conditions after twO face
advances. The numerical results are presented in terms of displacements and stresses.
With reference ta displacements, two quantities, Floor..to-roof convergence, Horizontal
wall closure, have been defined as shawn in Figure 6.31.
ConvergeN;e - vi+v2 ! Closure=ul+02
~._--.~_ _--------t\ ---------1r"-;--_. !
1 11 11 11 t, 1
l '. ,, U 1
~ U2 1 :~ 4 1
--.... 1 ~:1 1
1 •t ,1 \1 11 1, ,1 11 1, 1
l-----..----·-·--~~--------------~~~
Figure 6.31 Definition ofthe drift deformation
6..33

•Chapter 6 Model Verification and Parametric Study
The stress results are presented in a similar fashion to previous analyses, at the selected
locations, A, B and C as per Figure 6.14.
Figure 6.32 to 6.33 respectively show the vertical and horizontal deformation of the drift
with the variation of the angle ebefore destress blasting and after two face advances one
round behind the drift face. The variation of e from 00 to 900 has resulted in the decrease
of the horizontal closure and almost no change of vertical convergence. Figure 6.34 and
Figure 6.38 show the major principal stress distribution along the two top corners, the
roof centre and two side-centres of the drift respectively. Figure 6.39 to Figure 6.43
present the major principal stress distribution after two face advances while destressing
with the various angle 8.
6-r---------------------------,___ Before destressing. 0 . After two face advances while destressing
=- 5---- () .
oO,
'··0'0~:",c~:.lJ...~
~
W 4r----....=---....-.----..----j- --
9075604530153+----r-----r---~----..,.----__r_--~
o
Angle e
Figure 6.32 Vertical convergence one round behind the face before destress and aftertwo face advances
• 6-3~

•Chapter 6 Madel Verification and Paramelric Sludy
10...--------------------------,
~ Before deSlressing9 ·0· . Aflerlwo face advances while destressing
a8
-~~
:=~
7G
6
cr
90756030155+----.,-----,r------'T-----r---"""T"""---1
o 45
Angle e
Figure 6.33 Horizontal closure one round behind the face before destress and al'tertwo face advances
-12 -16 -20 -24-8
~ 8=90°
O' a= 60°-.- a=45°
~ a= 30°___ 8=0°
-4o
240
220o 00 0 00- 0 00- 0
- 00:0: 200 ...."' ...................~Co.~ . v<rV-'V"'/' .........,,1H1- ""\~." 180 .........~ .......,.'U...~ \'-;; 160 'Xc.~
c.t:;
140c.~.~
~ 120
100
8020 16 12 8 4
•Distance from the drift face (m)
Figure 6.34 Variation of major principal stress distribution vs. strike angle ealongthe right corner of the drift
6-35

Chapter 6 Model Verification and Parametric StLldy
100
240
-.- 6=900220
'0'00-0-00-0'00'0
.-"....~·oo. ·0· a= 60°-;- 200 ~.
-9- 9 = 45°c.. ·V'9-V~·~ ~::E v~· ~ 9= 30°-"Il 180 .........~.~ -. 9=00"Il~
\...~
::; 160Co.~
='i: 140Co::.~
:':
::E 120
•
·8 ·12 -16 -20 -24·4o4812
80 +--""T"""'---r--____r-~-----,r----r---.,....._-.,.....-__r_-_..,_-__t
20 16
Distance from the drift face (m)
Figure 6.35 Variation of major principal stress distribution vs. strike angle 8 alongthe left corner of the drift
o481216
9O+----r--~-~-----,r---.-----.---__r_-____r-____r--..._____1
20
•Distance from the drift face (m)
Figure 6.36 Variation of major principal stress distribution vs. strike angle 8 alongthe roof centre of the drift
6-36

Chapter 6 Model Verification and Parametric Study
• 180
160
-~C. 140~
:.r.:.r.':.)
120...Z:;Co.~
100cocCo
=.~ 80~
~
60
--- 9=90°"O' 9 = 60°
-.- 9 =45°
-? 9 =300
___ 9 = 00
..............................';.W-"'~.~~.~~.:
.................-..................,:
·0- 00 -0 -00-0 -0 0··0'00
·4o481216
40 +-----r-----r-_,---r---~-___r-_,r__-_r__-_r_-__r-__t
20
Distance from the drift face (m)
Figure 6.37 Variation of major principal stress distribution vs. strike angle ealongthe left-side centre of the drift
180 ,.....---------------------------,
160
~
c... 140~-:;Co
.~ 100'i:Co
~~ 80
60
---+- 9 = 90°
O' 9 =60°
-.- 9 = 45°
-ç- 9 =30°___ 6 = 00
-8 -12 -16 -20 -24-4o48121640 -+----r------r-----,,.....---r-----r-----r--.....--~-_._-__._----I
20
•Distance from the drift face (m)
Figure 6.38 Variation of major principal stress distribution vs. strike angle 9 alongthe right-side centre of the drift
6-37

•Chapter 6 Madel Verification and Parametric Study
300
250
-::Q..::;
200-:r.:r.~'-~
::; 150.5o
-.... 6=90°~
c.;:·0 6=60°Co
=100 -.- 6=45°'-'
~ -Ii}- 6= 30°
50 ~9=00
a28 24 20 16 12 8 4 0 ·4 ·8 ·12 -16
Distance from the drift face (m)
Figure 6.39 Variation of major principal stress distribution vs. strike angle ealong theright corner of the drift after two drift face advance
300
250
~~ 200:r.:r.~'-7:
.è- 150e=90°:..1
-....c
9 = 60°oc ·0·Co
-.- 6 =45°:: 100.~:: -va 9= 30°~
50~9=OO
-12 -16-8-4o4812162024O+--~---"--r---"'--~--r---'r---~---r---r----l
28
Distance from the drift face (m)
Figure 6.40 Vmation of major principal stress distribution vs. strike angle 8 along theright corner of the drift after two drift face advance• 6-38

160 -r-------------------;::=========J
ClJapter 6 Model Verification and Parametric Study
•140-=0:
C.~:1:
~ 120;:
80
-.- 8=90°
"O, e= 60°
-.- e= 45°-ça e=30°
~e=oo
-4a48
60 +---r----......--.,....----r--r---,--,.---.,..--...,...----r---i
28 24 20 16 12
Distance from the drift face (m)
Figure 6.41 Variation of major principal stress distribution vs. strike angle ealong theroof centre of the drift after two drift face advance
·8 ·12 ·16o4816 12
40 +---r---"""T"""---r----r-----r---r---,--,--.,..--.....-~
28 24 20
140
~120
:1::1:':J"-~ 100:;c.
-Gc::-cc. 80::
.::;,=0:
~
60
Distance l'rom the drift face (m)
•Figure 6.42 Variation of major principal stress distribution vs. strike angle ealong the
right side centre of the drift after two drift face advance
6-39

•Cilaprer 6 Madel Verificarion and Parametric Study
160 _r__---------------------------,
140-lf~ 120-:1':1:
~:1'
l 100uc
'Cc."- 800.~
~
~
60
-e- 9=900
--0- 9=60°
-.- 9 =450
~ 9=30°
-'-9=0° jl.: O'
.......~ ..... la'yr:
-12 -16-8-4o48121624 20
40 4--........-----r-----.....---r----r-----r--I""""""""-~-~-___r-__t
28
Distance from the drift face (m)
Figure 6.43 Variation of major principal stress distribution vs. strike angle 9 alongthe left side centre of the drift after two drift face advance
From Figure 6.44 to 6.49. the major principal stress contour in front of the initial drift
face and in front the drift face after two face advances are presented in pairs with the
change of angle 9 of 0, 45 and 90 degrees. The major principal stress values on the
feature points are collected in Table 6.8 and Table 6.9. Figure 6.50 and Figure 6.51
present the major principal stress changes at the feature points one round behind the drift
face before destressing and after two face advances while destressing.
• 6-40

•
•
Chapter 6 Madel Verification and Parametric Study
Honzontall.:oordinatc: lm)
Figure 6.44 Major principal stress contour in front of the initial drift face beforedestressing for e=0°
Honzonul coordinatc: (ml
Figure 6.45 Major principal stress contour in front of the drift face after two faceadvances while destressing for e=0°
6-41

•C/zapter 6 Madel Verification and Parametric Sludy
24 23 22
Hunzonlal coordinat!: 1m1
21 20
Figure 6.46 Major principal stress contour in front of the initial drift face beforedestressing for 9 = 45°
24 23 22
HonzontaJ coordinat!: lml
21 20
•Figure 6.47 Major principal stress contour in front of the drift face after two face
advances while destressing for 9 = 45°
6-42

•Chapter 6 Model Verification and Parametric Stlldy
24 23 22
HonZOnlall:oordinalt: lm)
21 20
•
Figure 6.48 Major principal stress contour in front of the initial drift face beforedestressing for e=90°
HUnlOnlaJ I:Oordlllale 1 ml
Figure 6.49 Major principal stress contour in front of the drift face after two faceadvances while destressing for e=90°
6-43

Chapter 6 Madel Verification and Parametric Study
_ .. _ .. --0
....0 ..--
.._-0-,_,._0'
.. --.._ .. _0'_"0"'"'"
l>--'-"~ Point A:
1
a PoimB"
-9- Point C;:_----011-..--- Point D"--- -r-_....lp...--------..... - ~ Point E:u . --~
~ - .,,,
• 240
220
200:;-c. 180~
:r.cr. 160:J..~
ë.. 140
:~ 120~
?; 100.=:0:
~80
60
40o 15 30 45 60 75 90
Angle a
Figure 6.50 Major principal stress al the fealure points one round behind the driftface before destressing
Ba604020
-_.~)_..- ..__-0-- r-'-----.....,...,...--
..A·· ~ PointA"....",...
.--,,~"o Point B"-" __ " /'0
--::::-:.:.. -.- Point Ch-----.... _ -va Point Dh..............~ ~ Point Eh......
.......- .....-------~,
130
120
:; 110c.~:r. 100:r.~...~
:; 90c..~
'C 80c.
.~~
~ 70
60
50a
•
AngleS
Figure 6.51 Major principal stress at the feature points one round behind the driftface after two face advances while destressing
6-44

•Chaprer 6 Model Verificarion and Parametric Study
Table 6.8 Major principal stress changes vs. angle 8 on the~ . beC< d bl'eature pomts ore estress astmg
Angle 8 One round behind the drift face
A2 82 C2 02 E2
90 64.0192 215.226 129.996 215.242 64.0125
60 71.6225 206.615 123.729 207.211 73.3625
45 79.9263 197.639 117.48 198.329 82.0007
30 88.5118 187.763 111.251 188.35 90.3541
0 97.8979 176.198 105.134 176.212 97.8951
Just behind the drift face
A3 B3 C3 D3 E3
90 134.98 157.773 130.802 157.745 134.939
60 125.207 146.405 137.929 160.619 153.697
45 128.366 139.076 143.362 158,43 160.694
30 136.351 131.768 148.233 154.115 163.785
0 155.888 140.751 152.951 140.724 155.87
Just in front of the drift face
A4 84 C4 D4 E4
90 106.838 130.104 122.907 130.1 106.819
60 96.4649 119.862 117.686 131.819 115.359
45 95.2632 112.924 113.254 129.726 117.449
30 98.7059 106.081 109.656 126.242 117.676
0 111.004 116.158 108.223 116.168 111.002
• 6-45

Chapter 6 Model Verification and Parametric Study
Table 6.9 Major principal stress changes vs. angle 9 on thef . af f deature pomts ter two ace avances
One round behind the drift face
A6 B6 C6 D6 E6
90 54.4011 120.141 78.0118 120.102 54.4156
60 62.5696 115.288 80.1867 115.559 64.7327
45 71.6301 110.161 86.3311 110.582 74.1978
30 81.0522 104.574 92.467 105.048 83.3217
0 91.4626 98.4311 99.3363 98.3939 91.4673
Just behind the drift face
A7 B7 C7 D7 E7
90 99.5896 93.6442 99.4673 93.6248 99.6143
60 95.5981 89.5663 111.746 90.3537 117.187
45 101.394 85.3992 118.97 86.4756 125.915
30 110.793 80.7415 125.212 81.9019 131.668
0 129.003 75.2914 130.234 75.2702 129.007
Just in front of the drift face
A8 B8 C8 08 E8
90 85.5568 86.7071 89.4832 86.6883 85.5412
60 82.7429 82.7778 99.4093 83.1458 100.743
45 88.2689 78.7433 105.63 79.2606 108.854
30 96.8728 74.3981 111.444 74.95 114.502
0 112.968 69.6242 116.862 69.601 112.96
•
• 6-46

•
•
CHAPTER 7
CASE STUDY OF A eUT-AND-FILL MINE STOPE
7.1 PROBLEM DEFINITION
Model validation is an essential step of its development as an efficient design tool. The
model verification serves the purpose of assuming that the model is mathematically
correct, whereas its application focuses on its ability to solve rnining problems for which
it was developed. Therefore, model validation is presented herein in conjunction with
data collected through published papers and repons. As the model is developed for the
strainburst evaluation, the selected case study must be suitable for it. In this chapter, the
numerical model e-% lools 3D is used through a case study with the data for Placer
Dame's Campbell Mine.
Rockbursts or violent pillar faitures were tirst recorded at Campbell Mine in the early
1960's, occurring in crown and boxhole pillars associated with shrinkage mining, from
1983 to 1987, at least 10 rockbursts of magnitude greater than 2.0, and one of 3. 1 were
recorded (Makuch, 1987).
Destress blasting was used for a number of years to overcome problems of highly
stressed ground and rockbursts. It is generally considered that the blast-induced fractures
in the rock reduce its deformation modulus and as a result transfer the stress to adjacent
rock structures.
Generally, at Campbell Mine, problems occur in the steeply dipping, hard and brittle
structures when extraction has reduced the size of the supporting pillars ta 20010. Three
attempts were made to destress cut-and-fill crown and sill pillars and one attempt in
shrinkage boxhole pillars. The report "Destress Blasting At Campbell Red Lake Mine"
(Makuch et al, 1987) outlined each of the three destress blasts including background,
preparation, instrumentation, hole layouts, powder factors, and the post-blast aetivities.
This provide a good opportunity for the author to undertake the case study.

•
•
Chapter 7 Case Sludy ofa Cut-and-Fi/J Mine Stope
This study takes the 1902 and 1802 crown and sill pillars at Campbell Mine as the study
object. The results obtained from e-z tools 3D for the case study are presented and
discussed.
7.1 CAMPBELL RED LAKE MINE
Campbell Red Lake Mine is a primary gold producer located in Balmertown, Red Lake
District ofNonh-western Ontario (Figure 7.1). The mine was brought into production in
1949 at a rate of 3S0 tOMes per day and eventuaUy mining went down to the 900 metre
horizon at a rate of slightly over 1100 tonnes per day.
The mine has had a continuai programme of development, the most recent of which was
the sinking of the Reid Shaft to a depth of 21 SOm. The new shaft is to be completed by
the second quarter of 1998 and followed by development of the underground
infrastructure. The entire system was to be commissioned by January 1999.
Figure 7.1 Campbell Mine location map (after Culleo, 1988)
7-2
•
e·
Chapte,. 7CQSe Sludy ofa Cut-and-Fill Mine Stope
The depth development project will cost an estimated 551 million and will a1low the mine
to maintain or increase its current rate of production weil into the next century,
potentially increasing annual production ftom 300,000 to 350,000 ounces of gold per
year. Mine aeeess is through a single four compartment shaft sunle te below the 27 Levet,
a depth of 1,316m below surface. There are 27 levels at 45 metre intervals with an
average of 6,OOOm of development per level. The mine is track based with full haulage
facilities on every level. Electric load haul dumps and electric hydraulic longhole drills
are used in high tonnage areas of the mine. Mining methods have evolved from shrinkage
stope mining through cut and fUI and finally to longhole mining. Longhole mining
praetices include sub-Ievel and crown pillar operations mine-wide.
7.2.1 Rockbunt Hittory
80th pillar and strain energy types of bursts have been recognised at Campbell. Pillar
bursts occur as violent failure of highly stressed underground rock pillars, while strain
energy bursts are a result of high local stress concentrations adjacent to underground
openings. Strain energy bursts are more frequent, occuning as rock bumps near
production faces, and usually have only minor impact on mining aetivities. Pillar bursts,
a1though less ftequent, are usually more severe in magnitude and can have a greater
impact on safety ta underground personnel. Crown pillars at Campbell Mine become
critically stressed and burst-prone when the pillar thickness approaches 6 m, or at about
80% extraction. Ta alleviate the rockburst problem and allow safe and efficient recovery
ofcrown pillars, destressing techniques have been adopted al the mine.
Oestress blasting has been used for a number of years ta overcome problems of highly
stressed ground and rockbursts. It is generally considered that the blast fractures the
rock, reducing its deformation modulus and transfers the stress to adjacent rock
structures.
7·3
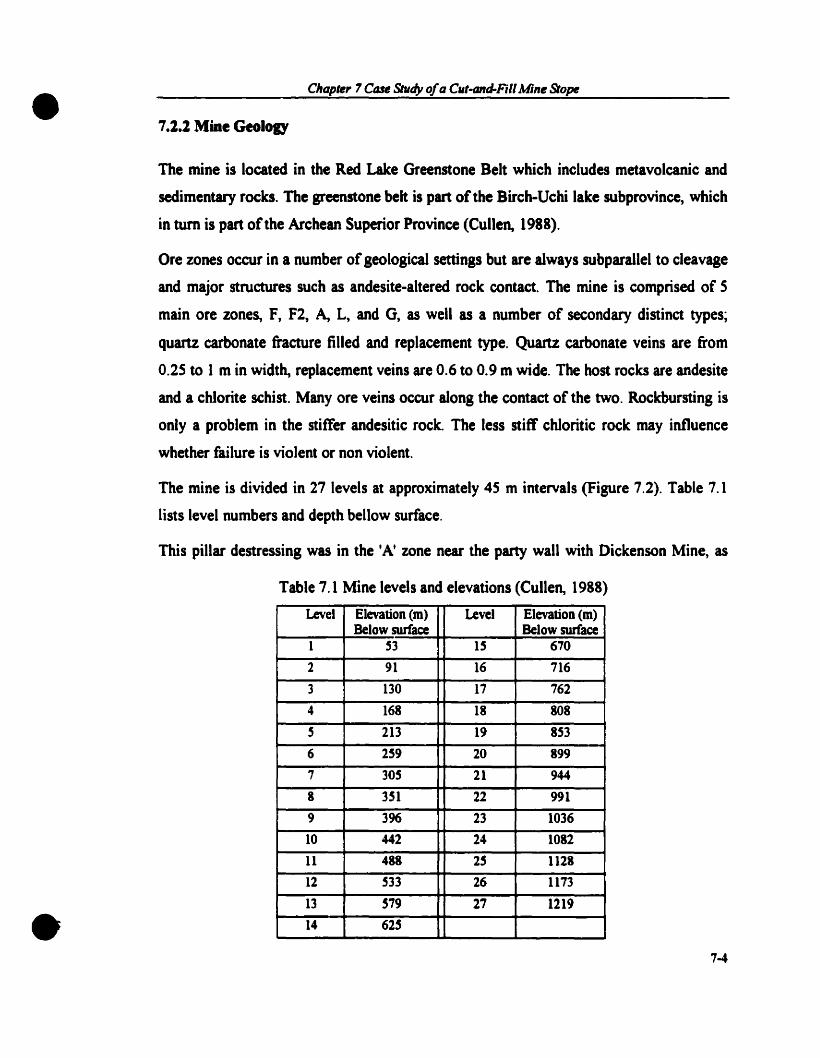
•
•
Chap"" 7 Case Shldy 0/a Cut.antJ.FiIl Mine Stope
7.2.2 Mine Geolol)'
The mine is located in the Red Lake Greenstone Belt which includes metavolcanic and
sedimentary rocks. The greenstone belt is part ofthe Birch-Uchi lake subprovince, which
in tum is part ofthe Archean Superior Province (Culien, 1988).
Ore zones occur in a number ofgeological settïngs but are always subparallel ta cleavage
and major structures such as andesite-altered rock contact. The mine is comprised of 5
main ore zones, F, F2, A, L, and G, as weil as a number of secondary distinct types;
quartz carbonate fracture filled and replacement type. Quartz carbonate veins are from
0.25 ta 1 min width, replacement veins are 0.6 ta 0.9 m wide. The host rocks are andesite
and a chlorite schist. Many ore veins occur along the contact of the two. Rockbursting is
only a problem in the stiffer andesitic rock The less stitT chloritic rock may influence
whether failure is violent or non violent.
The mine is divided in 27 levels at approximately 45 m intervals (Figure 7.2). Table 7.1
Iists level numbers and depth bellow surface.
This pillar destressing was in the lAt zone near the party wall with Dickenson Mine, as
Table 7.1 Mine levels and elevations (Culleo, 1988)
Level Elevation (m) Level Elevation (m)Below surface Below surface
1 ~3 IS 670
2 91 16 716
3 130 17 762
4 168 18 808
S 213 19 8S3
6 2S9 20 8997 30S 21 9448 3S1 22 9919 396 23 1036
10 442 24 1082
11 488 2S 112812 ~33 26 1173
13 S79 27 121914 62S
7-4

•
•
Chapter 7 Case Study ofA CUI-And-Fill Mine Stope
shown in Figure 7.2. Because of bursting experience in this zone on the upper levels
Campbell Red Lake Mine adopted a stair step mining geometry suggested by Professor
Morrison in 1961. Mining was started at the lower eastem extremity of the ore and
mined by cut-and-fill in small 40 m blocks. Four small sections against the party wall
were rnined through the level with only minor difficulties. The length of these stopes
made mining very slow, and therefore. the stope length was extended to SO m. When
1902 E. 'c' stope was within 6 m of the level. the decision ta destress was made. This
was based on the reports of 'Working Ground'. visual inspections and. for the tïrst time.
an increase in recorded microseismic activity.
On the 18th level the drift was renovated using 1.8 fi and 2.4 m resin rebar on walls and
back. and welded mesh screen. Initially. ail holes were to be drilled 54 mm in diameter
from the lSlh lever using a longhole machine. The plan was changed and spacing
adjusted 50 the same designed powder factor remained when 44 mm upholes were drilled
from the lSlh lever and from inside 1902 E. stope. as shown in Figure 3.10. Since mining
was ta be done from the 18lh level using a benching method. the stope was closed off and
tight tîlled.
7-5

•Chapter 7 Case Study ofA Cut-And-Fill Mine Srope
Figure 7.2 Longitudinal section of .A' ore zone (after Makuch et al, 1987)
ICl.JD
EXTENSOMETERSTATIONS
,longitudina1Section
ORE ZONE
fi L.EVEL. ~~,=iIiiII.....-----...-=-IIIIio:+;~~iE:
.il"'--=~~=%:=:-Œ~~~ii"":j:i
1 Level :~'.jI.-~tr---------.25 1ft----------.~..
CJZ-~
~ .,1./-~~e~~~CI)
wCJC~Z-a::%(ft
csz-CL.o~
en
Il••
• 7-6

•Chapter 7 Case Srudy ofa Cut-and-Fill Mine Stope
7.3 GEOMECHANICAL DATA, PRELIMINARY ANALYSIS AND MODELPARAMETERS
Mechanical properties of the various rock types are listed in Table 7.2. The values are
average obtained from rock samples recovered from throughout the mine.
A number of overcoring type measurements was conducted by CAl'1MET at the mine
using CSIR triaxial strain cells. Table 7.3 summarises the results and compares them to
expected values based on calculated stress gradients in the Canadian Shield of Northem
Ontario. As is common in the Canadian Shield, the major principal stress is horizontal,
striking NE-SW. Il is almost double the vertical stress, which is slightly greater than
that expected from overburden loading alone.
(f Mak h (987)fI bT bl 7 Î Ra e .- esu ts 0 a oratory test a ter uc ,
Rock type Uniaxial Strength Elastic Modulus Poisson's(psi) (GPa) Ratio
Andesite 33.0 to 41.0 82.4 0.21
(230 to 286 ~IPa)
Andesite Not Done 85.0 0.20
Chloritic 17.0 60.0 0.10Rock ( 117.5MPa)
Table 7.3 Field stresses (in MPa). Campbell Red Lake Mine (CRLM) (afterMakuch. 1987)
•
Depth(m) alarcraJ avertieal Lateral to vertical stress
MPa ratio
Normal to ore Parallel to Ore Normal! Parallellveins veins Vertical VerticalMPa MPa
625 27.0 16.0 16.0 1.7 1.0
( 14L)
1000 54.0 24.0 26.0 2.0 0.9(22L)
1220 73.0 43.0 32.0 2.3 1.3(27L)
7-7

•
•
Chapter 7 Case Study ofa Cut·and-Fill Mine Stope
A general analysis of the mining plan for stope 1802E and 1902E is needed for
choosing the most suitable principal stresses frorn the Table 7.3 and Figure 7.2. At the
rime when destress blasting was carried out, the stopes 1802E and 1902E were almost
iso1ated mined out areas. So the model domain for this case study takes the dimension
as 187mx300mx 333m. The 4.5 m wide crown pillar was drilled off with 44 mm holes
at 1.8 m spacing. ta within 1.5 m of the overlying drift. over a distance of 45 m. The sill
pillar. above the level. was drHled off with a 6 m long hole again at 1.8 m spacing over
a distance of 25 m. Since mining was to be done from the 18th level using benching
method. the stope was closed off and tight filled with 10: 1 cemented tailings. ANFO
was loaded into the destress holes with a powder factor of 0.2 kg/m3• After averaging.
the principal stresses for the model input for this case study took the following value:
<1\ = 46.03 MPa~ in the normal direction to the ore body;
02 =25.63 MPa~ in the strike direction to the ore body;
<13 =25.63 MPa. in the dip direction to the ore body.
KnonnaUvcru"::l1 = 1.8. KparallcUvcrtll:al = 1.0.
Figure 7.3 Orientation of the premining principal stresses adopted in thecase study
7-8

•
•
Chapter 7CQSe Study ofa Cut~d-Fi/lMine Stope
The rock mass for the hanging wall and footwall are andesite-dominated. It is decided
that the average value of available rock mass properties to be used for the model input
are as bellows:
~u =Erootwlll =80 OPa, v.......... = y/00"" =0.21
Eorebody =80 OPa, v~=0.22,
rroct =0.024 MN/mJ, ran =0.0256 MN/ml, (Je =230 MPa.
Based on the test results reported by Scoble et al. (1987) and Cullen (1988), the average
modulus in the destressed zone is in the range of 2S to 55 OPa, which means that the
rock fragmentation factor a =0.3-0.7. Thus, the rock fragmentation factors (lx, ay, and
(lz in the destressed piIlars are {0.5, 0.5,0.5 }, and the Poisson's ratio factors are
{1.4,1.4,1.4}. After preliminary studies with several values of ~, the stress dissipation
factors Px, J}y, Pz, Pxy, ayz, and azx used here in this case study are {0.6, 0.6, 0.6, 0.6, 0.6,
O.6} that gave the best correlation with the in situ measured stresses.
7.4 NUMERICAL MODELLING PROCEDURES
e-: tools 3D was tirst used to evaluate the burst potential of the 1802E sill and 1902E
crown pillars. Subsequently, it was used to model the destress blasting process. The
Zone 71
-~
i"""""_ 1
Figure 7.4 Numerical modelling zoning for mining sequence•1 1 1 1 1 1 1
11 1 1 1 1 1 1 1
7-9

•Chapter 7 Case Study ofa Cut-and-FiIl Mine Srope
numerical modelling procedures consisted of seven steps. Referring ta Figure 7.4. the
seven modelling steps are described in Table 7.4.
. al d IrTable 7.4 Description of the numenc mo e lng sequence
Modelling Data file Description
step
Stepl Cam-18.txt Initial configuration: drifts and raises
Step 2 Cam 18-1.txt Mining in stope 1802E (zone 6 and zone 7)
Step 3 Cam 18-2.txt Mining lower half of stope 1902E (zone 1) and
backfill stope 1802E (zone 6 and zone 7)
Step4 Cam 18-3.txt Mining upper half of the stope I902E (zone 2.
zone 3. and zone 4) and backtill the lower part of
the this stope (zone 1)
Step 5 Cam 18-4.txt Destress 1902E crown and I802E sill pillars
(zone 4 and zone 5) and the same lime backfill
the zone 2 and zone 3
Step 6 Cam 18-5.txt Destress 1902E crown pillar (zone 4) and
backfill the zone2 and zone 3
Step 7 Cam 18-6.txt Destress 1802E sill pillar (zone 5) and backtïll
zone 2 and zone 3
•
The finite element mesh was created using a commercial software called HyperMesh'~
with 78,548 nodes and 52.221 elements. The output file from HyperMesh® was
translated to the e·z tools 3D required format. Based on this file. the input file was
created for each mining step as shown in Table 7.4. The calculation of following step2
needs to input the preceding step's output files. For example. the ca1culation of step5
needs the output files from step 4. for step6 and step 7 also need the input of step 4' s
output files. The running of these tiles on Pentium 1I/233MHz PC computer took 15
hours each.
7-10
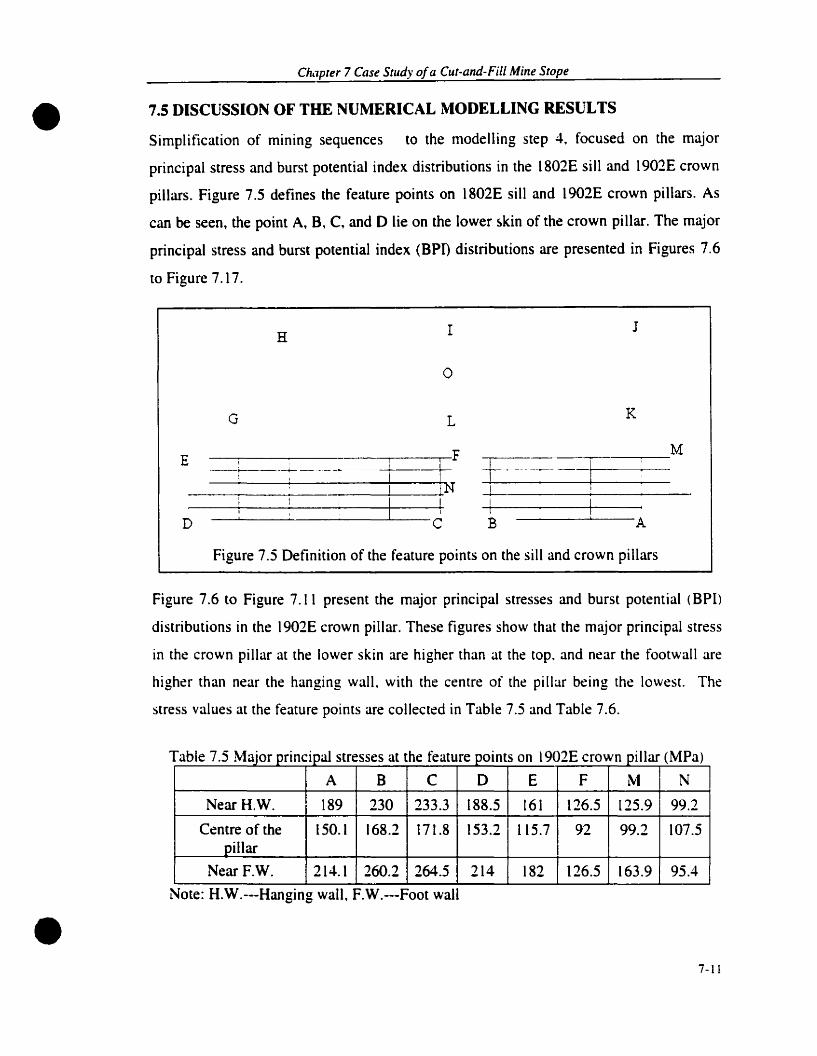
•Chl1pter 7 Case Study ofa Cut-and-Fill Mine Stope
7.5 DISCUSSION OF THE NUMERICAL MODELLING RESULTS
Simplification of mining sequences to the modelling step 4, focused on the major
principal stress and burst potential index distributions in the 1802E siii and 1902E crown
pillars. Figure 7.5 defines the feature points on 1802E siii and 1902E crown pillars. As
can he seen, the point A, B, C, and 0 lie on the lower 5lkin of the crown pillar. The major
principal stress and burst potential index (BPn distributions are presented in Figures 7.6
to Figure 7.17.
H l J
o
G L K
j~--
i
B A
Figure 7.5 Definition of the feature points on the siii and crown pillars
Figure 7.6 to Figure 7.11 present the major principal stresses and burst potential (BPI)
distributions in the 1902E crown pillar. These figures show that the major principal stress
in the crown pillar at the lower skin are higher than at the top. and near the footwalI are
higher than near the hanging wall. with the centre of the pillar being the lowest. The
stress values at the feature points are collected in Table 7.5 and Table 7.6.
9 'Eh f. . 1a e .) uJor pnnClpa stresses at t e eature pomts on l 0_ crown pillar (MPa)
A B C D E F M N
NearH.W. 189 230 233.3 188.5 161 126.5 125.9 99.2
Centre of the 150.1 168.2 171.8 153.2 115.7 92 99.2 107.5pillar
NearF.W. 214.1 260.2 264.5 214 182 126.5 163.9 95.4
Note: H.W.---Hanging wall, F.W.---Foot wall
T bl 7 - M .
• 7-11

•Chapler 7 Case Sllldy ofCl CUI~and~Fill Mine SliJpe
·n ~ )1902En h ~able 7.6 Burst potential index (BP at t e eature pOints on crown pl ar ( 0
A B C 0 E F M N
Near H.W. 93.2 140.7 144.7 92.7 84.3 38.9 38.4 23.7
Centre of the 60.5 76.3 80 58.7 34.4 19.5 23.6 26.5pillar
NearF.W. 97 140.5 145.8 98.9 90.3 32.3 30.7 20.5
T
Note: H.W.---Hanging wall, F.W.---Foot wall
Figure 7.12 to Figure 7.17 present the major principal stresses and burst potential (BP[)
distributions in the 1802E sill pillar. Stress values at the l'eature points are compiled in
Table 7.7 and Table 7.8. In the 1802E sill pillar the situation is different From in the
crown pillar. At the top of the sill pillar (points H, [ , and n, the major principal stress
and burst potential index (BPI) are higher than at the bottom. and near the hanging wall
are higher than near the footwall.
Table 7.7 Major principal stresses at the feature points on 1802E sill pillar(MPa)
G H 1 1 K L 0
NearH.W. 132.4 162 169 198.6 137 110 67
Centre of the 120.5 115.9 126.6 147.1 108.9 82 70.4pillar
Near F.W. 152.2 140.3 156.6 [73.6 149.4 110.4 70.6
Note: H.W.---Hanging wall, F.W.---Foot wall
Table 7.8 Burst potential index (BPI) at the feature points on 1802E sill pillar(%)
•
G H 1 J K L 0
NearH.W. 43.2 66.9 73.4 102.9 47.3 28.9 8.5
Centre of the 36.3 33.8 40.1 57 28.9 13.9 9.2pillac
Near F.W. 58.1 49.5 60.6 78 56 28.3 9.8
Note: H.W.---Hanging wall, F.W.--Foot wall
7~12

•Chapler 7 Case SlUdy ofa Cw-and·Fill Mine Srope
Upon examination of the model resuIts. it is found that the burst potential index (BPI) in
the 1902E crown and 1802E sill piHars is higher than 100%. suggesting the need for
destress blasting.
7.5.1 Destress Blasting of the IS02E Sill and 1902E Crown Pillars
The modelling step 5 was implemented, in which the 1902E crown and 1802E sill pillars
were destressed at the same time. The major principal stress distributions in the crown
and sill pillar are presented in Figures 7.18 to Figure 7.23. whereas the stress values at the
feature points are compiled in Table 7.9 and Table 7.10 respectively. The results show
that after destress blasting the major principal stress at the feature points A. B. C. D. and
E was reduced to 40-50%. however by not as much at point N and point M for the 1902E
crown pillar. [n the 1802E sili pillar. ufter destress. the major principal stress at points G.
H. 1. J. and K got 25-35% decrease. but not very few changes at point L and point O.
a ter mo e 102 step ( a)
A B C D E F M N
Near H.W. 121 148.6 138.2 116.9 109.5 109.8 97.4 95.4
Centre of the 97 110.7 113.1 97 82.3 85 76.8 99pinar
Near F.W. 140.6 173.2 158.3 136.5 129.4 102.1 103.8 93.1
Table 7.9 Major principal stresses at the feature points on 1902E crown pillar (MPa)f d Ir 5 MP
Note: H.W.---Hangmg wall. F.W.---Foot wall
a a ter mo e mg step ) li a)
G H [ J K L 0
Near H.W. 89.5 104.7 125.0 128.3 94.7 89.4 69.3
Centre of the 82.9 72.3 90.5 89.9 78.9 70.8 70.4pillar
Near F.W. 109 80.4 109 107.2 109.8 97.9 71.6
Table 7.10 Major principal stresses at the feature points on 1802E sill pillar(MP ) f d Ir - MP
Note: H.W.---Hanging wall, F.W.---Foot wall
•7·[3

•-.e--0u IMX~...V)
~ IKfl
ëüu'€ IM40;>
ê-lUIXXu
§III
:.a IXtl~u'e IH4l1J
;>
CI",I'''''' 7 ('mt' SllUh (lIa ('III-wu/·"ïll Mim' SWl't'
120----- -'2''''' "Kr- .... '2',..,~co12''''''''X'21"""~lOrq2(r= Cl21
IU(~ ~~ - 1111
- 12'~""'-------~~ ~1-lO_12U--1..:.... l"I~lfil6':"=>C;::=lhl~I"():::::;;X()S:Ulu0L~16u~IX~ec=lhU=;:-I-l1 c ",]
1 l "~Î
-170 -1ôO -150 . 140 -130
Distance frolllthe 1l1odcl's origin of refcrcnce l'rmne (111)
Figure 7,6 Major principal stress distrihution in the crown pillaI' near the hanging wall beforc destressing
Il
IlMI
~/'...../'..... IIK)
- /'..... IIMI/ '---"'" 'II)(~ ~IIKI~ "'-- ~
l IlKI12.~121,------1_1) l-llb -- l-ll) -121~'---r--
1 ) .--'.'1--,. c:=:1.(>---""';=;;:I~ ( t~ 120 ,.0, 1 . cl-l(~ é')l•
•
-170 -IbO -150 -140 -130
DisIUIIl'C frolll Iht: lIlodcl's origill of rcfcrclll'c frame (m)
Figure 7. 7 M~lior principal stress distrihution in the centre of crown pillaI' heforc c.Icslrcssing
7-14

• •CIUI!",'" 7 ClIse SIlle/y 0/ cl ('/II-CIIIIi- Fil/ Mùu' SIO/,t'
e---euuCSt/)
~
~u'eeu
;>
IH9
IHN
IH7
IHb
IHS
IH4
r120' 12lP -12U- -121'- '-121P <:120...• '12U '120
JlK~ _ \(K~IH'--' ~I(KJ IIKtJlHI
\IlU ICMl JIHI""\. ~ IIKI
~.,~IC.,~ _~"'--IC.'~. 12H.".
~. .. 12('-14(':::=::::::::::121~1;~:~ C---::::~U~~~I ---...-=1(~\ e== 1~I~IIm~II~lUss:" c:e===:: 1Kl'S"I ~14'42:!:!1 ~22nS'>ltI4t::;JK~yss (=?I KO.;:I~<1 i im
·170 -IbO ·150 -140 -130
Distance froln the Inodcl"s origin of rcference frmne (In)
Figure 7.8 Maior principal stress distribution in the crown pillaI' near the footwall wall hcforc dcstrcssing
-I.m
21~O2~11(;::;Jo 0 0 0
~l~l~ '(....J•.-------~Ill~ ~ ·tlI_ __"U)
,-, ") ........--- ïlt===> c=:1KIS":'> ""-=::=flF3":"> Cc ='K(J~ l'IOIS,,/II?:Klap r==60--.." c;xi)
-170 -IbO . 150 -140
-E-lUu INHc:E3lI'l:.a IHb~u'e IN4lU
;>
Distance l'rom the l1lodel's urigin of reference frame (m)
Figure 7.9 Burst potential index (BPI) distribution in the crown pillaI' near hanging wall hcfurc dcstrcssing
7-15

• •eJWf'lt'I" 7 etUt' SIIU/y ofa C"'-mu/-Fil/ Mit/t' SIO/,i'
-E--lUU
.§Vl
~
~u'f:lU
:>
188
186
184
-170 -IbO -150 -140 -130
JO
Distmlce frolll the Illodel's origin of referencc franlC (lU)
Figure 7.10 Burst potcntial index (BPI) distrihution in the centre of Cfown pithlr hefofe destrcssing
40C'''~'110''1
~ /',,,~'" "1 ~........... ~"20-..-/~ c 20......... ~ -
... ."~~~~ -lI.1 > cC reS---;:::=Mo:=:> c=:=-~,u~ e:::;::=xo56(~1 ~"'hO <l'Op <=""'""""6!}--:,,; c;:KO
-170 -ltJO ·150 -140 -130
§~
IKXu
BtJ'l
~ IKtlc;u'E IK4~
>
Distance frolll the Illodcl's origin of rcference t'raille (lU)
Figure 7.11 Burst potential index (BPI) distrihution in the crown pillilf neur footwall herme deslressing
7-16

• •CIUI/,It'" 7 Ca.H' Sltu!r of a CIII-mu/-Fill Millt' SIO/'t'
-IH
:!lll
1~~Ii' ~1.an.i607 cV' _I-$CI, ItIOJ ~"'IllU _1:!(~I,·I!)(I--..ItJ(
~"'-J ~ . Xl~H(~~~;
"H{"l,cH" '" Xl'
1')6 ~r!1,-)--------1'1) tit.-- H(~~ IOU" ( 100, 1110 XI1« > c::: 1111)==-- ..c:: lUIt-=...." 1()(.) M ,1 ----= '=="' c:= IIM'------" =..--::::::IIM' I~".IM) 1:'1' .- 1 ~.
-15U ·1-$5 ·J.UI
EdJUt:~III:a
"@ut:dJ
>
Distance frum the modd's origin of refcrence frame (m)
Figure 7.12 Major principal stress distribution in the sill pillar near the hanging wall bcfore destressing
E .:!o.:!-4JU
~200
..,.~
~IlJX
,g~Q.) IlJtJ>
-I()~ -160 ·1:':'1 ·150 -145 -140 ·1.~5
Distance l'rom the modd's origin of rcfcrcncc frame (m)
Figure 7.13 Maior principal stress distrihution in the centre of sill pillar beforc dcstrcssing
7-17

• •CIUI/,/('" 7 Ctue' SIm/y ofa OI1·tUld-Fi// Min(' .\'101'('
I·UI
-1.~5-140
21Mt -1 J XU
19Xi':w l:t19h ,
XII 'f,," ( -{Il'~II'!>. Il"', ;;,.. C "">---." -==11'''---''' ,..1I1ll",?~ '"' ... .,..." c= . .1~ II 1 1 i
-16:' -UlU -1:'; ·I:'ll -145
Ê 202--lUU
~cr.~"';j.g....4J:>
Dislam:e "rom the modcl's origin of reference frame (m)
Figure 7.14 Major principal stress distribution in Ihe sill pill~'r near the footwall wall before destressing
-.E 2U2--lUUc 2(Hl~~
tI)
:.a~
IlJXu'El1J IlJh:>
tJ~~~-- ~-6()=:7 -~27-"-6I~'6II~()-6II\,1i11
-r ;m---- ---
·165 -160 ·155 ·1511 -145 -140 -135
Distance from the modd'~ nrigin of rcfercncc t'nune (In)
Figure 7.15 Burst potcntial index (BPI) distrihution in the sill pillar near hi.mging wi.,11 before dcstrcssing
7-IH

•CJUlI'1t'" 7 Ca:œ SIIU/Y ola CIII-mu/-Fil/ Mim' SIOI'('
•
É202
lUu 2(K)cgVl
~
-a IlJXu'€lU
> IlJ()10 1( 2n
-1(-)Cl.-----Il
-1 ft5 -lllO -155 -150 -145 -14U -135
Distance l'rom the modcl's origin of reference frame (m)
Figure 7.16 Burst potential index (BPI) distribution in the centre of sill pillar before destressing
-e 202--0u&:: 2U()~...U':I:.a-a It)X 'lUU
"ElU 196>
-16; -lhU -155 -150 -145 -I·UI -135
Distance l'rom Ihe modcl's origin of refercncc frame (m)
Figure 7,17 Burst potcntial index (BPI) distrihution in the sill pillar ncar footwall bcforc destrcssing
7·19

• •(1wp't'I" 7 l'lHt' S'ud\' ofli C"'-(IIul-I--;1I A/illt, ,""'OPt'
.-e-lU
IHHut=co~rJ;
~ 186ë;u'€ IH4cu>
~'Jo-"H' '=IlH~I~lUl~ =Il.ï== =".ï== ~""".'---:"Hl
Q _"OA,••----.-/ 0 0.0 HO'Jl~ ~Il.ll ~l)(
100 SI§ ~IUO________IOW------ --- .- I.~ 1 =' I?/I Ill) I(HI
11lr--." C=:;::::121>:=;-v1l!.l-1/1l5"":">- ecUUs"12(~CH(~}-'O~~cAl2d~ C lll
-170 - IllO -150 . 140 -130
Distance froln the Illodcl's origin of ref"erence l'raine (lU)
FiJ!ure 7.18 Maior Principal stress distrihution in the crown pillar near hanging wall uner dcslrcss
KU-- ~~ K(~ -KI'--- -1(1'- -1(1.--- '--"K(~'---KIl-- _1'=)1)'JI'::-'/ "-'" "0 j')11 'JlI~
/JI~ ~~_70'J(~ 'tH~"HI~llH. ,}l) "
w<D IIH)- -V- 'W' , ro:==:> J'lU) I~ • '\ r---:> IlW- Il")-.../''
,-..
§cu
IKKu
~Vl
~ 1Xllë;u'2 IX4~
cu>
-170 -1 hl) -150 -140 -130
Distance frolll the Illodel's origin uf rcfcrcncc fmme (Ill)
Figure 7. 19 Major Principal stress dislri hution in the centre of the crown pi lIar ancr dcstress
7·20

• •CJUlII"'" 7 GUI' Sttu/y f~ra CII1-tltlt/·Fill Mill(' Stop"
Mil ....o• liN" ""1 (leP" '=10(.-:' > i§
u IXXu
3CIl
~ IK6~~'c IX4u
tl2U;>
-170 -1:'0
Distance from the JllmJd's origin of reference frame (Ill)
Figure 7.20 Major Principal stress distribution in the crown pillar near footwall after destrcss
-202i HU,J / 'v'E (lU-- 7U
nJ
)Uc 200tl3....t,I)
~IlJX IUll 7) 7~ fica
u ~ ) ./ 7U'
"2nJ
:>/110, r:- ~"II__l\I' - l\IJ~ !JOIIU-:=::=-"
1 ,1 1
-ltl5 -ltlO ·155 -1 ;(1 -145 -140 -1 ];
Dislance from Ihe mmlcl's migin of reference frame (111)
I:;'igurc 7.21 Major Principal sU'css distrihution in the sill pillar near hanging wall ~lfter destress
7-21

• •Clwl"C'r 7 GHt' StllIly ofa eur-w/(l· Fil! Miw' SIol'('
Il ' , ....'Cm... '(JI)' '-'JO'" '<JI""
111 l "\r "\ '\ "--- ---X~._~ ~ /".. ,,--HS.
hL~lIt~'h; 1"~~t-_H5.J_'-/-7-s)tUI~ , J "--III) f\ ()
70 S _7CJ~ 71V 7lJ7~ 74ï::) <!:~ ~ 70· 70 0 ;_ HO
711 Il
ê 202-euu§ 200-Vl
~"c; IlJHu'Eeu IlJ6:>
-165 ·160 -155 -150 -I~) -I~O -135
Distance from the modcl's origin of rcfcrcncc frame (Ill)
Figure 7.22 Maior Principal stress distrihution in the centre of the sill pillar after destress
g 2U2
euu§ 2CM.-Vl
~
~IlJX
u'feu IlJtl> HO---_ --11'~ XII ,--. n
1Jtl'-=:>. .c'HJ\"ï')(' 'JO r==cJO .c-'X!=:=> -<==='}O~ c--· ...... ? "J F--I:", ii 1 1 1 1
-165 -160 -155 -150 -1.J5 -140 -135
Distance from the modcl's origin of reference fnunc (Ill)
Figure 7.23 M4ljor Principal stress distrihution in the sill pillar neal' footwall artel' destrcss
7-22

•Chapter 7 Case Stud)' ofa Cut-and-Fill Mine Stope
7.5.2 Modelling the Destressing of 1902E Crown Pillar Only
To compare the results for different destressing scenarios. the modelling step 6 was
implemented which assumed that only the 1902E crown pillar is destressed. ln this step.
the same destressing factors ({ a}, (~}) as step 5 were used. The preceding modelling
step to this step is No. 4.
Figures 7.24 to Figure 7.29 present the major principal stress distributions in the 1902E
crown and IS02E sill pillars after only destressing the 1902E crown pillar (step6). The
correspondent Feature point values are given in Table 7.11 and Table 7.12.
estress astlOg ( a
A B C D E F M N
Near H.W. 117.5 143.7 146 114.6 92.5 98.4 90 91.3
Centre of 94.6 108.1 110.5 95.4 79.2 77.9 65 94.8the pillar
1
Near F.W. 137 148.7 171.4 134.1 105.6 90.9 100.7 89
Table 7.11 Major principal stress distribution in the 1902E crown pillar after itsd bl' MP)
Note: H.W.---HanglOg wall. F.W.---Foot wall
estresslng t e - crown pl ar( a)
G H 1 J K L 0
Near 148.6 165.6 172.3 201.7 152 125.7 73.2H.W.
Centre of 131.9 118.2 128.6 131.9 121.6 94.7 73.4the pillar
Near F.W. 170.9 144.4 160.3 177.3 165.6 126.4 75.4
Table 7. 12 Major principal stress distribution in the 1802E sill pillar afterct . h 190'"E ï 1 MP
Note: H.W.---Hanging wall. F.W.---Foot wall
The results show that. with the 1902E crown pillar being destressed. the stress level
in the 1902E crown pillar is lower than the stress level atler step 5. however. the
stress level in the 1802E sill pillar increased by 5-15%.
•

•-E
l)O-lUIXXu
5III
IX6~c;u'f: IX4lU
>--170
C/Wplt'" 7 CWt' SIIU/y ofa CIII-mu/-FiJI Mill,' SIOp"
-150 -140 -130
•
Distance from the modcl's origin of refrence frame (111)
Figure 7.24 Major principal stress distribution in the crown pillar near iHmging wall after destress the crown pillar
ê-lU1Xl'!u
§-Vl:.a 1Kt.~tJI,
IIH-C::>'Ca
1 IUt)u
·150
'e IX4lU
-1 hO>-
-170 -140 -130
711
Dist~lIlce from the modcl's origin of refrence frame (m)
Figure 7.25 Major principal stress distribution in the centre of the crown pillar 4lfter dcstress the crown pilla..
7-24

• •CJ/lIP'"" 7 C'a.\,' S,,,,h t~/11 CIII-mu/-,..i/l Mim' ,""'OP('
orKl~
~H() ---"'1
liO~liO::::::JKlI-___ =--:JO
HOliIl
~l~IO()------ .... 1110
Il)1~1111'-~-~.-.----- ,~ ~') <12~), .....12U-" c=;11'W:::"> c:<=1"O=>.U~ ~121rr1411p c=:12U=::> c---':>, 1
Ê(lJ
\XXu~...",.,
~ IXhë;u'e IX4QJ
;;;.-170 -1€lU -150 -lolO -1 ]()
Distance from the modd's origin of refrence frame (m)
Figure 7.26 Major principal stress distribution in the crown pillar ncar foot Willl after destrcss the crown pillar
E 202
(lJ
uc .100~....",.,
~
~ILJX
u'ElU Il)()
>
·Ib) -IbO ·155 -150 -145 -lolO ·1.'5
Distance fromlhe 1ll001cl's origin of refrcnce frame (Ill)
Figure 7.27 Major principill stress distribution in Ihe sill pillar near IHUlging wall ilfter destress the crown pilhtr
7-25

• •Clmplt'l' 7 CtI.H' SlIul)' of Il CtII-mu/- FiJI A'tlIft' Siope
~ ~ ~121t:::J c=:::::A..1~(~\'-J- K' ~........loo-lll~I1I~,~ \"0
:~1Ô~~~~kJ\,/ K(~~J))HU-.... ........-- HU-- l)() 1lI0
11ll
202Êu 2()()li
§III
~
ëa 19Kli"2u> 196
, ! " 'c > IJC)., c::=r)('-"""""'.c ---.......lltr ---=> ~)()' , < «, •1 1 1 1 1 1
-lM -160 ·155 -150 -145 -,·m -135
Distance from the modd's origin of refrence frame (m)Figure 7.28 Major principal stress distribution in the centre of the crown pillaI' after deslrcss the sill pillaI'
-E 202-lUt)
fij 20t)-Vl:.a'Cat)
'elU
>
-165 -((JO -155 -'5U -145 -140 ·135
Dislance from the modcl's origin of refrence frame (Ill)
Figure 7.29 Major principal stress distrihulion in the crown pilhll" near fool wall after dcslrcss Ihe crown pillaI'
7-26

•
•
Chaprer 7 Case Sludy ofa CUI-and-Fill Mine Srope
7.5.3 Modelling the Destressing of ISOlE Sill Pillar Only
As stated in section 7.5.2. to compare the results for different destressing scenarios, the
modelling step 7 was implemented which considers destressing the IS02E siU pillar only.
ln this step. the same destressing factors ({ a}. (~}) as step 5 were used. The preceding
modelling sequence for this step is No. 4. The results from the model step 7 are
presented. The major principal stress distribution in 1902E crown and IS02E sill pillars
are shown in the Figure 7.30 to Figure 7.35. The major principal stresses at the feature
points are given in Table 7.13 and Table 7.14.
Table 7.13 Major principal stress distribution In the 1902E crown pillar after
destressing the 1802E sill pillar only (MPa)
A B C D E F M N
Near H.W. 192.8 235.4 238.4 191 167.3 140.5 135.2 102.9
Centre of 152 171.3 174.9 154.1 121.4 100.8 104.6 113.the pillar
Near F.W. 218.2 265.8 270.1 216.9 180.3 140.1 130.9 102.1
~ote: H.W.-··Hanging wall. F.\V.---Foot wall
Table 7.14 Major principal stress distribution ln the I802E sill pillar after
destressing the 1802E sill pillar only (MPa)
G H l J K L 0
Near H.W. 77.8 101.4 122.3 125.4 84 77.2 66
Centre of 76.7 68.1 87.7 88.3 73.9 64.8 67.2the pillar
NearF.W. 84.2 76.1 97.2 95.6 75.4 75.6 67.2
Note: H.W.---Hanging wall, F.W.---Foot wall
7-27

•..-
E-cu
18Hu§III
~ 186~u'f 184cu:>
CIWpft'r 7 Ca.H' Snu/.' (~"a CIIl-mu/· Fill Mim' SlOpt"
-160
Distance fromlhe modd's origin of refcrcncc frame (Ill)
-130
•
Figure 7.JO Major principal stress distribution in the crown pillaI' near hanging wall after destress the sill pillar
Ê-cu188u
3III:a 186~u'e 184cu:>
-170 -160 -150 -140 -130
Distance l'rom the modd's origin of rcfcrcncc l'nunc (Ill)
Figure 7.31 Major principal stress distribution in the centre of the crown pillar aftef destress the si)) pillar
7-2K

• •Clwptt'I' 7 l'tUt' Stlu/y (lIa CItI-wu/-FiJ/ Mill(' Sto/u'
e-lUU
~III
~
Cüu'2lU
;>
-f\'l'''()'_ '--PO:;:::; c=: - =;::7"""""11:::::==nil=:7C=ï~:::::::7":==:-;-:;;-;;--:::7"'C:-"':'"'::""':----
188 r- ioo 12n=-, "=12{)::JCC:::::P(~120 "0 0 - 120---"''''==120::::::> C:::I20O:::> C:::I"(~~
IHt~~100 0 0 COO
...~fl()(}~) IlMl 'wo 1110 101 WU V v ,) 100:1 W~)100 f
H4 160 ...~2t~1". p(~4~ 120 ;r:160>5::\ c;EIXUS"'=> ~l/J---l)~ - ~16()........n- r~ . ---- ~l• _ n =.::> caIMt~"o~ ?'~0~12(~_un..l
-17() , -- ,. ~220"1()(-=20~ _14(~11.(\""_1611 ,- =1
Mol;;; '> a:1
MOSJ
-150 -140 -130
Distance l'rom the modcl's origin of rcfcrcncc fmme (m)
Figure 7.32 Major principal stress distribution in the crown pillar near foot wall arter destress the sill pillar
·u;-140-145-150-155-ltlO
()()
l",J---====- ""'== .111)
~()-I J():"llln_llCl~lO(J - ,. -WlI::'JO-l'If)- ~l"'l---....::..::..:.:.----
71) "'----I\I,---Hl
~"~'\70
70" =>,0= c=": 1 711 1 170~ A
-.2U!É
lUUc 2()Ueo3....~
:.aC; IlJHu'€
IlJ6 leu 70>~
1<
-165
Distance from the modd's origin of refcrcnce frame (Ill)
Figure 7.33 Major principal stress distrihution in the sill pillar near hanging wall artel' dcstress the sill pillar
7-29

• •('11111""'- 7 Ctl.\C' .'ùw/v (~I (1 CIIHmd-fï/l Mim' Stol't'
~! cco: \ ~ xU' \ --"'2'15--.-/ '--X'ï_ -X5
Il'\ K-li
\\1~7t:: K". ~.~5 "L" "\ ~~~,,;:;<
--_...... J "J ~5=C) {:> t~ 7iJ d75
') '--5~~-li ~)5t=: r "rtJU.... Cllh." t IO>., i , , i- -, 1
E202
~uc 200~..":a
'c;; ItJXuu 1
"Efi)
c.J I()(}>
-1 tl5 -160 -1:;5 -150 -1"5 -140 -1:'5
Distance frum Ihe modcl's origin of rcferencc franle (m)
Figure 7.34 Major principal stress distrihution in the centre of the sill pillaI' artel' destrcss the sill pillar
7U
hO Jhll~
~ tQ~Il)
(~. <,7(~ r71~. 70.. r=70 .c=7C~ ~7~F==='C:=::70 '{ y ,,1 1
E202
c.Juc 200~.."
:a~
I()Xu"i~lU
> Il)lJ
-165 -160 -15:=l -150 -145 -140 ·135
Distance from Ihe modcl's origin of reference frame (m)
Figure 7.35 Major principal stress distrihution in the sill pillaI' near foot wall arte .. destrcss the sill pillaI'
7-30

•Chapte, 7Case Study ofa Cut-and-Fi// Mine Stope
7.5.4 Discussion
In this case study, three destress blasting scenarios for the 1802E sill and 1902E crown
pillars have been modelled. From the modelled results shown in this section, the
following conclusions ofthis case study are made.
The major principal stress in the 1902E crown and 1802E sill pilIars is lowest in the
centre pans of pillars. For the 1902E crown pillar the area near the footwall is subjected
to higher stress, but in 1802E sill pillar the area near the hanging wall has higher stress.
In the 1902E crown pillar the principal stress near the lower skin of the pillar is higher
than that near the top of the pillar, but in the 1802E sill the top of the pillar bas higher
stresses than the bottom orthe pillar.
The highest stress concentration occurred at the centre bottom of 1902E crown pillar
where the thinner part of the pillar located.
Destressing of 1902E crown and 1802E sil1 pillars al the same time shows the most
favourable results for the subsequent mining ofthe 1902E crown pillar.
Destressing of 1902E crown pillar only decreases the stress level in the 1902E crown
piIlar, however, it increases the stress level in the 1802E sill pillar, which makes the
mining of 1902E crown pillar using bench down method very dangerous.
Destressing of 1802E sill pillar oRly increases the stress level in the 1902E crown pillar
which increases the hurst potential in the crown pillar.
Comparing the three destress blasting scenarios the destressing of 1902E crown and
1802E sill scenario appears to be the best choice.
7·31

•
•
CHAPTER8
CONCLUSIONS
1.1 SUMMARY AND COCLUSIONS
An energy based rockburst potential evaluation method, burst potential index (BPI), was
proposed. This new method relies on the mining induced strain energy storage rate and
the uniaxial compressive strength of the rock. The Burst Potential Index (BPI) is
calculated based on energy considerations, to help estimate the potential for face burst in
mine development headings. When BPI exceeds 100%, the situation calls for destress
blasting. And then the model was employed to assess the strainburst potential in a cut
and-fill mine stope. From the results obtained, it can be seen that the BPI is a useful tool
in predicting crown pillar strainburst in cut-and-fitl mining. It was shown that as the
mining sequence progresses upwards thus reducing the size of the pillar, the magnitudes
of ESR and BPI increase. Those were particularly highest at the corners of the stope
back, which indicates a possible shear faiture mechanism.
A numerical modelling technique for the simulations of destress blasting in hard rock
mining operations at depth was developed and implemented in a newly developed 3
dimensional finite element code, e-: tools JD by the author. The technique employs two
newly introduced parameters, {a}, rock fragmentation factor, and Hl}, stress dissipation
factor, inside the modelled, fraetured zone. The mode1 is based on the burst potential
theory to help assess strainburst potential and hence, the needs for a remedial solution
such as drift destressing. Basically, when the burst potential index (BPI) approaches or
exceeds 100%, the method suggests that rockburst is imminent and destress blasting may
be required. Destress blasting is simulated by modifying the deformation properties ofthe
rockmass and the post-blast state of stress in the destressed zone using the above
mentioned parameters (a} and {P}. The technique, based on incremental analysis,
permits the simulation ofaetual mining aetivities, i.e. mining and destressing.
Comparison of results between analytical solutions and numerical predictions of stresses
around circular opening shows excellent agreement, sewed to verify the numerical model.

•
•
Chapter 8 Conclusions
Model parametric study regarding the destress blasting patterns, the variation of the rock
fragmentation factor {CL}, the stress dissipation factor {Il}, and the initial stresses
orientations have shown that each parameter has a significant effect on the rock mass
response in terms ofstresses and deformations. No parameter could be neglected.
A case study ofa cut-and-fill mine stope on the destress blasting of 1802E sill and 1902E
crown pillars at Campbell Red Lake Mine, Berlmertown, Ontario was undertaken using
the developed finite element model. The geomechanical data were collected from the
published papers and reports. The model input data used are the average values. Mine
bacldill is modelled as a construction material, in which no initial stresses existed. The
results indicated that the destress blasting of 1802E sil1 and 1902E crown pillars is
necessary. The modelling results show that ailer destressing of the 1902E erown and
1802E sill pillacs the stress levels in the crown and sill pillars are reduced substantially.
It is shown through case studies of underground Canadian mines that the new method cao
be particularly useful in the assessment of deep drift face burst potential and the crown
pillar burst potential in cut-and-fill mine stopes.
8.1 RECOMMENDATIONS FOR FURTHER RESEARCH
The research work presented in this thesis can be extended in the following directions:
1. Further retinement of the current numerica! model may prove useful. The
development of an interface with as much available commercial graphie software
as possible ta make the e-% tools JD more versatile.
2. Investigate the behaviour and failure of brittle rocks under versatile loading to
improve the burst potential index theory.
3. The numerical model can be developed to account for the non-linear behaviour of
the rock mass. And funherrnore, the time effect cao be incorporated in the model
ta permit the simulation of time-dependent viscoplastic behaviour of rock
structure..
4. More case studies condueted with the new model will be very important for the
validation ofthe proposed approach and the numerical modeL
8·2
•
•
Chapter 8 Conclusions
STATEMENTS OF CONTRIBUTIONS
A 3-dimensionallinear elastic finite element model is developed ta evaluate the rockburst
potential and ta model destress blasting. An index called the Burst Potential Index (BPI)
is calculated based on energy considerations, to help estimate the potential for face burst
in underground openings. When BPI exceeds 1QOOA., the method suggests destress
blasting is required. The proposed destress blasting simulation technique is implemented
with the help of two sets newly introduced parameters: {a}, rock fragmentation factors,
and {P}, stress dissipation factors. The algorithm is based on an incremental
methodology. Verification of the implementation was done by comparing the analytical
and model results. A comprehensive model parametric study was done through a typical
drift in Canadian hard rock mines, then a case study on a cut-and-fill mine stope was
carried out. The effects of the destress blasting patterns, initial ground stresses
configuration, and the two factors (rock fragmentation, and stress dissipation) on destress
blasting are studied. It is shawn that the new method can be particularly useful in the
assessment of deep drift face burst potential and the crown pillar burst potential in cut
and-fill mine stopes.
8-3

•
•
REFERENCES
Adams, D.1., Gay, N.C. and Cross, M., 1993, Preconditioning - A Technique for
controlling rockbursts, Rockbursts and Seismicity in Mines, Young (ed.). pp.29-33,
Balkema, Rotterdam. ISBN 9054103205.
AI-Heib M.. Bigarre P. and Josien J.P. Principe. 1994, choix et parametres de la methode
de saignee. Laboratoire de mecanique des Terrains. INERIS - Ecole des Mines.
Arjang, B., 1986, Field and stress determination at Campbell Red Lake Mine. Ontario,
CANMET M&ETIMRL 86-57 TR.
Aubertin. M.. Gill. D.E., 1988. Une méthodologie d'évaluation du potentiel de coups de
terrain dans les mines d'Abitibi. Colloque sur le Contrôl de terrain (AMMQ), Val
d·Or.
Aubertin. M., Gill. D.E.. Simon. R.. 1994. On the use of brittleness index modified (BlM
to estimate the post-peak behaviour or rocks. Proc. First North American Rock
Mech. Symp.. Balkema. 945-952.
Beghoul. M.N.. Lauriault. R.A., Plouffe. M., 1996. Relation spatio-temporelle du taux
d'extraction et al réponse séismique minière induite. C.R. du 1r= Colloque en
Contrôl de Terrain. AMQ (ed.), Val d'Or.
Bigarre P., 1996, Rapport de synthese bibliographique et de recommandation sur les
methodes de détente. Laboratoire de mecanique des Terrains. INERIS - Ecole des
Mines.
Bieniawski, Z.T. , 1966, Stable and unstable fracture propagation in rock, Report of the
South AfTican Council of Scientific and Industrial Research. No. MEG 493.
Bieniawski. Z.T.. 1967. ~Iechanism of brittle fracture of rock. Part 1 Theory of fracture
proeess; Part li Experimental studies; Part II Fracture in tension and under long
term loading, Int. 1. Rock Mech. And Min. Sei., 4, 395-430.

•
•
References
Bigarré. P.. 1996, Rapport de synthèse bibliographique et de recommendations sur les
méthodes de détente. lnsritut national de l'environnement industriel et des risques
(lNERIS)-Ecole nationale supérieure des mines de Nancy.
Blaha. F.. 1990. Sorne principles of rock mass failure in the case of rockbursts.
Mechanics of lointed and Faulted Rock. Rossmanith (ed.), 757-762.
Blake W. and Cuvelier, OJ, 1988. Developing reinforcement requirements for rockburst
conditions at Hecla's Friday Mine. Proc. 2nd lot. Symp. Rockbursts and Seismicity
in Mines, Minneapolis. pp. 589-598.
Blake, W., L971. An automatic Rock Burst Monitor for Mine Use. Proc. Confr. on the
Underground Mining Environment. Uni. of Missouri. Ralla. MO, pp. 69-82
Blake. W.• 1972. Rockbursts Mechanics, Quarterly of the Colorado School of Mines, vol.
67. No.l. pp. 1-64.
Blake. W.. 1982. Rock preconditioning as a seismic control measure in mmes.
Rockbursts and Seismicity in Mines, Johannesburg. S. Afr. Min. Metall.. Symp.
Series No. 6.
Board, M.P. and Fairhurst, C., L983. Rockburst control through destressing- a case
example. Symp. Rockbursts: Prediction and Control, ~M. London. pp. 91-102.
Boistad. 0.0.. 1990. Keynote lecture: Rockburst control research by the US Bureau of
Mines. Rockburst and Seismicity in Mines. Fairhurst (ed.). Balkema. pp37 1-375.
Brady. B.H.a., and Brown. E.T., 1985. Rock Mechanics for Underground Mining. George
Allen & Unwin.
Brown, E.T.• 1984, Rockbursts: Prediction and control. Tunnels and Tunnelling, April.
pp.17-19.
Brummer. R.K. and Kaiser. P.K.• 1995, Risk-cost-benefit analysis for support design in
burst prone mines. Transactions of the Institution of Mining and ~Ie(allurgy,
104(A), A71-A75.
Budavari, S., 1983. Response of the rock mass to excavations underground, Rock Mech. in
Mining Practice, S. Afr.lnst. Min. Metall., Monograph Series, Vol. 5. pp. 55-76.
R-2

•
•
References
Calder, P.N., Archibald, J.F., Moroz, B., Semadeni, T., Korenberg, M., Mcilroy, P., 1986,
Rockburst prediction studies at Queen's University, Cano Min. J., 107, 33-39.
Chavan, S.A., Raju, N.M, and Srivastava, S.B., 1993, Rockburst prediction-An empirical
approach, Rockbursts and Seismicity in Mines, Young(ed.), Balkema, Rottedam,
ISBN 9054103205. pp.163-167.
Chen,Z.H.. Tang, C.A., Huang, R.Q., 1997, A double rock sample model for rockbursts.
Int. J. Rock Mech. Min. ScL. Vol. 34, No. 6, pp.991-IOOO.
Corneau, W., Mitri. H.S .. Mohanimed, M. and Tang, B., 1998, World-wide survey of
destress blasting, practice in deep hard rock mines, In the Proc of the 25th Annual
Conf. on Explosives and Blasing, Nashville, TN (1999), Sponsored by Int. Soc.
Explosives Engineers, pp. 189-205.
COMRO, 1988, An [ndustry Guide to Methods of Amelioration of the Hazards of
Rockfalls and Rockbursts, Chamber of Mines Research Organization of South
America, Johannesburg.
Cook. N.G.W.. 1978. An Industry Guide to the Amelioration of Hazards of Rockbursts
and Rockfalls. Chamber of mines of South America.
Cook. J.f. and Bruce, D.. 1983. Rockbursts at Macassa Mine and the Kirkland lake
mining area, Symp. Rockbursts: Prediction and Control, IMM, London, pp.81-90.
Cook, N.G.W, 1965, The failure of rock. lnt. J. Rock Mech. Min. Sei., 2: 389-403.
Cook, N.G.W., 1963, The basic mechanics of rockburst, Journal of South African
Institute of Mining & Metallurgy. vol. 64. pp71-81.
Cook. N.G.W., Hoek, E., Pretorius, J.P.G.,Ortlepp, W.D., Salamon, M.D.G., 1966, Rock
mechanics applied to the study of rockbursts, 1.S. Afr. [nst. of Min. Metall., 66,
pp.435-528.
Cox, 5.1.0.. Meredith. P.G., [993. Microcrack fonnation and material softening in rock
measured by monitoring acoustic eroissions, Int. J. Rock Mech. Min. Sei. and
Geomech. Abstr.. 30. 11-24.
R-3

•
•
References
Crouch. S.L.. 1974. Analysis of rockbursts in cut-and-fill stopes. Trans. SME-AIME.
vo1.256. pp.298-3D3.
CRRP. 1996. A comprehensive summary of five years of collaborative research on
rockbursting in hard rock mines. CAMIRO Mining Division. Canadian Rockburst
Research Program.
Culien. M.. 1988. Studies of Destress Blasting at Campbell Red Lake Mine. M.Sc.
Thesis. McGill University.
Daihua. Z.. Miller. H.D.S.. 1987. A proposed mechanism of rock failure and
rockbursting. Proc. 6th Int. Congo On Rock Mech.• Montreal, 1357-1362.
Davidge. G.R.• Martin. T.A. and Steed. C.M.. 1988. Lacing support trial at Strathcona
Mine. Proc. 2nd Symp. Rockbursts and Seismicity in ~lines. Minneapolis.
Dickout. M.H.. 1962. Ground control at Creighton Mine of the International Nickel
Company of Canada Limited. Proc. 1st cano Rock Mech. Symp.. McGill University.
Montreal. pp.121-139.
Diest. F.H.. 1965. A non-linear continuum approach to the problem of fracture zones and
rockburst. J.S.Afr. [nst. Min. Metall.. 65. pp.502-522.
Evan, B.. Fredrich. J.T.• Wang. T. 1990, The briule-ductile transition in rocks: Recent
experimental and theoretical progress. The Briule-Ductile Transition in Rocks: The
Heard Volume, Duba. et al. (eds). American Geophysical Union. Washington. D.C.
Filcek. H.. 1980. Geornechanical criteria of rockburst hazard. Zeszyty Naukowe AGH.
G6rnictwo no. 4. Krak6w. (cited from Tajdus et al. 1997).
Gay. N.G.• Spencer. D.. Van Wyk, J.1 .. Van Der Heever, P.K.• 1982. The control of
geological and mining parameters on seismicity in the Klerksdorp Gold Mine
District. Proc. of Symp. On Seislnicity in Mines. S. Afr. Nat. Group on Rock
Mech., paper 3.
Gibowicz. S.1., 1990, Keynote lecture: The rnechanism of seismic events induced by
mining-A review, Rockbursts and Seismicity in Mines. Fairhurst (ed.), Balkema. 3
27.
R-4

•
•
References
Gibowicz, S.1., Kijiko, A., 1994, An Introduction to Mining Seismology, Academie Press
Ine., International Geophysics Series, Vol. 55, ISBN 0122821203.
Gill, D.E., Aubertin, M. and Simon, R., 1993, A practical engineering approaeh to the
evaluation of rockburst potential. Rockbursts and Seismieity in Mines, Young(ed.),
Balkema, Rottedam. ISBN 9054103205, pp.63-68.
Gill. D.E.. Aubertin. M.. 1988. Évaluation du potentiel de coups de terrain dans les mines
d'Abitibi. Rapport de recherche de l'URSTM présenté à l'Institut de Recherche en
Santé et Sécurité du Travail (lRSST).
Glazer. S.N., 1997. Applied mine seismology: A Vaal Reef perspective. Rockbursts and
Seismicity in Mines. Gibowicz and Lasocki (eds). Balkema. 69-73.
Hakami, H., 1988, Post-failure behaviour of brittle rock. Doctoral Thesis. Lulea
University of Technology. Suède.
Hakami. H.. Kankkunen. J.. Q'Flaherty. T. and Olsson. M.. 1990. Destress Blasting
Experimems at the Pyhasalmi Mine. Finland. Report DS 1990 :3. SveDeFo.
SlOckholrn. Sweden.
Hanson. O.• Quesnel. W .. and Hong, R.. 1987. Destressing a rockburst prone crown
pillar. CANMET MRL 87-82(TR).
Hasegawa. H.S.. Wetmiller, RJ., Gendzwill. 0.1., 1989, Induced seismicity in mines in
Canada-An overview, Pure and Appl. Geophysics, 129,423-453.
Hedley. D.a.F., 1991. A five-year review of the Canada-Ontario industry rockburst
project, CANMET Special Report SP90-4E.
Hedley, D.a.F.. 1992, Rockburst Handbook for Ontario Hardrock Mines, CANMET
Special Report SP92-IE, ISBNO-660-14549-9.
Hedley. D.a.F.. and Whitten. N.. 1983. Performance of bolting systems subject to
rockbursts. CIM Seminar Underground Support Systems. Sudbury. CIM Special
volume 35. pp.73-79.
R-S

•
•
References
Hedley, D.G.F., Udd. J.E., 1987, The Canada-Ontario-industry rockburst project, Fred
Leighton Memorial Workshop on Mining Induced Seismicity, ISRM-CIM,
Montreal, 115-127.
Hill, F.G., and Plewman, R.P., 1957, Destressing: a means of ameliorating rockburst
conditions: Part2: implementing destressing with a discussion of the results so far
obtained, J.S. Afr. Inst. Min. Met., October. 1957.
Hoek, E., & Bieniawski, Z.T., 1965b, Fracture propagation in hard rock, Technical
Report- Rock Mech, Div., South A frican Council for Scientific and Industrial
research.
Hoek. E.. & Bieniawski.Z.T., 1965a, Brittle fracture propagation in rock under
compression. Int. J. Frac. Mech.. 1. 137-155.
Hoek. E.. and Brown E.T.. 1980. Underground Excavations in Rock. [nst. Min. and
Metal1.. London.
Hodgson, K. and Joughin. N.C. 1967, The relationship between energy release rate.
damage and seismicity in deep mines. Proc 8lh Symp. on Rock Mech.. University of
Minnesota. In Failure and Breakage of Rock. C. Fairhurst (Ed). pp. 194-203.
Hucka. V., Das, B.. 1974. Brittleness detennination of rocks by different methods. Int. J.
Rock Mech. Min. Sei. & Geomech. Abstr., 30, 257-269.
HueckeI. T., 1987. Hysteresis evolution and failure in cyclic loading of dilatant rocks.
Constitutive Laws for Eng. ~laterials: Theory and Applications. Desai C.S. et al.
(ed.), Elsevier Science Pub.. 565-572.
Jeager, J.C., Cook,N.G.W., 1976, Fundamentals of Rock Mechanics, 2nd Edition,
Champman and Hall, ISBN 0-470-15063-7.
Karwoski, W. J., McLaughin, W. C. and Black, 1979. Rock preconditioning to prevent
rock bursts-report on a field demonstration. Report of investigations 8381, United
States Department of the Interior. Bureau of Mines.
R-6

•
•
References
Krauland. N.. Soder, P-E.. 1991. Rock stabilisation by destress blasting - experiences
from Boliden mines (in Swedish), Rock Mechanics Meeting, BeFo. Stockholm.
Sweden.
Kidybinski. A.• 1981, Bursting Liability indices in coal, Int. J. Rock Mech. Min. Sci.. 18,
295-304.
Kijko, Andrzej, 1997, Keynote: Seismic hazard assessment in mines, Roekbursts and
Seismieity in ~1ines, Gibowicz & Lasocki(eds.)© Balkema. Rotterdam. [SBN
9054108908.
Landriault. D.. and Oliver. P.. 1992. The destress slot concept for bulk mining at depth.
Rock Support in Mining and Underground Construction. Kaiser & McCreath
(eds.)© Balkema. Rotterdam. ISBN 9054100443. pp.211-l17.
Lekhnitskii. S.G.. 1963. Theory of Elasticity of an Anisotropie Elastic Body. Julius J.
Brandstatter (ed.), Holden-Day. [ne.• San Francisco.
Lightfoot. N.. 1993. The use of numerical modelling in rockburst control. Rockbursts and
Seismicity in Mines. Young(ed.), Balkema. Rotterdam. ISBN 9054103205. pp.355
360.
Lightfoot. N.. Goldbach. 0.0.. Kullmann. D.H.• and Toper. A.Z.. 1996. Rockburst
control in the South African deep level gold mining industry, Proceedings of the 2nd
North American Rock Mechanics Symposium (NARMS 96). pp.295-303. Montreal.
Canada.
Lu. J.Y.. Wang, B. and Wang, C.M.. 1993. Application of numerical methods in
rockburst prediction and control. Rockbursts and Seismicity in Mines. Young (ed.).
Balkema, Rotterdam. ISBN 9054103205, pp361-366.
MacDonald, P., Wiles, T. and Villeneuve, T., 1988, Rock mechanics aspects of vertical
retreat mining at 2000m depth at Creighton Mine, CARE Univ. Newcastle-upon
Tyne. Pub. IMM.• London.
Martin, C. Derek, 1996, Brittle failure of rock materials: Test results and constitutive
model, Canadian Geotechnical Journal, vol. 33, No. 2. p378.
R-7

•
•
References
McCreath, O.R. and Kaiser, P.K., 1992, Evaluation of current support practices in burst
prone ground and preliminary guidelÏ!les for Canadian hardrock mines, Rock
Support in Mining and Underground Construction, Kaiser & McCreath (eds.), ©
Balkema, Rotterdam, ISBN 9054100443, pp.611-619.
McGarr. A., and Wiebols. G.A., 1977, Influence of mine geometry and closure volume
on seismicity in a deep level mine, Int. 1. Rock Mech. Min. Sci. Geomech., 14,
pp.139-145.
Mei, J., Lu, J., 1987, The phenomena, prediction and control of rockburst in China. Proc.
6th Int. Congo Rock Mech., ISRM, Vol. 2, pp.1135-1140.
Mitri, H. S., Hassani, F.P. and Kebbe, R.1993, A strain energy approach for the
prediction of rockburst potential in underground hard rock mines, Proc., 1st
Canadian Symp. on Numerical Modelling Applications in Mining and
Geomechanics. Montreal. March 27-30. pp. 228-239.
Mitri. B.S.. 1996a. Numerical modelling of mining-induced energy JO rockburst
problems. Workshop notes of 2nd North American Rock Mechanics Symposium
1996. Mitri et al. (ed.). Montreal. pp.I-I-I-19.
Mitri. H.S., 1996b. Study of rockburst potential at Sigma Mine, Val d'Or. Quebec using
numerical modelling, Final Report, p.129.
H.S. Mitri, B. Tang and R. Simon. 1999. FE modelling of mining-induced energy release
and storage rates. Transactions of SAIMM (South African Institute of Mining and
Metallurgy) Journal. Vol. 99(2): 103-110.
Morrison, R.G.K., 1942. Report on rockburst situation in Ontario mines, trans. Cano Inst.
Min. and Met.. 45, pp225-272.
Moruzi. G.A. and Pasieka. A.R.. 1964. Evaluation of a blasting technique for destressing
ground subject to rockbursting, 6lh V.S. Rock Mech. Symp.. Rolla. Missuri.
Moruzi. G.A., and Pasieka, A.R., 1969, Evaluation of a Blasting Technique for
Destressing Ground subject to Rock Bursting, Proe. 5th Canadian Symp. on Rock
Mech., Mines Branch, Queens Printer, Ottaw~ pp. 185-204.
R-S

•
•
References
Makuch. A., 1987. Rock mechanics at Campbell Red Lake Mine. Workshop on Mining
[nduced Seismicity, Montreal. pp. 181-188.
Makuch A., Neumann M., Hedley D.G.F., and Blake W., 1987, Destress blasting at
Campbell Red lake mine. Part 1: Rock Mechanics concepts of destressing pillars,
Part 2: Practical applications of pillar destressing at Campbell Mine, Part 3: An
instrumented destress blast of the 1604E crown pillar. CANMET, Elliot Lake
Laboratory, Report produced for CanadalOntario/industry Rockburst Research
Projeet, Report SP 87-8E.
Neyman, B., Szecowka, Z., Zuberek, W., 1972, Effective methods for tïghting rockburst
in Polish collieries, Proe. 51h [nt. Strata Control Conf.. 23.1-23.9.
O'Donnell. J.D.P., 1992, The use of destress blasting at [nco's Creighton Mine.
MASSMIN 92. Johannesburg. SAIMM, pp.71-74.
Obert. L.o Duvall, W.I.. 1967, Rock Mechanics and the Design of Structures in Rock,
John Wiley.
Oliver, P.. Wiles, T.. MacDonald. P. and D'Donnell, D.. 1987. Rockburst control
measures at [nco's Creighton Mine, Proc. 61h Conf. on Ground Control in Mining.
West Virginia.
Ortlepp. W.D., 1982, Rockbursts in South African Gold Mines: A Phenomenological
View, Proceedings of the 1SI international Congress on Rockbursts and Seismicity
in Mines. Gay & Wainwright(ed.), Johannesburg, 1982, ppI65-178.
Ortlepp. W.D., 1983. The Mechanism and Control of Rockbursts: Chapter 12: Rock
Mechanics in Mining Practice", Budavari (ed.), S. Afr. [nst. Min. Met.. ~Iono series
No. 5, pp. 257 - 282,
Ortlepp, W.D., 1984, Rockbursts in South African gold mines: a phenomenological view.
Int. Symposium on Rockbursts and Seismicity in Mines, South African Institute of
Min. Metall. Symp. Series No. 6, Johannesburg, pp.165-178.
Ortlepp. W.D., 1992, Invited lecture: The design of support for the containment of
rockburst damage in tunnels-An engineering approach~ Rock Support in Mining and
R-9

•
•
References
Underground Construction, Kaiser & McCreath (eds.)© Balkema, Rotterdam, ISBN
9054100443, pp.593-609.
Ortlepp, W.D., Stacey, T.R., 1994, Rockburst mechanisms in tunnels and shafts,
Tunnelling and Underground Space Technology, Vol. 9, No. 1, pp.59-65.
Pande. G.N.. Beer. G.. and Williams. J.R., 1990. Numerical Method in Rock Mechanics.
John Wiley & Sons Ltd.. ISBN 04719202215.
Paterson. M.S .. 1978. Experimental Rock Defonnation-The Brittle Field. Spinger-Verlag.
Petukhov, LM., 1987. Forecasting and combating rockbursts: recent developments. Proc.
61h Congo IRSM. Vol. 2, pp.1207-1210.
Petukhov. I.M., 1990, Theory of rockbursts and their classification. Rockburst-global
experience, paper presented at Fifth Plenary Scientific Session of Working Group
on Rockbursts of International Bureau of Strata Mechanics, pp.l-IO.
Plouffe. M.. Mottahed, P.. Lebel. D.. Côté. M., 1993, Monitoring of large mining induced
seismic events-CANMET/MRL's contribution, Rockbursts and Seismicity in
Mines, Young (ed.), Balkema. 393-397.
Roberts, M.K.S. and Brummer. R.K.. 1988. Support requirements ID rockburst
conditions. J. South African Inst. Min. Met.. vo1.88. No.3. pp97-104.
Robson. W.T., Adamson, J.C. and Seines, W.E., 1940, Rock-burst at Lake Shore Mines,
Trans. C.LM., vo1.43, pp7-30.
Rorke. A.J. and Brummer, R.K., 1988, The use of explosives in rockburst control
techniques, Proc. 2nd lnt. Symp. Rockbursts and Seismicity in Mines. Minneapolis.
A.A. Blkema, Rotterdam, pp.377-386.
Rorke, A.J., Cross, M., Van Antwerpen, H.E.F., and Noble, E., 1990, The mining of a
small up-dip remnant with the aid of preconditioning blasts. lot. Deep Mining
Conf.. Johannesburg, s.afr. Inst. Min. Met., Symposium Seires 10. pp. 765-774.
Roux. AJ .A.. Leeman, E.R..and Denkhaus, H.G., 1957. Destressing: a means of
ameliorating rockburst conditions. Part 1: The concept of destressing and the results
obtained from its applications, J. S.Afr. Inst. Min. Met., October 1957.
R-lO

•
•
References
Ryder, J.A., 1987, Excess shear stress (ESS): an engineering criterion for
assessingunstable slip and associated rockburst hazard, Proc. 6th Congo Rock Mech..
IRSM. Montreal, vol.2, 1211-1215.
Ryman-Lipinsky, W.K., Bakker. D., 1997. The developrnent of governrnent rockburst
and rockfall hazard monitoring system for South African mines, Rockburst and
Seismieity in Mines. Gibowiez and Lasocki (eds.), Balkema, 371-376.
Salarnon, M.D.G., 1964a, Elastic analysis of displaeements and stress induced by the
mining of seam or reef deposits-Part I, J. S. Afr. Inst. Min. MetalI.. 64. pp. 129
149.
Salamon, M.D.G., 1964b, Elastic analysis of displaeements and stress indueed by the
mining of seam or reef deposits-Part n, J. S. Afr. Inst. Min. Metall.. 64, pp.197
218.
Salarnon. M.D.G.. 1964c. Elastic analysis of displaeements and stress induced by the
mining of seam or reef deposits-Part [II, 1. S. Afr. [nst. Min. Metall.. 64. pp"+68
500.
Salarnon. M.D.G., 1970. Pillar stability/ instability and design of pillar workings. [nt. 1.
Rock Mech. Min. Sei., 7, pp613-631.
Salamon, M.D.G.. 1974, Rock Mechanics of Underground Excavations, Advances 10
Rock Mechanics, Proc. 3rd Congo Int. Soc. Rock Mech.. Vol. I-B, pp.951-1099.
Salarnon. M.D.G., 1984. Energy considerations in rock rnechanies: fundamental results.
J. S.Afr. [nst. Min. Metall .. Vol. 84. No. 8, pp.233-246.
Salarnon. M.D.G., 1993, Keynote address: Sorne applications of geomechanical
modelling in rockburst and related research. Rockbursts and Seismicity in Mines.
Young(ed.), Balkerna, Rotterdam. ISBN 9054103205, pp.297-309.
Salarnon, M.G.D., 1983, Rockburst hazard and the fight for its alleviation in South
African gold mines, Rockbursts: Prediction and Control, IMM, London, pp. 11- 36.
R-II

•
•
•
References
Scoble, M.J., Cullen, M. And Makuch, A, 1987, Experimental studies of factors relating
to destress blasting. 281h U.S. Symposium on Rock Mechanics, Tucson, Arizona,
USA
Scott, O.F., 1990, Relationships of geological features to seismic events, Lucky Fridy
Mine, Mullan, Idaho, Rockbursts and Seismicity in Mines, Fairhurst(ed.), Balkema,
Rotterdam.
Shao, I.F., Khazraei, R., 1996, A continuum damage mechanics approach for time
independent and dependent behaviour of brittle rock, Mechanics Research
Communications, Vo1.23, No. 3, pp.257-265.
Simon, R., 1999, Analysis ofFault-Slip Mechanisms in Hard Rock Mining, Ph.O. Thesis,
McGiIl University.
Simon, R., Aubertin, M. and Mitri, H. S., 1995, Evaluation of rockburst potential in hard
rock mines, 97th AGM of C.lM. and Rock Mechanics and Strata Control Session,
Halifax, Nova Scotia, Canada.
Simon, R., Aubertin, M., Auer, L., Gill, D.E., Labrie, O. and Mitri, H.S, 1998, A study of
destress blasting eifect on the rockburst potential of an underground mine in bard
rock. 3rd Nonh Amer. Rock Mech. Symp. NARMS'98, Caneun, 285-294.
Singh, S.P., 1989, Classification of mine workings according ta their rockburst
proneness, Mining Science and Technology, 8, 253-262.
Spottiswoode, S.M., 1990, Volume excess shear stress and cumulative seismic moments,
Rockbursts and Seismieity in Mines, Fairhurst (ed.), Balkema, pp. 39-43.
Srinivasan, C., Arora, S.K., and Yaji, R.K., 1997, Use of mining and seismological
parameters as premoDitors of roekbursts, lot. 1. Rock Mech. Min. Sei., Vol. 34,
No.6, ppl001-100S.
Stacey, T.R. and Page, C.R., 1986, Praetical Handbook for Underground Rock
Mechanies, Trans-Tech. Publ.
R-12

•
•
•
Re[ennces
Stacey, T.R., Ortlepp, W.D., and Kirste~ H.AD., 1995, Energy-absorbing capacity of
reinforced shotcrete, with reference ta the containment of rockburst damage,
lS.Afr. mst. Min. Metall., V. 95, n. 3, p137, 4p.
Starfield, A.M., Fairhurst, C., 1968, How high-speed computers advance design of
practical mine pillar systems, Engng. Min. l, 169, 78-84.
Starfield, AM., Wawersik, W.R., 1968, Pillars as structural components in room-and
pillar mine design, Proe. IOda US Sym. On Rock Mech., Austin, 783-809.
Stewarski, E., 1987, Energetic indicator ofliability ofroeks to burst during shock loading
with Hopkin's bar, Stanislaw Staszie Acad. Min. Metall., Cracow, Min. Bul., 129,
263-269.
Stopinski, W., Dmowska, R., 1984, Rock resistivity in the Lubin (poland) Copper Mine
and its relation to variations of strain field and occurrence of rockbursts, Proc. lit
lot. Congo Rockbursts and Seismicity in Mines, Johannesburg, S.Afr. Inst. Min.
Metall., 297-307.
Tajdus, A Flisiak, J., and Cala, M., 1997, Estimation of rockburst hazard basing on 3D
stress field analysis, Rockbursts and Seismicity in Mines, Gibowicz & Lasoeki(00.),
Balkema, Rotterdam, ISBN 9054108908, pp272-277.
Tan, T.K., 1986, Hypothesis on rockbursts, Proe.Inl. Symp. On Rock Stress and Stress
Measurements, ppS 15-520.
Tang CA, 1997, Numerical simulation of progressive rock failure and associated
seismicity, Int. 1. ofRock Mech. & Min. Sei. & Geomech. Abs., 34(2): 249 ff
Tao, Z.Y., 1988, Support design of tunnels subjeeted ta rockbursting, Rock Mechanics
and Power Plants, Romana (ed.), Balkema, 407-411.
Taube, A., Krauland, N., Ouchterlony, F. and Hakami, H. , 1991, Destress blasting in
Centralmine's (Boliden Group) Laisvall orebody (in Swedish), Report OS 1991 :
3G, SveDeFo, Stockholm, Sweden.
R-13

•
•
•
References
Toper, Al., Grodner, M., Stewart, R.D., Lightfoo~ N., 1997, Preconditioning: A
rockburst control technique, Roekbursts and Seismicity in Mines, Gibowicz &
Lasocki(ed.), Balkema, Rottedam, ISBN 9054108908, pp.267-272.
Toper, Al., Srewart, R.D., Kullmann, D.H, Grodner, M., Lightfoot, N., Janse v~
Rensburg, AL. and Longmore, PJ., 1998, Develop and implement preconditioning
techniques, CSIR, Division ofMining Technology, SIMRAC report, GAP 336.
Walsh, lB., 1977, Energy changes due to mining, Int.I. Rock Mech. Min. SeL, Vol. 14, pp.
25-33.
Wawersik, W.R., Rudnicki, J.W., otsson, W.A, Hotcomb, D.J., Chau, K.T., 1990,
Localisation of deformation in brittle rocks: Theoretical and laboratory
investigations, Micromechnics of Failure of Quasi-brittle Materials, Elsevier Appt.
Sei., 115-124.
Williams, T.J., and Cuvelier, 1988, Report on a field trial of an underhand longwatl
mining method to alleviate rockburst hazards, Proc. 2nd Int. Symp. Rockbursts and
Seismicity in mines, MiMeapolis, A.A. Balkema, Rotterdam, pp. 349 - 354.
Wittaker, B.N., Singh, R.N., and Sun, G.X., 1992, Roek Fracture Mechanics: Principle,
Design and Applications, ELSEVIER, Amsterdam-Landon-New York-Tokyo.
Wu, Y.K., and lhang, W.B., 1997, Prevention of rockbursts in coal mines in China,
Rockbursts and Seismicity in Mines, Gibowicz & Lasoeki(ed.), Balkema,
Rotterdam, ISBN 9054108908, pp.361-366.
Zipf, R.K., 1996, Simulation of caseading pillar failure in room-and-pillar mines using
boundary element method, Proceedings of 2nd North American Rock Mechanics
Symposium, Aubertin, Hassani, and Mitri (eds), Montreal, June 19-21, pp. 1887
1892
Yu, Y.S, Toews, N.A, Boyle, R., Vongpaisal, S., Wang, B., and Thomson, S, 1996,
Very large-scale 3-D modelling of mine structures using the finite element
technique. Rock Mechanics Tools and Techniques (NARMS'96), vol. 2, pp. 1871
1878.
R-14

•
•
APPENDIXA
BRICK ELEMENT SHAPE FUNCTION
For each corner node. it has its connection mid-side nodes. We put this relation into a
matrix NK(8.3). For C;/, 11..Ç, , we also can put them into a matrix CEZ(2ü,3) for 2ü-node
and a matrix CEZ1(8,3) for 8-node element. Corresponding to Figure 5.6. the matrices
can be arranged as follows:
-1. -1. 1.
-1. 1. 1.
1. 1. 1.
1. -1. 1.
-1. -1. -1.
-1. 1. -1.
1. 1. -l. \12 9 131. -1. -1. 1
10 9 14-1. O. l.
10 II 15O. 1. 1.
CEZ(20.3) = 12 Il 161. O. 1. NK(8.3) = (A.I)
20 17 13O. -1. l.
-1. -1. O.18 17 14
-1. O. 1.18 19 15
1. 1. O. 20 19 16
1. -1. O.-1. O. -1.
O. 1. -1.
1. O. -1.
O. -1. -1.

• -1
-1
1
1CEZl(S,3) =
-1
-1
1
1
For example,
-1 1
1 1
1 1
-1 1
-1 -1
1 -1
1 -1
-1 -1
Appendix A Brick Element Shape Funcrion
(A.2)
i= 1: ç1=CEZ( 1.1 )= -1.. 11 1=CEZ( 1.2)= - [ .• , 1=CEZ( 1.3)= -1.
Ir - 0 1'" - lit: - 1"") - • _12 - - • ~17 - - •
..:\ = 9 119 : -1.. B= 12 1112 _= O. . C= 17 71~7 ~-1.
'9 - -1. Çl! - -1. ~17 - O.
N It: r Il .. ! r 1 2 .t: r 1 1'11=8" (1- ~ )(1- 1] )(1- ~ )-2[4" (1- ç )(1- 11 )( 1- ~ )+ 4" (1- 1] )(1- ~ )(1- ~ )+ 4" (1- ~ )( 1-
ç}{I-TJ)]
= .!. ( 1- T] )( 1-ç )( 1- , )[ 1-( 1+; )-( 1+ TJ )-( 1+ç )]8
=.!.(1+ÇI ; )(1+77111)(1+'1 ')[;1 Ç+111 1]+'1 ç-2}8
For Î=6: ~6=CEZ(6.l)=1. 716=CEZ(6,2)=-1, Ç6=CEZ(6,3)=1
1;13 = O.
A= 13 '113 = -1. ,
'13 = 1. 1t: - 1
"14 - •
B= 14 7114 =O.•
'14 =1
•
1): r 1 1):, ri,.. 1N6=-(l+~ )(l-TJ)(l+~ )--[ -(l-~ - )(1-11)(1+~ )+-«(1-77 - )(1+; )(1+()+-1-
8 2 4 4 4
, 2 )( 1+; )(1- 11 )}
=i (1+ Ç)( 1- r1l(1+ç )[; -1J+ç -2]
A-2

•
•
Appendi:c A Brick Element Shape Function
After calculated each corner node' s shape function we find that
Now we can get the derivatives of shape function to ç,1] ,ç respectively
For i =1,8
1N,.!, = g;'(1 + 1],11)(1 +ç,Ç)[2Ç.; +11,11+Ç" -1]
N,~ = ~7), (1 +ç,ç)(I+Ç,Ç)[ç,ç + 27),7) +ç,ç -1]
N,; =iç,(1 +ç,ç)( 1+ 7),7) )[ç,ç + 7),7) + 2Ç,Ç -1]
For i = 13, 16
1N L !, =-2; (1+11,1])(I+Ç,Ç)
N,,~ =±7), (1- ç ')(l + Ç,Ç)
N,; = ±ç,(1- ç ')(l + Tl, Tl)
Fori = 10, 12.20,18
N,~ = - ~ Tl (1 + ç,Ç)(I + ç.Ç)
N,,; =~ Ç, (1-7)')(1 +ç,ç)
For i = 9, 11, 19, 17
(A.3)
(A.4)
tA.5)
(A.6)
A-3

•
•
Appendi:c A Brick Element Shape Function
N". = ~ Tl, (1- Ç')(I +ÇiÇ)
1NI.; = -"2'0 + ~i~)(l + 71;11)
(A.?)
A.4

•
•
APPENDIXB
USERS GUIDE TO e-z tools 3D
A.t STRUCTURE OF THE INPUT DATA FILE
[n this appendix. the preparation of input data file is explained in detail. When the input
data are prepared. all the information needed is ail weil arranged into the input data file
with the following format.
Card 1: NND, MM, NEC, NCUT, NIS, NGW, NCA:
• NND: total number of nodes;
• ~1l\'1: total number of the elements;
• NEC: total number of materials:
• NCUT: number of eut sequences;
• NIS: initial stress indicator: O-without initial stress, l-with initial stress:
• NGW: gravity indicator:
O-without gravity.
l-gravity along Z-positive.
2-y -positive.
3-X-positive,
4-Z-negtive,
5-y -negtive,
6-X-negtive:
• NCA: local node numbering system. I--normal 10-oode. 2--Hyper~lesh lO-node. 3-
8-node element.
Card 2: IGS, (OS, (MS, NCOM, NSR
• IGS: indicator for the equation solver, l-OS-Seidel, 2-Skyline;
• IDS: indicator for destress blasting, O-without destress, 1 with destress blasting;

•Appendix B Users Guide ra e-z lools 3D
• !MS: indicator for the material number in the destressed zone, it should always equal
to the material number for the destressed zone;
• NCOM: total number of components.
• NSR: surface traction indicator, O-without surface traction. l-with surface traction.
Card 3: Nl\'1AT (NCOM):
Array used to defi ne the number of material for each component, when it equals to zero
that means the element is being eut in the eut.
Card 4: NK, X (NK), Y (NK), Z (NK):
• NK: node number:
• X(NK). Y(NK). Z{NK)-coordinate of the node
CardS: ~IAN, (ECS (1), 1=1,10):
• MAN: material number,
• ESC( 1): E, Elastic modulus on x direction;
• ESC(2): Ev Elastic modulus on y direction;
• ESC(3): Ez Elastic modulus on z direction;
• ESC(4): G,y Shear Modulus on xoy plane:
• ESC(5): G yz Shear Modulus on yoz plane:
• ESC(6): Gu Shear Modulus on zox plane:
• ESC(7): v n Poisson's ratio on xoy plane:
• ESC(8): v \: Poisson's ratio on yoz plane:
• ESC(9): v t= Poisson's ratio on zox plane;
• • ESC( 10): r unit weight of the rock material.
8-2

•
•
Appendi.t B Users Guide 10 e-z lools 3D
Card 6: (SIGMA(I),I=I,6), 0, <p:
• SIGMA(I): initial stresses array at the original point
8: strike describes the direction of a contour
<p: dip describes the slope of the Hne of the dip on the local plane relation to the
global coordinale system, refer to Figure 5.3.
Card 7: (FB(I), 1=1,6):
Coefficient array for stress ratio: nonnally FB(I)=O.5-2.5, FB(2)=O.5-2.,FB(3)= 1., FB(4)
=FB(5) =FB(6) =O.
Card 8: CC, 51\'1, 5S, FAI, SIGC:
• CC: Coherent force of the material;
• SM: geomechanical constant m for RMR.
• SS: geomechanical constant s for R!\ltR.
• FAI: friction angle;
• SlGC: uniaxial compress strength
Card9: ALPHA(I),I=I,9): (Rock fragmentation factors array, O. to 1.0), (if
necessary):
Card 10: (BETA(I),I=1,6): (stitTness factors array, 1.0 to 0.0), (if necessary):
Card Il: (ME, MAN, (NN(I), I=I,m): (m=20 for 20-node element, m = 8 for 8-node
element)
• ME: element number;
8-3

•Appendi:c B Users Guide CO e·z. tools 3D
• MAN: material number;
• NN(I): element node number connectivity array
Card 12: NK, (NCON(I),I=I,J):
• NK: node number,
• NCON(D: node constraints array,O-free, l-fixed
Card 13: NTOT (if necessary):
• NTOT: total number of node suffering surface traction
Card 14: NK, (P (i), i =1,3) (if necessary):
• NK: node number
• P(I): Nodal surface stress suffered
B.2 SCENARIO FOR THE GLOBAL STIFFNESS l\'IATRIX
In skyline format, the global stiffness matrix will be stored in three arrays: S(NMT),
MDIA(N+ 1), and MHT(N), in which the NMT is the total size of the skyline format
global stiffness matrix, N is the total numher of rows or columns of the matrix. and
MDlA(l) is the diagonal element position in the skyline format for global stiffness
matrix, MHT( D is the column height in skyline format for global stiffness matrix.
Referring to Figure A-l, the upper triangle of a symmetric matrix will be store in the
format as in Table A-l, and the Iower triangle of it will be stored in the format as in Table
A-2.
T bl BISk r f< ~ tha e - ~y me onnat or e upper tnan~ e symmetnc matnx1 2 3 4 5 6 7 8 9 10 Il 12 13 14 15 16 17 18 19 20 21 22 23
S(I) x. x. x 0 Ox x 0 0 Ox. x x Ox. x. x x x x. x. x x
MDLA\(I) 1 3 7 12 16 18 21 23 24MHT(1) l 3 4 3 l 2 1 0
• B-4

~ th 1Table B-2 Skylïne ormal or e ower lnan~:e symmetnc matnx1 2 3 4 5 6 7 8 9 10 11 12 13 14 15 16 17 18 19 20 21
S(I) x x 0 0 x x 0 x x x x x 0 0 x x 0 x x x xMDlA(1) 1 6 9 10 12 16 19 21 22MHT(l) 4 2 0 1 3 2 l 0
Appendi:c B Users Guide to e-% 'Dols 3D
•The Sparse Linear Aigebra Package (SLAP) utilizes two matrix data structures: 1) the
SLAP Triad format or 2) the SLAP Column fonnat. In the e-z tools 3D the SLAP
TRIAD fonnat has been used.
In the SLAP Triad format, only the non-zeros are stored. They may appear in ANY
order. Three arrays of length NELT, where NELT is the number of non-zeros in the
matrix: (IA(NELT), JA(NELT), A(NELT» are employed. For each non-zero the row
and column index of that matrix element will be stored in the lA and JA arrays. The
value of the non-zero matrix element is placed in the corresponding location of the array.
This is an extremely easy data structure to generate. On the other hand it is not too
efficient on vector computers for the iterative solution of linear systems. Hence. SLAP
changes this input data structure to the SLAP Column format for the iteration (but does
not change it back). Here is an example of the SLAP Triad storage format for a 5x5
Matrix. Recall that the entries may appear in any order.
5x5 Matrix SLAP Column fonnat for 5x5 matrix on left
11 12 0 0 15 2 3 4 5 6 7 8 9 10 11
21 22 0 0 0 A: 11 21 51 22 12 33 53 44 55 15 350 0 33 0 35
lA: 2 5 2 3 5 4 5 30 0 0 44 0
51 0 53 0 55 lA: 2 2 3 3 4 5 5 5
• B-5

Appendix B Users Guide 10 e-z lools 3D
•~O 0 0 0 0 0
lx 0 0 il 0 0 0
lx 0 0 0 iL Olx X 0 iIl 0
QO 0
a) Upper Triangle Skyline
x
~~[!)o ~~ 0t
ooooo~o 0 0 0 0 X
o 000 t t X X
b) Lower TriangleSkyline
•
Figure 8-1 Skyline storage strategy for global stiffness matrix
8-6

• APPENDIXC
POTENTIAL ENERGY
Based on the relationship between the stresses and the strains in the element and the
nodal point displacements, the equation of condition for the nodal point displacements
can be established.
The potential energy of an element rte is comprised of the elastic strain energy and the
work of the bulk, distributed and point loads on the element. The elastic strain energy in
relation to an element of volume is obtained from half of the product of the stress and the
elastic strain. Thus the following is obtained for the element for the element under
consideration:
The quantilies in Equation 5.-l3 are defined as follows:
{tla} = {cr} - {ao). {au} is the initial stress vector in the element.
{o} = {u. v. w} T
{pl = (px, py. pz}T:
{q} =(qx,qy.qz}T:
Displacement vector
bulk force per unit volume, e.g. dead weight.
distributed load per unit area.
point loads applied to nodal points of element.
Vr: = volume of element. Sc =surface of the element.
Using Equation 5.37. Equation 5.43 can be changed inta Equation 5.44 which the only
unknowns are the nodal displacements Ui. Vi. wi. i =1. ffi.
•Jr~ =.!-( f{<5~r[Bf [D]· [B]. {c5~ }. dV - f{cS~r[Br{ail}. dV)
2 v' v"
- f{c5" i [N f .{p}. dV - J{cS"Y{N 1Y.{q ]ds - {cS"Y{F· }v s'
(C.2)

•:\ppendi:c C Palencial Energy
Applying the minimum potential energy theory here, the following vector can be
obtained:
•
arr'aU I
alt'dlt' aVI
aw1= alt' =0aw1
arr'-aw,"
Carrying the differentiation gives
:{;:}=.[[Bf[D).[Bl dV{8'}- pBr {u"}1v
- f[Nf {P}.dV - f{N'] {q}·dS -{F-}=O\" s'
(C.3)
(CA)
C-2
Recommended