INTRODUCING IFC AND THE
ITALY-IFC ENERGY ACCESS
PARTNERSHIP MARKET TRENDS WORKSHOP: EXPLORING
OPPORTUNITIES FOR ITALIAN COMPANIES
Russell Sturm
Marco Indelicato
Stratos Tavoulareas
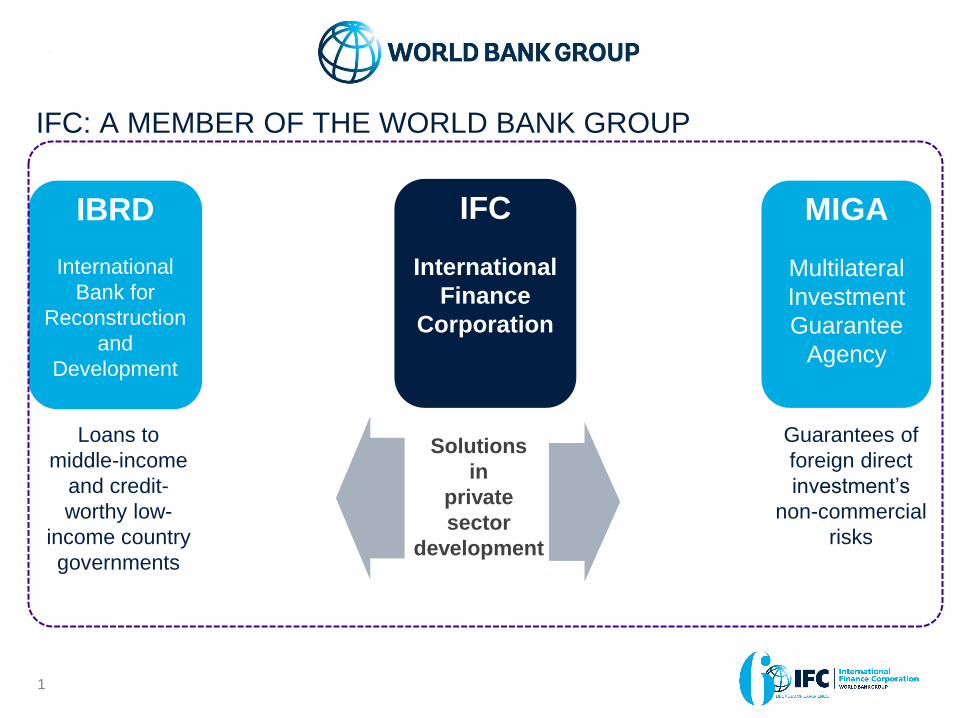
IFC: A MEMBER OF THE WORLD BANK GROUP
1
Guarantees of
foreign direct
investment’s
non-commercial
risks
Loans to
middle-income
and credit-
worthy low-
income country
governments
Solutions
in
private
sector
development
IBRD
International
Bank for
Reconstruction
and
Development
IFC
International
Finance
Corporation
MIGA
Multilateral
Investment
Guarantee
Agency
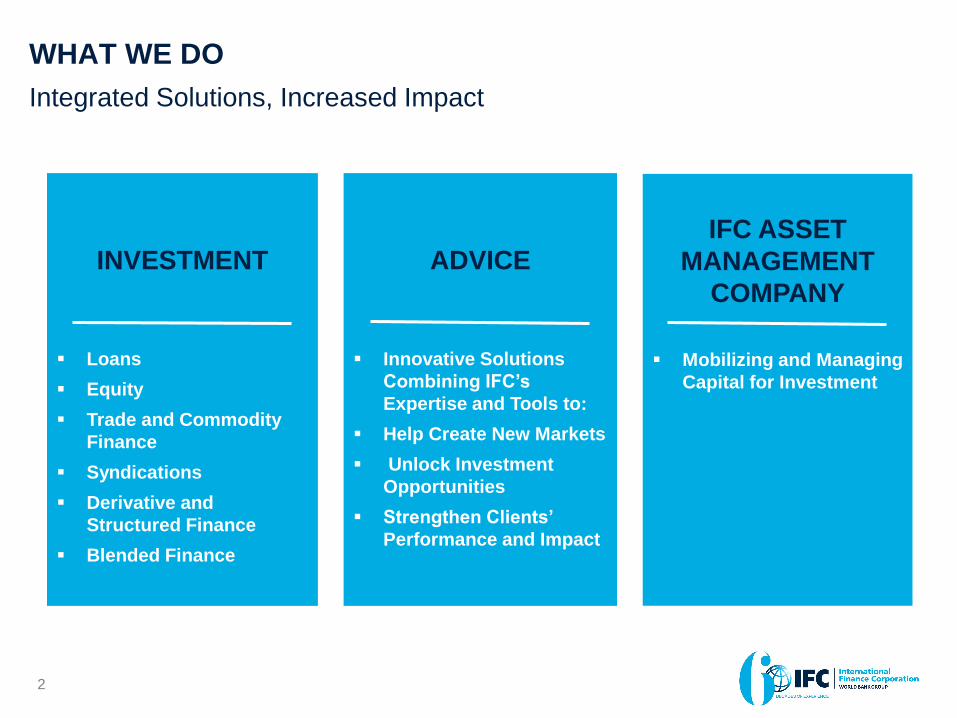
WHAT WE DO
Integrated Solutions, Increased Impact
2
INVESTMENT
Loans
Equity
Trade and Commodity
Finance
Syndications
Derivative and
Structured Finance
Blended Finance
ADVICE
Innovative Solutions
Combining IFC’s
Expertise and Tools to:
Help Create New Markets
Unlock Investment
Opportunities
Strengthen Clients’
Performance and Impact
IFC ASSET
MANAGEMENT
COMPANY
Mobilizing and Managing
Capital for Investment
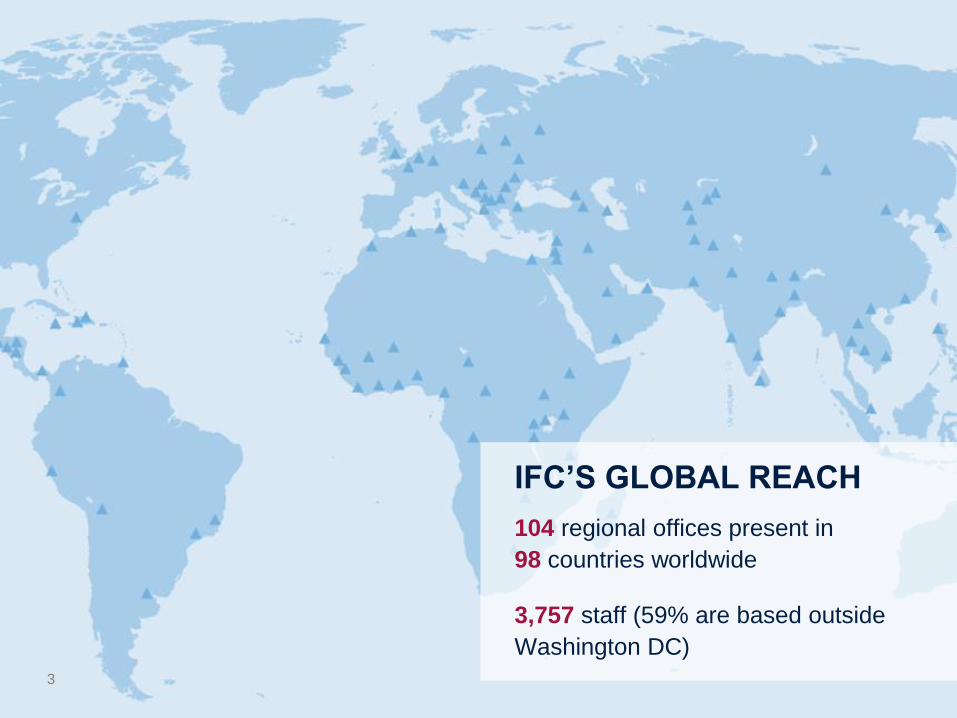
IFC’S GLOBAL REACH
104 regional offices present in
98 countries worldwide
3,757 staff (59% are based outside
Washington DC)
3
4
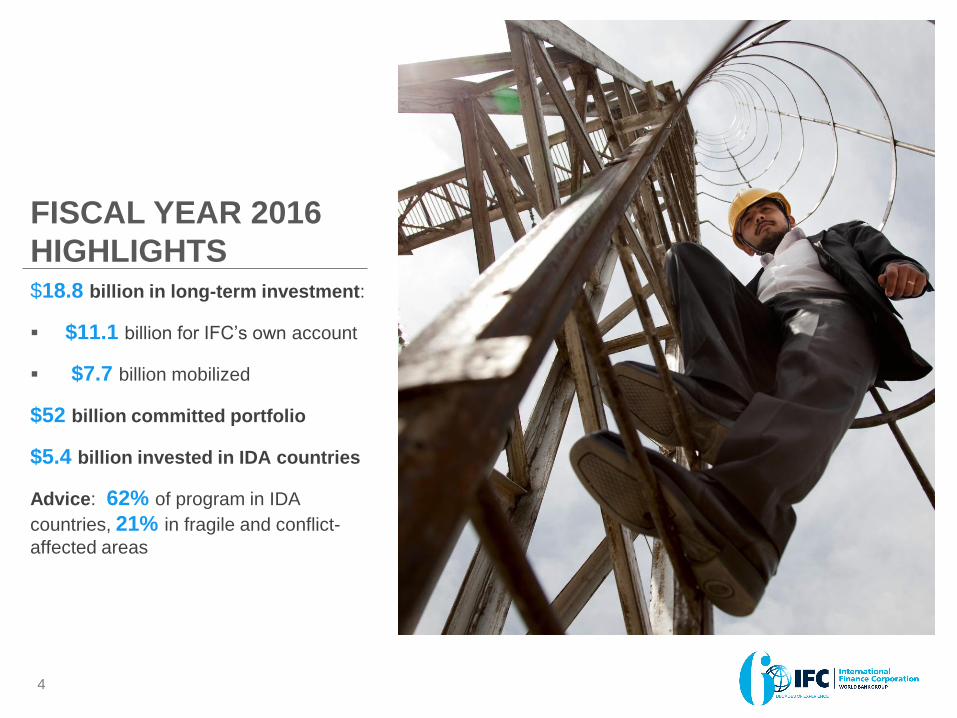
$18.8 billion in long-term investment:
$11.1 billion for IFC’s own account
$7.7 billion mobilized
$52 billion committed portfolio
$5.4 billion invested in IDA countries
Advice: 62% of program in IDA
countries, 21% in fragile and conflict-
affected areas
FISCAL YEAR 2016
HIGHLIGHTS
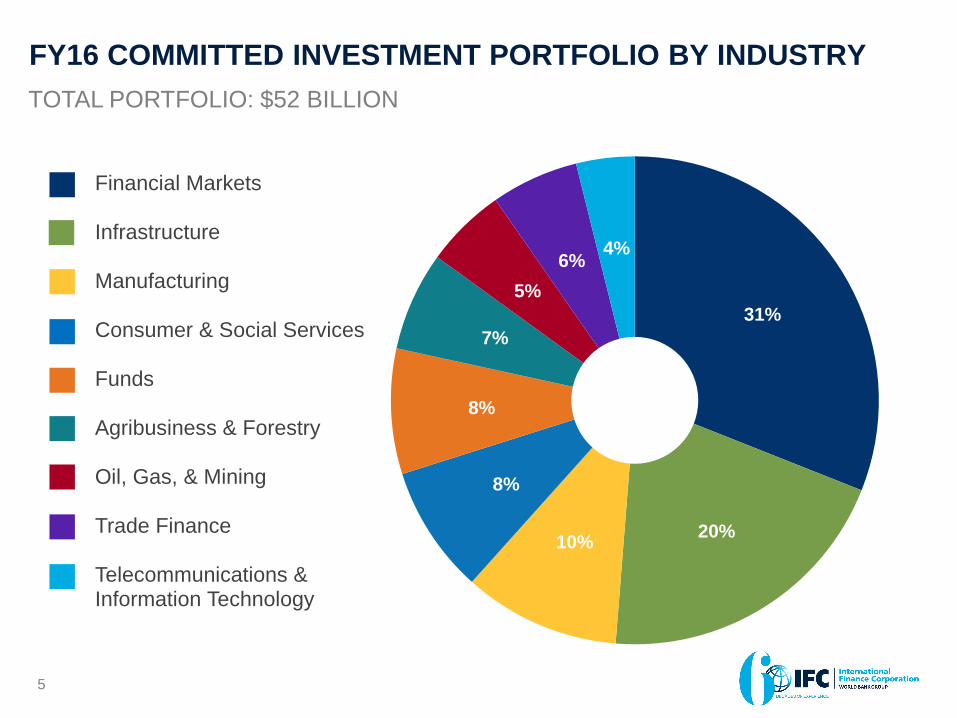
31%
20% 10%
8%
8%
7%
5%
6% 4%
Financial Markets
Infrastructure
Manufacturing
Consumer & Social Services
Funds
Agribusiness & Forestry
Oil, Gas, & Mining
Trade Finance
Telecommunications & Information Technology
FY16 COMMITTED INVESTMENT PORTFOLIO BY INDUSTRY
5
TOTAL PORTFOLIO: $52 BILLION
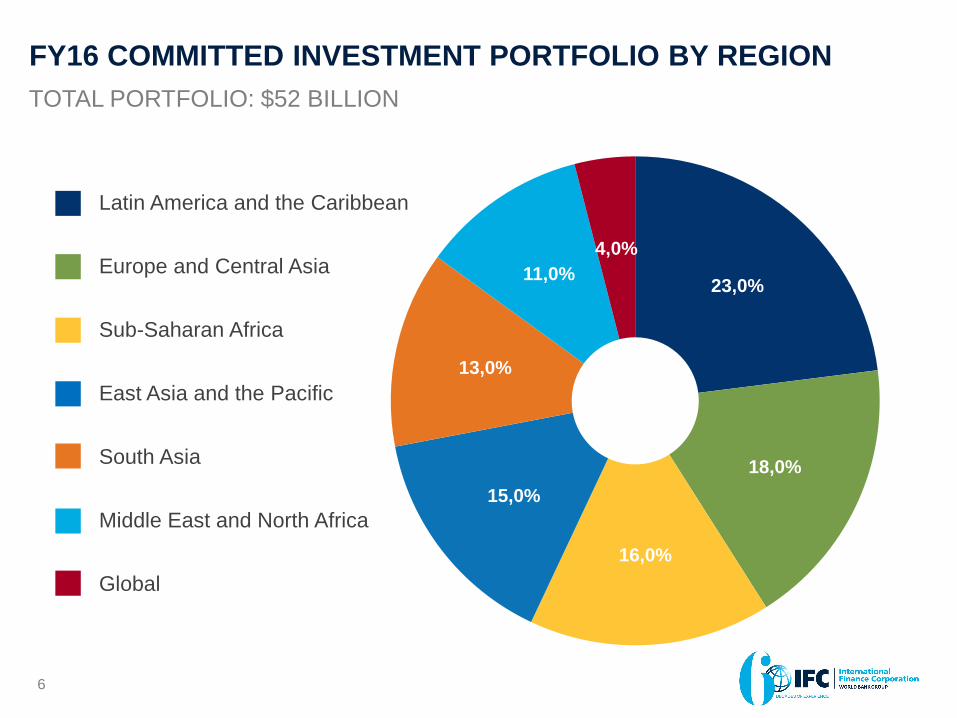
23,0%
18,0%
16,0%
15,0%
13,0%
11,0%
4,0%
Latin America and the Caribbean
Europe and Central Asia
Sub-Saharan Africa
East Asia and the Pacific
South Asia
Middle East and North Africa
Global
FY16 COMMITTED INVESTMENT PORTFOLIO BY REGION
6
TOTAL PORTFOLIO: $52 BILLION
SETTING THE SCENE: EMERGING
BUSINESS OPPORTUNITIES FOR
ENERGY SERVICES
• Massive needs
• Established (but dysfunctional) markets
• Emerging opportunities driven by technology and
business innovation
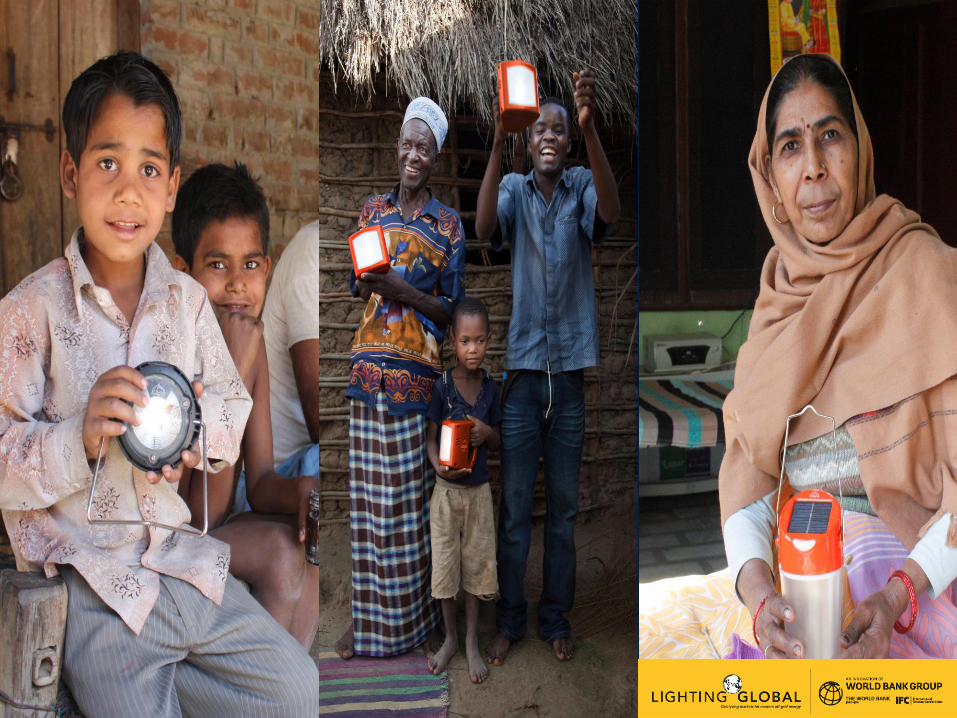
Lighting Global:
The Gov’t of Italy-IFC
Energy Access Partnership Enabling the Solar Off-Grid Energy
Industry To Address An Intractable
Global Problem Rome Workshop for
Italian Companies
October 27, 2016
Russell Sturm
Global Head
Energy Access
International Finance Corporation
9
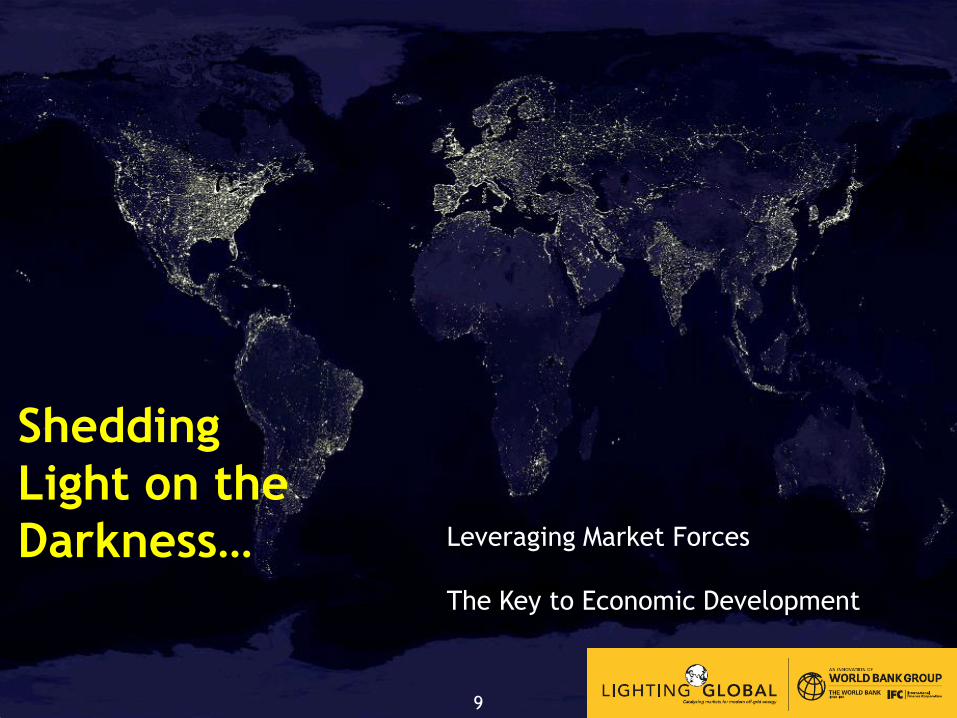
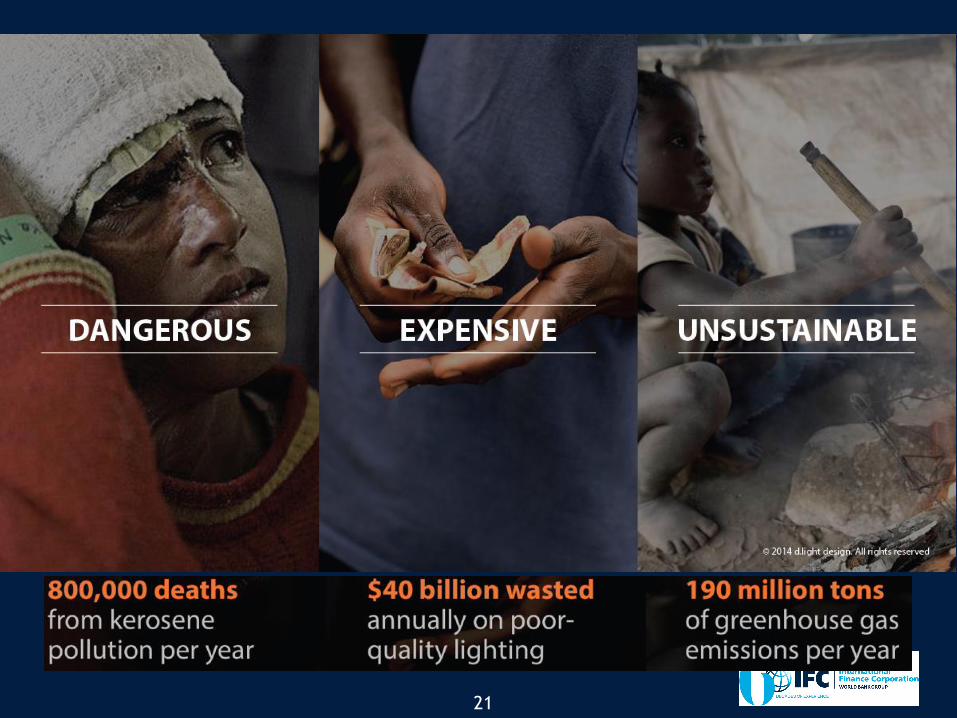
Shedding
Light on the
Darkness… Leveraging Market Forces
The Key to Economic Development
9
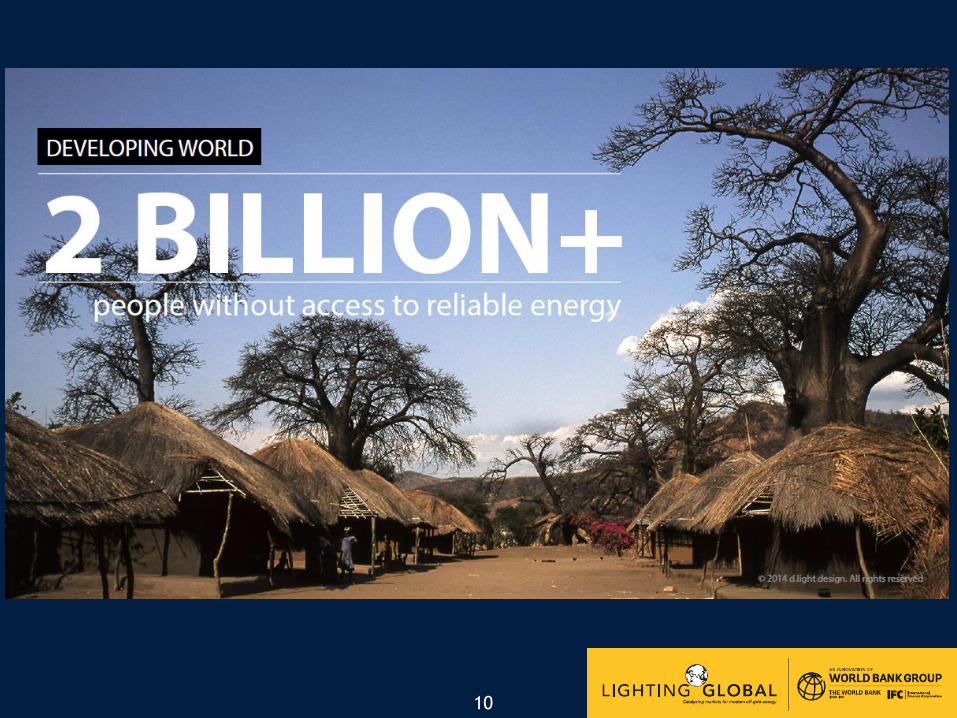
10
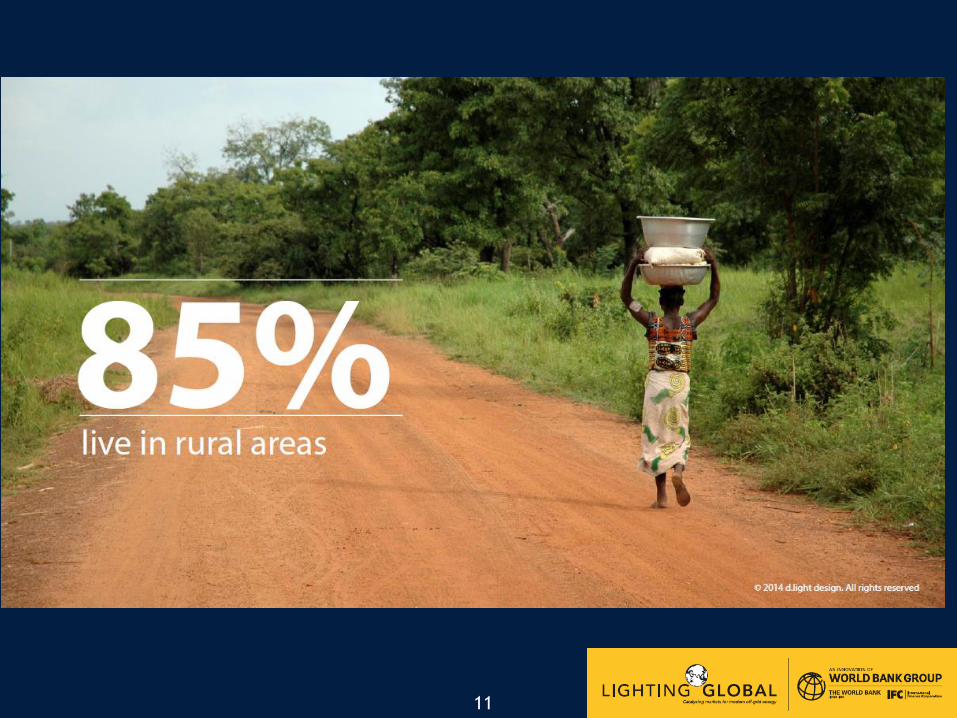
11
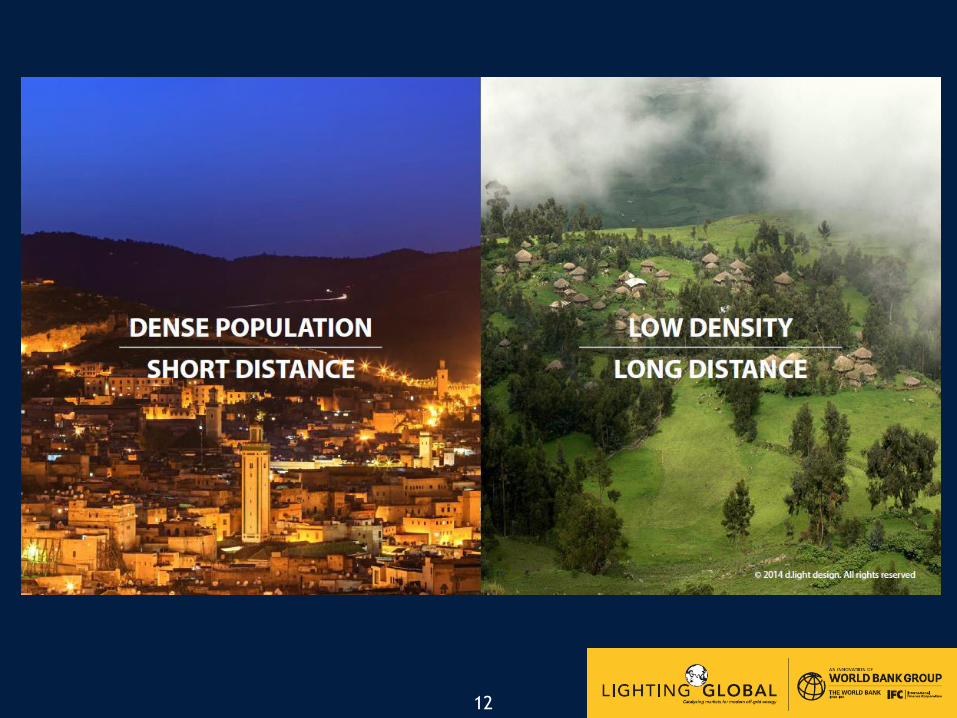
12
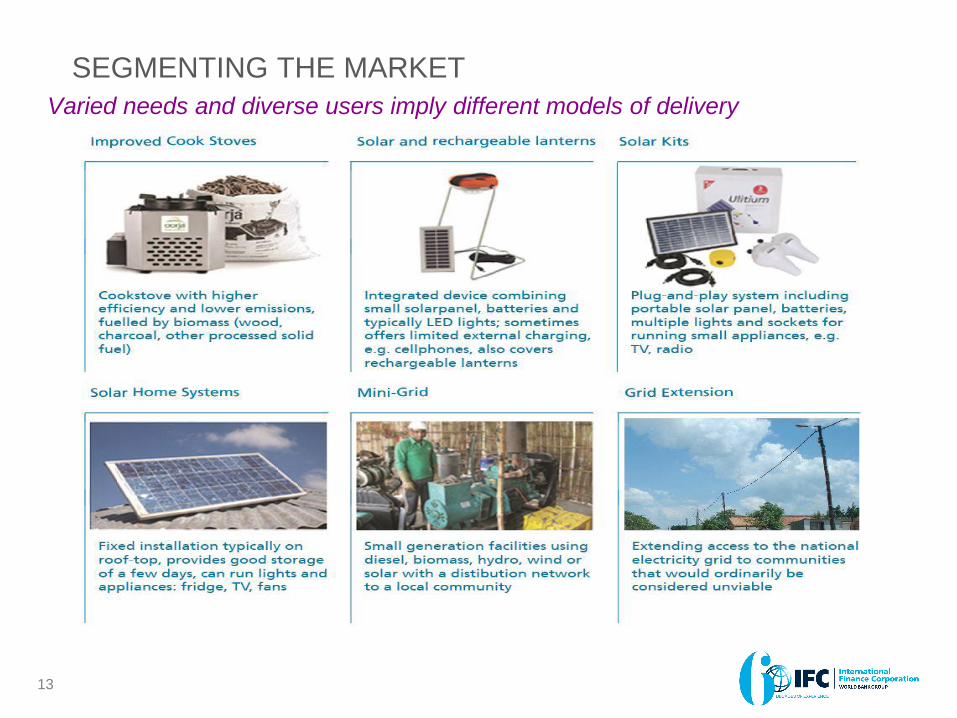
SEGMENTING THE MARKET
Varied needs and diverse users imply different models of delivery
13
$700 BILLION
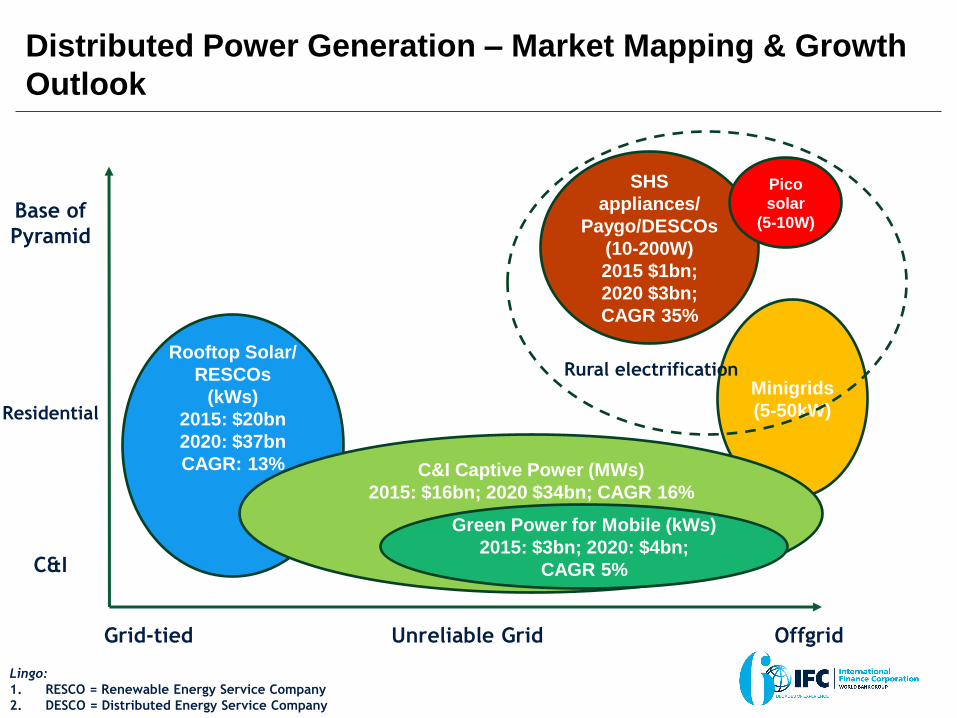
Grid-tied Unreliable Grid Offgrid
Base of
Pyramid
Residential
C&I
SHS
appliances/
Paygo/DESCOs
(10-200W)
2015 $1bn;
2020 $3bn;
CAGR 35%
Pico
solar
(5-10W)
Rooftop Solar/
RESCOs
(kWs)
2015: $20bn
2020: $37bn
CAGR: 13%
Distributed Power Generation – Market Mapping & Growth
Outlook
Minigrids
(5-50kW)
C&I Captive Power (MWs)
2015: $16bn; 2020 $34bn; CAGR 16%
Green Power for Mobile (kWs)
2015: $3bn; 2020: $4bn;
CAGR 5%
Rural electrification
Lingo:
1. RESCO = Renewable Energy Service Company
2. DESCO = Distributed Energy Service Company
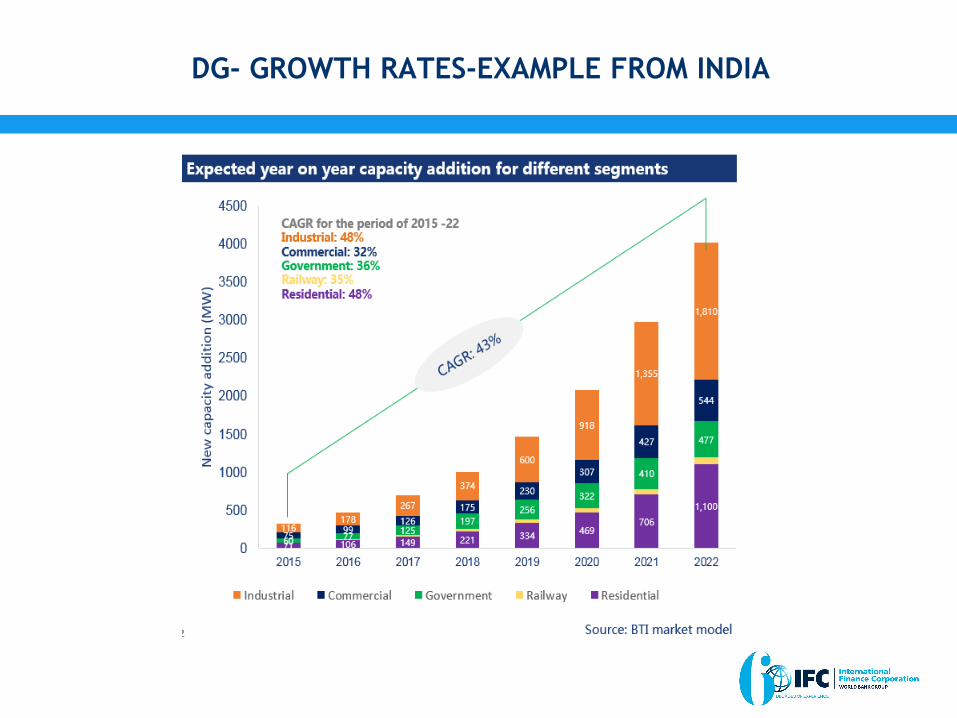
DG- GROWTH RATES-EXAMPLE FROM INDIA
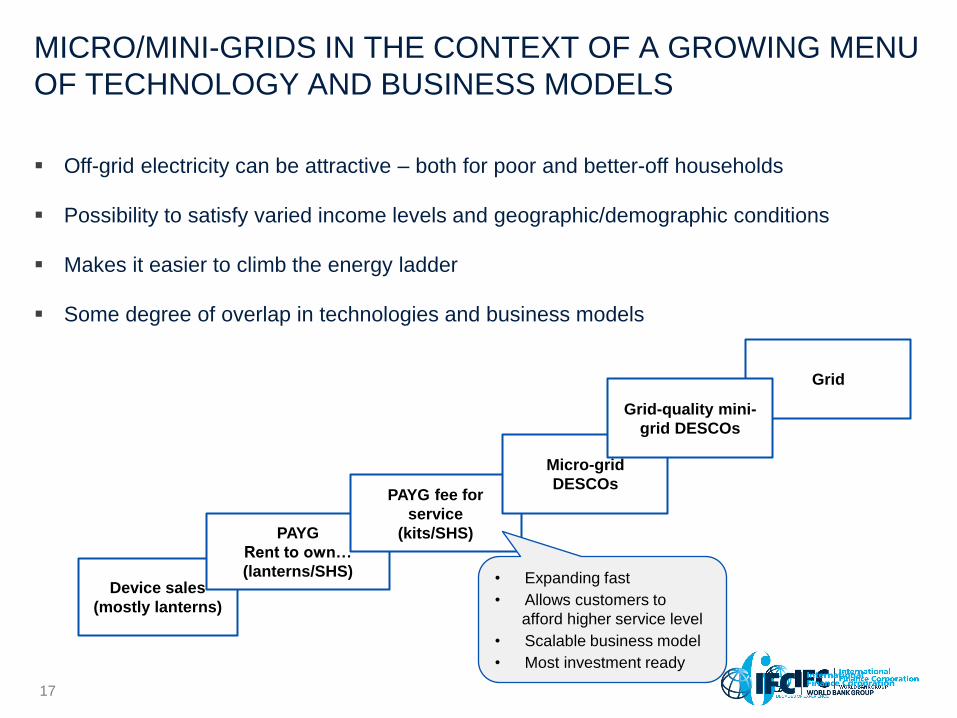
MICRO/MINI-GRIDS IN THE CONTEXT OF A GROWING MENU
OF TECHNOLOGY AND BUSINESS MODELS
Off-grid electricity can be attractive – both for poor and better-off households
Possibility to satisfy varied income levels and geographic/demographic conditions
Makes it easier to climb the energy ladder
Some degree of overlap in technologies and business models
Grid
Device sales
(mostly lanterns)
PAYG
Rent to own…
(lanterns/SHS)
PAYG fee for
service
(kits/SHS)
Micro-grid
DESCOs
Grid-quality mini-
grid DESCOs
• Expanding fast
• Allows customers to
afford higher service level
• Scalable business model
• Most investment ready
17
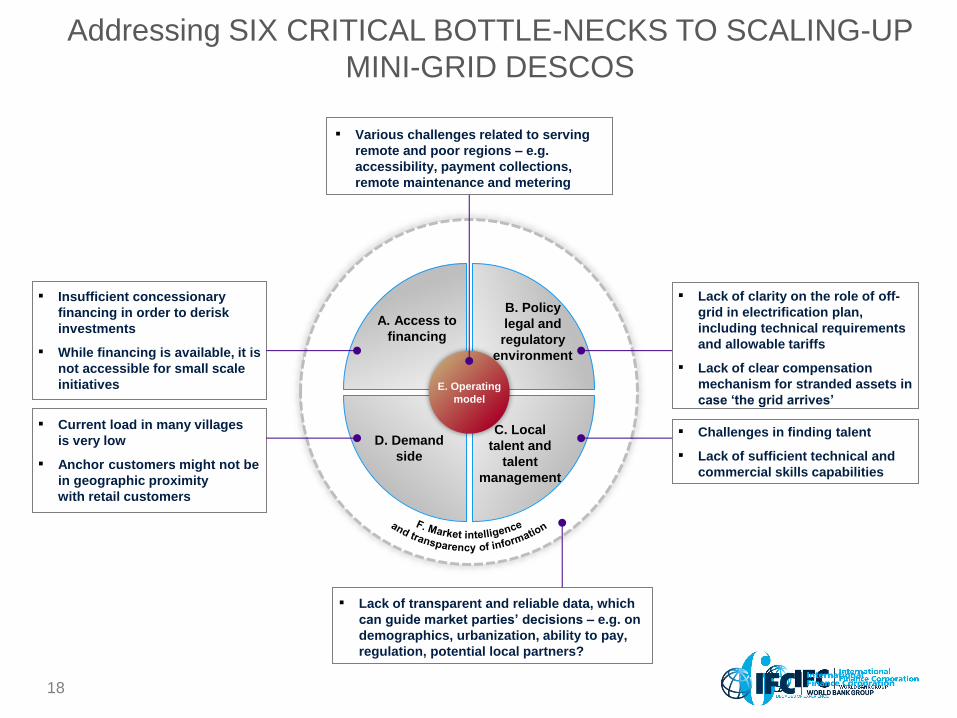
Addressing SIX CRITICAL BOTTLE-NECKS TO SCALING-UP
MINI-GRID DESCOS
18
▪ Lack of clarity on the role of off-
grid in electrification plan,
including technical requirements
and allowable tariffs
▪ Lack of clear compensation
mechanism for stranded assets in
case ‘the grid arrives’
▪ Insufficient concessionary
financing in order to derisk
investments
▪ While financing is available, it is
not accessible for small scale
initiatives
▪ Current load in many villages
is very low
▪ Anchor customers might not be
in geographic proximity
with retail customers
▪ Challenges in finding talent
▪ Lack of sufficient technical and
commercial skills capabilities
▪ Lack of transparent and reliable data, which
can guide market parties’ decisions – e.g. on
demographics, urbanization, ability to pay,
regulation, potential local partners?
▪ Various challenges related to serving
remote and poor regions – e.g.
accessibility, payment collections,
remote maintenance and metering
A. Access to
financing
B. Policy
legal and
regulatory
environment
C. Local
talent and
talent
management
D. Demand
side
E. Operating
model
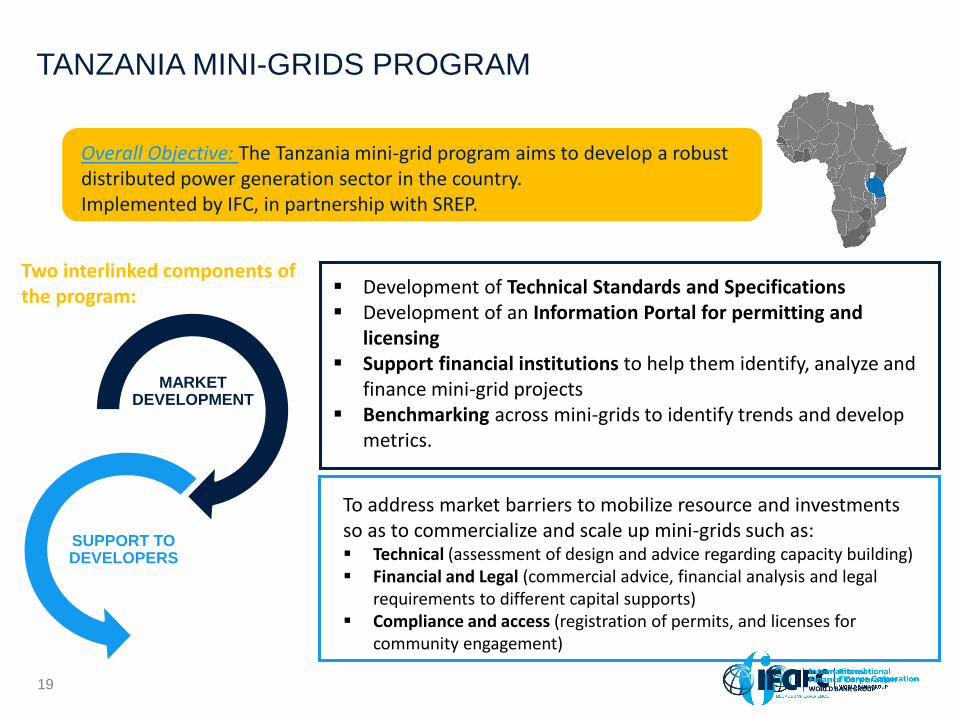
19
SUPPORT TO DEVELOPERS
MARKET DEVELOPMENT
Development of Technical Standards and Specifications Development of an Information Portal for permitting and
licensing Support financial institutions to help them identify, analyze and
finance mini-grid projects Benchmarking across mini-grids to identify trends and develop
metrics.
To address market barriers to mobilize resource and investments so as to commercialize and scale up mini-grids such as: Technical (assessment of design and advice regarding capacity building) Financial and Legal (commercial advice, financial analysis and legal
requirements to different capital supports) Compliance and access (registration of permits, and licenses for
community engagement)
Two interlinked components of the program:
Overall Objective: The Tanzania mini-grid program aims to develop a robust distributed power generation sector in the country. Implemented by IFC, in partnership with SREP.
TANZANIA MINI-GRIDS PROGRAM
20
21
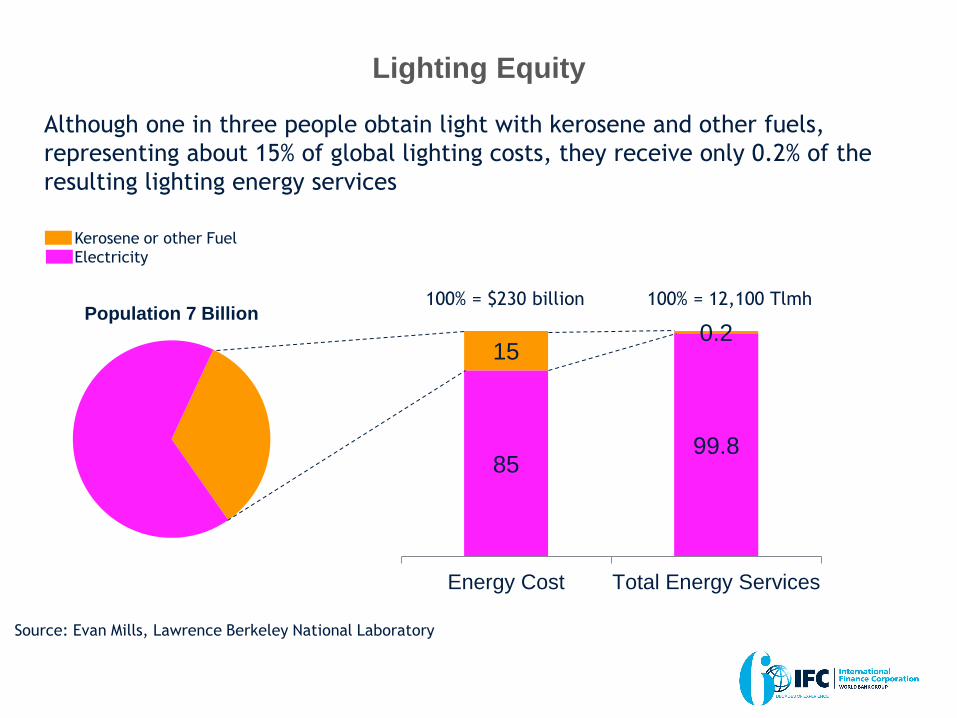
Lighting Equity
Although one in three people obtain light with kerosene and other fuels,
representing about 15% of global lighting costs, they receive only 0.2% of the
resulting lighting energy services
22
Population 7 Billion
85 99.8
15 0.2
Energy Cost Total Energy Services
100% = $230 billion 100% = 12,100 Tlmh
Kerosene or other Fuel
Electricity
Source: Evan Mills, Lawrence Berkeley National Laboratory
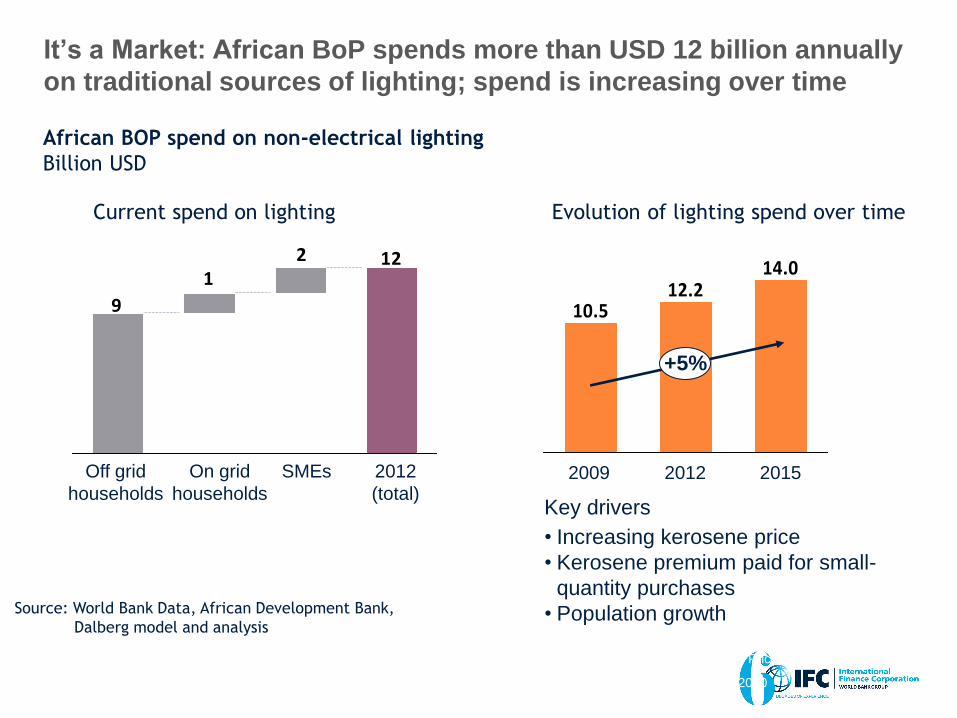
It’s a Market: African BoP spends more than USD 12 billion annually
on traditional sources of lighting; spend is increasing over time
Assumptions: Includes estimated spend on kerosene, batteries, candles and bio-fuel; Prices are adjusted for inflation;
Average kerosene price has grown at ~12% nominally from a base of 1 USD/liter in 2010
21
12
9
2012
(total)
SMEs On grid
households
Off grid
households
14.012.2
10.5
2015
+5%
2012 2009
African BOP spend on non-electrical lighting
Billion USD
Key drivers
• Increasing kerosene price
• Kerosene premium paid for small-
quantity purchases
• Population growth
Current spend on lighting Evolution of lighting spend over time
23
Source: World Bank Data, African Development Bank,
Dalberg model and analysis
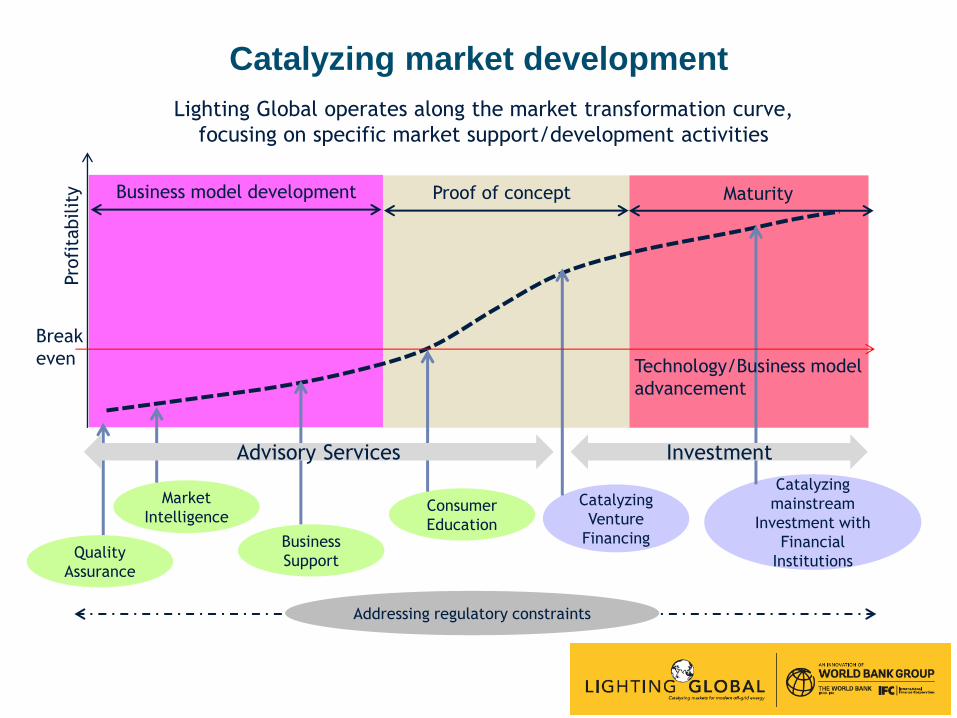
Pro
fita
bilit
y
Break
even
Maturity Proof of concept Business model development
24
Catalyzing market development
Market
Intelligence
Quality
Assurance
Business
Support
Consumer
Education
Catalyzing
Venture
Financing
Catalyzing
mainstream
Investment with
Financial
Institutions
Lighting Global operates along the market transformation curve,
focusing on specific market support/development activities
Addressing regulatory constraints
Technology/Business model
advancement
Advisory Services Investment
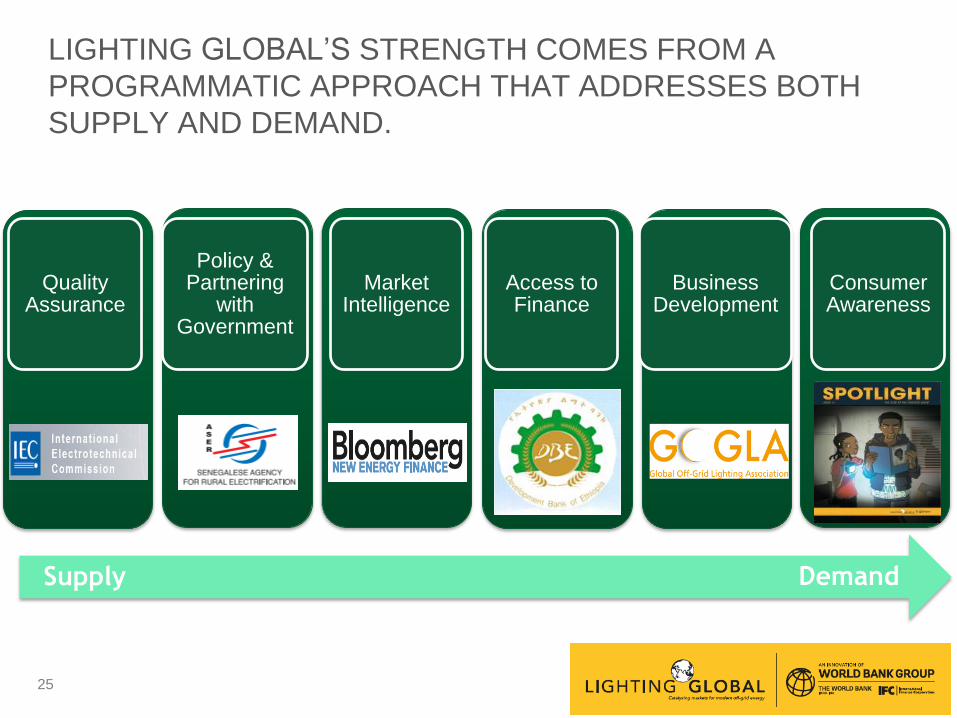
LIGHTING GLOBAL’S STRENGTH COMES FROM A
PROGRAMMATIC APPROACH THAT ADDRESSES BOTH
SUPPLY AND DEMAND.
Quality Assurance
Policy & Partnering
with Government
Market Intelligence
Access to Finance
Business Development
Consumer Awareness
Supply Demand
25
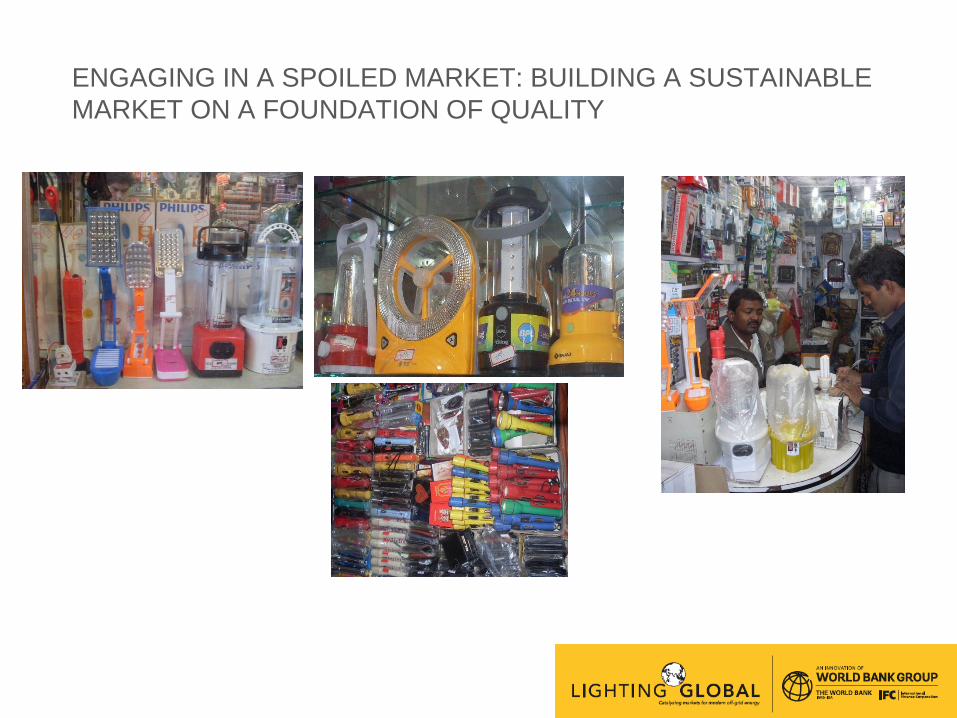
ENGAGING IN A SPOILED MARKET: BUILDING A SUSTAINABLE
MARKET ON A FOUNDATION OF QUALITY
26
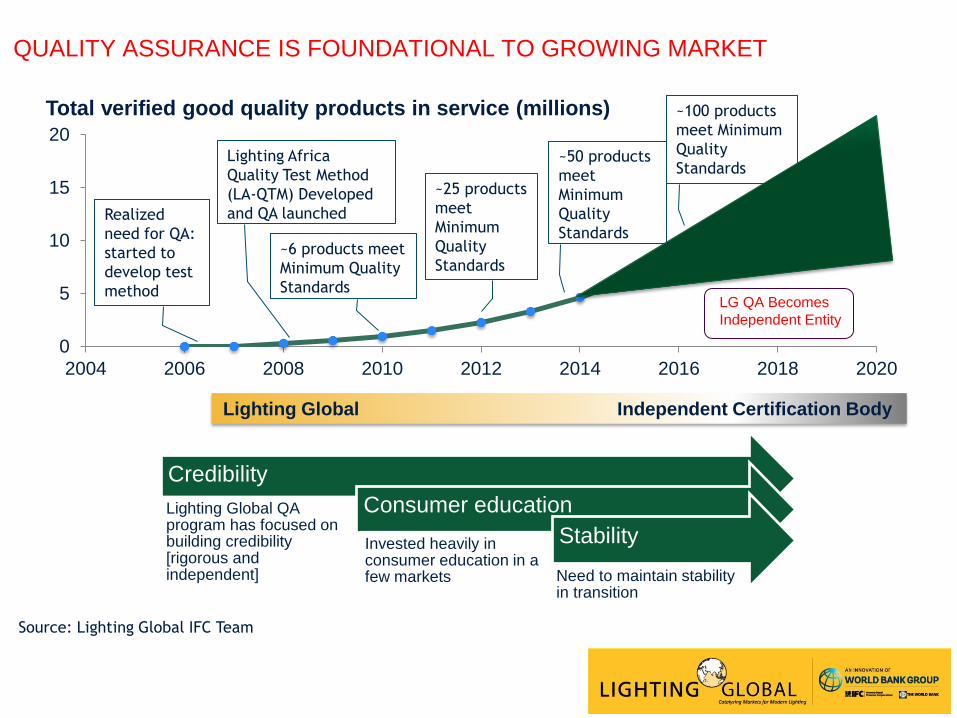
QUALITY ASSURANCE IS FOUNDATIONAL TO GROWING MARKET
0
5
10
15
20
2004 2006 2008 2010 2012 2014 2016 2018 2020
Total verified good quality products in service (millions) ~100 products
meet Minimum
Quality
Standards
LG QA Becomes
Independent Entity
Lighting Global Independent Certification Body
27
Source: Lighting Global IFC Team
Realized
need for QA:
started to
develop test
method
Lighting Africa
Quality Test Method
(LA-QTM) Developed
and QA launched
~6 products meet
Minimum Quality
Standards
~25 products
meet
Minimum
Quality
Standards
~50 products
meet
Minimum
Quality
Standards
Credibility
Lighting Global QA program has focused on building credibility [rigorous and independent]
Consumer education
Invested heavily in consumer education in a few markets
Stability
Need to maintain stability in transition
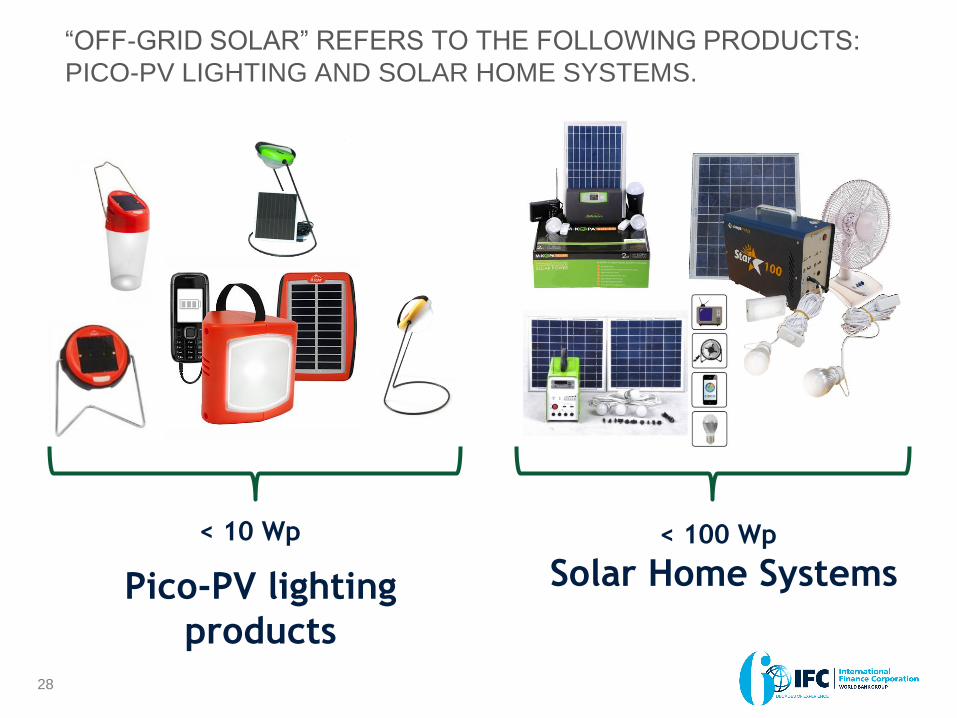
“OFF-GRID SOLAR” REFERS TO THE FOLLOWING PRODUCTS:
PICO-PV LIGHTING AND SOLAR HOME SYSTEMS.
28
< 10 Wp < 100 Wp
Pico-PV lighting
products
Solar Home Systems
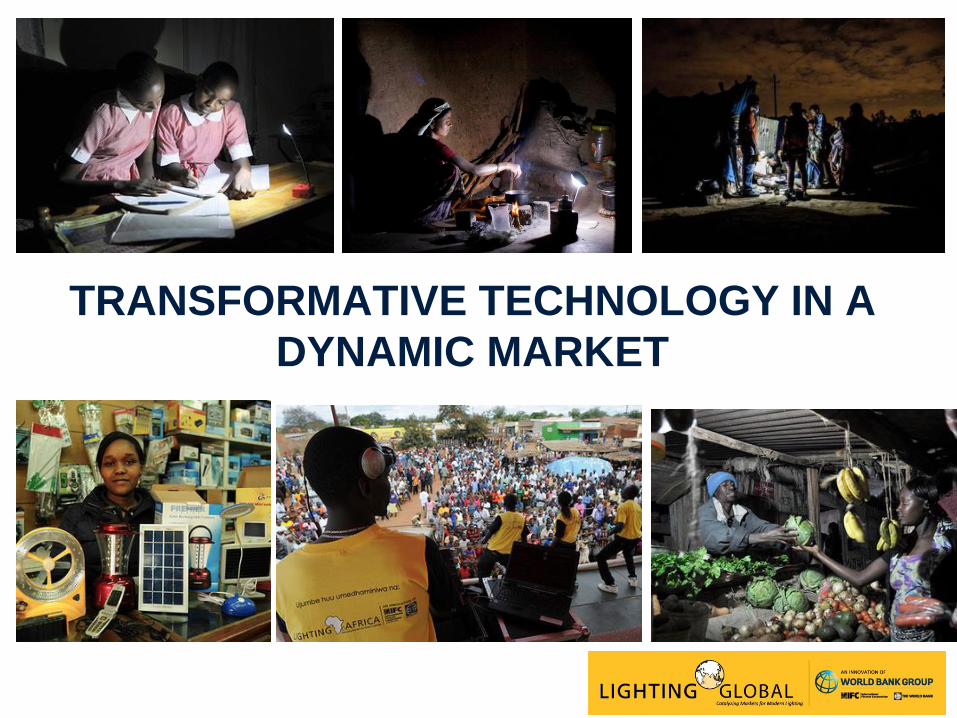
TRANSFORMATIVE TECHNOLOGY IN A
DYNAMIC MARKET
29
30
31
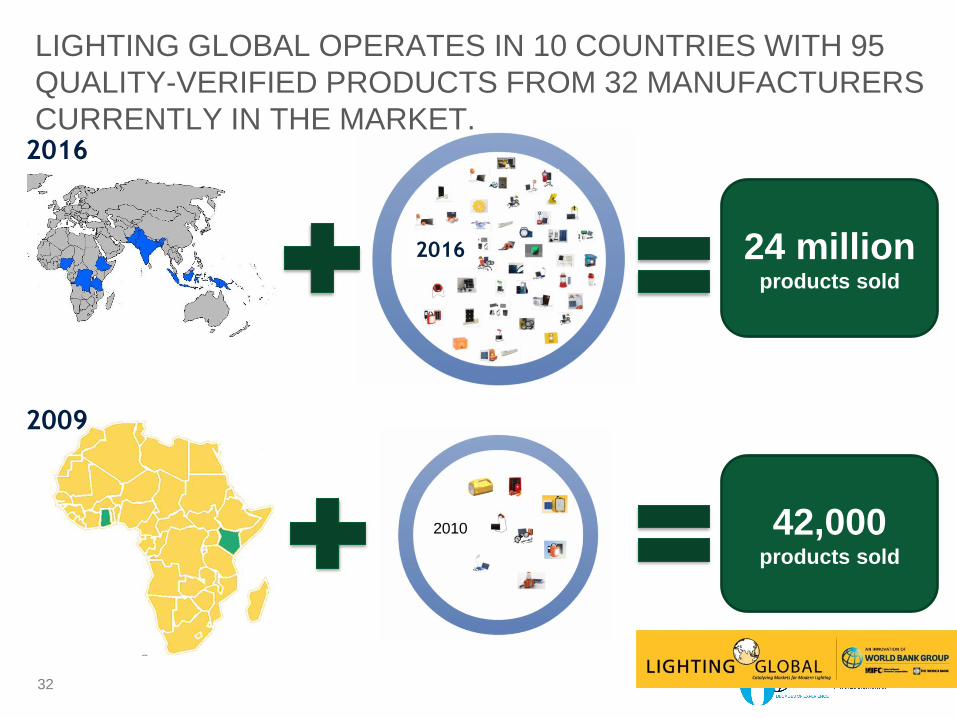
42,000 products sold
24 million products sold
2016
2009
2016
LIGHTING GLOBAL OPERATES IN 10 COUNTRIES WITH 95
QUALITY-VERIFIED PRODUCTS FROM 32 MANUFACTURERS
CURRENTLY IN THE MARKET.
32

33
Electricity Access Deficit,
Top 20 Countries
(population millions),
SE4A
We go where the markets are…
And where our clients want to go
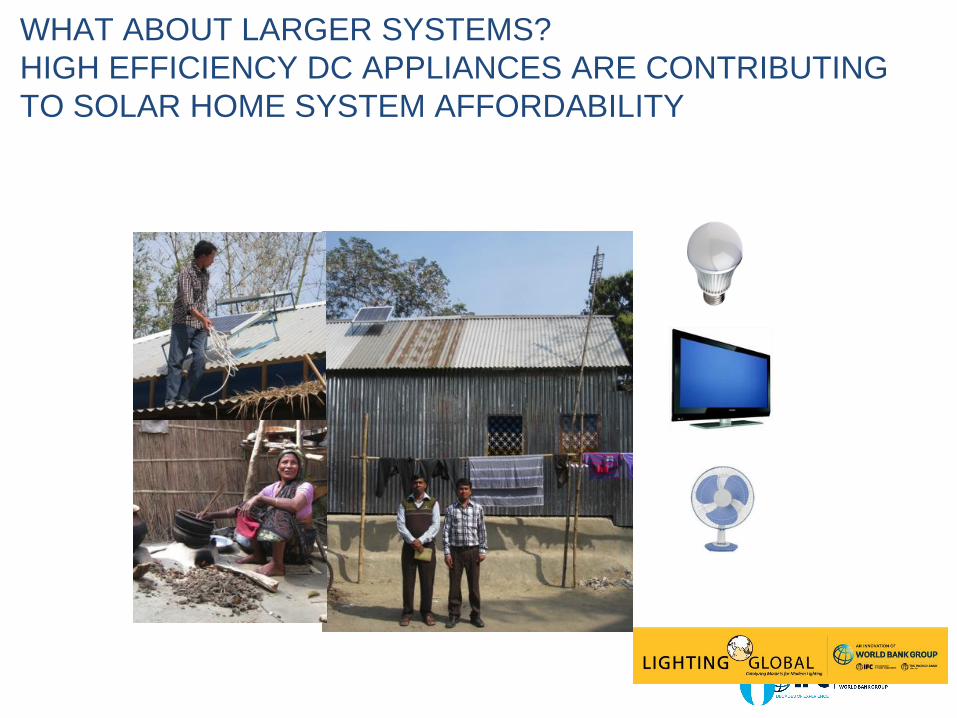
WHAT ABOUT LARGER SYSTEMS?
HIGH EFFICIENCY DC APPLIANCES ARE CONTRIBUTING
TO SOLAR HOME SYSTEM AFFORDABILITY
$0
$20
0
$4
00
$60
0
$80
0
$1.0
00
$1.2
00
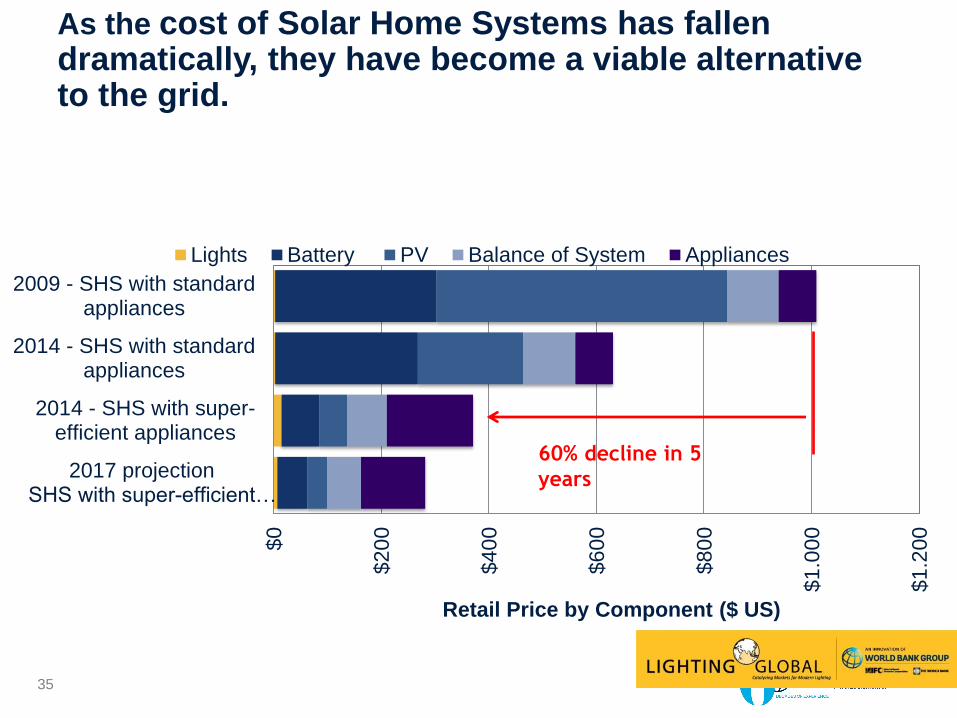
2017 projectionSHS with super-efficient…
2014 - SHS with super-efficient appliances
2014 - SHS with standardappliances
2009 - SHS with standardappliances
Retail Price by Component ($ US)
Lights Battery PV Balance of System Appliances
60% decline in 5
years
As the cost of Solar Home Systems has fallen dramatically, they have become a viable alternative to the grid.
35
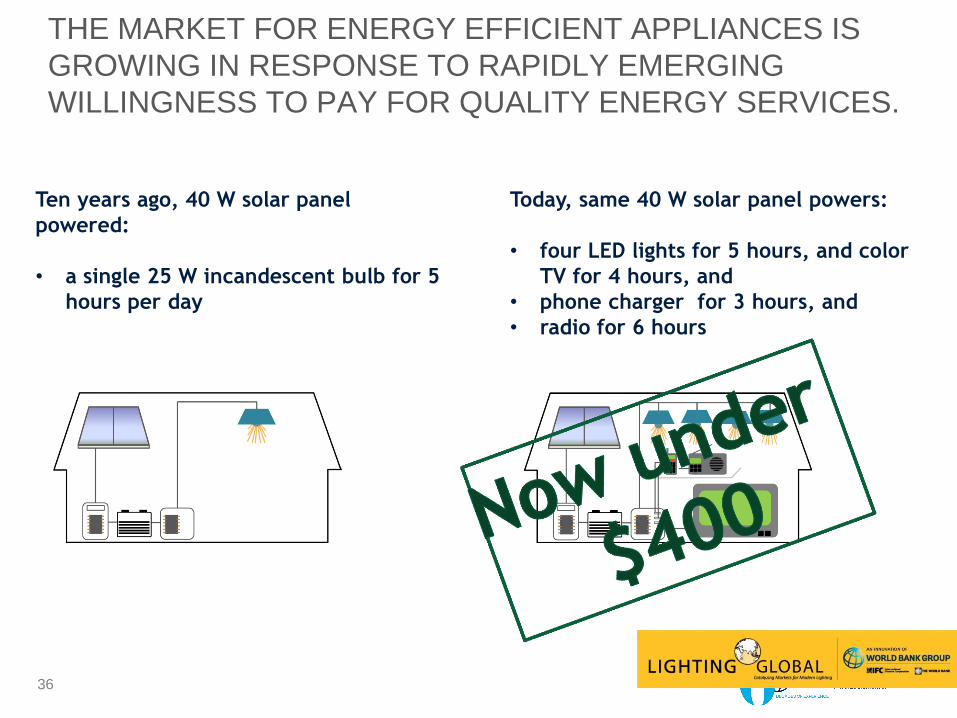
Ten years ago, 40 W solar panel
powered:
• a single 25 W incandescent bulb for 5
hours per day
THE MARKET FOR ENERGY EFFICIENT APPLIANCES IS
GROWING IN RESPONSE TO RAPIDLY EMERGING
WILLINGNESS TO PAY FOR QUALITY ENERGY SERVICES.
Today, same 40 W solar panel powers:
• four LED lights for 5 hours, and color
TV for 4 hours, and
• phone charger for 3 hours, and
• radio for 6 hours
36
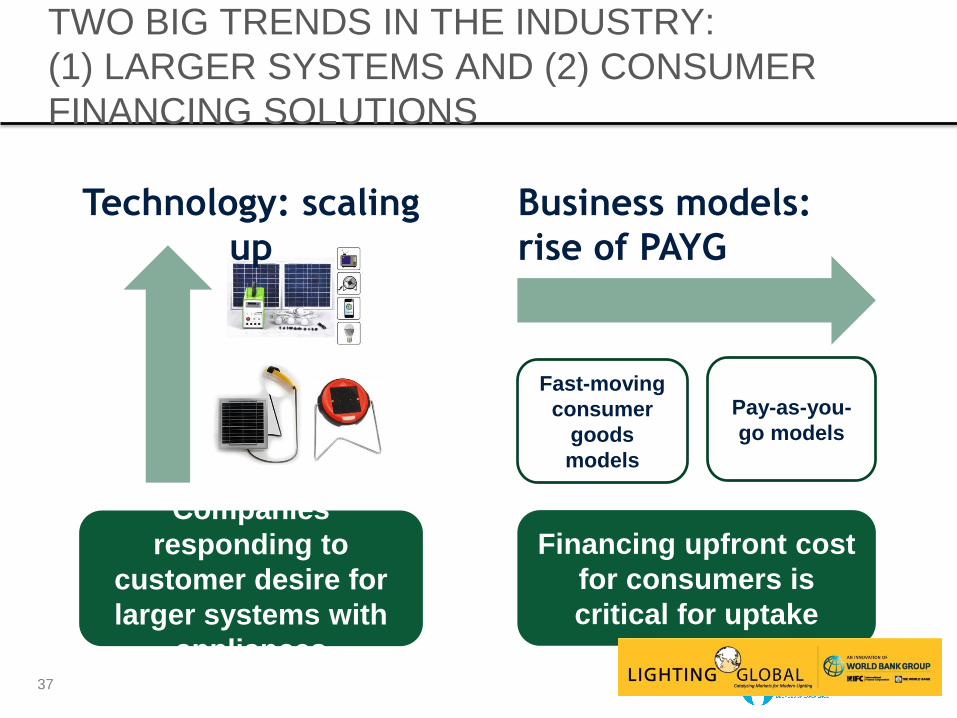
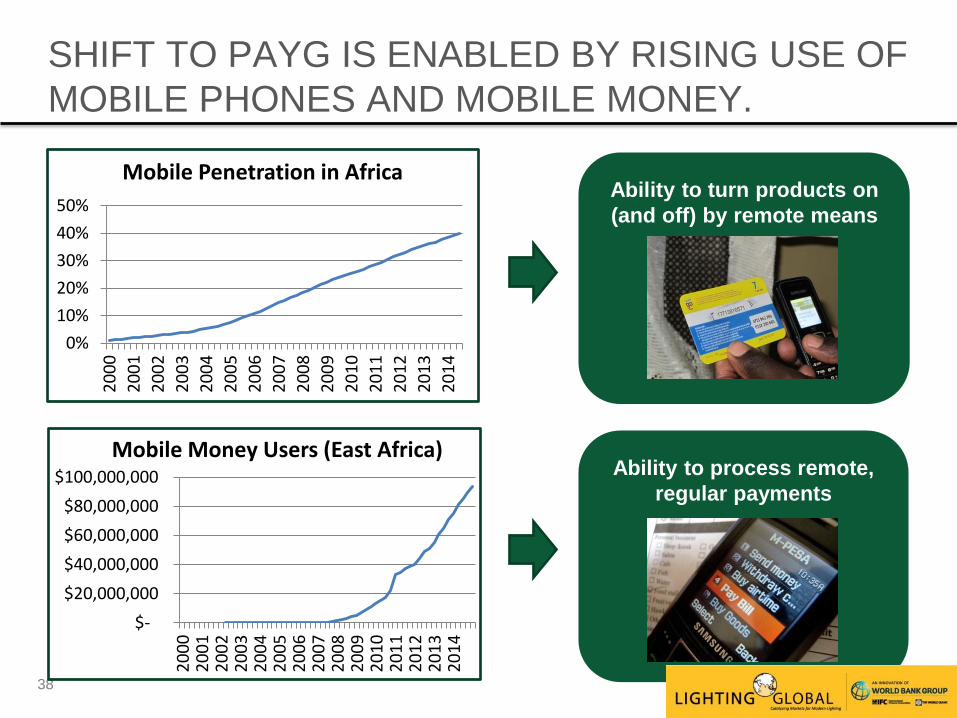
TWO BIG TRENDS IN THE INDUSTRY:
(1) LARGER SYSTEMS AND (2) CONSUMER
FINANCING SOLUTIONS
37
Companies
responding to
customer desire for
larger systems with
appliances
Technology: scaling
up
Business models:
rise of PAYG
Financing upfront cost
for consumers is
critical for uptake
Fast-moving
consumer
goods
models
Pay-as-you-
go models
$-
$20,000,000
$40,000,000
$60,000,000
$80,000,000
$100,000,000
20
00
20
01
20
02
20
03
20
04
20
05
20
06
20
07
20
08
20
09
20
10
20
11
20
12
20
13
20
14
Mobile Money Users (East Africa)
0%
10%
20%
30%
40%
50%
20
00
20
01
20
02
20
03
20
04
20
05
20
06
20
07
20
08
20
09
20
10
20
11
20
12
20
13
20
14
Mobile Penetration in Africa
Ability to process remote,
regular payments
Ability to turn products on
(and off) by remote means
SHIFT TO PAYG IS ENABLED BY RISING USE OF
MOBILE PHONES AND MOBILE MONEY.
38
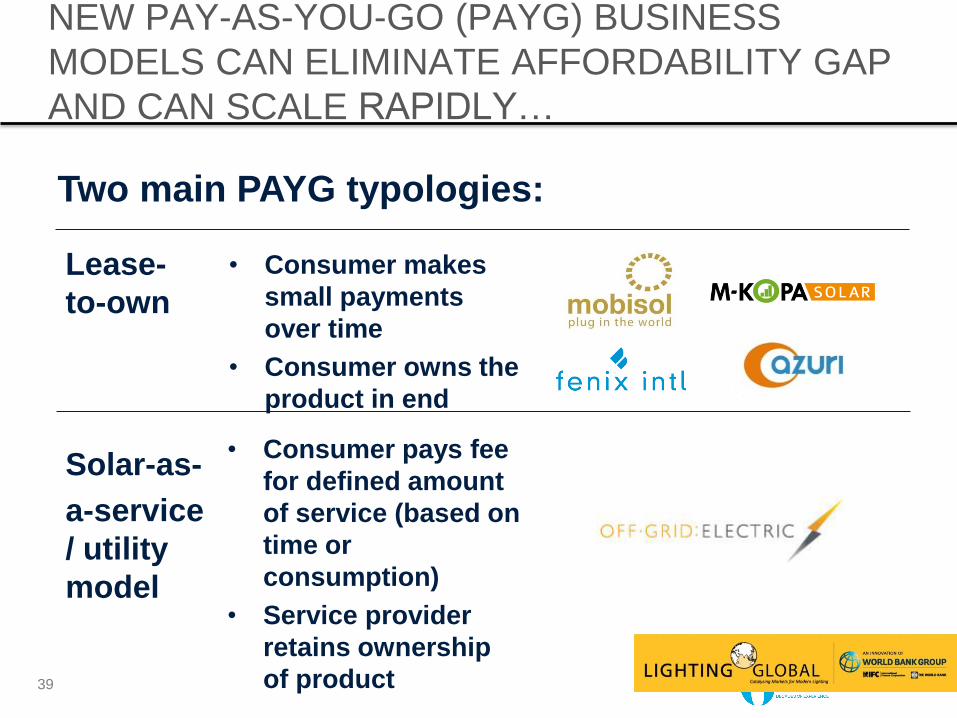
Lease-
to-own
• Consumer makes
small payments
over time
• Consumer owns the
product in end
Solar-as-
a-service
/ utility
model
• Consumer pays fee
for defined amount
of service (based on
time or
consumption)
• Service provider
retains ownership
of product
NEW PAY-AS-YOU-GO (PAYG) BUSINESS
MODELS CAN ELIMINATE AFFORDABILITY GAP
AND CAN SCALE RAPIDLY…
39
Two main PAYG typologies:
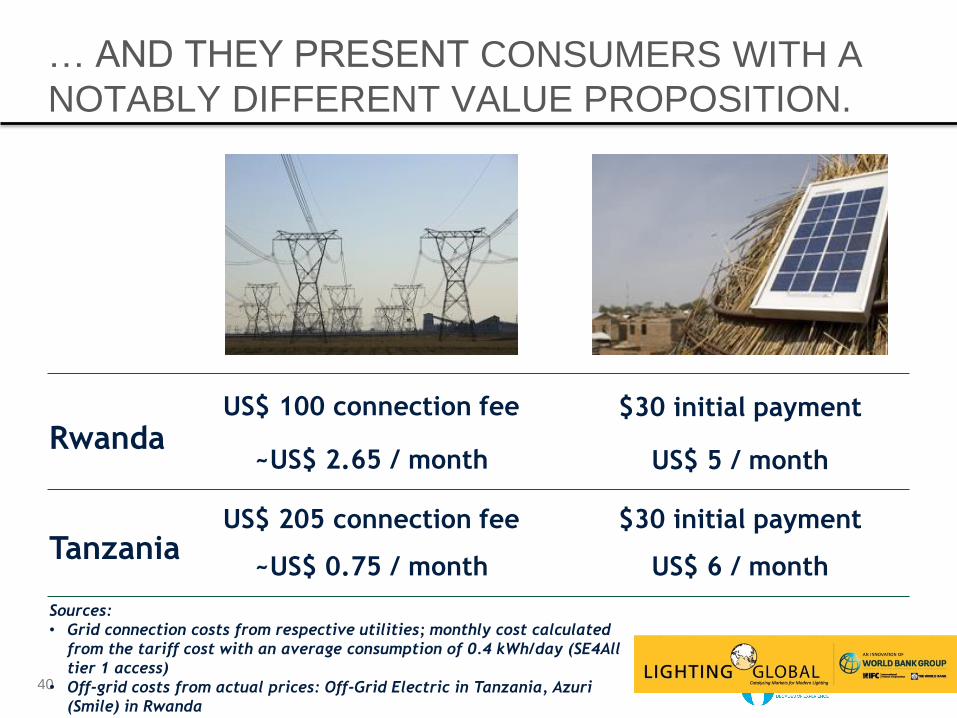
… AND THEY PRESENT CONSUMERS WITH A
NOTABLY DIFFERENT VALUE PROPOSITION.
40
US$ 5 / month ~US$ 2.65 / month
$30 initial payment US$ 100 connection fee
~US$ 0.75 / month
US$ 205 connection fee
US$ 6 / month
$30 initial payment
Rwanda
Tanzania
Sources:
• Grid connection costs from respective utilities; monthly cost calculated
from the tariff cost with an average consumption of 0.4 kWh/day (SE4All
tier 1 access)
• Off-grid costs from actual prices: Off-Grid Electric in Tanzania, Azuri
(Smile) in Rwanda
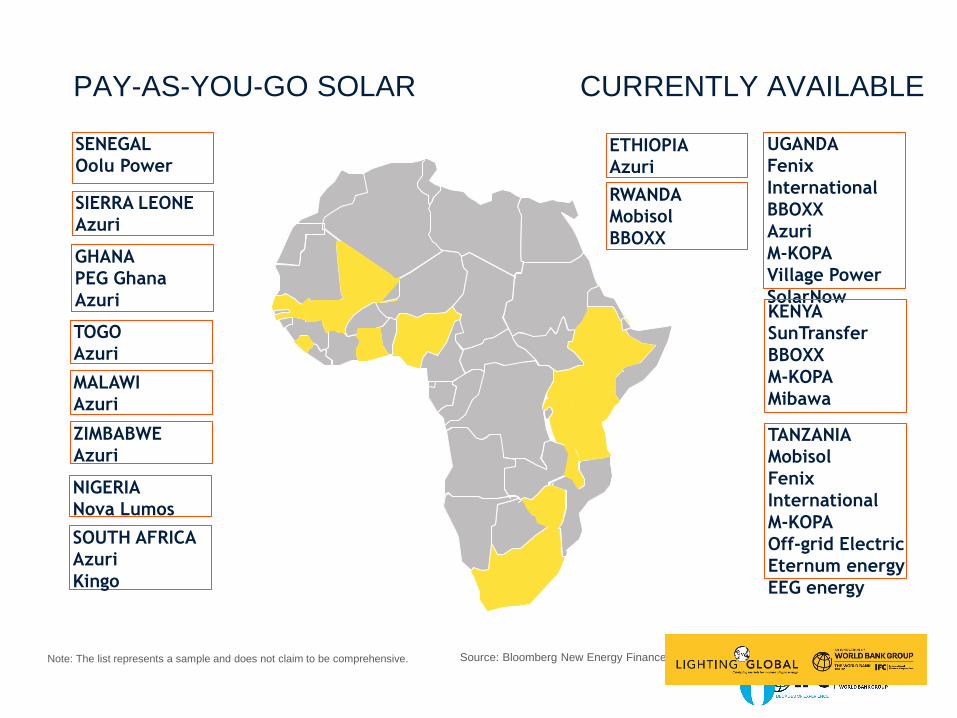
PAY-AS-YOU-GO SOLAR SERVICES CURRENTLY AVAILABLE
SYSTEMS)
TANZANIA
Mobisol
Fenix
International
M-KOPA
Off-grid Electric
Eternum energy
EEG energy
RWANDA
Mobisol
BBOXX
GHANA
PEG Ghana
Azuri
UGANDA
Fenix
International
BBOXX
Azuri
M-KOPA
Village Power
SolarNow
KENYA
SunTransfer
BBOXX
M-KOPA
Mibawa
NIGERIA
Nova Lumos
ETHIOPIA
Azuri
SOUTH AFRICA
Azuri
Kingo
ZIMBABWE
Azuri
SIERRA LEONE
Azuri
TOGO
Azuri
MALAWI
Azuri
Note: The list represents a sample and does not claim to be comprehensive.
SENEGAL
Oolu Power
Source: Bloomberg New Energy Finance
Azuri
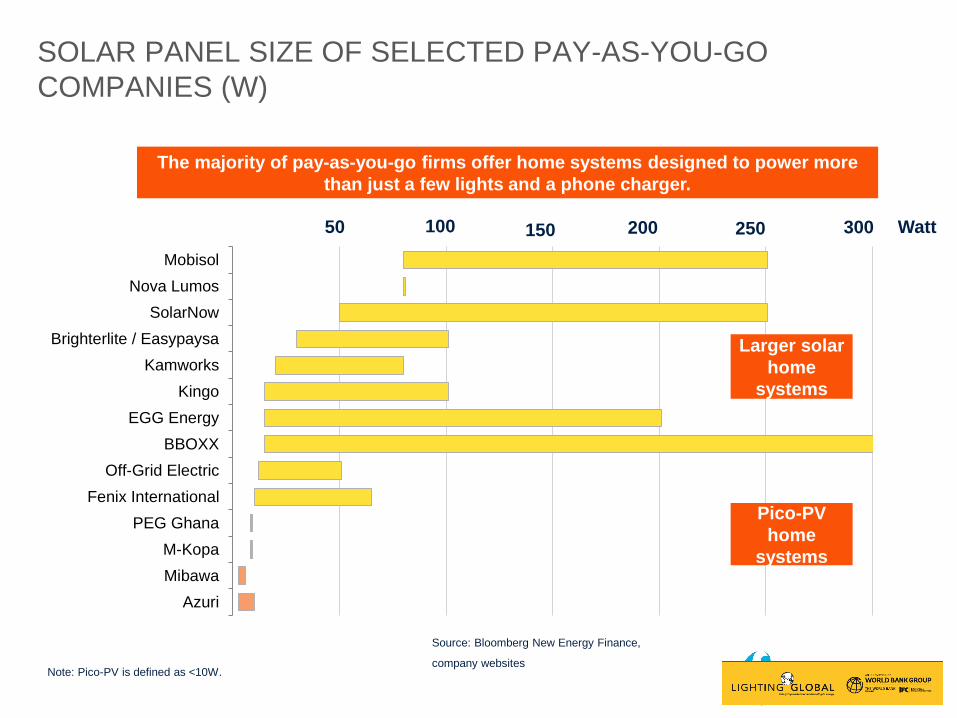
Mibawa
M-Kopa
PEG Ghana
Fenix International
Off-Grid Electric
BBOXX
EGG Energy
Kingo
Kamworks
Brighterlite / Easypaysa
SolarNow
Nova Lumos
Mobisol
Note: Pico-PV is defined as <10W.
Source: Bloomberg New Energy Finance,
company websites
SOLAR PANEL SIZE OF SELECTED PAY-AS-YOU-GO
COMPANIES (W)
50 100 150 200 250 300 Watt
The majority of pay-as-you-go firms offer home systems designed to power more
than just a few lights and a phone charger.
Pico-PV
home
systems
Larger solar
home
systems
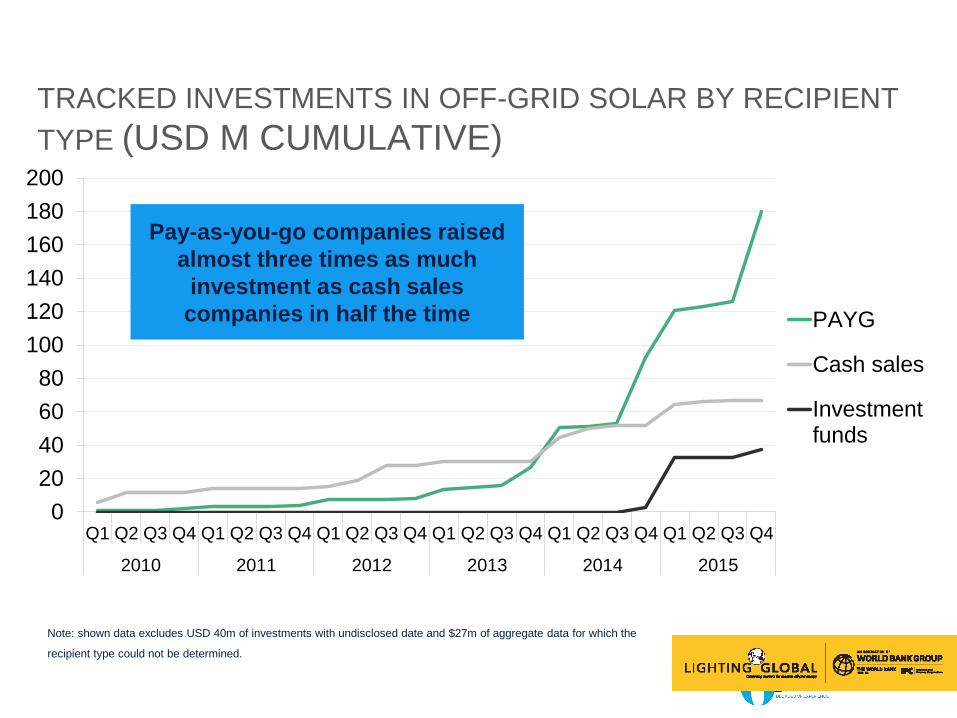
0
20
40
60
80
100
120
140
160
180
200
Q1 Q2 Q3 Q4 Q1 Q2 Q3 Q4 Q1 Q2 Q3 Q4 Q1 Q2 Q3 Q4 Q1 Q2 Q3 Q4 Q1 Q2 Q3 Q4
2010 2011 2012 2013 2014 2015
PAYG
Cash sales
Investmentfunds
Note: shown data excludes USD 40m of investments with undisclosed date and $27m of aggregate data for which the
recipient type could not be determined.
Source: Bloomberg New Energy Finance
TRACKED INVESTMENTS IN OFF-GRID SOLAR BY RECIPIENT
TYPE (USD M CUMULATIVE)
Pay-as-you-go companies raised
almost three times as much
investment as cash sales
companies in half the time
Source: Bloomberg New Energy Finance
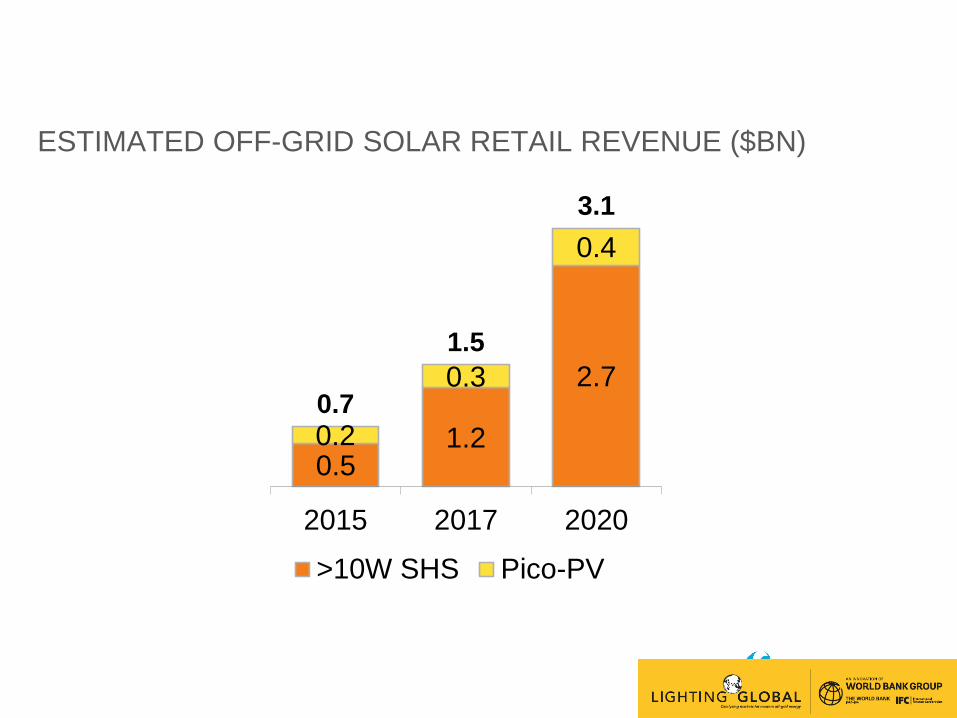
ESTIMATED OFF-GRID SOLAR RETAIL REVENUE ($BN)
0.51.2
2.7
0.2
0.3
0.4
0.7
1.5
3.1
2015 2017 2020
>10W SHS Pico-PV
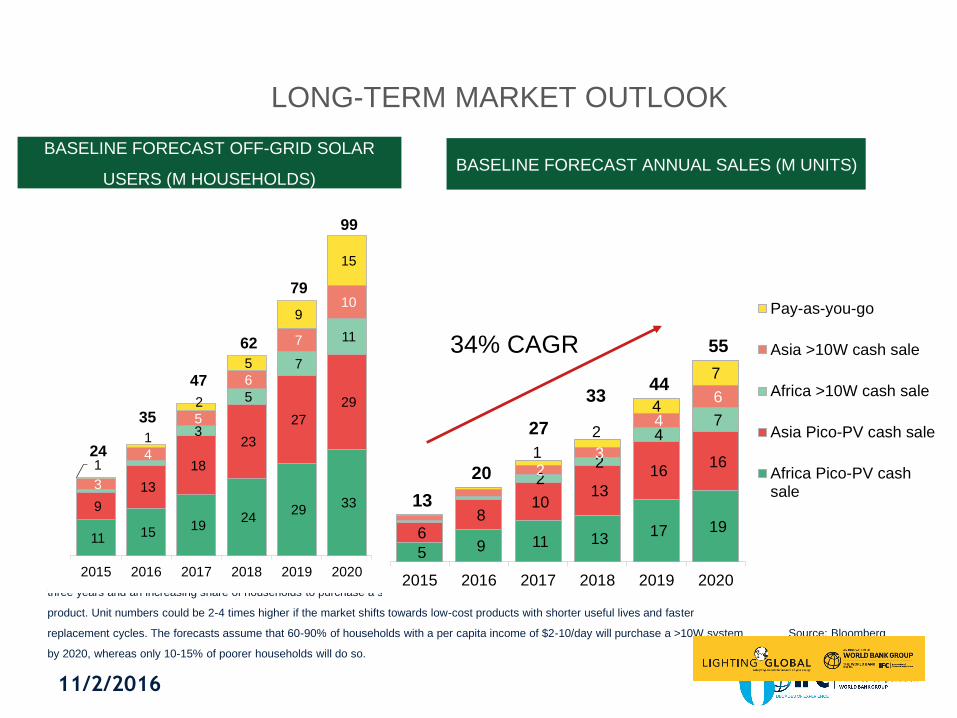
LONG-TERM MARKET OUTLOOK
Note: sales through third-parties with consumer-finance offerings are captured in cash sales. Sales projections assume product lifetime of
three years and an increasing share of households to purchase a second device after one year. Unit sales assume sales of high-quality
product. Unit numbers could be 2-4 times higher if the market shifts towards low-cost products with shorter useful lives and faster
replacement cycles. The forecasts assume that 60-90% of households with a per capita income of $2-10/day will purchase a >10W system
by 2020, whereas only 10-15% of poorer households will do so.
Source: Bloomberg
New Energy Finance.
11 15 19
24 29
33 9
13
18
23
27
29
3
5
7
11
3
4
5
6
7
10
1
1
2
5
9
15
24
35
47
62
79
99
2015 2016 2017 2018 2019 2020
5 9 11 13 17 19 6
8 10
13
16 16
2 2
4 7
2 3
4
6
1
2
4
7
13
20
27
33 44
55
2015 2016 2017 2018 2019 2020
Pay-as-you-go
Asia >10W cash sale
Africa >10W cash sale
Asia Pico-PV cash sale
Africa Pico-PV cashsale
34% CAGR
BASELINE FORECAST OFF-GRID SOLAR
USERS (M HOUSEHOLDS) BASELINE FORECAST ANNUAL SALES (M UNITS)
11/2/2016
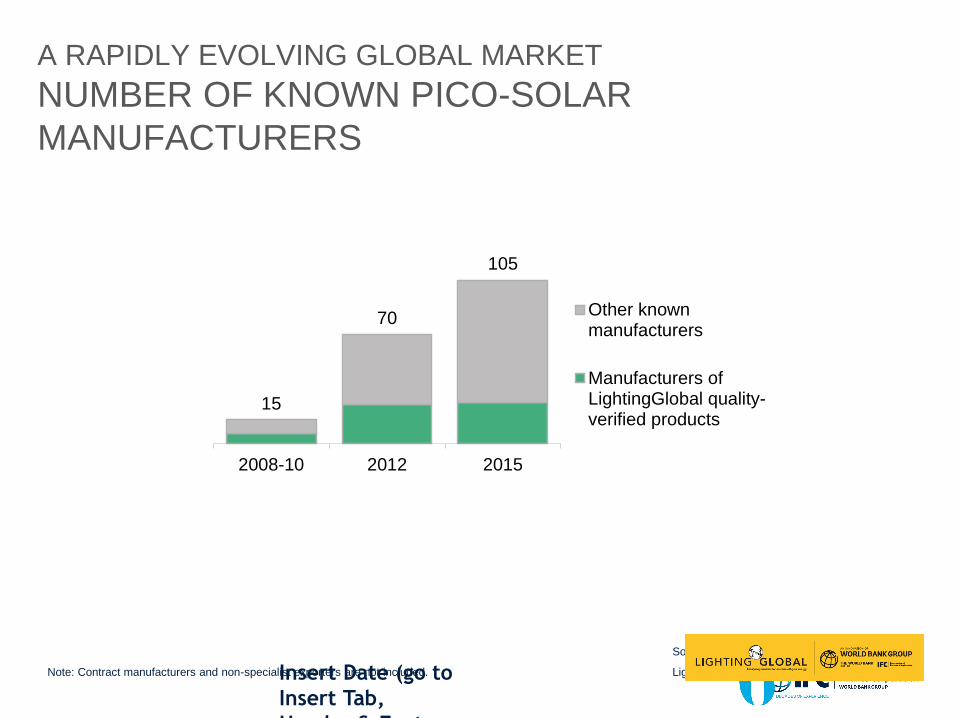
Note: Contract manufacturers and non-specialist exporters are not included.
Source: Bloomberg New Energy Finance,
Lighting Global, Dalberg Insert Date (go to
Insert Tab,
Header & Footer
and Apply to All)
A RAPIDLY EVOLVING GLOBAL MARKET
NUMBER OF KNOWN PICO-SOLAR
MANUFACTURERS
15
70
105
2008-10 2012 2015
Other knownmanufacturers
Manufacturers ofLightingGlobal quality-verified products
48
49
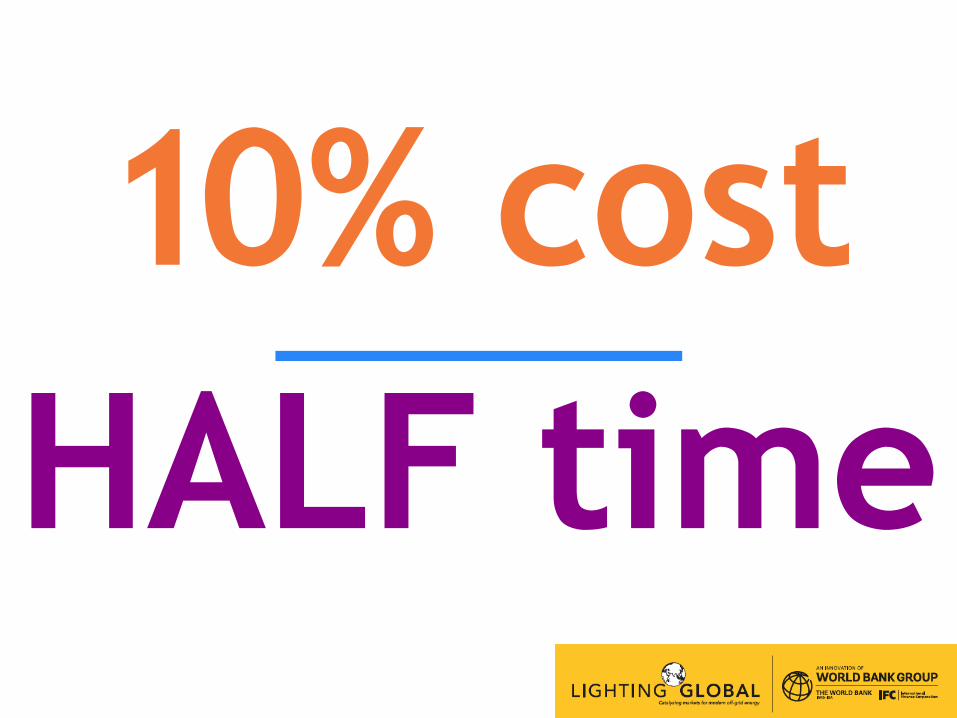
10% cost
of the cost
HALF time the time
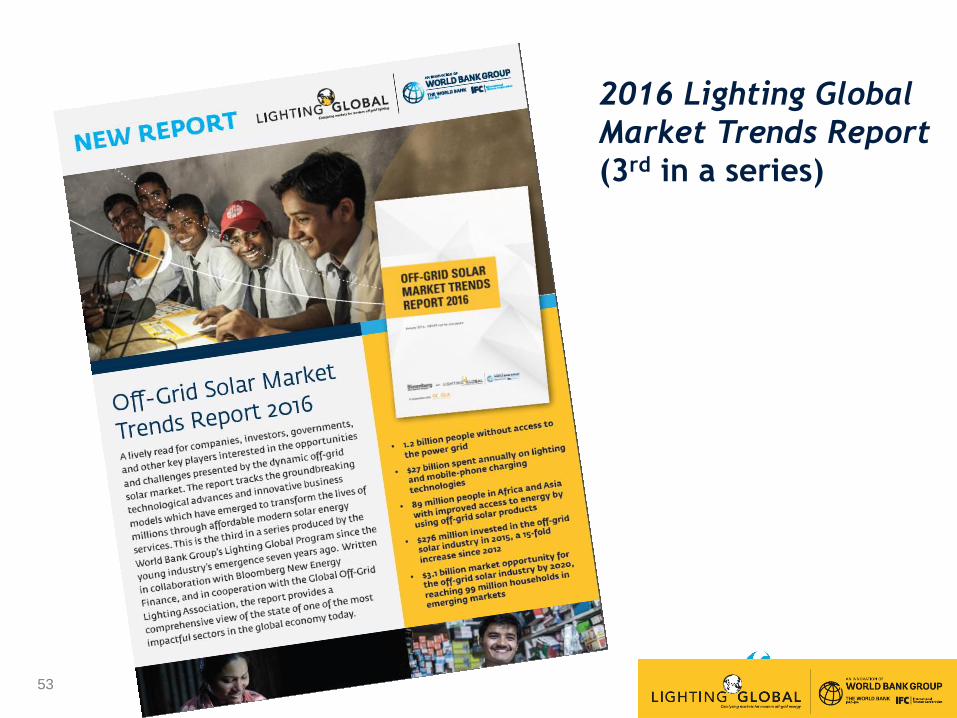
53
2016 Lighting Global
Market Trends Report
(3rd in a series)
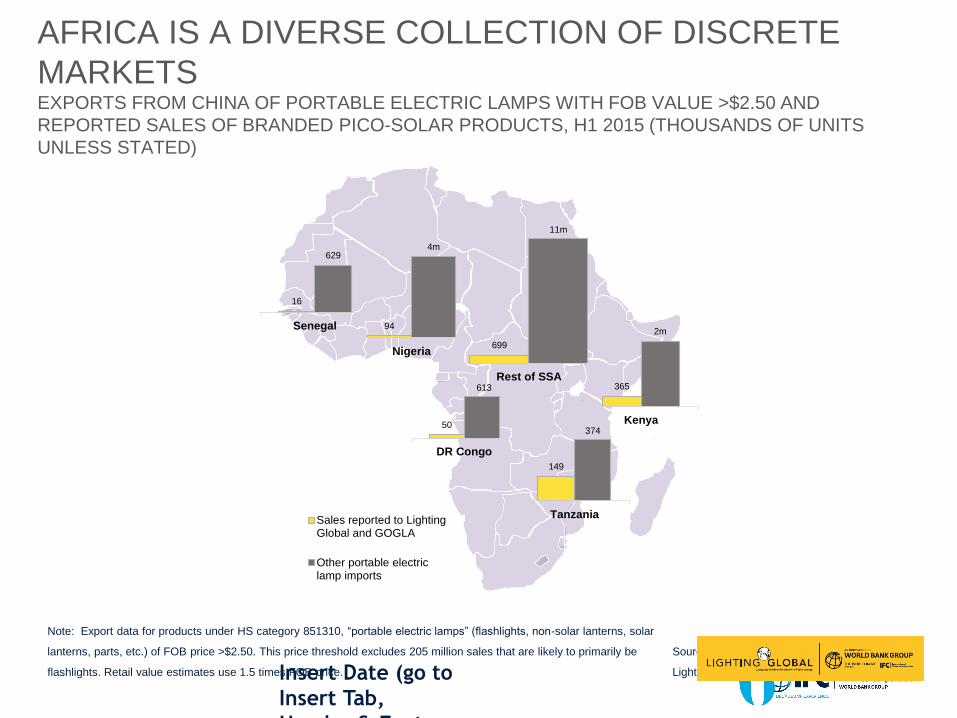
Note: Export data for products under HS category 851310, “portable electric lamps” (flashlights, non-solar lanterns, solar
lanterns, parts, etc.) of FOB price >$2.50. This price threshold excludes 205 million sales that are likely to primarily be
flashlights. Retail value estimates use 1.5 times FOB price.
Source: Bloomberg New Energy Finance,
Lighting Global, GOGLA, Sinoimex. Insert Date (go to
Insert Tab,
Header & Footer
and Apply to All)
AFRICA IS A DIVERSE COLLECTION OF DISCRETE
MARKETS EXPORTS FROM CHINA OF PORTABLE ELECTRIC LAMPS WITH FOB VALUE >$2.50 AND
REPORTED SALES OF BRANDED PICO-SOLAR PRODUCTS, H1 2015 (THOUSANDS OF UNITS
UNLESS STATED)
50
613
DR Congo
149
374
Tanzania
16
629
Senegal
699
11m
Rest of SSA
94
4m
Nigeria
365
2m
Kenya
Sales reported to LightingGlobal and GOGLA
Other portable electriclamp imports
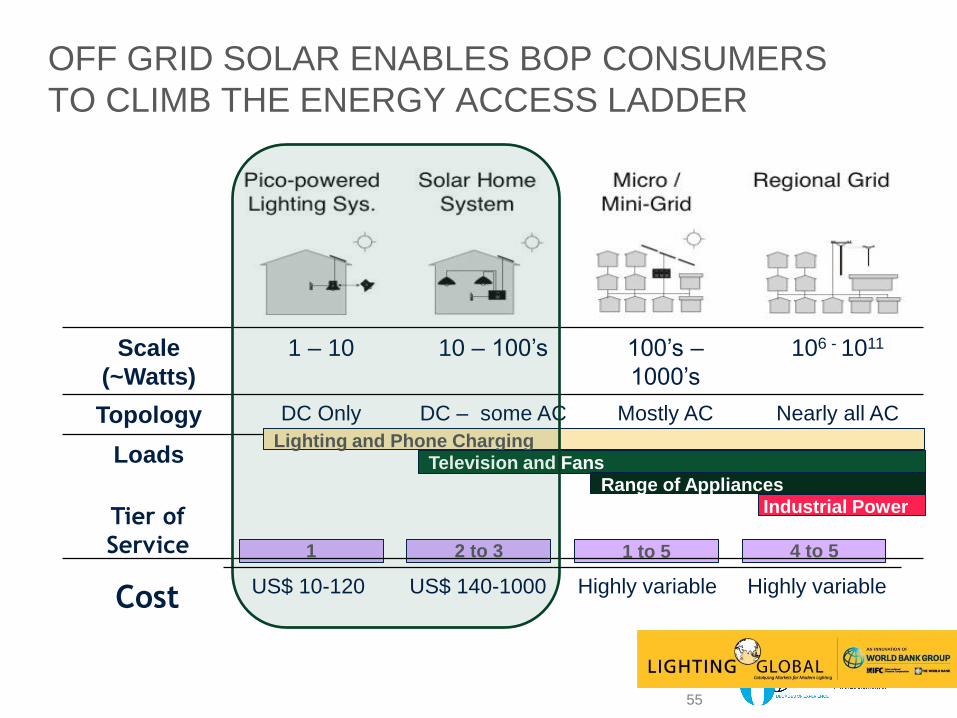
OFF GRID SOLAR ENABLES BOP CONSUMERS
TO CLIMB THE ENERGY ACCESS LADDER
Cost 1 – 10 10 – 100’s 100’s –
1000’s
106 - 1011
Topology DC Only DC – some AC Mostly AC Nearly all AC
Loads
SE4ALL Cost
Lighting and Phone Charging Television and Fans
Range of Appliances
Industrial Power
1 4 to 5 2 to 3 1 to 5
Scale
(~Watts)
1 – 10 10 – 100’s 100’s –
1000’s
106 - 1011
Topology DC Only DC – some AC Mostly AC Nearly all AC
Loads
Lighting and Phone Charging
Television and Fans
Range of Appliances
Industrial Power
55
US$ 10-120 US$ 140-1000 Highly variable Highly variable Cost
Tier of
Service
Recommended


![100% RENEWABLE ENERGY: An Energy [R]evolution for ITALY 2020 · 2020. 6. 17. · 100% Renewable Energy: An Energy [R]evolution for Italy : 2 : ABOUT THE AUTHORS. The Institute for](https://img.pdfslide.net/doc/110x75/60cf8d382645f431124d516d/100-renewable-energy-an-energy-revolution-for-italy-2020-2020-6-17-100.jpg)