Formulating a hypothesis testInterpreting a hypothesis test
Common types of hypothesis testPower calculations
Hypothesis tests and confidence intervals
Hypothesis Testing
Mark Lunt
Arthritis Research UK Epidemiology UnitUniversity of Manchester
31/10/2017
Formulating a hypothesis testInterpreting a hypothesis test
Common types of hypothesis testPower calculations
Hypothesis tests and confidence intervals
Introduction
We saw last week that we can never know the populationparameters without measuring the entire population.We can, however, make inferences about the populationparameters from random samples.Last week, we saw how we can create a confidenceinterval, within which we are reasonably certain thepopulation parameter lies.This week, we will see a different type of inference: is thereevidence that the parameter does not take a particularvalue ?
Formulating a hypothesis testInterpreting a hypothesis test
Common types of hypothesis testPower calculations
Hypothesis tests and confidence intervals
Components of Hypothesis testTest statisticsExamples
Hypothesis Testing
Form the Null HypothesisCalculate probability of observing data if null hypothesis istrue (p-value)Low p-value taken as evidence that null hypothesis isunlikelyOriginally, only intended as informal guide to strength ofevidence against null hypothesis
Formulating a hypothesis testInterpreting a hypothesis test
Common types of hypothesis testPower calculations
Hypothesis tests and confidence intervals
Components of Hypothesis testTest statisticsExamples
Significance Testing
Fisher’s p-value was very informal way to assess evidenceagainst null hypothesisNeyman and Pearson developed more formal approach:significance testingBased on decision making: rule for deciding whether or notto reject the null hypothesisClinically, need to make decisions. Scientifically, may bemore appropriate to retain uncertainty.Introduces concepts of power, significance
Formulating a hypothesis testInterpreting a hypothesis test
Common types of hypothesis testPower calculations
Hypothesis tests and confidence intervals
Components of Hypothesis testTest statisticsExamples
The Null Hypothesis
Simplest acceptable model.If the null hypothesis is true, the world is uninteresting.Must be possible to express numerically (“test statistic”).Sampling distribution of test statistic must be known.
Formulating a hypothesis testInterpreting a hypothesis test
Common types of hypothesis testPower calculations
Hypothesis tests and confidence intervals
Components of Hypothesis testTest statisticsExamples
The Alternative Hypothesis
“Null Hypothesis is untrue”Covers any other possibility.May be one-sided, if effect in opposite direction is asuninteresting as the null hypothesis
Formulating a hypothesis testInterpreting a hypothesis test
Common types of hypothesis testPower calculations
Hypothesis tests and confidence intervals
Components of Hypothesis testTest statisticsExamples
One and Two-sided tests
Good example: χ2 test.χ2 test measures difference between expected andobserved frequenciesOnly unusually large differences are evidence against nullhypothesis.
Bad example: clinical trialA drug company may only be interested in how much betterits drug is than the competition.Easier to get a significant difference with a one-sided test.The rest of the world is interested in differences in eitherdirection, want to see a two-sided test.
One-sided tests are rarely justified
Formulating a hypothesis testInterpreting a hypothesis test
Common types of hypothesis testPower calculations
Hypothesis tests and confidence intervals
Components of Hypothesis testTest statisticsExamples
Test Statistic
Null hypothesis distribution must be known.Expected value if null hypothesis is true.Variation due to sampling error (standard error) if nullhypothesis is true.
From this distribution, probability of any given value can becalculated.Can be a mean, proportion, correlation coefficient,regression coefficient etc.
Formulating a hypothesis testInterpreting a hypothesis test
Common types of hypothesis testPower calculations
Hypothesis tests and confidence intervals
Components of Hypothesis testTest statisticsExamples
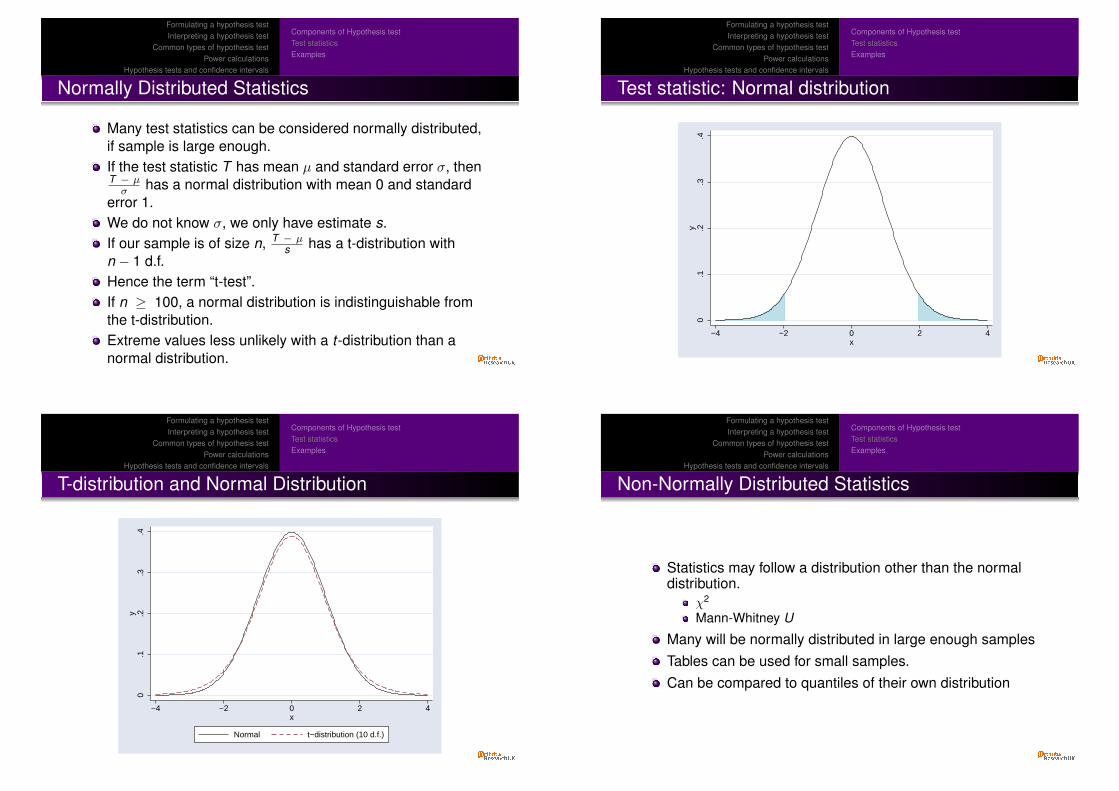
Normally Distributed Statistics
Many test statistics can be considered normally distributed,if sample is large enough.If the test statistic T has mean µ and standard error σ, thenT − µσ has a normal distribution with mean 0 and standard
error 1.We do not know σ, we only have estimate s.If our sample is of size n, T − µ
s has a t-distribution withn − 1 d.f.Hence the term “t-test”.If n ≥ 100, a normal distribution is indistinguishable fromthe t-distribution.Extreme values less unlikely with a t-distribution than anormal distribution.
Formulating a hypothesis testInterpreting a hypothesis test
Common types of hypothesis testPower calculations
Hypothesis tests and confidence intervals
Components of Hypothesis testTest statisticsExamples
Test statistic: Normal distribution
0.1
.2.3
.4y
−4 −2 0 2 4x
Formulating a hypothesis testInterpreting a hypothesis test
Common types of hypothesis testPower calculations
Hypothesis tests and confidence intervals
Components of Hypothesis testTest statisticsExamples
T-distribution and Normal Distribution
0.1
.2.3
.4y
−4 −2 0 2 4x
Normal t−distribution (10 d.f.)
Formulating a hypothesis testInterpreting a hypothesis test
Common types of hypothesis testPower calculations
Hypothesis tests and confidence intervals
Components of Hypothesis testTest statisticsExamples
Non-Normally Distributed Statistics
Statistics may follow a distribution other than the normaldistribution.
χ2
Mann-Whitney U
Many will be normally distributed in large enough samplesTables can be used for small samples.Can be compared to quantiles of their own distribution
Formulating a hypothesis testInterpreting a hypothesis test
Common types of hypothesis testPower calculations
Hypothesis tests and confidence intervals
Components of Hypothesis testTest statisticsExamples
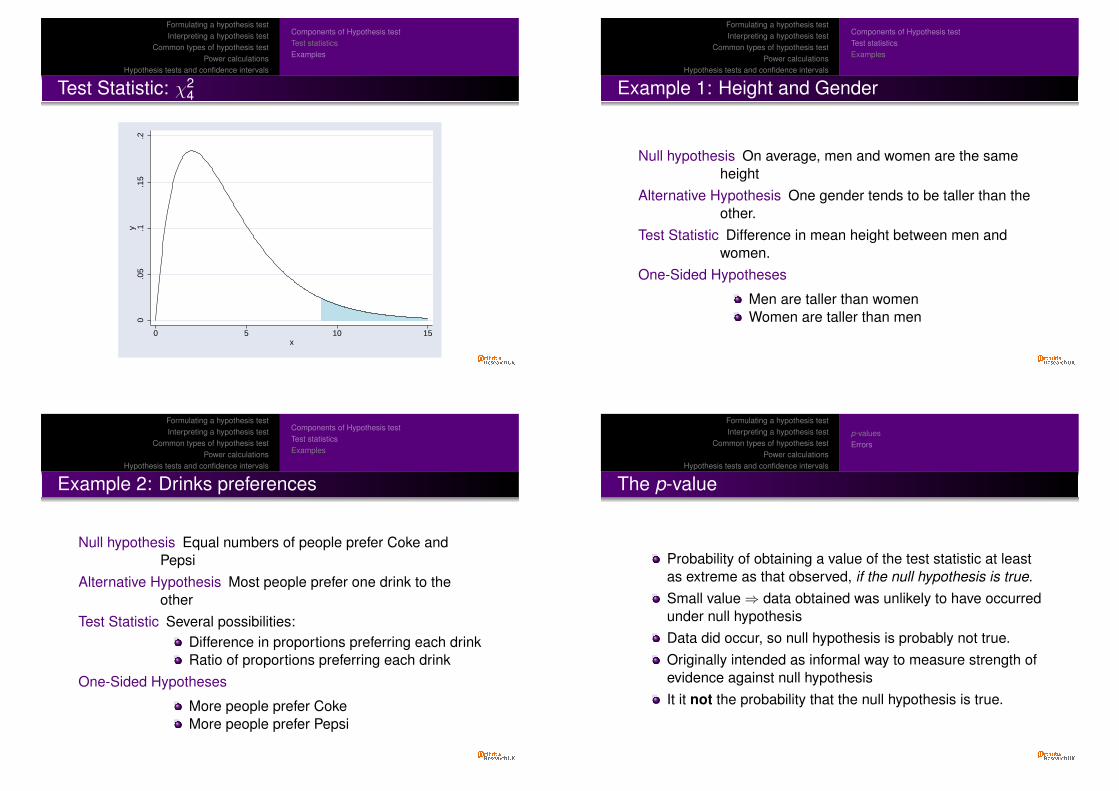
Test Statistic: χ24
0.0
5.1
.15
.2y
0 5 10 15x
Formulating a hypothesis testInterpreting a hypothesis test
Common types of hypothesis testPower calculations
Hypothesis tests and confidence intervals
Components of Hypothesis testTest statisticsExamples
Example 1: Height and Gender
Null hypothesis On average, men and women are the sameheight
Alternative Hypothesis One gender tends to be taller than theother.
Test Statistic Difference in mean height between men andwomen.
One-Sided Hypotheses
Men are taller than womenWomen are taller than men
Formulating a hypothesis testInterpreting a hypothesis test
Common types of hypothesis testPower calculations
Hypothesis tests and confidence intervals
Components of Hypothesis testTest statisticsExamples
Example 2: Drinks preferences
Null hypothesis Equal numbers of people prefer Coke andPepsi
Alternative Hypothesis Most people prefer one drink to theother
Test Statistic Several possibilities:Difference in proportions preferring each drinkRatio of proportions preferring each drink
One-Sided Hypotheses
More people prefer CokeMore people prefer Pepsi
Formulating a hypothesis testInterpreting a hypothesis test
Common types of hypothesis testPower calculations
Hypothesis tests and confidence intervals
p-valuesErrors
The p-value
Probability of obtaining a value of the test statistic at leastas extreme as that observed, if the null hypothesis is true.Small value⇒ data obtained was unlikely to have occurredunder null hypothesisData did occur, so null hypothesis is probably not true.Originally intended as informal way to measure strength ofevidence against null hypothesisIt it not the probability that the null hypothesis is true.
Formulating a hypothesis testInterpreting a hypothesis test
Common types of hypothesis testPower calculations
Hypothesis tests and confidence intervals
p-valuesErrors
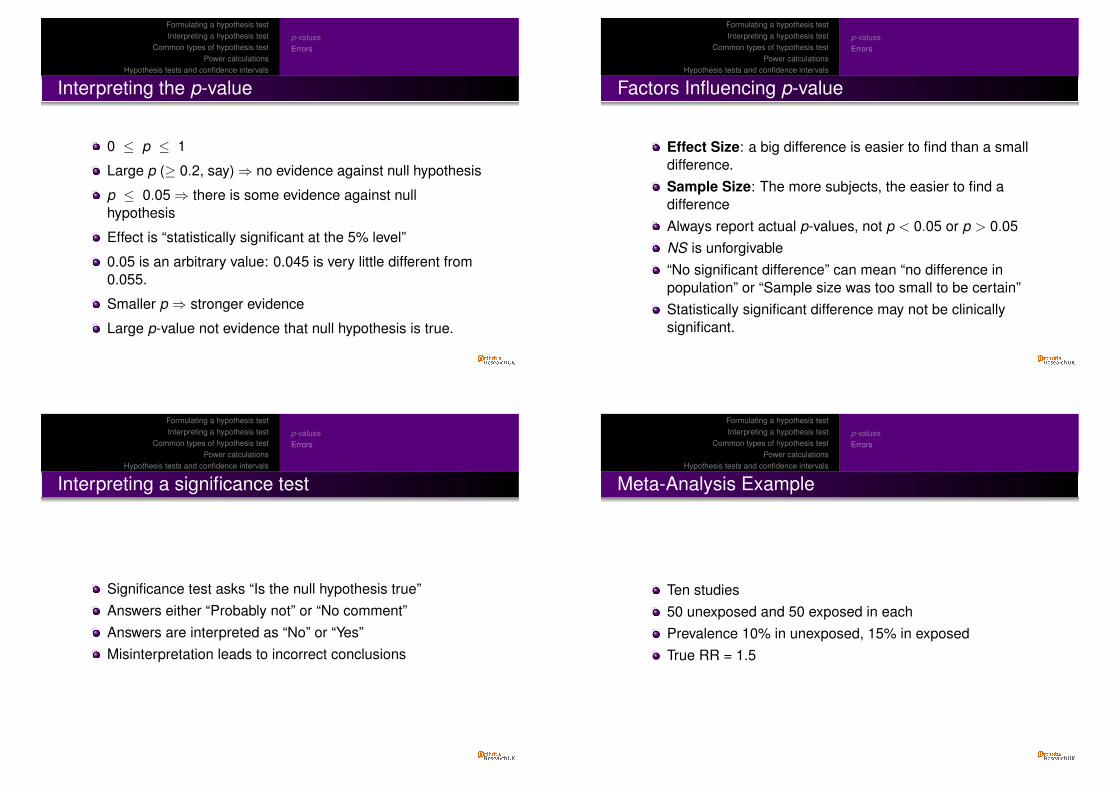
Interpreting the p-value
0 ≤ p ≤ 1
Large p (≥ 0.2, say)⇒ no evidence against null hypothesis
p ≤ 0.05⇒ there is some evidence against nullhypothesis
Effect is “statistically significant at the 5% level”
0.05 is an arbitrary value: 0.045 is very little different from0.055.
Smaller p ⇒ stronger evidence
Large p-value not evidence that null hypothesis is true.
Formulating a hypothesis testInterpreting a hypothesis test
Common types of hypothesis testPower calculations
Hypothesis tests and confidence intervals
p-valuesErrors
Factors Influencing p-value
Effect Size: a big difference is easier to find than a smalldifference.Sample Size: The more subjects, the easier to find adifferenceAlways report actual p-values, not p < 0.05 or p > 0.05NS is unforgivable“No significant difference” can mean “no difference inpopulation” or “Sample size was too small to be certain”Statistically significant difference may not be clinicallysignificant.
Formulating a hypothesis testInterpreting a hypothesis test
Common types of hypothesis testPower calculations
Hypothesis tests and confidence intervals
p-valuesErrors
Interpreting a significance test
Significance test asks “Is the null hypothesis true”Answers either “Probably not” or “No comment”Answers are interpreted as “No” or “Yes”Misinterpretation leads to incorrect conclusions
Formulating a hypothesis testInterpreting a hypothesis test
Common types of hypothesis testPower calculations
Hypothesis tests and confidence intervals
p-valuesErrors
Meta-Analysis Example
Ten studies50 unexposed and 50 exposed in eachPrevalence 10% in unexposed, 15% in exposedTrue RR = 1.5
Formulating a hypothesis testInterpreting a hypothesis test
Common types of hypothesis testPower calculations
Hypothesis tests and confidence intervals
p-valuesErrors
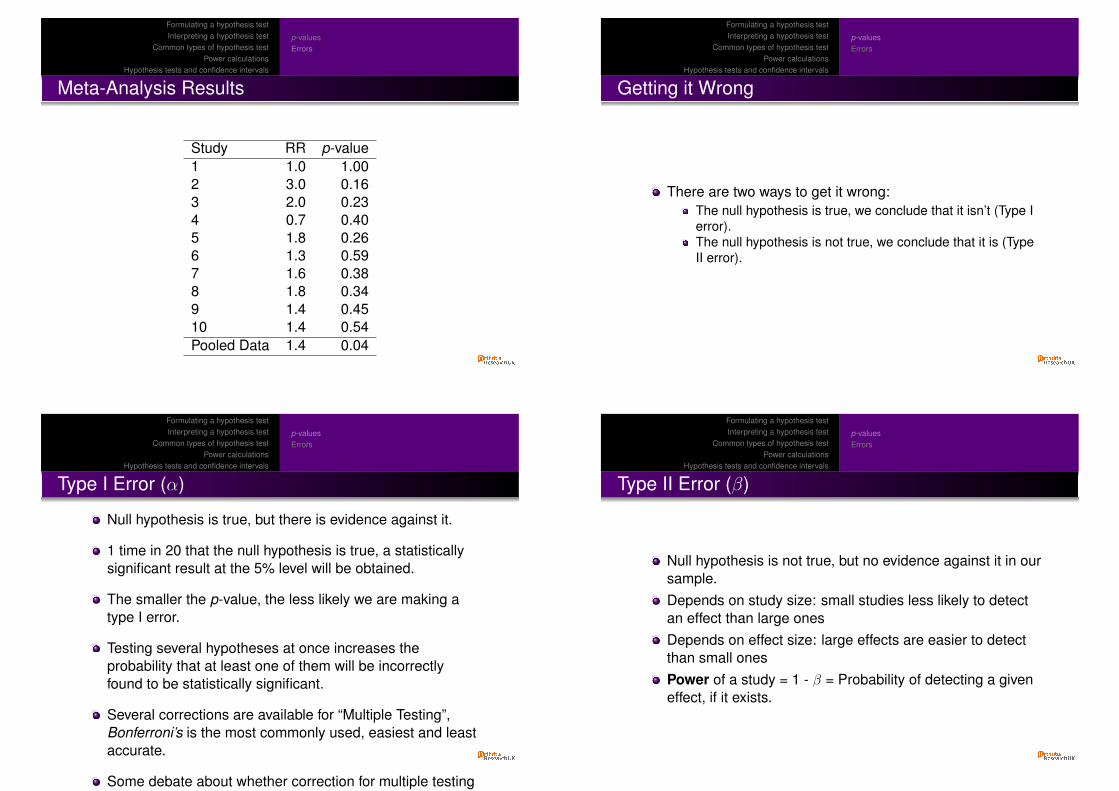
Meta-Analysis Results
Study RR p-value1 1.0 1.002 3.0 0.163 2.0 0.234 0.7 0.405 1.8 0.266 1.3 0.597 1.6 0.388 1.8 0.349 1.4 0.4510 1.4 0.54Pooled Data 1.4 0.04
Formulating a hypothesis testInterpreting a hypothesis test
Common types of hypothesis testPower calculations
Hypothesis tests and confidence intervals
p-valuesErrors
Getting it Wrong
There are two ways to get it wrong:The null hypothesis is true, we conclude that it isn’t (Type Ierror).The null hypothesis is not true, we conclude that it is (TypeII error).
Formulating a hypothesis testInterpreting a hypothesis test
Common types of hypothesis testPower calculations
Hypothesis tests and confidence intervals
p-valuesErrors
Type I Error (α)
Null hypothesis is true, but there is evidence against it.
1 time in 20 that the null hypothesis is true, a statisticallysignificant result at the 5% level will be obtained.
The smaller the p-value, the less likely we are making atype I error.
Testing several hypotheses at once increases theprobability that at least one of them will be incorrectlyfound to be statistically significant.
Several corrections are available for “Multiple Testing”,Bonferroni’s is the most commonly used, easiest and leastaccurate.
Some debate about whether correction for multiple testingis necessary.
Formulating a hypothesis testInterpreting a hypothesis test
Common types of hypothesis testPower calculations
Hypothesis tests and confidence intervals
p-valuesErrors
Type II Error (β)
Null hypothesis is not true, but no evidence against it in oursample.Depends on study size: small studies less likely to detectan effect than large onesDepends on effect size: large effects are easier to detectthan small onesPower of a study = 1 - β = Probability of detecting a giveneffect, if it exists.
Formulating a hypothesis testInterpreting a hypothesis test
Common types of hypothesis testPower calculations
Hypothesis tests and confidence intervals
One-sample t-testTwo-sample t-testComparing proportions
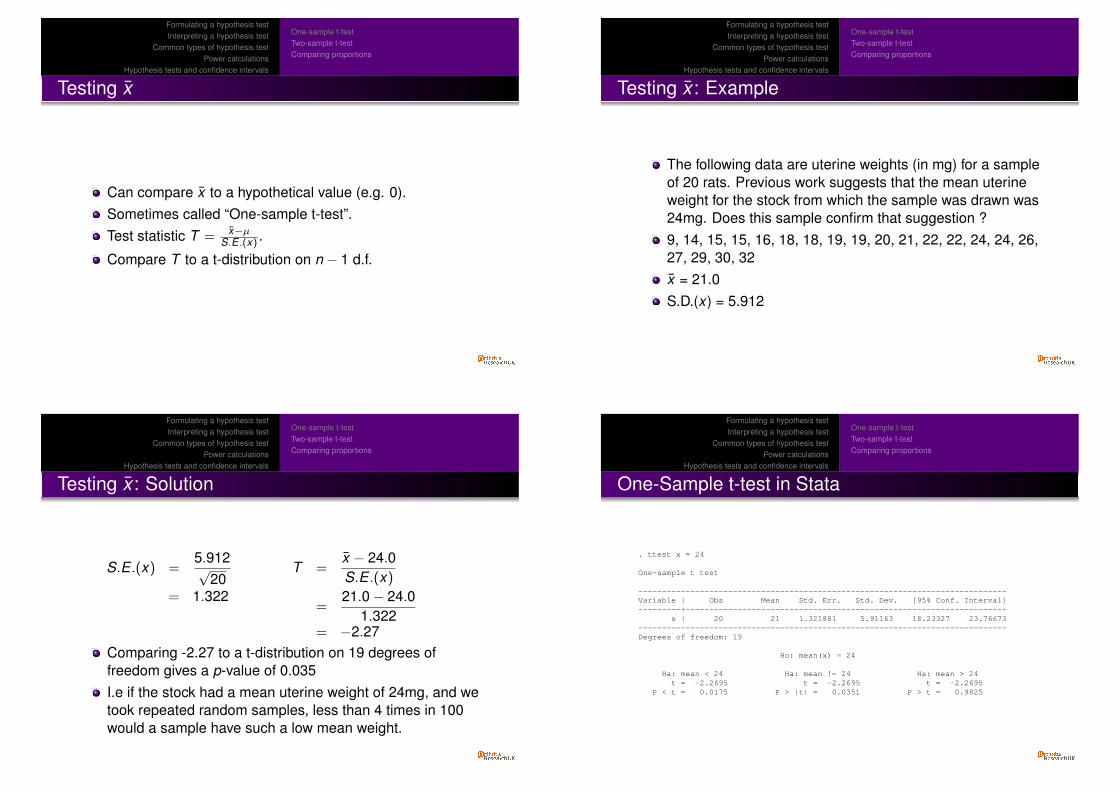
Testing x
Can compare x to a hypothetical value (e.g. 0).Sometimes called “One-sample t-test”.Test statistic T = x−µ
S.E .(x) .
Compare T to a t-distribution on n − 1 d.f.
Formulating a hypothesis testInterpreting a hypothesis test
Common types of hypothesis testPower calculations
Hypothesis tests and confidence intervals
One-sample t-testTwo-sample t-testComparing proportions
Testing x : Example
The following data are uterine weights (in mg) for a sampleof 20 rats. Previous work suggests that the mean uterineweight for the stock from which the sample was drawn was24mg. Does this sample confirm that suggestion ?9, 14, 15, 15, 16, 18, 18, 19, 19, 20, 21, 22, 22, 24, 24, 26,27, 29, 30, 32x = 21.0S.D.(x) = 5.912
Formulating a hypothesis testInterpreting a hypothesis test
Common types of hypothesis testPower calculations
Hypothesis tests and confidence intervals
One-sample t-testTwo-sample t-testComparing proportions
Testing x : Solution
S.E .(x) =5.912√
20= 1.322
T =x − 24.0S.E .(x)
=21.0− 24.0
1.322= −2.27
Comparing -2.27 to a t-distribution on 19 degrees offreedom gives a p-value of 0.035I.e if the stock had a mean uterine weight of 24mg, and wetook repeated random samples, less than 4 times in 100would a sample have such a low mean weight.
Formulating a hypothesis testInterpreting a hypothesis test
Common types of hypothesis testPower calculations
Hypothesis tests and confidence intervals
One-sample t-testTwo-sample t-testComparing proportions
One-Sample t-test in Stata
. ttest x = 24
One-sample t test
------------------------------------------------------------------------------Variable | Obs Mean Std. Err. Std. Dev. [95% Conf. Interval]---------+--------------------------------------------------------------------
x | 20 21 1.321881 5.91163 18.23327 23.76673------------------------------------------------------------------------------Degrees of freedom: 19
Ho: mean(x) = 24
Ha: mean < 24 Ha: mean != 24 Ha: mean > 24t = -2.2695 t = -2.2695 t = -2.2695
P < t = 0.0175 P > |t| = 0.0351 P > t = 0.9825
Formulating a hypothesis testInterpreting a hypothesis test
Common types of hypothesis testPower calculations
Hypothesis tests and confidence intervals
One-sample t-testTwo-sample t-testComparing proportions
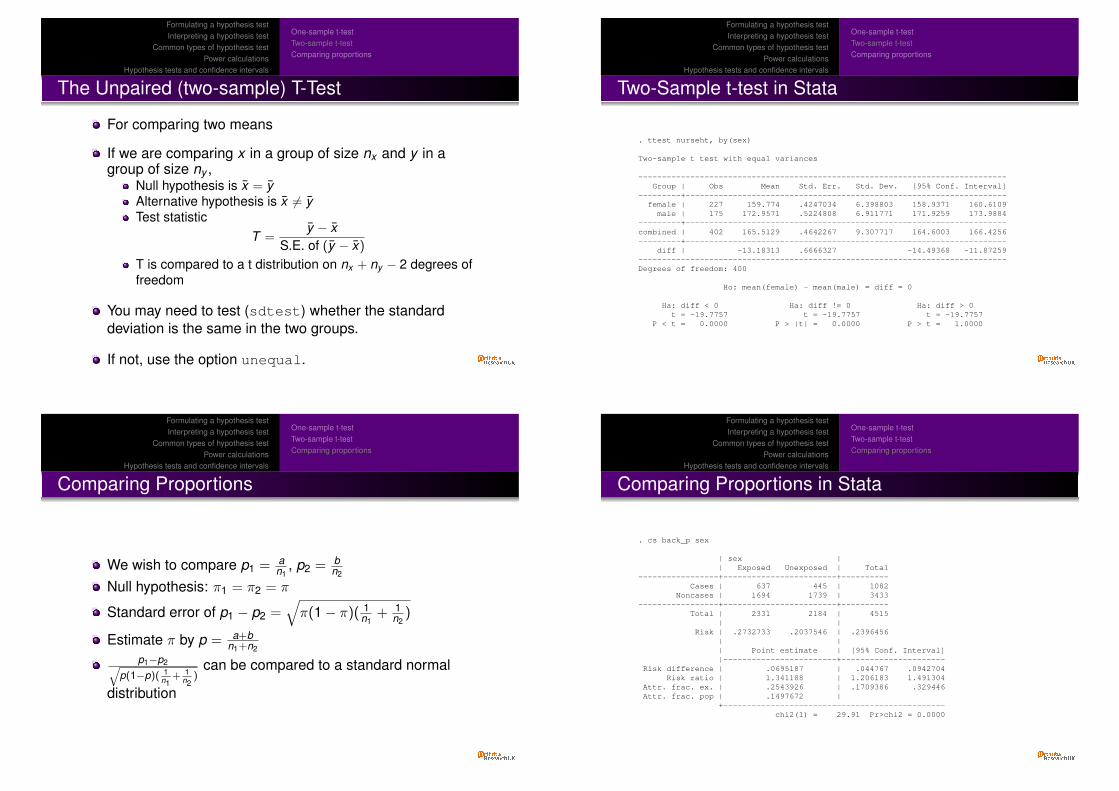
The Unpaired (two-sample) T-Test
For comparing two means
If we are comparing x in a group of size nx and y in agroup of size ny ,
Null hypothesis is x = yAlternative hypothesis is x 6= yTest statistic
T =y − x
S.E. of (y − x)
T is compared to a t distribution on nx + ny − 2 degrees offreedom
You may need to test (sdtest) whether the standarddeviation is the same in the two groups.
If not, use the option unequal.
Formulating a hypothesis testInterpreting a hypothesis test
Common types of hypothesis testPower calculations
Hypothesis tests and confidence intervals
One-sample t-testTwo-sample t-testComparing proportions
Two-Sample t-test in Stata
. ttest nurseht, by(sex)
Two-sample t test with equal variances
------------------------------------------------------------------------------Group | Obs Mean Std. Err. Std. Dev. [95% Conf. Interval]
---------+--------------------------------------------------------------------female | 227 159.774 .4247034 6.398803 158.9371 160.6109
male | 175 172.9571 .5224808 6.911771 171.9259 173.9884---------+--------------------------------------------------------------------combined | 402 165.5129 .4642267 9.307717 164.6003 166.4256---------+--------------------------------------------------------------------
diff | -13.18313 .6666327 -14.49368 -11.87259------------------------------------------------------------------------------Degrees of freedom: 400
Ho: mean(female) - mean(male) = diff = 0
Ha: diff < 0 Ha: diff != 0 Ha: diff > 0t = -19.7757 t = -19.7757 t = -19.7757
P < t = 0.0000 P > |t| = 0.0000 P > t = 1.0000
Formulating a hypothesis testInterpreting a hypothesis test
Common types of hypothesis testPower calculations
Hypothesis tests and confidence intervals
One-sample t-testTwo-sample t-testComparing proportions
Comparing Proportions
We wish to compare p1 = an1
, p2 = bn2
Null hypothesis: π1 = π2 = π
Standard error of p1 − p2 =√π(1− π)( 1
n1+ 1
n2)
Estimate π by p = a+bn1+n2
p1−p2√p(1−p)( 1
n1+ 1
n2)
can be compared to a standard normal
distribution
Formulating a hypothesis testInterpreting a hypothesis test
Common types of hypothesis testPower calculations
Hypothesis tests and confidence intervals
One-sample t-testTwo-sample t-testComparing proportions
Comparing Proportions in Stata
. cs back_p sex
| sex || Exposed Unexposed | Total
-----------------+------------------------+----------Cases | 637 445 | 1082
Noncases | 1694 1739 | 3433-----------------+------------------------+----------
Total | 2331 2184 | 4515| |
Risk | .2732733 .2037546 | .2396456| || Point estimate | [95% Conf. Interval]|------------------------+----------------------
Risk difference | .0695187 | .044767 .0942704Risk ratio | 1.341188 | 1.206183 1.491304
Attr. frac. ex. | .2543926 | .1709386 .329446Attr. frac. pop | .1497672 |
+-----------------------------------------------chi2(1) = 29.91 Pr>chi2 = 0.0000
Formulating a hypothesis testInterpreting a hypothesis test
Common types of hypothesis testPower calculations
Hypothesis tests and confidence intervals
How power calculations workPower calculations in stata
Sample Size
Given:Null hypothesis valueAlternative hypothesis valueStandard errorSignificance level (generally 5%)
Calculate:Power to reject null hypothesis for given sample sizeSample size to give chosen power to reject null hypothesis
Formulating a hypothesis testInterpreting a hypothesis test
Common types of hypothesis testPower calculations
Hypothesis tests and confidence intervals
How power calculations workPower calculations in stata
Power Calculations Illustrated: 1
0.1
.2.3
.4y
H0x
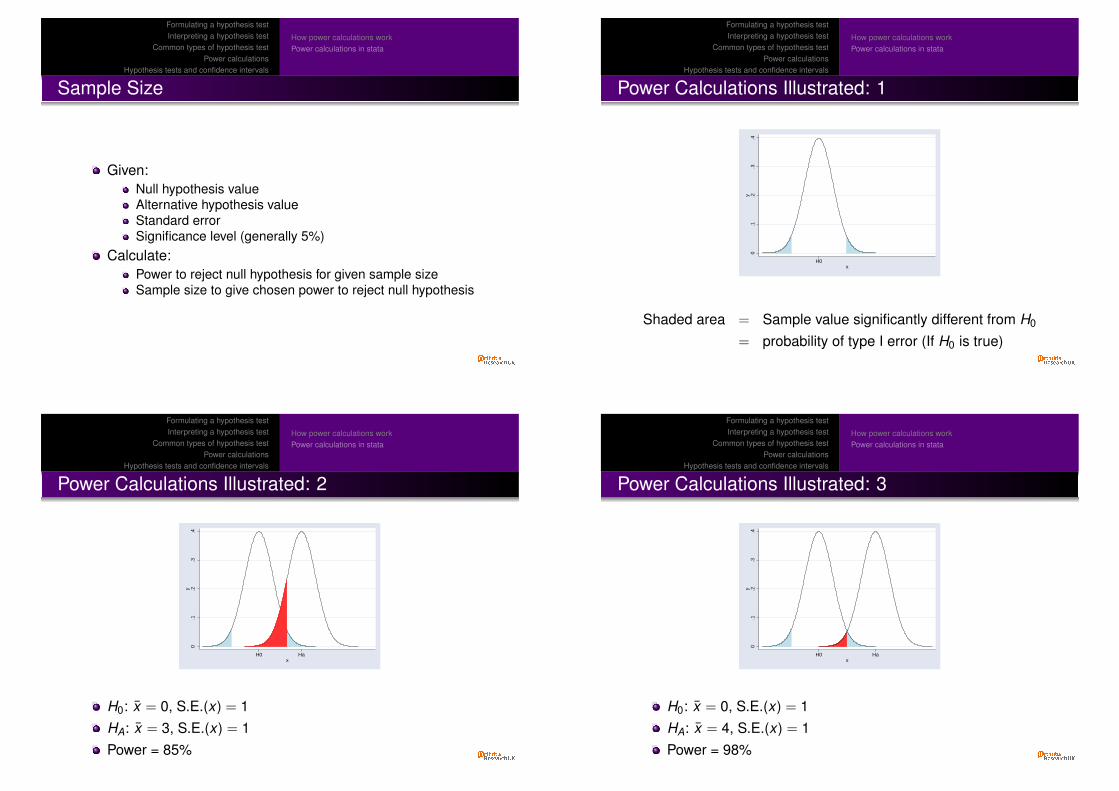
Shaded area = Sample value significantly different from H0
= probability of type I error (If H0 is true)
Formulating a hypothesis testInterpreting a hypothesis test
Common types of hypothesis testPower calculations
Hypothesis tests and confidence intervals
How power calculations workPower calculations in stata
Power Calculations Illustrated: 2
0.1
.2.3
.4y
H0 Hax
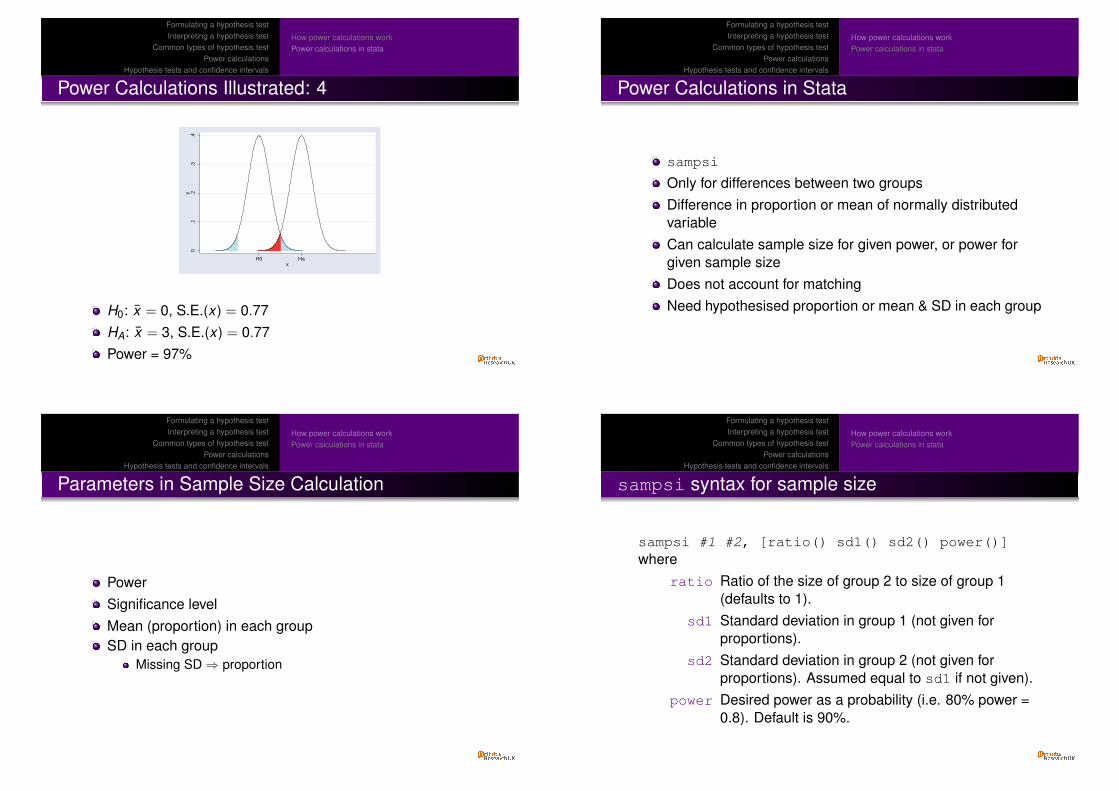
H0: x = 0, S.E.(x) = 1HA: x = 3, S.E.(x) = 1Power = 85%
Formulating a hypothesis testInterpreting a hypothesis test
Common types of hypothesis testPower calculations
Hypothesis tests and confidence intervals
How power calculations workPower calculations in stata
Power Calculations Illustrated: 3
0.1
.2.3
.4y
H0 Hax
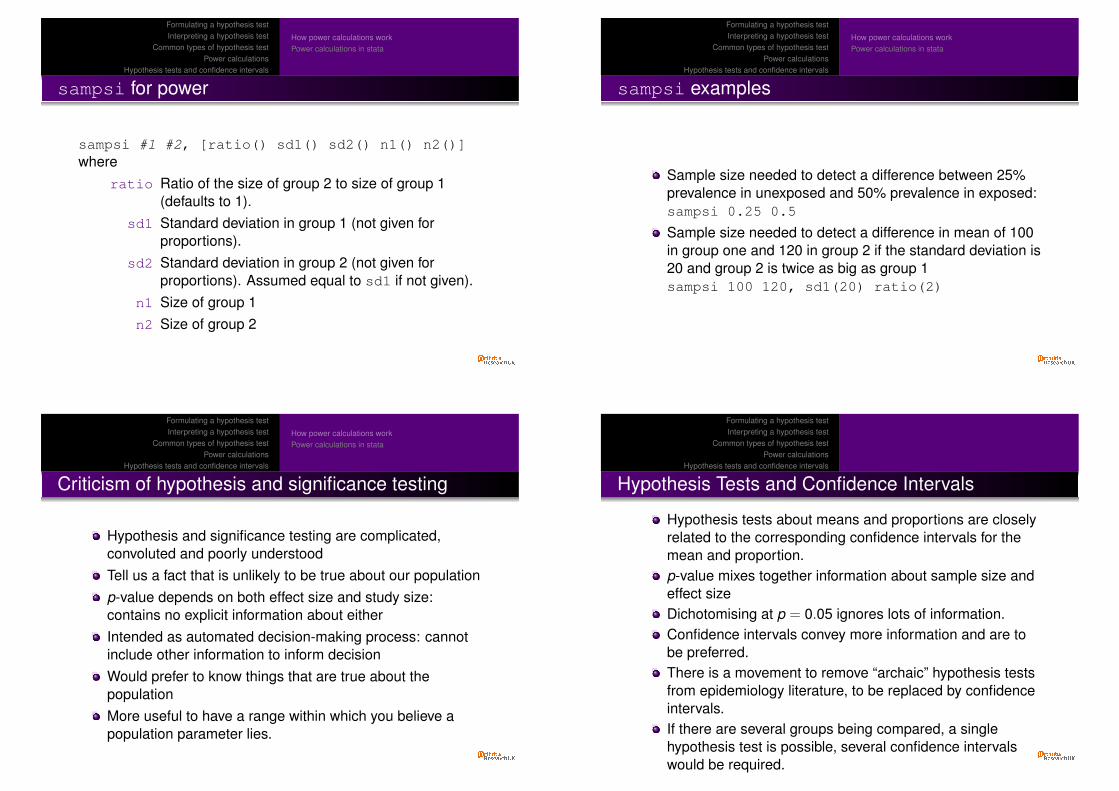
H0: x = 0, S.E.(x) = 1HA: x = 4, S.E.(x) = 1Power = 98%
Formulating a hypothesis testInterpreting a hypothesis test
Common types of hypothesis testPower calculations
Hypothesis tests and confidence intervals
How power calculations workPower calculations in stata
Power Calculations Illustrated: 4
0.1
.2.3
.4y
H0 Hax
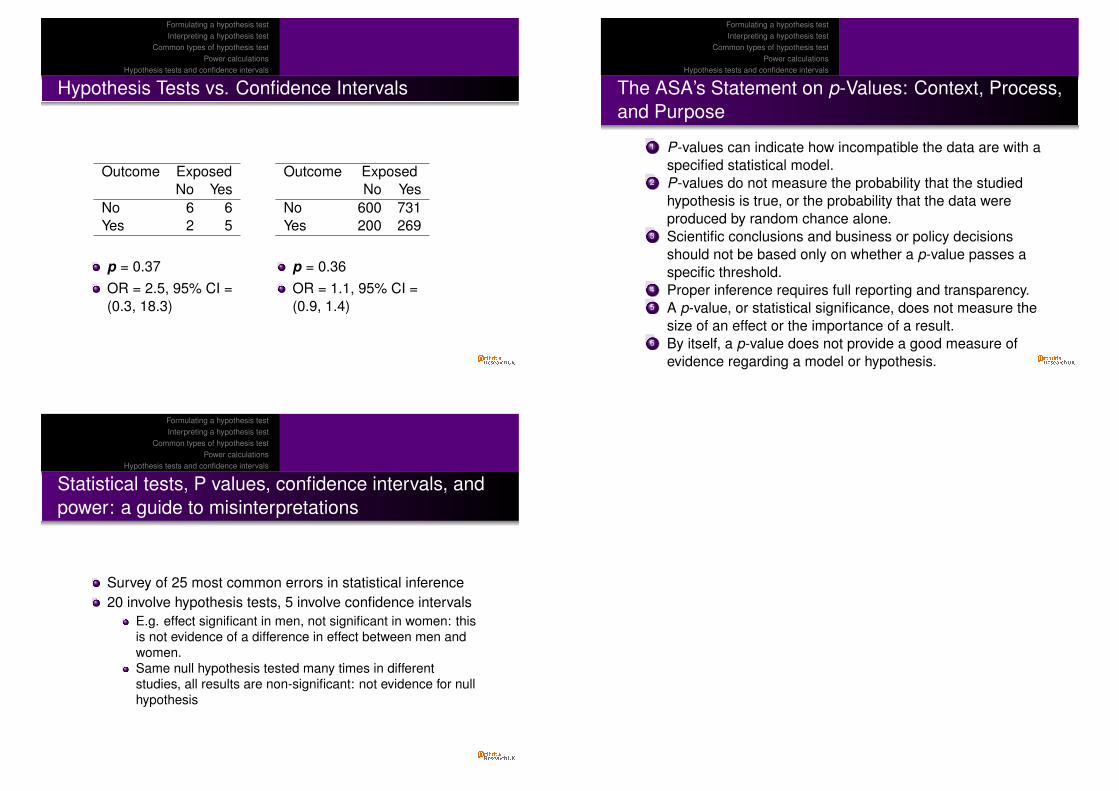
H0: x = 0, S.E.(x) = 0.77HA: x = 3, S.E.(x) = 0.77Power = 97%
Formulating a hypothesis testInterpreting a hypothesis test
Common types of hypothesis testPower calculations
Hypothesis tests and confidence intervals
How power calculations workPower calculations in stata
Power Calculations in Stata
sampsi
Only for differences between two groupsDifference in proportion or mean of normally distributedvariableCan calculate sample size for given power, or power forgiven sample sizeDoes not account for matchingNeed hypothesised proportion or mean & SD in each group
Formulating a hypothesis testInterpreting a hypothesis test
Common types of hypothesis testPower calculations
Hypothesis tests and confidence intervals
How power calculations workPower calculations in stata
Parameters in Sample Size Calculation
PowerSignificance levelMean (proportion) in each groupSD in each group
Missing SD⇒ proportion
Formulating a hypothesis testInterpreting a hypothesis test
Common types of hypothesis testPower calculations
Hypothesis tests and confidence intervals
How power calculations workPower calculations in stata
sampsi syntax for sample size
sampsi #1 #2, [ratio() sd1() sd2() power()]where
ratio Ratio of the size of group 2 to size of group 1(defaults to 1).
sd1 Standard deviation in group 1 (not given forproportions).
sd2 Standard deviation in group 2 (not given forproportions). Assumed equal to sd1 if not given).
power Desired power as a probability (i.e. 80% power =0.8). Default is 90%.
Formulating a hypothesis testInterpreting a hypothesis test
Common types of hypothesis testPower calculations
Hypothesis tests and confidence intervals
How power calculations workPower calculations in stata
sampsi for power
sampsi #1 #2, [ratio() sd1() sd2() n1() n2()]where
ratio Ratio of the size of group 2 to size of group 1(defaults to 1).
sd1 Standard deviation in group 1 (not given forproportions).
sd2 Standard deviation in group 2 (not given forproportions). Assumed equal to sd1 if not given).
n1 Size of group 1n2 Size of group 2
Formulating a hypothesis testInterpreting a hypothesis test
Common types of hypothesis testPower calculations
Hypothesis tests and confidence intervals
How power calculations workPower calculations in stata
sampsi examples
Sample size needed to detect a difference between 25%prevalence in unexposed and 50% prevalence in exposed:sampsi 0.25 0.5
Sample size needed to detect a difference in mean of 100in group one and 120 in group 2 if the standard deviation is20 and group 2 is twice as big as group 1sampsi 100 120, sd1(20) ratio(2)
Formulating a hypothesis testInterpreting a hypothesis test
Common types of hypothesis testPower calculations
Hypothesis tests and confidence intervals
How power calculations workPower calculations in stata
Criticism of hypothesis and significance testing
Hypothesis and significance testing are complicated,convoluted and poorly understoodTell us a fact that is unlikely to be true about our populationp-value depends on both effect size and study size:contains no explicit information about eitherIntended as automated decision-making process: cannotinclude other information to inform decisionWould prefer to know things that are true about thepopulationMore useful to have a range within which you believe apopulation parameter lies.
Formulating a hypothesis testInterpreting a hypothesis test
Common types of hypothesis testPower calculations
Hypothesis tests and confidence intervals
Hypothesis Tests and Confidence Intervals
Hypothesis tests about means and proportions are closelyrelated to the corresponding confidence intervals for themean and proportion.p-value mixes together information about sample size andeffect sizeDichotomising at p = 0.05 ignores lots of information.Confidence intervals convey more information and are tobe preferred.There is a movement to remove “archaic” hypothesis testsfrom epidemiology literature, to be replaced by confidenceintervals.If there are several groups being compared, a singlehypothesis test is possible, several confidence intervalswould be required.
Formulating a hypothesis testInterpreting a hypothesis test
Common types of hypothesis testPower calculations
Hypothesis tests and confidence intervals
Hypothesis Tests vs. Confidence Intervals
Outcome ExposedNo Yes
No 6 6Yes 2 5
p = 0.37OR = 2.5, 95% CI =(0.3, 18.3)
Outcome ExposedNo Yes
No 600 731Yes 200 269
p = 0.36OR = 1.1, 95% CI =(0.9, 1.4)
Formulating a hypothesis testInterpreting a hypothesis test
Common types of hypothesis testPower calculations
Hypothesis tests and confidence intervals
The ASA’s Statement on p-Values: Context, Process,and Purpose
1 P-values can indicate how incompatible the data are with aspecified statistical model.
2 P-values do not measure the probability that the studiedhypothesis is true, or the probability that the data wereproduced by random chance alone.
3 Scientific conclusions and business or policy decisionsshould not be based only on whether a p-value passes aspecific threshold.
4 Proper inference requires full reporting and transparency.5 A p-value, or statistical significance, does not measure the
size of an effect or the importance of a result.6 By itself, a p-value does not provide a good measure of
evidence regarding a model or hypothesis.
Formulating a hypothesis testInterpreting a hypothesis test
Common types of hypothesis testPower calculations
Hypothesis tests and confidence intervals
Statistical tests, P values, confidence intervals, andpower: a guide to misinterpretations
Survey of 25 most common errors in statistical inference20 involve hypothesis tests, 5 involve confidence intervals
E.g. effect significant in men, not significant in women: thisis not evidence of a difference in effect between men andwomen.Same null hypothesis tested many times in differentstudies, all results are non-significant: not evidence for nullhypothesis
Recommended


