Chapter 12Introduction to Analysis of Variance
PowerPoint Lecture Slides
Essentials of Statistics for the Behavioral SciencesEighth Edition
by Frederick J. Gravetter and Larry B. Wallnau

Chapter 12 Learning Outcomes
• Explain purpose and logic of Analysis of Variance1
• Perform Analysis of Variance on data from single-factor study2
• Know when and why to use post hoc tests (posttests)3
• Compute Tukey’s HSD and Scheffé test post hoc tests 4
• Compute η2 to measure effect size5
Tools You Will Need
• Variability (Chapter 4)
– Sum of squares
– Sample variance
– Degrees of freedom
• Introduction to hypothesis testing (Chapter 8)
– The logic of hypothesis testing
• Independent-measures t statistic (Chapter 10)
12.1 Introduction to Analysis of Variance
• Analysis of variance
– Used to evaluate mean differences between two or more treatments
– Uses sample data as basis for drawing general conclusions about populations
• Clear advantage over a t test: it can be used to compare more than two treatments at the same time

Figure 12.1 Typical Situationfor Using ANOVA

Terminology
• Factor
– The independent (or quasi-independent) variable that designates the groups being compared
• Levels
– Individual conditions or values that make up a factor
• Factorial design
– A study that combines two or more factors

Figure 12.2 Two-Factor Research Design

Statistical Hypotheses for ANOVA
• Null hypothesis: the level or value on the factor does not affect the dependent variable
– In the population, this is equivalent to saying that the means of the groups do not differ from each other
• 3210 : H
Alternate Hypothesis for ANOVA
• H1: There is at least one mean difference among the populations (Acceptable shorthand is “Not H0”)
• Issue: how many ways can H0 be wrong?
– All means are different from every other mean
– Some means are not different from some others, but other means do differ from some means

Test statistic for ANOVA
• F-ratio is based on variance instead of sample mean differences
effect treatment no withexpected es)(differenc variance
means samplebetween es)(differenc varianceF
Test statistic for ANOVA
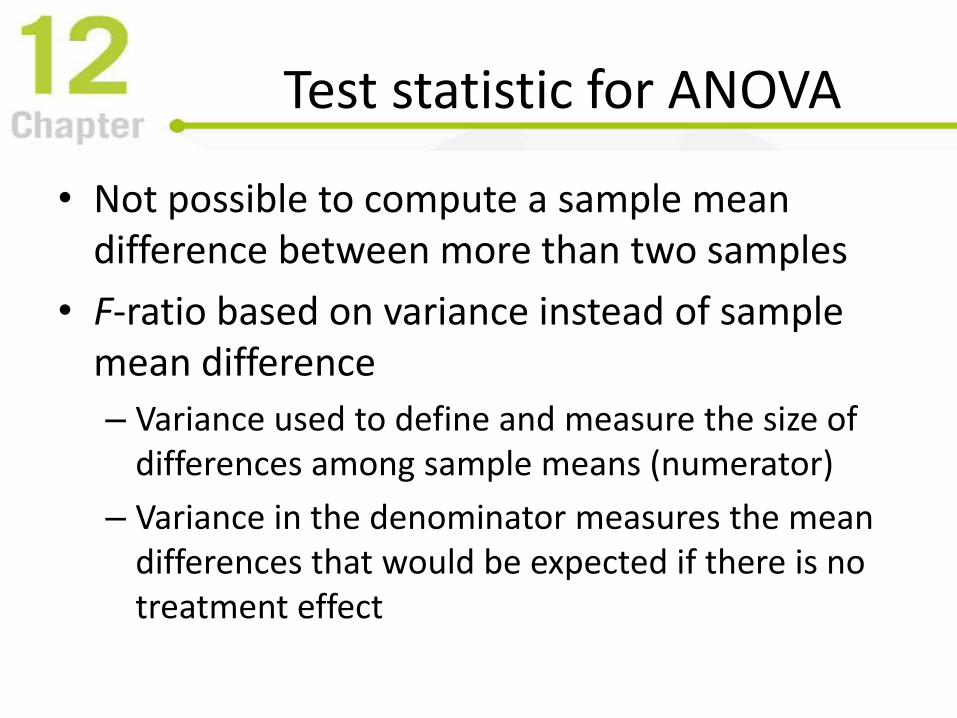
• Not possible to compute a sample mean difference between more than two samples
• F-ratio based on variance instead of sample mean difference
– Variance used to define and measure the size of differences among sample means (numerator)
– Variance in the denominator measures the mean differences that would be expected if there is no treatment effect

Type I Errors andMultiple-Hypothesis tests
• Why ANOVA (if t can compare two means)?
– Experiments often require multiple hypothesis tests—each with Type I error (testwise alpha)
– Type I error for a set of tests accumulates testwisealpha experimentwise alpha > testwise alpha
• ANOVA evaluates all mean differences simultaneously with one test—regardless of the number of means—and thereby avoids the problem of inflated experimentwise alpha

12.2 Analysis of Variance Logic
• Between-treatments variance
– Variability results from general differences between the treatment conditions
– Variance between treatments measures differences among sample means
• Within-treatments variance
– Variability within each sample
– Individual scores are not the same within each sample

Sources of VariabilityBetween Treatments
• Systematic differences caused by treatments
• Random, unsystematic differences
– Individual differences
– Experimental (measurement) error

Sources of VariabilityWithin Treatments
• No systematic differences related to treatment groups occur within each group
• Random, unsystematic differences
– Individual differences
– Experimental (measurement) error
effects treatment no withsdifference
effects treatmentany including sdifferenceF

Figure 12.3 Total Variability Partitioned into Two Components

F-ratio
• If H0 is true:
– Size of treatment effect is near zero
– F is near 1.00
• If H1 is true:
– Size of treatment effect is more than 0.
– F is noticeably larger than 1.00
• Denominator of the F-ratio is called the error term

Learning Check
• Decide if each of the following statements is True or False
• ANOVA allows researchers to compare several treatment conditions without conducting several hypothesis tests
T/F
• If the null hypothesis is true, the F-ratio for ANOVA is expected (on average) to have a value of 0
T/F

Learning Check - Answers
• Several conditions can be compared in one testTrue
• If the null hypothesis is true, the F-ratio will have a value near 1.00
False
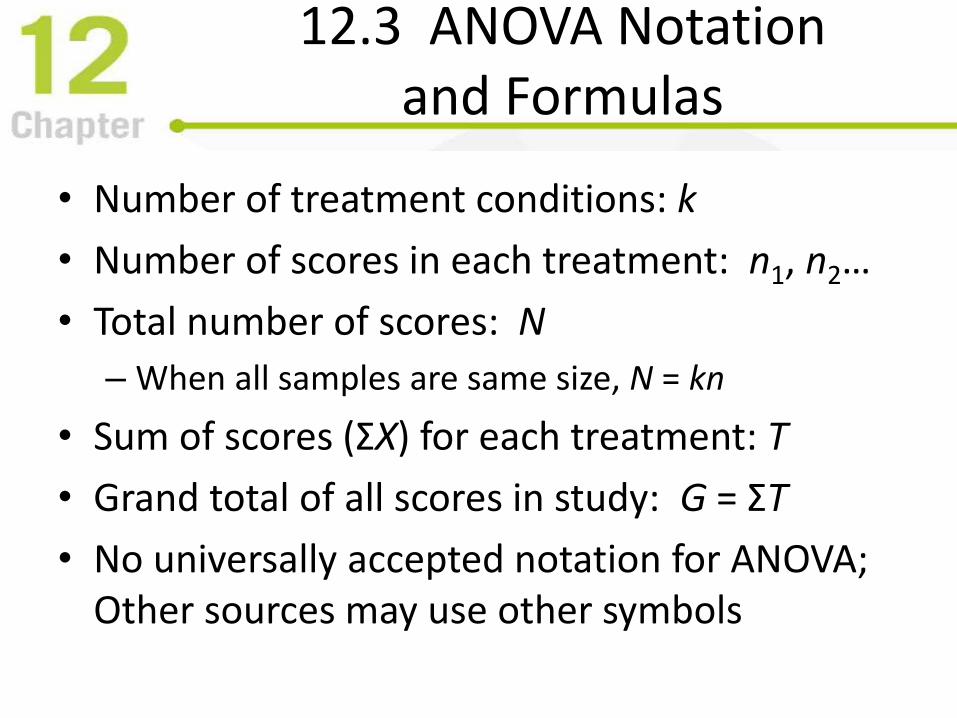
12.3 ANOVA Notationand Formulas
• Number of treatment conditions: k
• Number of scores in each treatment: n1, n2…
• Total number of scores: N
– When all samples are same size, N = kn
• Sum of scores (ΣX) for each treatment: T
• Grand total of all scores in study: G = ΣT
• No universally accepted notation for ANOVA; Other sources may use other symbols

Figure 12.4 ANOVA Calculation
Structure and Sequence

Figure 12.5 Partitioning SS for Independent-measures ANOVA

ANOVA equations
N
GXSStotal
22
treatment each insidetreatmentswithin SSSS
N
G
n
TSS treatmentsbetween
22

Degrees of Freedom Analysis
• Total degrees of freedomdftotal= N – 1
• Within-treatments degrees of freedomdfwithin= N – k
• Between-treatments degrees of freedomdfbetween= k – 1

Figure 12.6 Partitioning Degrees of Freedom

Mean Squares and F-ratio
within
withinwithinwithin
df
SSsMS 2
between
betweenbetweenbetween
df
SSsMS 2
within
between
within
between
MS
MS
s
sF
2
2

ANOVA Summary Table
Source SS df MS F
Between Treatments 40 2 20 10
Within Treatments 20 10 2
Total 60 12
•Concise method for presenting ANOVA results
•Helps organize and direct the analysis process
•Convenient for checking computations
•“Standard” statistical analysis program output
Learning Check
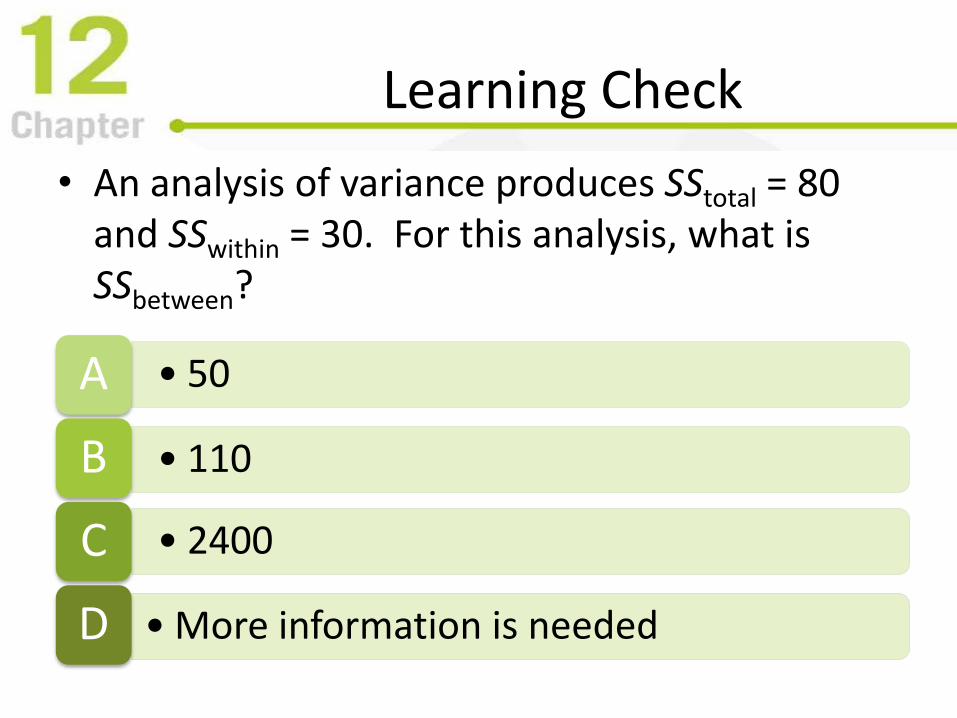
• An analysis of variance produces SStotal = 80 and SSwithin = 30. For this analysis, what is SSbetween?
• 50A
• 110B
• 2400C
• More information is neededD

Learning Check - Answer
• An analysis of variance produces SStotal = 80 and SSwithin = 30. For this analysis, what is SSbetween?
• 50A
• 110B
• 2400C
• More information is neededD

12.4 Distribution of F-ratios
• If the null hypothesis is true, the value of F will be around 1.00
• Because F-ratios are computed from two variances, they are always positive numbers
• Table of F values is organized by two df
– df numerator (between) shown in table columns
– df denominator (within) shown in table rows
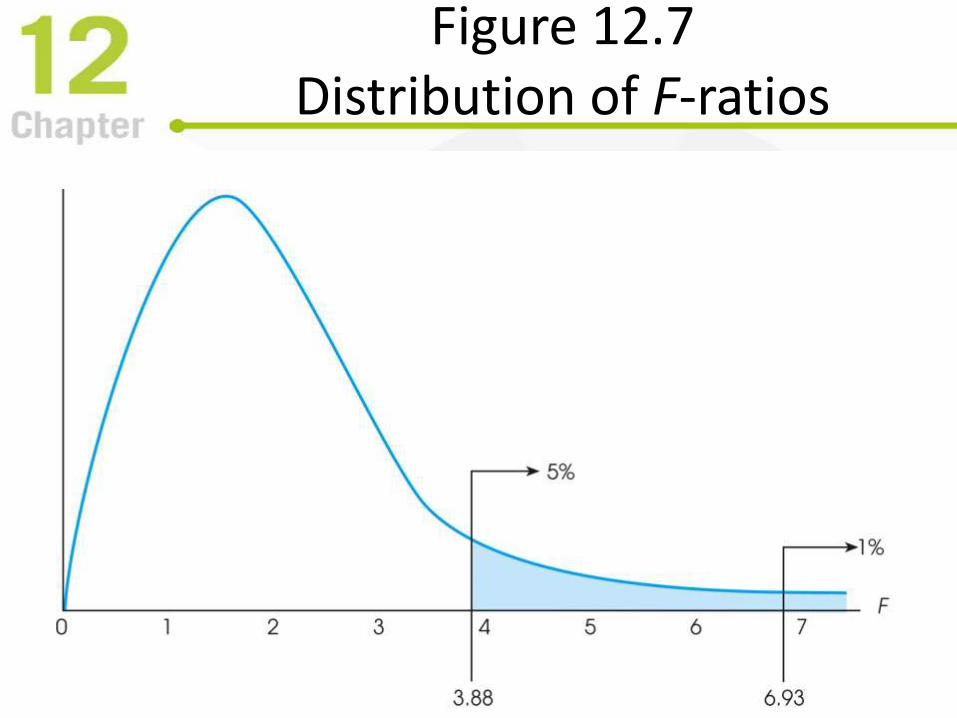
Figure 12.7 Distribution of F-ratios
12.5 Examples of Hypothesis Testing and Effect Size
• Hypothesis tests use the same four steps that have been used in earlier hypothesis tests.
• Computation of the test statistic F is donein stages
– Compute SStotal, SSbetween, SSwithin
– Compute MStotal, MSbetween, MSwithin
– Compute F

Figure 12.8 Critical region for α=.01 in Distribution of F-ratios
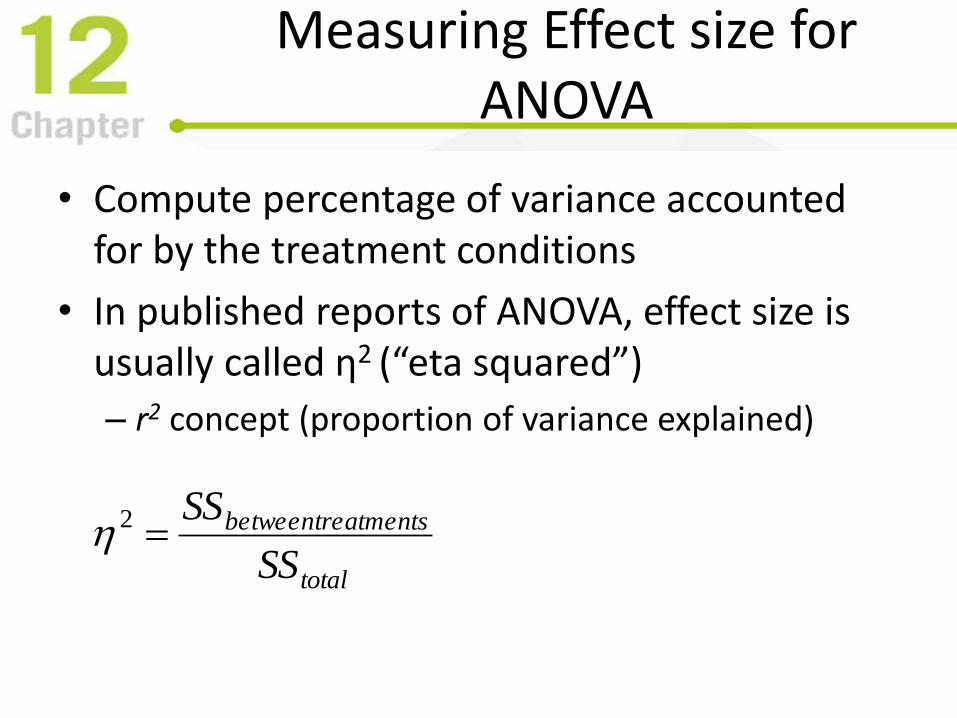
Measuring Effect size for ANOVA
• Compute percentage of variance accounted for by the treatment conditions
• In published reports of ANOVA, effect size is usually called η2 (“eta squared”)
– r2 concept (proportion of variance explained)
total
treatments between
SS
SS2

In the Literature
• Treatment means and standard deviations are presented in text, table or graph
• Results of ANOVA are summarized, including
– F and df
– p-value
– η2
• E.g., F(3,20) = 6.45, p<.01, η2 = 0.492

Figure 12.9 Visual Representation of Between & Within Variability
MSwithin and Pooled Variance
• In the t-statistic and in the F-ratio, the variances from the separate samples are pooled together to create one average value for the sample variance
• Numerator of F-ratio measures how much difference exists between treatment means.
• Denominator measures the variance of the scores inside each treatment

12.6 post hoc Tests
• ANOVA compares all individual mean differences simultaneously, in one test
• A significant F-ratio indicates that at least one difference in means is statistically significant
– Does not indicate which means differ significantly from each other!
• post hoc tests are follow up tests done to determine exactly which mean differences are significant, and which are not
Experimentwise Alpha
• post hoc tests compare two individual means at a time (pairwise comparison)
– Each comparison includes risk of a Type I error
– Risk of Type I error accumulates and is called the experimentwise alpha level.
• Increasing the number of hypothesis tests increases the total probability of a Type I error
• post hoc (“posttests”) use special methods to try to control experimentwise Type I error rate

Tukey’s Honestly Significant Difference
• A single value that determines the minimum difference between treatment means that is necessary to claim statistical significance–a difference large enough that p < αexperimentwise
– Honestly Significant Difference (HSD)
n
MSqHSD within

The Scheffé Test
• The Scheffé test is one of the safest of all possible post hoc tests
– Uses an F-ratio to evaluate significance of the difference between two treatment conditions
groups twoof SS with calculatedB A versus
within
between
MS
MSF

Learning Check
• Which combination of factors is most likely to produce a large value for the F-ratio?
• large mean differences and large sample variancesA
• large mean differences and small sample variancesB
• small mean differences and large sample variancesC
• small mean differences and small sample variancesD
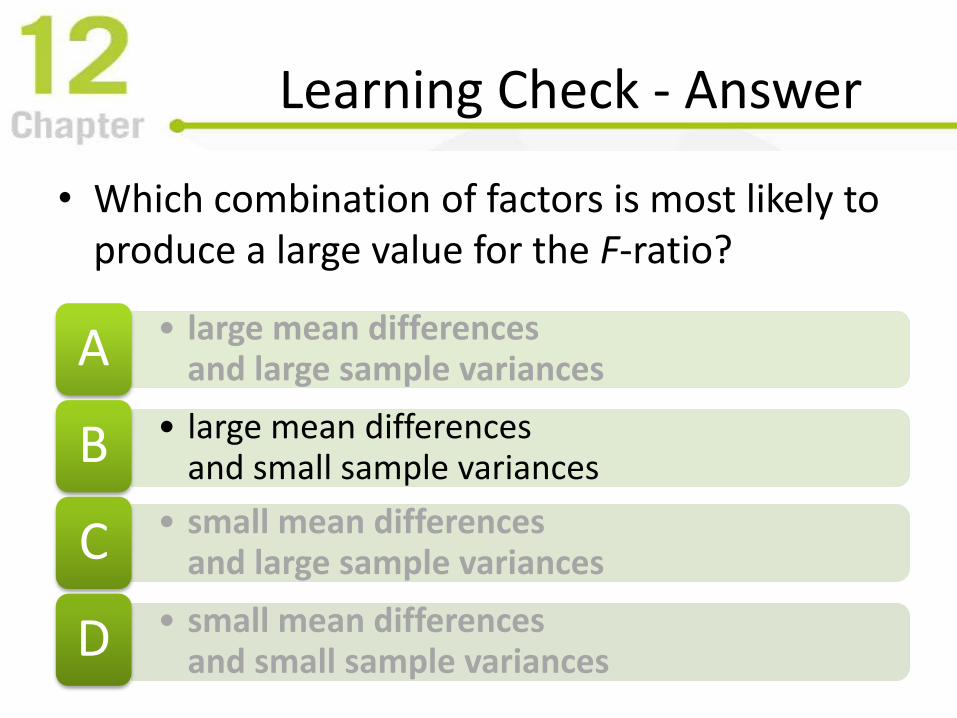
Learning Check - Answer
• Which combination of factors is most likely to produce a large value for the F-ratio?
• large mean differences and large sample variancesA
• large mean differences and small sample variancesB
• small mean differences and large sample variancesC
• small mean differences and small sample variancesD

Learning Check
• Decide if each of the following statements is True or False
• Post tests are needed if the decision from an analysis of variance is “fail to reject the null hypothesis”
T/F
• A report shows ANOVA results: F(2, 27) = 5.36, p < .05. You can conclude that the study used a total of 30 participants
T/F

Learning Check - Answers
• post hoc tests are needed only if you reject H0 (indicating at least one mean difference is significant)
False
• Because dftotal = N-1 and
• Because dftotal = dfbetween + dfwithinTrue
12.7 Relationship between ANOVA and t tests
• For two independent samples, either t or Fcan be used
– Always result in same decision
– F = t2
• For any value of α, (tcritical)2 = Fcritical

Figure 12.10 Distribution of t and F statistics

Independent Measures ANOVA Assumptions
• The observations within each sample must be independent
• The population from which the samples are selected must be normal
• The populations from which the samples are selected must have equal variances(homogeneity of variance)
• Violating the assumption of homogeneity of variance risks invalid test results

Figure 12.11 Formulas for ANOVA

Figure 12.12 Distribution of t and F statistics

AnyQuestions
?
Concepts?
Equations?
Recommended