Embed Size (px)
Citation preview

Chapter 12Introduction to Analysis of Variance
PowerPoint Lecture Slides
Essentials of Statistics for the Behavioral SciencesEighth Edition
by Frederick J. Gravetter and Larry B. Wallnau

Chapter 12 Learning Outcomes
• Explain purpose and logic of Analysis of Variance1
• Perform Analysis of Variance on data from single-factor study2
• Know when and why to use post hoc tests (posttests)3
• Compute Tukey’s HSD and Scheffé test post hoc tests 4
• Compute η2 to measure effect size5
Tools You Will Need
• Variability (Chapter 4)
– Sum of squares
– Sample variance
– Degrees of freedom
• Introduction to hypothesis testing (Chapter 8)
– The logic of hypothesis testing
• Independent-measures t statistic (Chapter 10)
12.1 Introduction to Analysis of Variance
• Analysis of variance
– Used to evaluate mean differences between two or more treatments
– Uses sample data as basis for drawing general conclusions about populations
• Clear advantage over a t test: it can be used to compare more than two treatments at the same time

Figure 12.1 Typical Situationfor Using ANOVA

Terminology
• Factor
– The independent (or quasi-independent) variable that designates the groups being compared
• Levels
– Individual conditions or values that make up a factor
• Factorial design
– A study that combines two or more factors

Figure 12.2 Two-Factor Research Design

Statistical Hypotheses for ANOVA
• Null hypothesis: the level or value on the factor does not affect the dependent variable
– In the population, this is equivalent to saying that the means of the groups do not differ from each other
• 3210 : H
Alternate Hypothesis for ANOVA
• H1: There is at least one mean difference among the populations (Acceptable shorthand is “Not H0”)
• Issue: how many ways can H0 be wrong?
– All means are different from every other mean
– Some means are not different from some others, but other means do differ from some means

Test statistic for ANOVA
• F-ratio is based on variance instead of sample mean differences
effect treatment no withexpected es)(differenc variance
means samplebetween es)(differenc varianceF
Test statistic for ANOVA
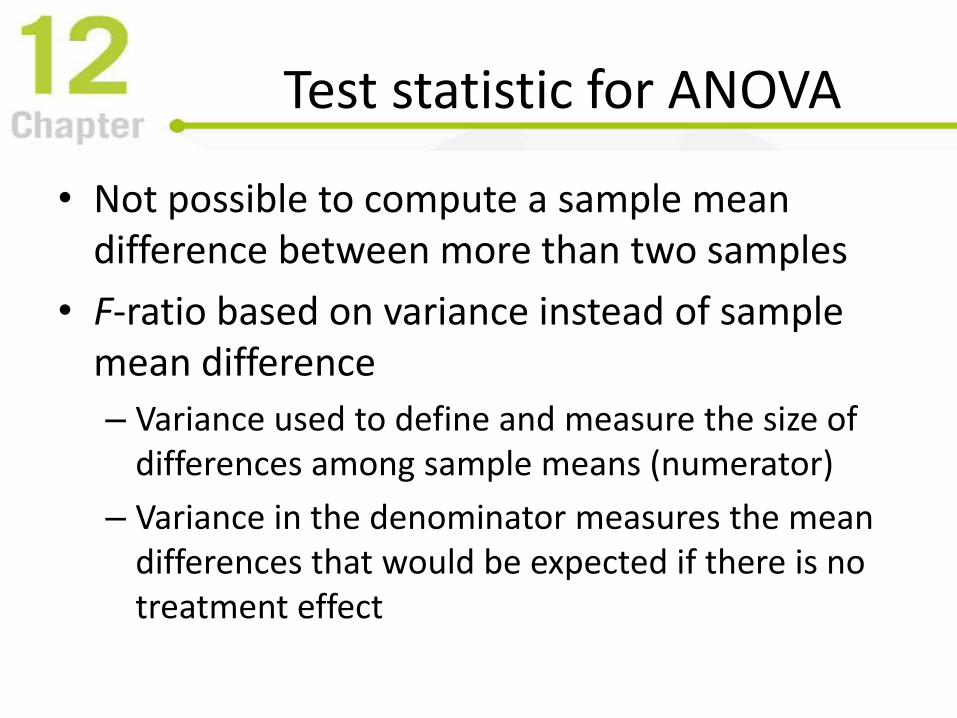
• Not possible to compute a sample mean difference between more than two samples
• F-ratio based on variance instead of sample mean difference
– Variance used to define and measure the size of differences among sample means (numerator)
– Variance in the denominator measures the mean differences that would be expected if there is no treatment effect

Type I Errors andMultiple-Hypothesis tests
• Why ANOVA (if t can compare two means)?
– Experiments often require multiple hypothesis tests—each with Type I error (testwise alpha)
– Type I error for a set of tests accumulates testwisealpha experimentwise alpha > testwise alpha
• ANOVA evaluates all mean differences simultaneously with one test—regardless of the number of means—and thereby avoids the problem of inflated experimentwise alpha

12.2 Analysis of Variance Logic
• Between-treatments variance
– Variability results from general differences between the treatment conditions
– Variance between treatments measures differences among sample means
• Within-treatments variance
– Variability within each sample
– Individual scores are not the same within each sample

Sources of VariabilityBetween Treatments
• Systematic differences caused by treatments
• Random, unsystematic differences
– Individual differences
– Experimental (measurement) error

Sources of VariabilityWithin Treatments
• No systematic differences related to treatment groups occur within each group
• Random, unsystematic differences
– Individual differences
– Experimental (measurement) error
effects treatment no withsdifference
effects treatmentany including sdifferenceF

Figure 12.3 Total Variability Partitioned into Two Components

F-ratio
• If H0 is true:
– Size of treatment effect is near zero
– F is near 1.00
• If H1 is true:
– Size of treatment effect is more than 0.
– F is noticeably larger than 1.00
• Denominator of the F-ratio is called the error term

Learning Check
• Decide if each of the following statements is True or False
• ANOVA allows researchers to compare several treatment conditions without conducting several hypothesis tests
T/F
• If the null hypothesis is true, the F-ratio for ANOVA is expected (on average) to have a value of 0
T/F

Learning Check - Answers
• Several conditions can be compared in one testTrue
• If the null hypothesis is true, the F-ratio will have a value near 1.00
False
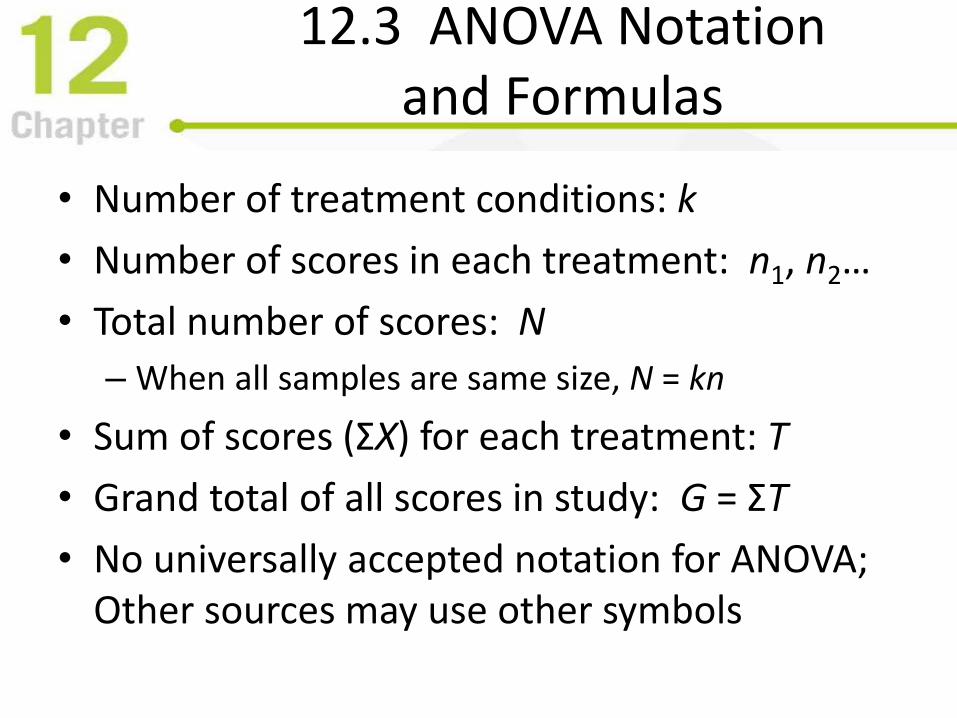
12.3 ANOVA Notationand Formulas
• Number of treatment conditions: k
• Number of scores in each treatment: n1, n2…
• Total number of scores: N
– When all samples are same size, N = kn
• Sum of scores (ΣX) for each treatment: T
• Grand total of all scores in study: G = ΣT
• No universally accepted notation for ANOVA; Other sources may use other symbols

Figure 12.4 ANOVA Calculation
Structure and Sequence

Figure 12.5 Partitioning SS for Independent-measures ANOVA

ANOVA equations
N
GXSStotal
22
treatment each insidetreatmentswithin SSSS
N
G
n
TSS treatmentsbetween
22

Degrees of Freedom Analysis
• Total degrees of freedomdftotal= N – 1
• Within-treatments degrees of freedomdfwithin= N – k
• Between-treatments degrees of freedomdfbetween= k – 1

Figure 12.6 Partitioning Degrees of Freedom

Mean Squares and F-ratio
within
withinwithinwithin
df
SSsMS 2
between
betweenbetweenbetween
df
SSsMS 2
within
between
within
between
MS
MS
s
sF
2
2

ANOVA Summary Table
Source SS df MS F
Between Treatments 40 2 20 10
Within Treatments 20 10 2
Total 60 12
•Concise method for presenting ANOVA results
•Helps organize and direct the analysis process
•Convenient for checking computations
•“Standard” statistical analysis program output
Learning Check
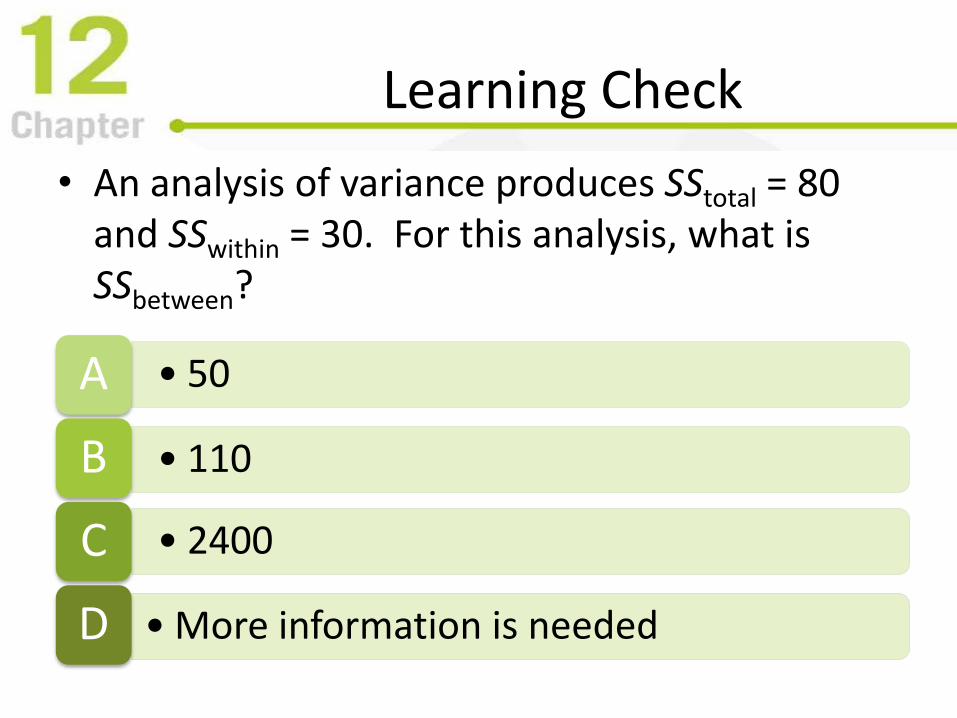
• An analysis of variance produces SStotal = 80 and SSwithin = 30. For this analysis, what is SSbetween?
• 50A
• 110B
• 2400C
• More information is neededD

Learning Check - Answer
• An analysis of variance produces SStotal = 80 and SSwithin = 30. For this analysis, what is SSbetween?
• 50A
• 110B
• 2400C
• More information is neededD

12.4 Distribution of F-ratios
• If the null hypothesis is true, the value of F will be around 1.00
• Because F-ratios are computed from two variances, they are always positive numbers
• Table of F values is organized by two df
– df numerator (between) shown in table columns
– df denominator (within) shown in table rows
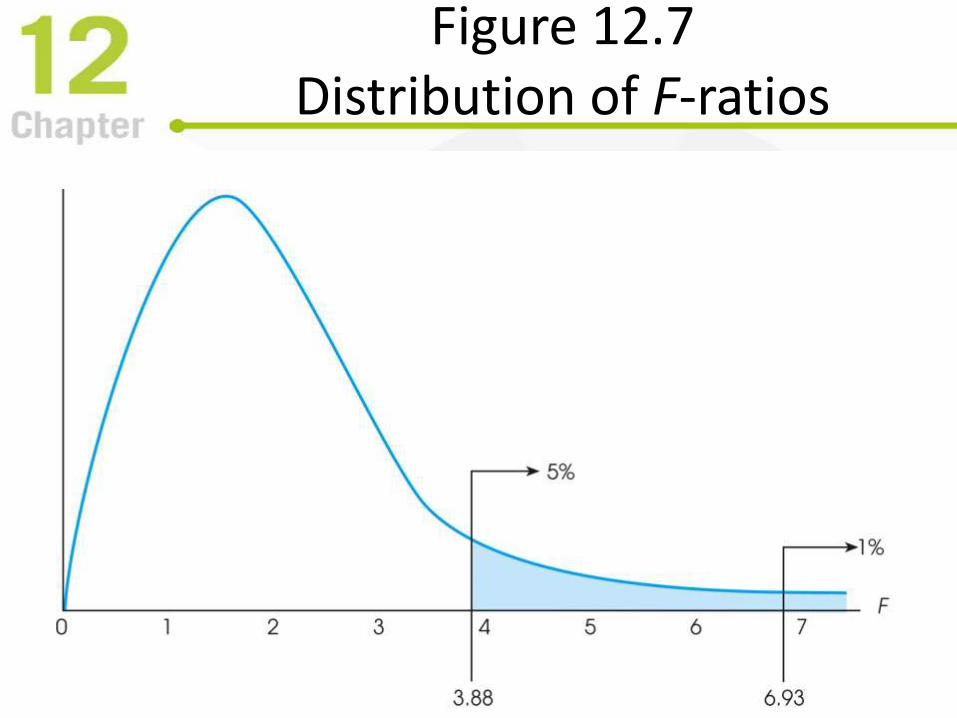
Figure 12.7 Distribution of F-ratios
12.5 Examples of Hypothesis Testing and Effect Size
• Hypothesis tests use the same four steps that have been used in earlier hypothesis tests.
• Computation of the test statistic F is donein stages
– Compute SStotal, SSbetween, SSwithin
– Compute MStotal, MSbetween, MSwithin
– Compute F

Figure 12.8 Critical region for α=.01 in Distribution of F-ratios
Measuring Effect size for ANOVA
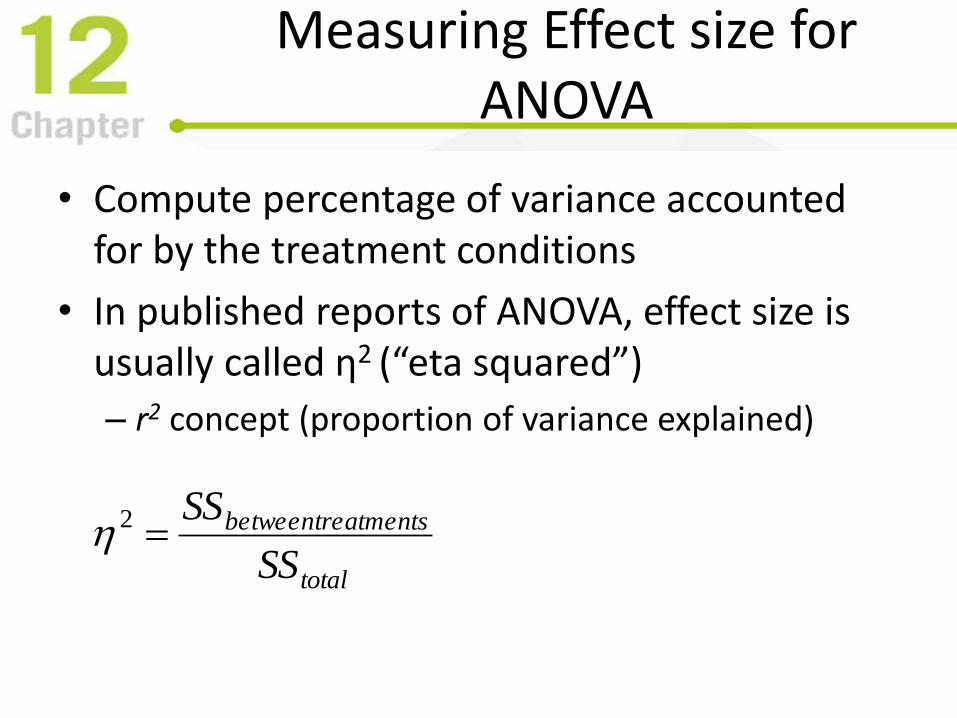
• Compute percentage of variance accounted for by the treatment conditions
• In published reports of ANOVA, effect size is usually called η2 (“eta squared”)
– r2 concept (proportion of variance explained)
total
treatments between
SS
SS2

In the Literature
• Treatment means and standard deviations are presented in text, table or graph
• Results of ANOVA are summarized, including
– F and df
– p-value
– η2
• E.g., F(3,20) = 6.45, p<.01, η2 = 0.492

Figure 12.9 Visual Representation of Between & Within Variability
MSwithin and Pooled Variance
• In the t-statistic and in the F-ratio, the variances from the separate samples are pooled together to create one average value for the sample variance
• Numerator of F-ratio measures how much difference exists between treatment means.
• Denominator measures the variance of the scores inside each treatment

12.6 post hoc Tests
• ANOVA compares all individual mean differences simultaneously, in one test
• A significant F-ratio indicates that at least one difference in means is statistically significant
– Does not indicate which means differ significantly from each other!
• post hoc tests are follow up tests done to determine exactly which mean differences are significant, and which are not
Experimentwise Alpha
• post hoc tests compare two individual means at a time (pairwise comparison)
– Each comparison includes risk of a Type I error
– Risk of Type I error accumulates and is called the experimentwise alpha level.
• Increasing the number of hypothesis tests increases the total probability of a Type I error
• post hoc (“posttests”) use special methods to try to control experimentwise Type I error rate

Tukey’s Honestly Significant Difference
• A single value that determines the minimum difference between treatment means that is necessary to claim statistical significance–a difference large enough that p < αexperimentwise
– Honestly Significant Difference (HSD)
n
MSqHSD within

The Scheffé Test
• The Scheffé test is one of the safest of all possible post hoc tests
– Uses an F-ratio to evaluate significance of the difference between two treatment conditions
groups twoof SS with calculatedB A versus
within
between
MS
MSF

Learning Check
• Which combination of factors is most likely to produce a large value for the F-ratio?
• large mean differences and large sample variancesA
• large mean differences and small sample variancesB
• small mean differences and large sample variancesC
• small mean differences and small sample variancesD
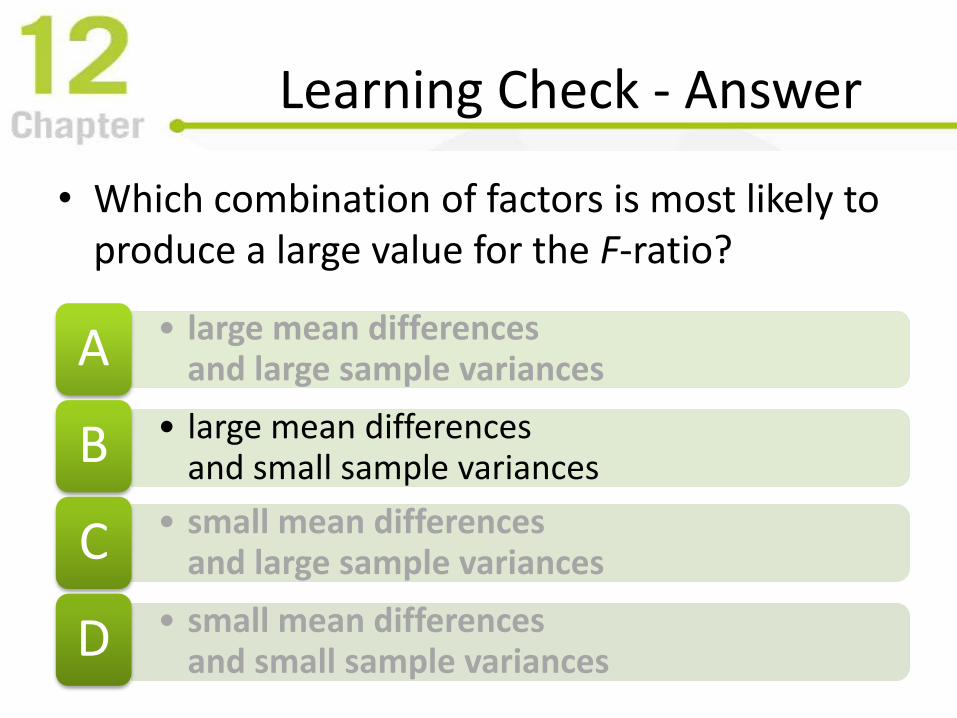
Learning Check - Answer
• Which combination of factors is most likely to produce a large value for the F-ratio?
• large mean differences and large sample variancesA
• large mean differences and small sample variancesB
• small mean differences and large sample variancesC
• small mean differences and small sample variancesD

Learning Check
• Decide if each of the following statements is True or False
• Post tests are needed if the decision from an analysis of variance is “fail to reject the null hypothesis”
T/F
• A report shows ANOVA results: F(2, 27) = 5.36, p < .05. You can conclude that the study used a total of 30 participants
T/F

Learning Check - Answers
• post hoc tests are needed only if you reject H0 (indicating at least one mean difference is significant)
False
• Because dftotal = N-1 and
• Because dftotal = dfbetween + dfwithinTrue
12.7 Relationship between ANOVA and t tests
• For two independent samples, either t or Fcan be used
– Always result in same decision
– F = t2
• For any value of α, (tcritical)2 = Fcritical

Figure 12.10 Distribution of t and F statistics

Independent Measures ANOVA Assumptions
• The observations within each sample must be independent
• The population from which the samples are selected must be normal
• The populations from which the samples are selected must have equal variances(homogeneity of variance)
• Violating the assumption of homogeneity of variance risks invalid test results

Figure 12.11 Formulas for ANOVA

Figure 12.12 Distribution of t and F statistics

AnyQuestions
?
Concepts?
Equations?