
This content has been downloaded from IOPscience. Please scroll down to see the full text.
Download details:
IP Address: 130.126.32.13
This content was downloaded on 04/06/2014 at 18:26
Please note that terms and conditions apply.
Investigation and optimization of the magnetic field configuration in high-power impulse
magnetron sputtering
View the table of contents for this issue, or go to the journal homepage for more
2013 Plasma Sources Sci. Technol. 22 045012
(http://iopscience.iop.org/0963-0252/22/4/045012)
Home Search Collections Journals About Contact us My IOPscience
IOP PUBLISHING PLASMA SOURCES SCIENCE AND TECHNOLOGY
Plasma Sources Sci. Technol. 22 (2013) 045012 (10pp) doi:10.1088/0963-0252/22/4/045012
Investigation and optimization ofthe magnetic field configuration inhigh-power impulse magnetron sputteringHe Yu1,2, Liang Meng1, Matthew M Szott1, Jake T McLain1, Tae S Cho1
and David N Ruzic1
1 Center for Plasma Material Interactions, Department of Nuclear Plasma and Radiological Engineering,University of Illinois at Urbana-Champaign, Urbana, IL 61801, USA2 State Key Laboratory of Electronic Thin Films and Integrated Devices, School of OptoelectronicInformation, University of Electronic Science and Technology of China, Chengdu 610054,People’s Republic of China
E-mail: [email protected]
Received 3 April 2013Published 5 July 2013Online at stacks.iop.org/PSST/22/045012
AbstractAn effort to optimize the magnetic field configuration specifically for high-power impulsemagnetron sputtering (HiPIMS) was made. Magnetic field configurations with different fieldstrengths, race track widths and race track patterns were designed using COMSOL. Theirinfluence on HiPIMS plasma properties was investigated using a 36 cm diameter copper target.The I–V discharge characteristics were measured. The temporal evolution of electrontemperature (Te) and density (ne) was studied employing a triple Langmuir probe, which wasalso scanned in the whole discharge region to characterize the plasma distribution andtransport. Based on the studies, a closed path for electrons to drift along was still essential inHiPIMS in order to efficiently confine electrons and achieve a high pulse current. Very denseplasmas (1019–1020 m−3) were generated in front of the race tracks during the pulse, andexpanded downstream afterwards. As the magnetic field strength increased from 200 to 800 G,the expansion became faster and less isotropic, i.e. more directional toward the substrate. Theelectric potential distribution accounted for these effects. Varied race track widths and patternsaltered the plasma distribution from the target to the substrate. A spiral-shaped magnetic fielddesign was able to produce superior plasma uniformity on the substrate in addition toimproved target utilization.
(Some figures may appear in colour only in the online journal)
1. Introduction
Magnetron sputtering (MS) has been used in a variety ofindustrial applications such as hard coatings, low frictioncoatings and coatings with specific optical or electricalproperties [1–7]. A magnetron is designed to magneticallyenhance and confine the plasma close to the cathode (thetarget). The orthogonal electric (E) and magnetic (B) fieldsresult in a classic E ×B drift for electrons. The drifting pathsform closed loops so that electrons are constrained, circulatingmany times in the near vicinity of the target. The enhancedplasma density allows for a few per cent of the sputtered atomsto be ionized. An interest to further increase the ionization,
initially driven by the need to deposit metal layers and diffusionbarriers in high aspect ratio interconnects during integratedcircuit (IC) fabrication, led to the development of ionizedphysical vapor deposition (iPVD) [2–5, 8]. The methods toimplement iPVD include supplementary plasma enhancement[7, 9], hollow cathode magnetron [5, 10], high-power impulsemagnetron sputtering (HiPIMS), etc. HiPIMS was introducedby Kouznetsov et al [11] and has been extensively studied eversince [12–14]. It is featured with very high peak power onthe target. Dense plasmas of 1019–1020 m−3 in front of thetarget are consequently achieved to produce a high degree ofionization of the sputtered material [15–17].
0963-0252/13/045012+10$33.00 1 © 2013 IOP Publishing Ltd Printed in the UK & the USA
Plasma Sources Sci. Technol. 22 (2013) 045012 H Yu et al
Magnetic field design is important in dcMS to affectthe plasma and the film deposition [1, 18–20]. The B fielddetermines the efficiency of plasma confinement and thus thesputtering rate. The B field profile on the target surface definesthe drifting path of electrons and the resultant erosion patternsuch as the so-called ‘race track’ on the target. It is generallydesirable to have a full face target erosion to control the re-deposition and to extend the target lifetime. For a sputteringprocess, it is usually critical to have uniform downstreamplasmas and deposition rates, which are affected by the racetrack pattern as well as the degree of unbalancing in themagnetic field [1, 18]. The magnetic field configuration hasto be carefully customized and combined with magnet packrotation or scanning to optimize the magnetron performance,especially for deposition on large substrates. However, theoptimization of magnetic field has been largely overlookedin HiPIMS. In most cases, rotating or scanning magnetsdesigned for dcMS are commonly used. It is known thatthe HiPIMS discharge mechanisms are unique and complex.The behaviors of the pulsed plasma including the plasmaignition, plasma growth and the downstream plasma releaseare different from those in dcMS. The influence of themagnetic field configuration on these processes is undoubtedlyimportant, but has not been systematically studied except fora few discussions regarding the magnetic field deformationin HiPIMS [21] or the effect of magnetic field strength inmodulated pulsed power MS [22].
In this study, magnetic field configurations of differentB field strengths, race track widths and race track patternswere designed using COMSOL and then created usinga fully adjustable magnet pack. The HiPIMS dischargecurrents of these configurations in a large magnetron systemwere measured. A three-dimensional (3D) scanning tripleLangmuir probe was used to measure the distribution of plasmaparameters such as the electron temperature Te, electrondensity ne and floating potential Vf as time evolved. Theeffects of magnetic field on the plasma generation and transportprocesses were discussed. Special designs such as spiral-shaped race tracks were attempted to achieve both good targetutilization and uniform downstream plasma distribution evenwithout the assistance of magnet rotation.
2. Experimental setup
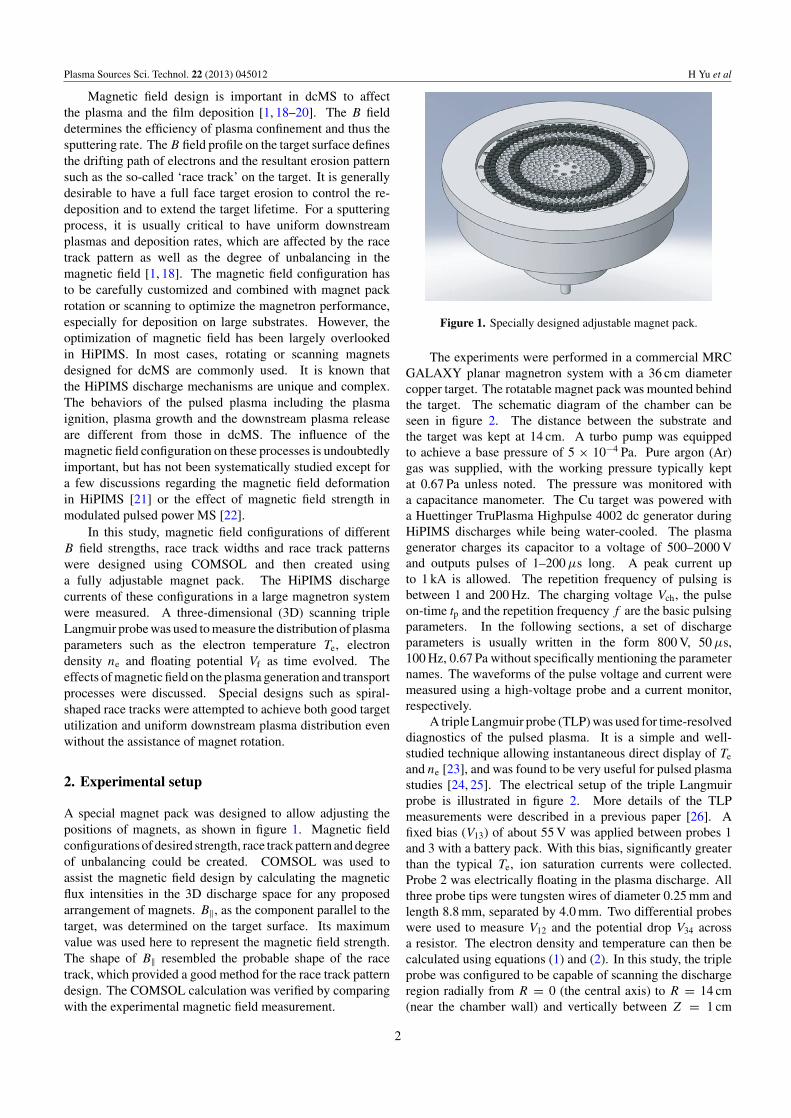
A special magnet pack was designed to allow adjusting thepositions of magnets, as shown in figure 1. Magnetic fieldconfigurations of desired strength, race track pattern and degreeof unbalancing could be created. COMSOL was used toassist the magnetic field design by calculating the magneticflux intensities in the 3D discharge space for any proposedarrangement of magnets. B‖, as the component parallel to thetarget, was determined on the target surface. Its maximumvalue was used here to represent the magnetic field strength.The shape of B‖ resembled the probable shape of the racetrack, which provided a good method for the race track patterndesign. The COMSOL calculation was verified by comparingwith the experimental magnetic field measurement.
Figure 1. Specially designed adjustable magnet pack.
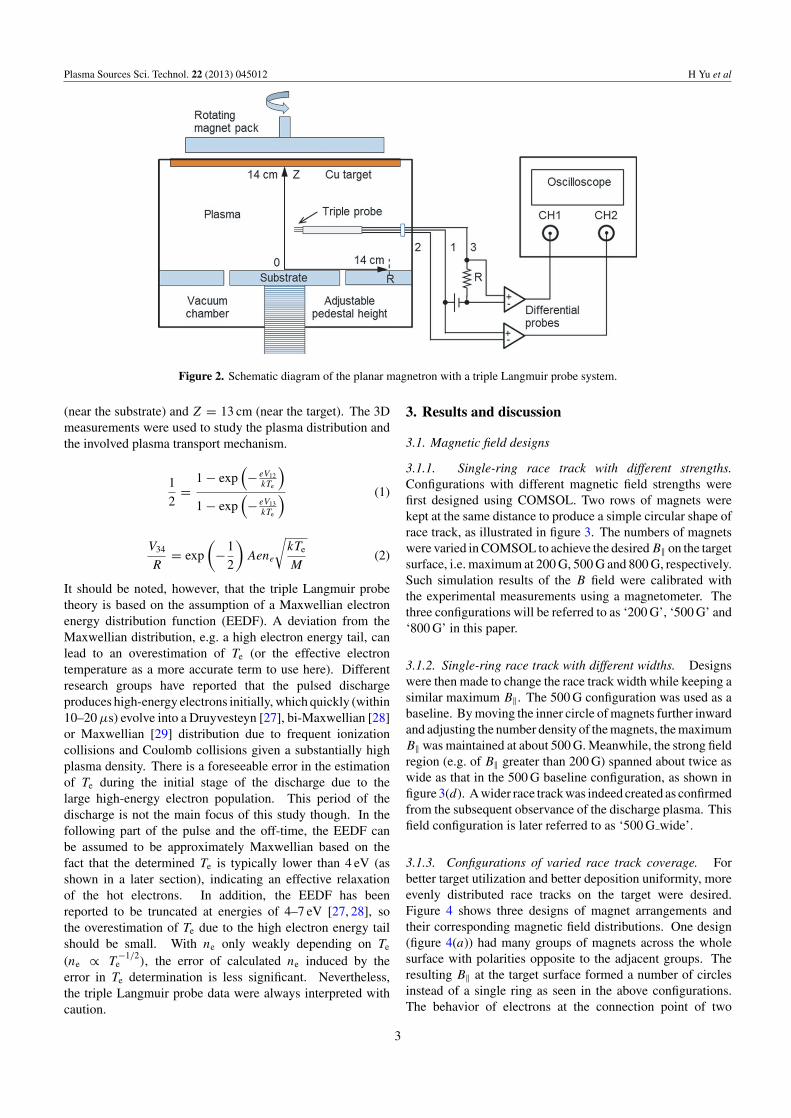
The experiments were performed in a commercial MRCGALAXY planar magnetron system with a 36 cm diametercopper target. The rotatable magnet pack was mounted behindthe target. The schematic diagram of the chamber can beseen in figure 2. The distance between the substrate andthe target was kept at 14 cm. A turbo pump was equippedto achieve a base pressure of 5 × 10⁻⁴ Pa. Pure argon (Ar)gas was supplied, with the working pressure typically keptat 0.67 Pa unless noted. The pressure was monitored witha capacitance manometer. The Cu target was powered witha Huettinger TruPlasma Highpulse 4002 dc generator duringHiPIMS discharges while being water-cooled. The plasmagenerator charges its capacitor to a voltage of 500–2000 Vand outputs pulses of 1–200 µs long. A peak current upto 1 kA is allowed. The repetition frequency of pulsing isbetween 1 and 200 Hz. The charging voltage Vch, the pulseon-time tp and the repetition frequency f are the basic pulsingparameters. In the following sections, a set of dischargeparameters is usually written in the form 800 V, 50 µs,100 Hz, 0.67 Pa without specifically mentioning the parameternames. The waveforms of the pulse voltage and current weremeasured using a high-voltage probe and a current monitor,respectively.
A triple Langmuir probe (TLP) was used for time-resolveddiagnostics of the pulsed plasma. It is a simple and well-studied technique allowing instantaneous direct display of Te
and ne [23], and was found to be very useful for pulsed plasmastudies [24, 25]. The electrical setup of the triple Langmuirprobe is illustrated in figure 2. More details of the TLPmeasurements were described in a previous paper [26]. Afixed bias (V13) of about 55 V was applied between probes 1and 3 with a battery pack. With this bias, significantly greaterthan the typical Te, ion saturation currents were collected.Probe 2 was electrically floating in the plasma discharge. Allthree probe tips were tungsten wires of diameter 0.25 mm andlength 8.8 mm, separated by 4.0 mm. Two differential probeswere used to measure V12 and the potential drop V34 acrossa resistor. The electron density and temperature can then becalculated using equations (1) and (2). In this study, the tripleprobe was configured to be capable of scanning the dischargeregion radially from R = 0 (the central axis) to R = 14 cm(near the chamber wall) and vertically between Z = 1 cm
2
Plasma Sources Sci. Technol. 22 (2013) 045012 H Yu et al
Figure 2. Schematic diagram of the planar magnetron with a triple Langmuir probe system.
(near the substrate) and Z = 13 cm (near the target). The 3Dmeasurements were used to study the plasma distribution andthe involved plasma transport mechanism.
1
2=
1 − exp(− eV12
kTe
)
1 − exp(− eV13
kTe
) (1)
V34
R= exp
(−1
2
)Aene
√kTe
M(2)
It should be noted, however, that the triple Langmuir probetheory is based on the assumption of a Maxwellian electronenergy distribution function (EEDF). A deviation from theMaxwellian distribution, e.g. a high electron energy tail, canlead to an overestimation of Te (or the effective electrontemperature as a more accurate term to use here). Differentresearch groups have reported that the pulsed dischargeproduces high-energy electrons initially, which quickly (within10–20 µs) evolve into a Druyvesteyn [27], bi-Maxwellian [28]or Maxwellian [29] distribution due to frequent ionizationcollisions and Coulomb collisions given a substantially highplasma density. There is a foreseeable error in the estimationof Te during the initial stage of the discharge due to thelarge high-energy electron population. This period of thedischarge is not the main focus of this study though. In thefollowing part of the pulse and the off-time, the EEDF canbe assumed to be approximately Maxwellian based on thefact that the determined Te is typically lower than 4 eV (asshown in a later section), indicating an effective relaxationof the hot electrons. In addition, the EEDF has beenreported to be truncated at energies of 4–7 eV [27, 28], sothe overestimation of Te due to the high electron energy tailshould be small. With ne only weakly depending on Te
(ne ∝ T−1/2
e ), the error of calculated ne induced by theerror in Te determination is less significant. Nevertheless,the triple Langmuir probe data were always interpreted withcaution.
3. Results and discussion
3.1. Magnetic field designs
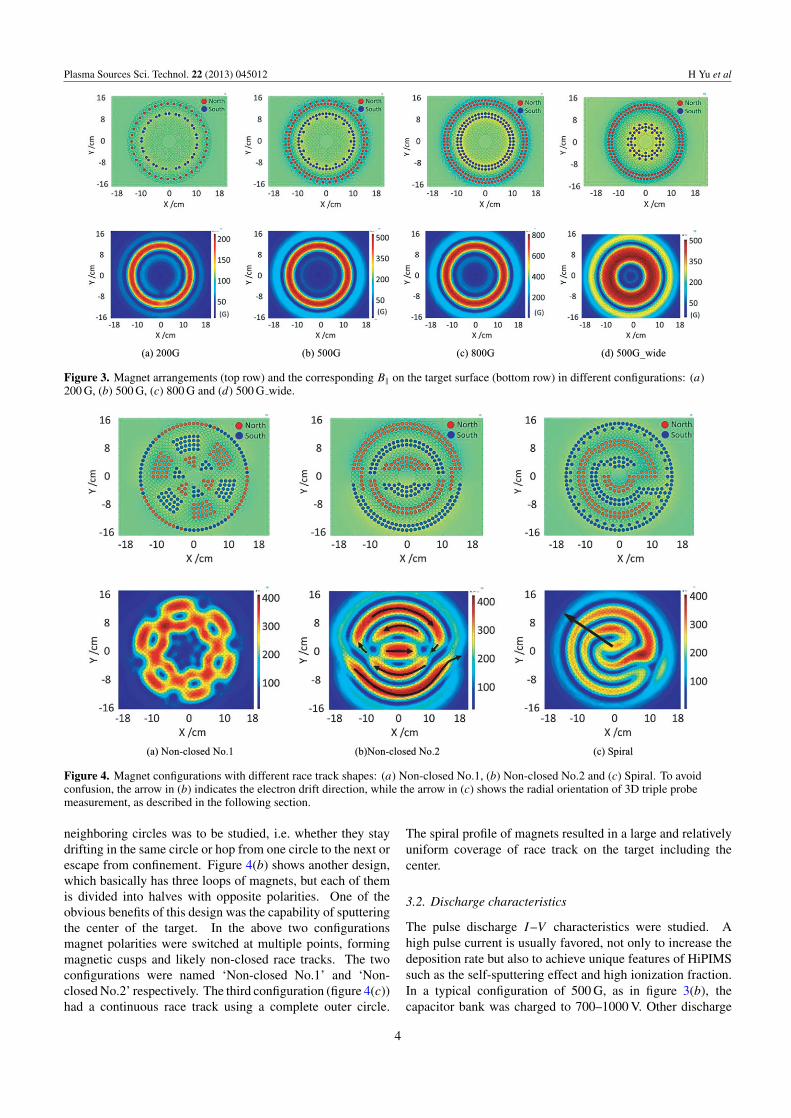
3.1.1. Single-ring race track with different strengths.Configurations with different magnetic field strengths werefirst designed using COMSOL. Two rows of magnets werekept at the same distance to produce a simple circular shape ofrace track, as illustrated in figure 3. The numbers of magnetswere varied in COMSOL to achieve the desired B‖ on the targetsurface, i.e. maximum at 200 G, 500 G and 800 G, respectively.Such simulation results of the B field were calibrated withthe experimental measurements using a magnetometer. Thethree configurations will be referred to as ‘200 G’, ‘500 G’ and‘800 G’ in this paper.
3.1.2. Single-ring race track with different widths. Designswere then made to change the race track width while keeping asimilar maximum B‖. The 500 G configuration was used as abaseline. By moving the inner circle of magnets further inwardand adjusting the number density of the magnets, the maximumB‖ was maintained at about 500 G. Meanwhile, the strong fieldregion (e.g. of B‖ greater than 200 G) spanned about twice aswide as that in the 500 G baseline configuration, as shown infigure 3(d). A wider race track was indeed created as confirmedfrom the subsequent observance of the discharge plasma. Thisfield configuration is later referred to as ‘500 G wide’.
3.1.3. Configurations of varied race track coverage. Forbetter target utilization and better deposition uniformity, moreevenly distributed race tracks on the target were desired.Figure 4 shows three designs of magnet arrangements andtheir corresponding magnetic field distributions. One design(figure 4(a)) had many groups of magnets across the wholesurface with polarities opposite to the adjacent groups. Theresulting B‖ at the target surface formed a number of circlesinstead of a single ring as seen in the above configurations.The behavior of electrons at the connection point of two
3
Plasma Sources Sci. Technol. 22 (2013) 045012 H Yu et al
(a) 200G (b) 500G (c) 800G (d) 500G_wide
Figure 3. Magnet arrangements (top row) and the corresponding B‖ on the target surface (bottom row) in different configurations: (a)200 G, (b) 500 G, (c) 800 G and (d) 500 G wide.
(a) Non-closed No.1 (b)Non-closed No.2 (c) Spiral
Figure 4. Magnet configurations with different race track shapes: (a) Non-closed No.1, (b) Non-closed No.2 and (c) Spiral. To avoidconfusion, the arrow in (b) indicates the electron drift direction, while the arrow in (c) shows the radial orientation of 3D triple probemeasurement, as described in the following section.
neighboring circles was to be studied, i.e. whether they staydrifting in the same circle or hop from one circle to the next orescape from confinement. Figure 4(b) shows another design,which basically has three loops of magnets, but each of themis divided into halves with opposite polarities. One of theobvious benefits of this design was the capability of sputteringthe center of the target. In the above two configurationsmagnet polarities were switched at multiple points, formingmagnetic cusps and likely non-closed race tracks. The twoconfigurations were named ‘Non-closed No.1’ and ‘Non-closed No.2’ respectively. The third configuration (figure 4(c))had a continuous race track using a complete outer circle.
The spiral profile of magnets resulted in a large and relativelyuniform coverage of race track on the target including thecenter.
3.2. Discharge characteristics
The pulse discharge I–V characteristics were studied. Ahigh pulse current is usually favored, not only to increase thedeposition rate but also to achieve unique features of HiPIMSsuch as the self-sputtering effect and high ionization fraction.In a typical configuration of 500 G, as in figure 3(b), thecapacitor bank was charged to 700–1000 V. Other discharge
4
Plasma Sources Sci. Technol. 22 (2013) 045012 H Yu et al
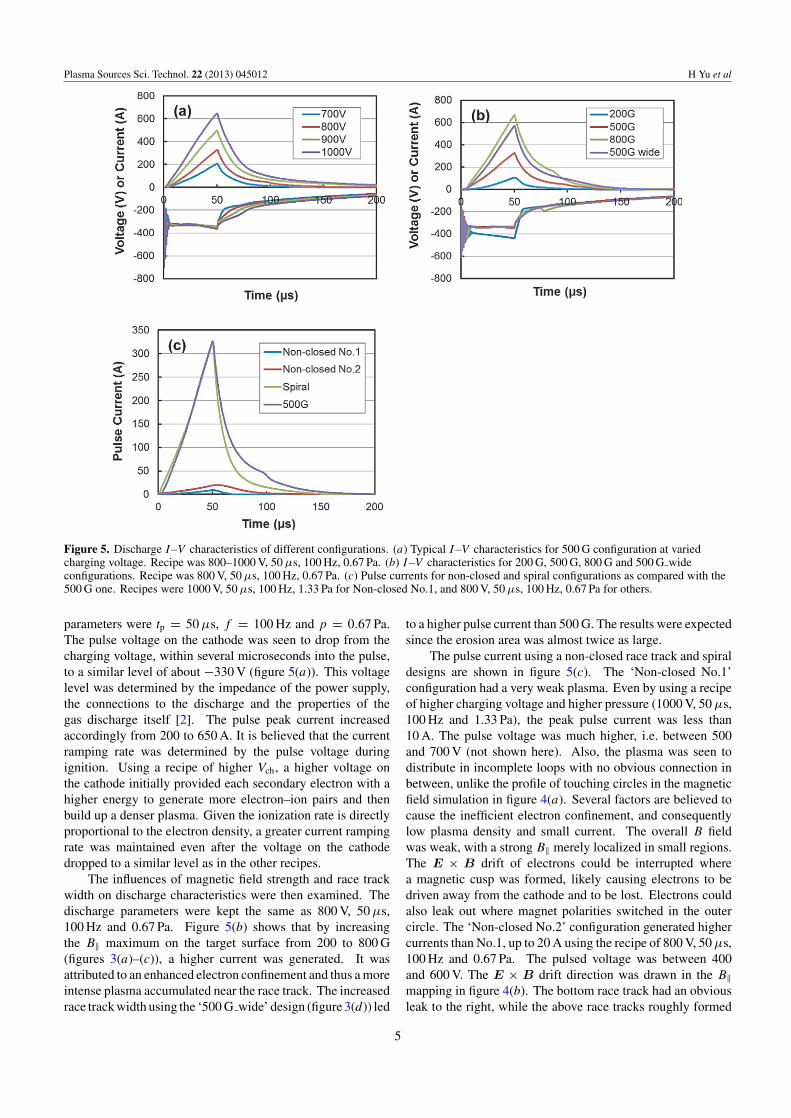
Figure 5. Discharge I–V characteristics of different configurations. (a) Typical I–V characteristics for 500 G configuration at variedcharging voltage. Recipe was 800–1000 V, 50 µs, 100 Hz, 0.67 Pa. (b) I–V characteristics for 200 G, 500 G, 800 G and 500 G wideconfigurations. Recipe was 800 V, 50 µs, 100 Hz, 0.67 Pa. (c) Pulse currents for non-closed and spiral configurations as compared with the500 G one. Recipes were 1000 V, 50 µs, 100 Hz, 1.33 Pa for Non-closed No.1, and 800 V, 50 µs, 100 Hz, 0.67 Pa for others.
parameters were tp = 50 µs, f = 100 Hz and p = 0.67 Pa.The pulse voltage on the cathode was seen to drop from thecharging voltage, within several microseconds into the pulse,to a similar level of about −330 V (figure 5(a)). This voltagelevel was determined by the impedance of the power supply,the connections to the discharge and the properties of thegas discharge itself [2]. The pulse peak current increasedaccordingly from 200 to 650 A. It is believed that the currentramping rate was determined by the pulse voltage duringignition. Using a recipe of higher Vch, a higher voltage onthe cathode initially provided each secondary electron with ahigher energy to generate more electron–ion pairs and thenbuild up a denser plasma. Given the ionization rate is directlyproportional to the electron density, a greater current rampingrate was maintained even after the voltage on the cathodedropped to a similar level as in the other recipes.
The influences of magnetic field strength and race trackwidth on discharge characteristics were then examined. Thedischarge parameters were kept the same as 800 V, 50 µs,100 Hz and 0.67 Pa. Figure 5(b) shows that by increasingthe B‖ maximum on the target surface from 200 to 800 G(figures 3(a)–(c)), a higher current was generated. It wasattributed to an enhanced electron confinement and thus a moreintense plasma accumulated near the race track. The increasedrace track width using the ‘500 G wide’ design (figure 3(d)) led
to a higher pulse current than 500 G. The results were expectedsince the erosion area was almost twice as large.
The pulse current using a non-closed race track and spiraldesigns are shown in figure 5(c). The ‘Non-closed No.1’configuration had a very weak plasma. Even by using a recipeof higher charging voltage and higher pressure (1000 V, 50 µs,100 Hz and 1.33 Pa), the peak pulse current was less than10 A. The pulse voltage was much higher, i.e. between 500and 700 V (not shown here). Also, the plasma was seen todistribute in incomplete loops with no obvious connection inbetween, unlike the profile of touching circles in the magneticfield simulation in figure 4(a). Several factors are believed tocause the inefficient electron confinement, and consequentlylow plasma density and small current. The overall B fieldwas weak, with a strong B‖ merely localized in small regions.The E × B drift of electrons could be interrupted wherea magnetic cusp was formed, likely causing electrons to bedriven away from the cathode and to be lost. Electrons couldalso leak out where magnet polarities switched in the outercircle. The ‘Non-closed No.2’ configuration generated highercurrents than No.1, up to 20 A using the recipe of 800 V, 50 µs,100 Hz and 0.67 Pa. The pulsed voltage was between 400and 600 V. The E × B drift direction was drawn in the B‖mapping in figure 4(b). The bottom race track had an obviousleak to the right, while the above race tracks roughly formed
5
Plasma Sources Sci. Technol. 22 (2013) 045012 H Yu et al
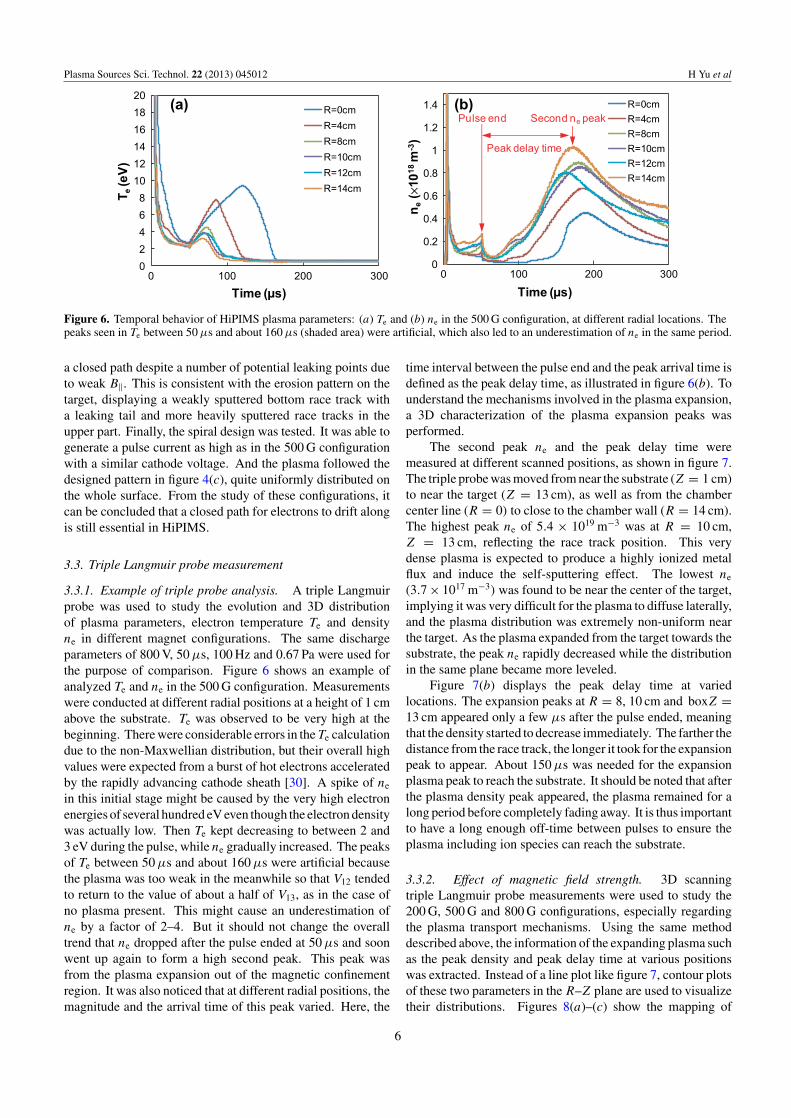
Figure 6. Temporal behavior of HiPIMS plasma parameters: (a) Te and (b) ne in the 500 G configuration, at different radial locations. Thepeaks seen in Te between 50 µs and about 160 µs (shaded area) were artificial, which also led to an underestimation of ne in the same period.
a closed path despite a number of potential leaking points dueto weak B‖. This is consistent with the erosion pattern on thetarget, displaying a weakly sputtered bottom race track witha leaking tail and more heavily sputtered race tracks in theupper part. Finally, the spiral design was tested. It was able togenerate a pulse current as high as in the 500 G configurationwith a similar cathode voltage. And the plasma followed thedesigned pattern in figure 4(c), quite uniformly distributed onthe whole surface. From the study of these configurations, itcan be concluded that a closed path for electrons to drift alongis still essential in HiPIMS.
3.3. Triple Langmuir probe measurement
3.3.1. Example of triple probe analysis. A triple Langmuirprobe was used to study the evolution and 3D distributionof plasma parameters, electron temperature Te and densityne in different magnet configurations. The same dischargeparameters of 800 V, 50 µs, 100 Hz and 0.67 Pa were used forthe purpose of comparison. Figure 6 shows an example ofanalyzed Te and ne in the 500 G configuration. Measurementswere conducted at different radial positions at a height of 1 cmabove the substrate. Te was observed to be very high at thebeginning. There were considerable errors in the Te calculationdue to the non-Maxwellian distribution, but their overall highvalues were expected from a burst of hot electrons acceleratedby the rapidly advancing cathode sheath [30]. A spike of ne
in this initial stage might be caused by the very high electronenergies of several hundred eV even though the electron densitywas actually low. Then Te kept decreasing to between 2 and3 eV during the pulse, while ne gradually increased. The peaksof Te between 50 µs and about 160 µs were artificial becausethe plasma was too weak in the meanwhile so that V12 tendedto return to the value of about a half of V13, as in the case ofno plasma present. This might cause an underestimation ofne by a factor of 2–4. But it should not change the overalltrend that ne dropped after the pulse ended at 50 µs and soonwent up again to form a high second peak. This peak wasfrom the plasma expansion out of the magnetic confinementregion. It was also noticed that at different radial positions, themagnitude and the arrival time of this peak varied. Here, the
time interval between the pulse end and the peak arrival time isdefined as the peak delay time, as illustrated in figure 6(b). Tounderstand the mechanisms involved in the plasma expansion,a 3D characterization of the plasma expansion peaks wasperformed.
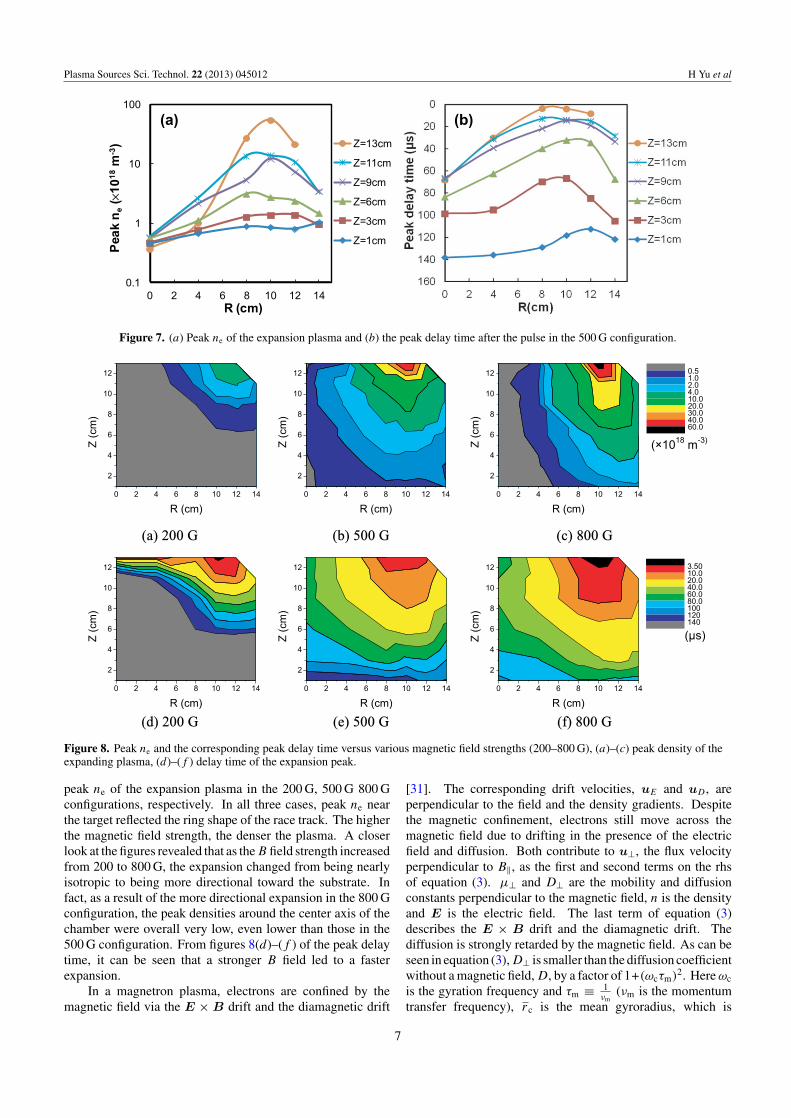
The second peak ne and the peak delay time weremeasured at different scanned positions, as shown in figure 7.The triple probe was moved from near the substrate (Z = 1 cm)to near the target (Z = 13 cm), as well as from the chambercenter line (R = 0) to close to the chamber wall (R = 14 cm).The highest peak ne of 5.4 × 10¹⁹ m−3 was at R = 10 cm,Z = 13 cm, reflecting the race track position. This verydense plasma is expected to produce a highly ionized metalflux and induce the self-sputtering effect. The lowest ne
(3.7 × 10¹⁷ m−3) was found to be near the center of the target,implying it was very difficult for the plasma to diffuse laterally,and the plasma distribution was extremely non-uniform nearthe target. As the plasma expanded from the target towards thesubstrate, the peak ne rapidly decreased while the distributionin the same plane became more leveled.
Figure 7(b) displays the peak delay time at variedlocations. The expansion peaks at R = 8, 10 cm and boxZ =13 cm appeared only a few µs after the pulse ended, meaningthat the density started to decrease immediately. The farther thedistance from the race track, the longer it took for the expansionpeak to appear. About 150 µs was needed for the expansionplasma peak to reach the substrate. It should be noted that afterthe plasma density peak appeared, the plasma remained for along period before completely fading away. It is thus importantto have a long enough off-time between pulses to ensure theplasma including ion species can reach the substrate.
3.3.2. Effect of magnetic field strength. 3D scanningtriple Langmuir probe measurements were used to study the200 G, 500 G and 800 G configurations, especially regardingthe plasma transport mechanisms. Using the same methoddescribed above, the information of the expanding plasma suchas the peak density and peak delay time at various positionswas extracted. Instead of a line plot like figure 7, contour plotsof these two parameters in the R–Z plane are used to visualizetheir distributions. Figures 8(a)–(c) show the mapping of
6
Plasma Sources Sci. Technol. 22 (2013) 045012 H Yu et al
Figure 7. (a) Peak ne of the expansion plasma and (b) the peak delay time after the pulse in the 500 G configuration.
(a) 200 G
(b) 500 G
(c) 800 G
(d) 200 G
(e) 500 G
(f) 800 G
0 2 4 6 8 10 12 14
2
4
6
8
10
12
Z (c
m)
R (cm)0 2 4 6 8 10 12 14
2
4
6
8
10
12
Z (c
m)
R (cm)0 2 4 6 8 10 12 14
2
4
6
8
10
12
Z (c
m)
R (cm)
0.51.02.04.010.020.030.040.060.0
0 2 4 6 8 10 12 14
2
4
6
8
10
12
Z (c
m)
R (cm)0 2 4 6 8 10 12 14
2
4
6
8
10
12
Z (c
m)
R (cm)0 2 4 6 8 10 12 14
2
4
6
8
10
12
Z (c
m)
R (cm)
3.5010.020.040.060.080.0100120140
(×1018 m-3)
(µs)
Figure 8. Peak ne and the corresponding peak delay time versus various magnetic field strengths (200–800 G), (a)–(c) peak density of theexpanding plasma, (d)–(f ) delay time of the expansion peak.
peak ne of the expansion plasma in the 200 G, 500 G 800 Gconfigurations, respectively. In all three cases, peak ne nearthe target reflected the ring shape of the race track. The higherthe magnetic field strength, the denser the plasma. A closerlook at the figures revealed that as the B field strength increasedfrom 200 to 800 G, the expansion changed from being nearlyisotropic to being more directional toward the substrate. Infact, as a result of the more directional expansion in the 800 Gconfiguration, the peak densities around the center axis of thechamber were overall very low, even lower than those in the500 G configuration. From figures 8(d)–(f ) of the peak delaytime, it can be seen that a stronger B field led to a fasterexpansion.
In a magnetron plasma, electrons are confined by themagnetic field via the E × B drift and the diamagnetic drift
[31]. The corresponding drift velocities, uE and uD , areperpendicular to the field and the density gradients. Despitethe magnetic confinement, electrons still move across themagnetic field due to drifting in the presence of the electricfield and diffusion. Both contribute to u⊥, the flux velocityperpendicular to B‖, as the first and second terms on the rhsof equation (3). µ⊥ and D⊥ are the mobility and diffusionconstants perpendicular to the magnetic field, n is the densityand E is the electric field. The last term of equation (3)describes the E × B drift and the diamagnetic drift. Thediffusion is strongly retarded by the magnetic field. As can beseen in equation (3), D⊥ is smaller than the diffusion coefficientwithout a magnetic field, D, by a factor of 1+(ωcτm)2. Here ωc
is the gyration frequency and τm ≡ 1νm
(νm is the momentumtransfer frequency), rc is the mean gyroradius, which is
7
Plasma Sources Sci. Technol. 22 (2013) 045012 H Yu et al
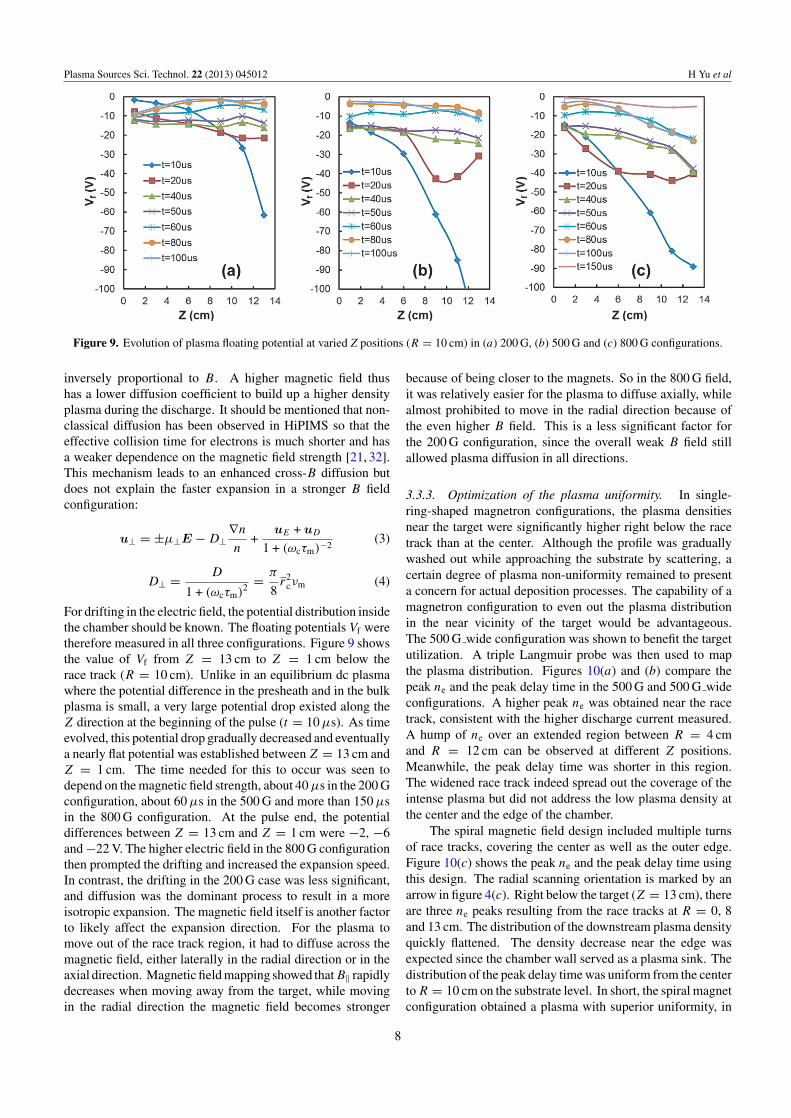
Figure 9. Evolution of plasma floating potential at varied Z positions (R = 10 cm) in (a) 200 G, (b) 500 G and (c) 800 G configurations.
inversely proportional to B. A higher magnetic field thushas a lower diffusion coefficient to build up a higher densityplasma during the discharge. It should be mentioned that non-classical diffusion has been observed in HiPIMS so that theeffective collision time for electrons is much shorter and hasa weaker dependence on the magnetic field strength [21, 32].This mechanism leads to an enhanced cross-B diffusion butdoes not explain the faster expansion in a stronger B fieldconfiguration:
u⊥ = ±µ⊥E − D⊥∇n
n+
uE + uD
1 + (ωcτm)−2(3)
D⊥ = D
1 + (ωcτm)2 = π
8r2
cνm (4)
For drifting in the electric field, the potential distribution insidethe chamber should be known. The floating potentials Vf weretherefore measured in all three configurations. Figure 9 showsthe value of Vf from Z = 13 cm to Z = 1 cm below therace track (R = 10 cm). Unlike in an equilibrium dc plasmawhere the potential difference in the presheath and in the bulkplasma is small, a very large potential drop existed along theZ direction at the beginning of the pulse (t = 10 µs). As timeevolved, this potential drop gradually decreased and eventuallya nearly flat potential was established between Z = 13 cm andZ = 1 cm. The time needed for this to occur was seen todepend on the magnetic field strength, about 40 µs in the 200 Gconfiguration, about 60 µs in the 500 G and more than 150 µsin the 800 G configuration. At the pulse end, the potentialdifferences between Z = 13 cm and Z = 1 cm were −2, −6and −22 V. The higher electric field in the 800 G configurationthen prompted the drifting and increased the expansion speed.In contrast, the drifting in the 200 G case was less significant,and diffusion was the dominant process to result in a moreisotropic expansion. The magnetic field itself is another factorto likely affect the expansion direction. For the plasma tomove out of the race track region, it had to diffuse across themagnetic field, either laterally in the radial direction or in theaxial direction. Magnetic field mapping showed that B‖ rapidlydecreases when moving away from the target, while movingin the radial direction the magnetic field becomes stronger
because of being closer to the magnets. So in the 800 G field,it was relatively easier for the plasma to diffuse axially, whilealmost prohibited to move in the radial direction because ofthe even higher B field. This is a less significant factor forthe 200 G configuration, since the overall weak B field stillallowed plasma diffusion in all directions.
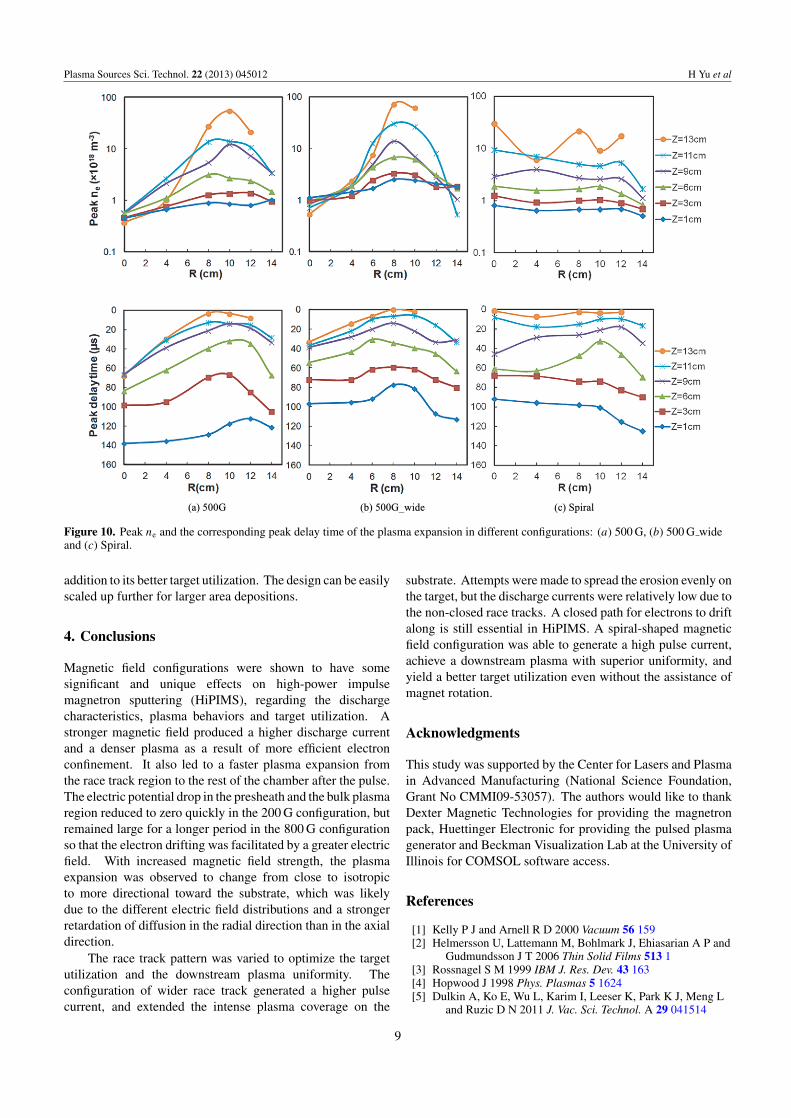
3.3.3. Optimization of the plasma uniformity. In single-ring-shaped magnetron configurations, the plasma densitiesnear the target were significantly higher right below the racetrack than at the center. Although the profile was graduallywashed out while approaching the substrate by scattering, acertain degree of plasma non-uniformity remained to presenta concern for actual deposition processes. The capability of amagnetron configuration to even out the plasma distributionin the near vicinity of the target would be advantageous.The 500 G wide configuration was shown to benefit the targetutilization. A triple Langmuir probe was then used to mapthe plasma distribution. Figures 10(a) and (b) compare thepeak ne and the peak delay time in the 500 G and 500 G wideconfigurations. A higher peak ne was obtained near the racetrack, consistent with the higher discharge current measured.A hump of ne over an extended region between R = 4 cmand R = 12 cm can be observed at different Z positions.Meanwhile, the peak delay time was shorter in this region.The widened race track indeed spread out the coverage of theintense plasma but did not address the low plasma density atthe center and the edge of the chamber.
The spiral magnetic field design included multiple turnsof race tracks, covering the center as well as the outer edge.Figure 10(c) shows the peak ne and the peak delay time usingthis design. The radial scanning orientation is marked by anarrow in figure 4(c). Right below the target (Z = 13 cm), thereare three ne peaks resulting from the race tracks at R = 0, 8and 13 cm. The distribution of the downstream plasma densityquickly flattened. The density decrease near the edge wasexpected since the chamber wall served as a plasma sink. Thedistribution of the peak delay time was uniform from the centerto R = 10 cm on the substrate level. In short, the spiral magnetconfiguration obtained a plasma with superior uniformity, in
8
Plasma Sources Sci. Technol. 22 (2013) 045012 H Yu et al
(a) 500G (b) 500G_wide (c) Spiral
Figure 10. Peak ne and the corresponding peak delay time of the plasma expansion in different configurations: (a) 500 G, (b) 500 G wideand (c) Spiral.
addition to its better target utilization. The design can be easilyscaled up further for larger area depositions.
4. Conclusions
Magnetic field configurations were shown to have somesignificant and unique effects on high-power impulsemagnetron sputtering (HiPIMS), regarding the dischargecharacteristics, plasma behaviors and target utilization. Astronger magnetic field produced a higher discharge currentand a denser plasma as a result of more efficient electronconfinement. It also led to a faster plasma expansion fromthe race track region to the rest of the chamber after the pulse.The electric potential drop in the presheath and the bulk plasmaregion reduced to zero quickly in the 200 G configuration, butremained large for a longer period in the 800 G configurationso that the electron drifting was facilitated by a greater electricfield. With increased magnetic field strength, the plasmaexpansion was observed to change from close to isotropicto more directional toward the substrate, which was likelydue to the different electric field distributions and a strongerretardation of diffusion in the radial direction than in the axialdirection.
The race track pattern was varied to optimize the targetutilization and the downstream plasma uniformity. Theconfiguration of wider race track generated a higher pulsecurrent, and extended the intense plasma coverage on the
substrate. Attempts were made to spread the erosion evenly onthe target, but the discharge currents were relatively low due tothe non-closed race tracks. A closed path for electrons to driftalong is still essential in HiPIMS. A spiral-shaped magneticfield configuration was able to generate a high pulse current,achieve a downstream plasma with superior uniformity, andyield a better target utilization even without the assistance ofmagnet rotation.
Acknowledgments
This study was supported by the Center for Lasers and Plasmain Advanced Manufacturing (National Science Foundation,Grant No CMMI09-53057). The authors would like to thankDexter Magnetic Technologies for providing the magnetronpack, Huettinger Electronic for providing the pulsed plasmagenerator and Beckman Visualization Lab at the University ofIllinois for COMSOL software access.
References
[1] Kelly P J and Arnell R D 2000 Vacuum 56 159[2] Helmersson U, Lattemann M, Bohlmark J, Ehiasarian A P and
Gudmundsson J T 2006 Thin Solid Films 513 1[3] Rossnagel S M 1999 IBM J. Res. Dev. 43 163[4] Hopwood J 1998 Phys. Plasmas 5 1624[5] Dulkin A, Ko E, Wu L, Karim I, Leeser K, Park K J, Meng L
and Ruzic D N 2011 J. Vac. Sci. Technol. A 29 041514
9
Plasma Sources Sci. Technol. 22 (2013) 045012 H Yu et al
[6] Yu H, Jiang Y, Wang T, Wu Z and Yu J and Wei X 2010 J. Vac.Sci. Technol. A 28 466
[7] Raju R, Meng L, Flauta R, Shin H, Neumann M J,Dockstader T A and Ruzic D N 2010 Plasma Sources Sci.Technol. 19 025011
[8] Cheng P F, Rossnagel S M and Ruzic D N 1995 J. Vac. Sci.Technol. B 13 203
[9] Juliano D R, Ruzic D N, Allain M M C and Hayden D B 2002J. Appl. Phys. 91 605
[10] Meng L, Raju R, Flauta R, Shin H, Ruzic D N andHayden D B 2010 J. Vac. Sci. Technol. A 28 112
[11] Kouznetsov V, Macak K, Schneider J M,Helmersson U and Petrov I 1999 Surf. Coat. Technol.122 290
[12] Alami J, Bolz S and Sarakinos K 2009 J. Alloys Compounds483 530
[13] Bradley J W and Welzel T 2009 J. Phys. D: Appl. Phys.42 093001
[14] Sarakinos K, Alami J and Konstantinidis S 2010 Surf. Coat.Technol. 204 1661
[15] Macak K, Kouznetzov V, Schneider J M, Helmersson U andPetrov I 2000 J. Vac. Sci. Technol. A 18 1533
[16] Bohlmark J, Alami J, Christou C, Ehiasarian A P andHelmersson U 2005 J. Vac. Sci. Technol. A 23 18
[17] Mishra B, Moore J J, Lin J and Sproul W D 2010 Mater. Sci.Forum 638 208
[18] Rodil S E and Olaya J J 2006 J. Phys.: Condens. Matter18 S1703
[19] Zlatanovic M, Belosevac R and Kunosic A 1997 Surf. Coat.Technol. 90 143
[20] Ekpe S D, Jimenez F J, Field D J, Davis M J and Dew S K2009 J. Vac. Sci. Technol. A 27 1275
[21] Bohlmark J, Helmersson U, VanZeeland M, Axnas I, Alami Jand Brenning N 2004 Plasma Sources Sci. Technol. 13 654
[22] Lin J, Moore J J, Sproul W D and Lee S L 2011 J. Vac. Sci.Technol. A 29 061301
[23] Chen S and Goodings J M 1968 J. Appl. Phys. 39 3300[24] Bryant P M, Voronin S A, Bradley J W and Vetushka A 2007
J. Appl. Phys. 102 043302[25] Alami J, Gudmundsson J T, Bohlmark J, Birch J and
Helmersson U 2005 Plasma Sources Sci. Technol. 14 525[26] Meng L, Cloud A N, Jung S and Ruzic D N 2011 J. Vac. Sci.
Technol. A 29 011024[27] Pajdarova A D, Vlcek J, Kudlacek P and Lukas J 2009 Plasma
Sources Sci. Technol. 18 025008[28] Gudmundsson J T, Alami J and Helmersson U 2002 Surf.
Coat. Technol. 161 249[29] Seo S-H, In J-H and Chang H-Y 2005 Plasma Sources Sci.
Technol. 14 576[30] Bradley J W, Backer H, Kelly P J and Arnell R D 2001 Surf.
Coat. Technol. 135 221[31] Lieberman M A and Lichtenberg A J 1994 Principles of
Plasma Discharge and Materials Processing (New York:Wiley)
[32] Gudmundsson J T, Brenning N, Lundin D and Helmersson U2012 J. Vac. Sci. Technol. A 30 030801
10
Recommended