Investing in Green EnergyGlitnir Investment Management Mikko Linnanvuori
This area is for placement of client logo

2Document NameDate
Government policies drive the market
Rising CO2 concentration and subsequent climate change have not been part of the market mechanism
“Internalizing the externalities”.
Implications on equity markets are primarily coming from government policies, not from climate change itself
Short-term consequences are hard to identify except melting glaciers and snowcaps, flood risk on lowlands and the growing probability of severe storms.
A wide selection of carbon abatement policies are in use – the “all measures have to be taken” approach
Huge differences exist in the implicit cost per ton of carbon abatement.
Government agendas will be putting more emphasis on the economics of carbon abatement – “preference for the most efficient methods” approach emerging?
A global carbon pricing mechanism would lead to this.

3Document NameDate
The money is flowing in…
European green funds received 15.2% of the total equity fund inflow in Jan-Jul 2007 (€4.6bn), up from 2.6% in 2006 and 0.6% in 2005.
Global VC+PE investment has grown 15-fold in five years.
The IPO pipelines are feeding the listed market
China and the US are the leading IPO markets.
Source: New Energy Finance
0 2 4 6 8 10
China
United States
United Kingdom
Germany
India
Australia
Canada
Taiwan
0 2 4 6 8 10
Solar
Wind
Biofuels
Efficiency: demand side
Biomass & Waste
Fuel Cells
Marine
Mini-Hydro
Power Storage
Smart Distribution

4Document NameDate
…and this shows in the market
0.0
50.0
100.0
150.0
200.0
250.0
300.0
4.1.2002 4.1.2003 4.1.2004 4.1.2005 4.1.2006 4.1.2007
ML Renewable Energy
MSCI World
S&P 500
DJ Stoxx 600

5Document NameDate
Marginal role in global energy production
66 %
16 %
16 %
2 %
Thermal
Hydroelectric
Nuclear
Geothermal, Solar, Wind, Wood, Waste
Total electricity capacity 4 200 000 MW, growing 2-3% p.a.
Wind 74 000 MW ~0.2%
Geothermal 11 000 MW ~0.03%
Photovoltaic 7 000 MW ~0.02%

6Document NameDate
Wind: the most mature market
Wind power is the most mature sub-sector.
Global installed capacity is expected to more than double by 2010.
Subsidized, but has reached the cost level of conventional energy in the best locations.
Leading countries are Germany, USA, Spain and India.
The turbine market is well consolidated – the six largest players have a combined market share of 85%
Large power equipment companies have bought access to the market - most recently Alstom acquired Ecotecnia.
Wind turbines are developing and growing, but no technology revolution is emerging.
Offshore wind is the next growth area.
7Document NameDate
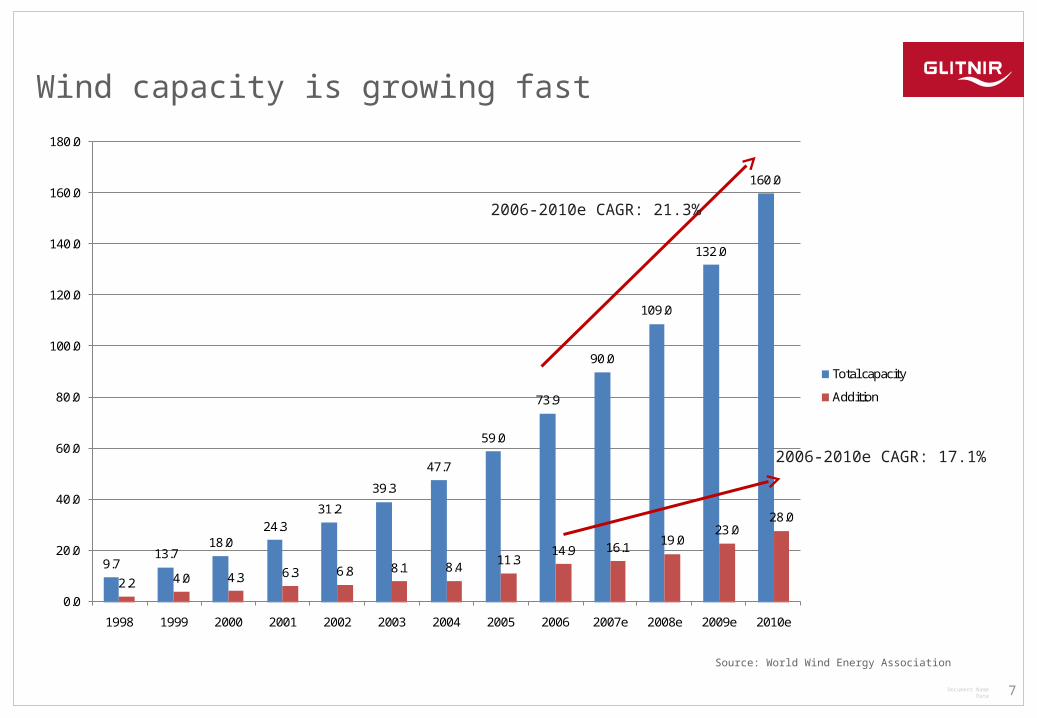
Wind capacity is growing fast
9.713.7
18.024.3
31.2
39.3
47.7
59.0
73.9
90.0
109.0
132.0
160.0
2.2 4.0 4.3 6.3 6.8 8.1 8.4 11.314.9 16.1 19.0
23.028.0
0.0
20.0
40.0
60.0
80.0
100.0
120.0
140.0
160.0
180.0
1998 1999 2000 2001 2002 2003 2004 2005 2006 2007e 2008e 2009e 2010e
Total capacity
Addition
2006-2010e CAGR: 21.3%
2006-2010e CAGR: 17.1%
Source: World Wind Energy Association

8Document NameDate
Wind multiples are high, but not extreme
Source: World Wind Energy Association
P/E P/Sales 2007 2008 2009 2007 2008 2009
Vestas 43.6 26.8 21.6 2.3 1.9 1.7Gamesa 29.1 23.8 19.3 2.3 1.9 1.7EDF Energies Nouvelles 86.5 52.2 37.3 7.5 6.3 5.3Suzlon 34.8 24.7 18.0 3.4 2.3 1.9FPL Group 18.5 16.4 14.9 1.6 1.5 1.4
0
50
100
150
200
250
300
Vestas
Gamesa
EDF Energies Nouvelles
Suzlon
FPL Group
Source: Bloomberg

9Document NameDate
Solar power: a long-term play, the near term market relies on subsidies
Solar power is heavily dependent on government support
Germany was the first to introduce a favorable feed-in tariff - Spain, Italy, California (USA) and Korea have followed suit.
The German scheme offers a 20-year tariff guarantee, Spain offers 25 years.
The German tariff is currently 33.19 eurocent/kWh.
Grid price parity expected between 2020-2030, which will lead to explosion in market growth.
Solar is already competitive with Californian intra-day peak prices.
Germany is the leading solar power market with 56% of new installations in 2006.
Market is polysilicon capacity constrained
The market is expected to remain tight in 2008.
Current high profitability is not sustainable in the long run.
Market growth at 28% CAGR through 2012 (Goldman Sachs).
Some of the thin film technologies bypass silicon shortage.

10Document NameDate
Solar multiples are, well, solar
Source: Bloomberg
P/E P/Sales 2007 2008 2009 2007 2008 2009
Solarworld 46.8 32.4 23.1 6.7 4.9 3.5Motech 24.1 17.8 13.2 4.6 3.3 2.5First Solar 214.2 94.2 51.7 20.8 12.4 7.7Q-Cells 55.7 40.5 26.0 10.6 7.5 5.1REC 58.7 39.3 22.3 18.8 12.1 8.0
0
100
200
300
400
500
600
700
Solarworld
Motech
First solar
Q-Cells
REC

11Document NameDate
Biofuels: a tricky market
Biodiesel in Europe and ethanol in the US and Brazil
Demand is mainly government-driven
The Brazilian market is based on lowest cost production.
Energy independence is the main driver in the US.
Trade barriers restrain global trade.
Ethanol comprises 2% of global gasoline consumption.
Three sets of players: oil majors, agriculture companies and specialized refiners.
Biofuels are under pressure in most of the markets
The global ethanol price is low, weighing on Brazilian producers.
US ethanol is cheap and corn expensive.
European production struggles with high input costs.
Ethical issues and concerns
Questionable energy and carbon balances.
Food prices, deforestation and work conditions.
2nd generation biofuels emerging

12Document NameDate
Biofuels
Source: Bloomberg
P/E P/Sales 2007 2008 2009 2007 2008 2009
Cosan 33.6 48.7 16.3 1.5 1.5 1.2Verasun 24.5 10.5 12.4 1.1 0.5 0.4Verbio 126.0 10.9 5.6 0.6 0.5 0.3CropEnergies 24.7 15.4 8.7 2.2 1.1 0.8
0
20
40
60
80
100
120
140
160
180
Cosan
Verasun
Verbio
CropEnergies

13Document NameDate
Energy efficiency
Improving energy efficiency provides negative cost option to cutting emissions.
There are still quick wins available for politicians e.g. replacing conventional light bulbs.
Investing in energy efficiency solutions is rather complicated
Though a growing theme across industries, in most cases not the primary driver of business.
Valuations are at a more reasonable level (in some cases).
The prime energy efficiency themes for investment are building insulation, vehicle fuel efficiency and energy-efficient products/solutions.
A wide spectrum of target industries enables risk diversification, but opens up industry-specific volatility.
Recommended