Investor PresentationApril-June 2021
Forward looking statements and non-IFRS measures
This document may contain forward-looking statements that may or may not prove accurate. For example, statements regarding expected revenue growth
and trading profit margins, market trends and our product pipeline are forward-looking statements. Phrases such as "aim", "plan", "intend", "anticipate",
"well-placed", "believe", "estimate", "expect", "target", "consider" and similar expressions are generally intended to identify forward-looking statements.
Forward-looking statements involve known and unknown risks, uncertainties and other important factors that could cause actual results to differ materially
from what is expressed or implied by the statements. For Smith+Nephew, these factors include: risks related to the impact of COVID, such as the depth and
longevity of its impact, government actions and other restrictive measures taken in response, material delays and cancellations of elective procedures,
reduced procedure capacity at medical facilities, restricted access for sales representatives to medical facilities, or our ability to execute business continuity
plans as a result of COVID; economic and financial conditions in the markets we serve, especially those affecting health care providers, payers and
customers (including, without limitation, as a result of COVID); price levels for established and innovative medical devices; developments in medical
technology; regulatory approvals, reimbursement decisions or other government actions; product defects or recalls or other problems with quality
management systems or failure to comply with related regulations; litigation relating to patent or other claims; legal compliance risks and related
investigative, remedial or enforcement actions; disruption to our supply chain or operations or those of our suppliers (including, without limitation, as a
result of COVID); competition for qualified personnel; strategic actions, including acquisitions and dispositions, our success in performing due diligence,
valuing and integrating acquired businesses; disruption that may result from transactions or other changes we make in our business plans or organisation to
adapt to market developments; relationships with healthcare professionals; reliance on information technology and cybersecurity; and numerous other
matters that affect us or our markets, including those of a political, economic, business, competitive or reputational nature. Please refer to the documents
that Smith+Nephew has filed with the U.S. Securities and Exchange Commission under the U.S. Securities Exchange Act of 1934, as amended, including
Smith+Nephew's most recent annual report on Form 20-F, for a discussion of certain of these factors. Any forward-looking statement is based on information
available to Smith+Nephew as of the date of the statement. All written or oral forward-looking statements attributable to Smith+Nephew are qualified by
this caution. Smith+Nephew does not undertake any obligation to update or revise any forward-looking statement to reflect any change in circumstances or
in Smith+Nephew's expectations. The terms ‘Group’ and ‘Smith+Nephew’ are used for convenience to refer to Smith & Nephew plc and its consolidated
subsidiaries, unless the context requires otherwise.
Certain items included in ‘trading results’, such as trading profit, trading profit margin, tax rate on trading results, trading cash flow, trading profit to cash
conversion ratio, EPSA, leverage ratio, and underlying growth are non-IFRS financial measures. The non-IFRS financial measures in this announcement are
explained and reconciled to the most directly comparable financial measure prepared in accordance with IFRS in our Fourth Quarter and Full Year 2020
Results announcement dated 18 February 2021, and our First Quarter 2021 trading report dated 29 April 2021.2
3
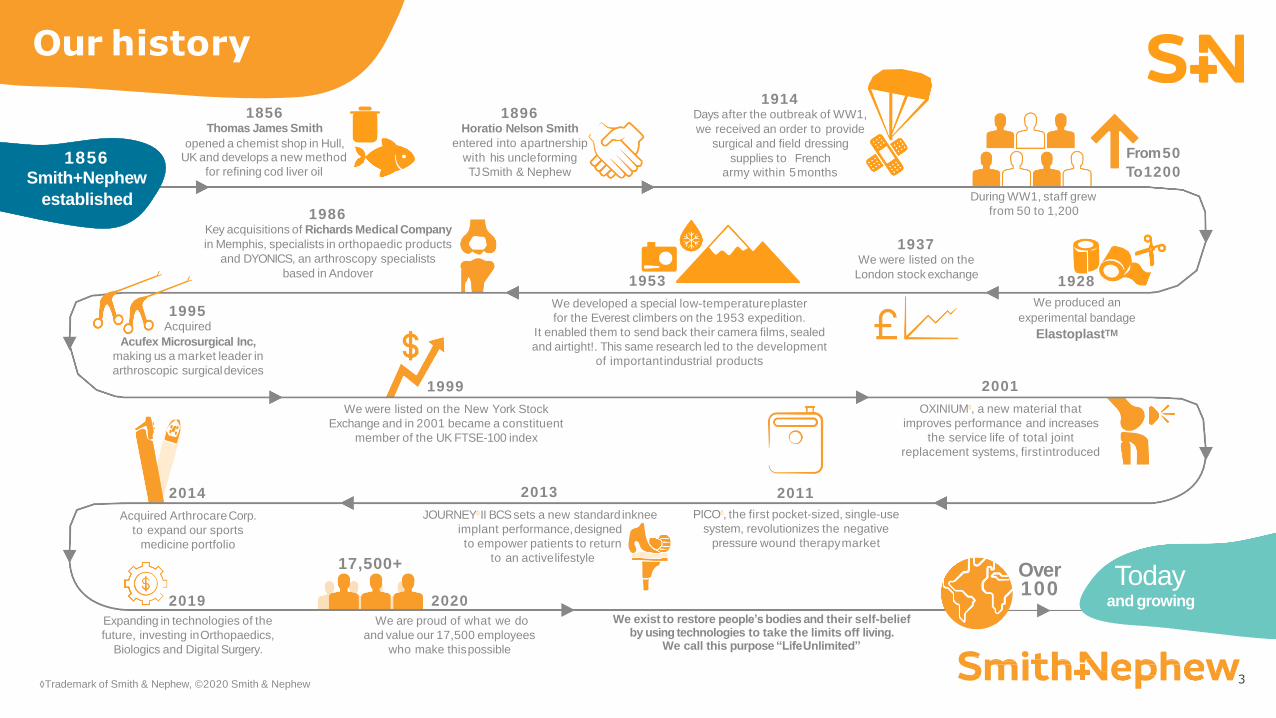
1856Thomas James Smith
opened a chemist shop in Hull,UK and develops a new method
for refining cod liver oil
1986Key acquisitions of Richards Medical Company
in Memphis, specialists in orthopaedic products
and DYONICS, an arthroscopy specialists
based in Andover
1995Acquired
Acufex Microsurgical Inc,
making us a market leader in
arthroscopic surgicaldevices
1999
We were listed on the New York Stock
Exchange and in 2001 became a constituent
member of the UK FTSE-100 index
2001
OXINIUM◊, a new material that
improves performance and increases
the service life of total joint
replacement systems, first introduced
2011
PICO◊, the first pocket-sized, single-use
system, revolutionizes the negative
pressure wound therapymarket
2013
JOURNEY◊II BCS sets a new standard inknee
implant performance,designed
to empower patients to return
to an activelifestyle
We exist to restore people’sbodies and their self-belief by using technologies to take the limits off living.
We call this purpose “LifeUnlimited”
2014
Acquired ArthrocareCorp.
to expand our sports
medicine portfolio
2020
We are proud of what we do
and value our 17,500 employees
who make thispossible
1953
We developed a special low-temperatureplaster
for the Everest climbers on the 1953 expedition.
It enabled them to send back their camera films, sealed
and airtight!. This same research led to the development
of importantindustrial products
1937We were listed on the
London stock exchange1928
We produced an
experimental bandage
ElastoplastTM
1896Horatio Nelson Smith
entered into apartnership
with his uncleforming
TJ Smith & Nephew
1914Days after the outbreak of WW1,
we received an order to provide
surgical and field dressing
supplies to French
army within 5months
During WW1, staff grew
from 50 to 1,200
From50
To1200
Over 100
17,500+
◊Trademark of Smith & Nephew, ©2020 Smith & Nephew
1856Smith+Nephew
established
Todayand growing
Our history
2019
Expanding in technologies of the
future, investing inOrthopaedics,
Biologics and Digital Surgery.
4
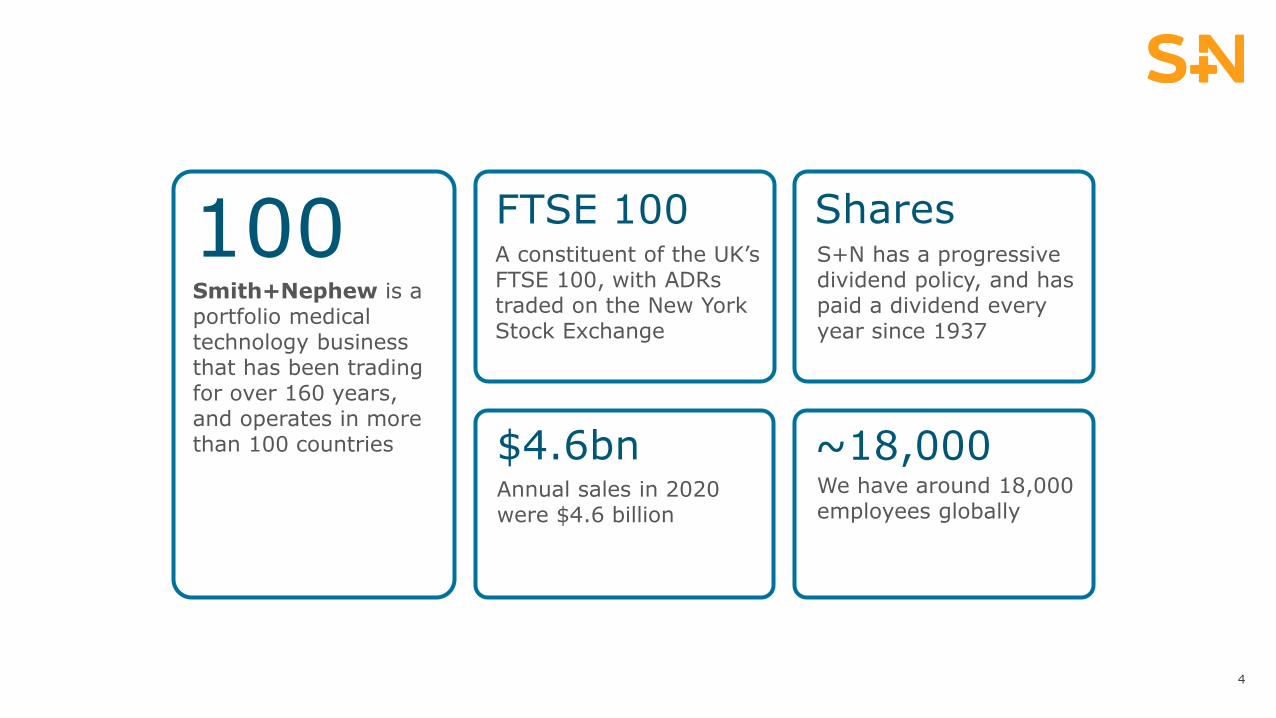
100Smith+Nephew is a portfolio medical technology business that has been trading for over 160 years, and operates in more than 100 countries
A constituent of the UK’s FTSE 100, with ADRstraded on the New York Stock Exchange
FTSE 100
Annual sales in 2020 were $4.6 billion
$4.6bn
S+N has a progressive dividend policy, and has paid a dividend every year since 1937
Shares
We have around 18,000 employees globally
~18,000

A portfolio medical technology business
5
Other Recon
Advanced Wound Care
Advanced WoundBioactives
Arthroscopic Enabling Technologies
Sports MedicineJoint Repair Trauma
Hips
Knees
Advanced Wound Devices
ALLEVYN◊ LIFEAdvanced Foam Wound Dressings
Collagenase SANTYL◊ Ointment Enzymatic debrider
CORI◊
Surgical System
COBLATION◊
Wand
REGENETEN◊
Bioinductive Implant
PICO◊
Negative Pressure Wound Therapy
JOURNEY◊ II BCSBi-Cruciate
StabilisedKnee System
$4.6bnRevenues
(2020)
OR3O◊
Dual Mobility
EVOS◊ SMALLPlating System
ENT

Leading positions in attractive markets
Zimmer
Biomet33%
Stryker
22%
DePuy
Synthes19%
Smith+
Nephew11%
Others
15%
Arthrex
33%
Smith+
Nephew26%
DePuy
Mitek13%
Stryker
11%
Others
17%3M
19%
Smith+
Nephew14%
Molnlycke
9%Convatec
7%
Others
51%
Data used in 2020 estimates generated by Smith+Nephew is based on publicly available sources and internal analysis and represents an indication of market shares1 A division of Johnson & Johnson.
$12.6bn market+2% 2017-19 average growth
-15% 2020 growth
$4.6bn market+5% 2017-19 average growth
-12% 2020 growth
$9.1bn market+5% 2017-19 average growth
-3% 2020 growth
#4 position #2 position #2 position
Hip & Knee Implants Sports Medicine Advanced Wound Management
6
1
1

Our performance
7* Underlying growth percentage after adjusting for the effect of currency translation, acquisitions and disposals.
** 2020 net debt includes lease liabilities.
$4,560m -12.1%*
64.6¢
Revenue
Adjusted earnings per share (EPSA)
Trading cash conversion
Net debt
$683m 15.0% margin
37.5¢
Trading profit
Dividend per share
1020 10481123 1169
683
2016 2017 2018 2019 2020
82.694.5
100.9 102.2
64.6
2016 2017 2018 2019 2020
30.835.0 36.0 37.5 37.5
2016 2017 2018 2019 2020
15501281
1104
1600
1926
2016 2017 2018 2019 2020
75%
90% 85% 83%
101%
2016 2017 2018 2019 2020
101%
$1,926m**
46694765
4904
5138
4560
2016 2017 2018 2019 2020

First Quarter 2021
8

Q1 revenue by region: $1,264m, 6.2% underlying, 11.5% reported
9
US$640m
Other established markets$407m
Emerging markets$217m
• Falling infection rates and easing restrictions drove improvement through the quarter
• Growth further helped by weaker prior year comparator in late March
• Solid growth in Japan and Australia; UK strengthened in the quarter
• Most other European markets slowed in March as infection rates rose
• China growth reflects maintained recovery and weak prior year comparator
• Some improvement in other emerging markets
-4.7%
-31.8%
0.9%
-4.9%
7.1%
1Q20 2Q20 3Q20 4Q20 1Q21
-6.3%
-30.8%
-6.2% -6.2%-1.8%
1Q20 2Q20 3Q20 4Q20 1Q21
-17.9%-20.2%
-14.5% -14.9%
21.8%
1Q20 2Q20 3Q20 4Q20 1Q21
Quarterly underlying sales development by region

Q1 revenue: $1,264m, 6.2% underlying, 11.5% reported
10
Product franchise growth
Global
US
Other Established Markets
Emerging Markets
Revenue split
Geographical growth
US$640m
Other Established Markets
$407m
Emerging Markets$217m
21.8%
-1.8%
7.1%
6.2%
-3.2%
26.7%
4.5%
9.3%
-4.6%
11.7%
12.0%
10.4%
12.0%
17.7%
9.1%
-10.3%
1.6%
Arthroscopic Enabling Technologies
Orthopaedics
Hips
Knees
Advanced Wound Management
Advanced Wound Care
Advanced Wound Bioactives
Advanced Wound Devices
ENT
Sports Medicine & ENT
Trauma & Extremities
Other Recon
Sports Medicine Joint Repair

11
• Targeting underlying revenue growth of 10-13%
− Hips to continue to outperform Knees
− Sports Medicine & ENT to rebound strongly
− AWM momentum to continue
• Trading margin range of 18-19%
− COVID impact on gross margin; partial offset from efficiency programmes
− Dilution relative to 2019 from investment in R&D (c.100bps), initial dilution from completed M&A (c.150bps)
− FX headwind relative to 2019 (c.100bps)
• Tax rate on trading results in the range of 18-19%
• Targets assume improvement in conditions through the year,
with surgery volumes largely unconstrained by COVID in H2
2021 outlook

Priorities for 2021
12

Priorities for 2021 – Strategy and COVID
13
Return to top-line growth and recapture momentum
Drive further operational improvement
Continue to respond effectively to COVID

Priority for 2021: Return to top-line growth and recapture momentum
Clear strategy for growth
• New commercial model
• New commercial leadership
• Portfolio enhanced through M&A
Investment in innovation
• Step up in R&D investment
New Leadership Team
Maximising portfolio potential
• Driving higher return from portfolio and growing recent launches
• Continuing to drive commercial excellence across franchises
Delivering value of the acquired assets
• Driving synergistic growth in Trauma & Extremities, Joint Repair, ENT and Bioactives
• Adding further value-creating opportunities focused on high-growth segments
Launching expanded pipeline of innovation
• High cadence of product launches across the franchises
• Further increase in R&D investment
Foundations from 2018/9 Driving sustainable revenue growth
14
1
2
3
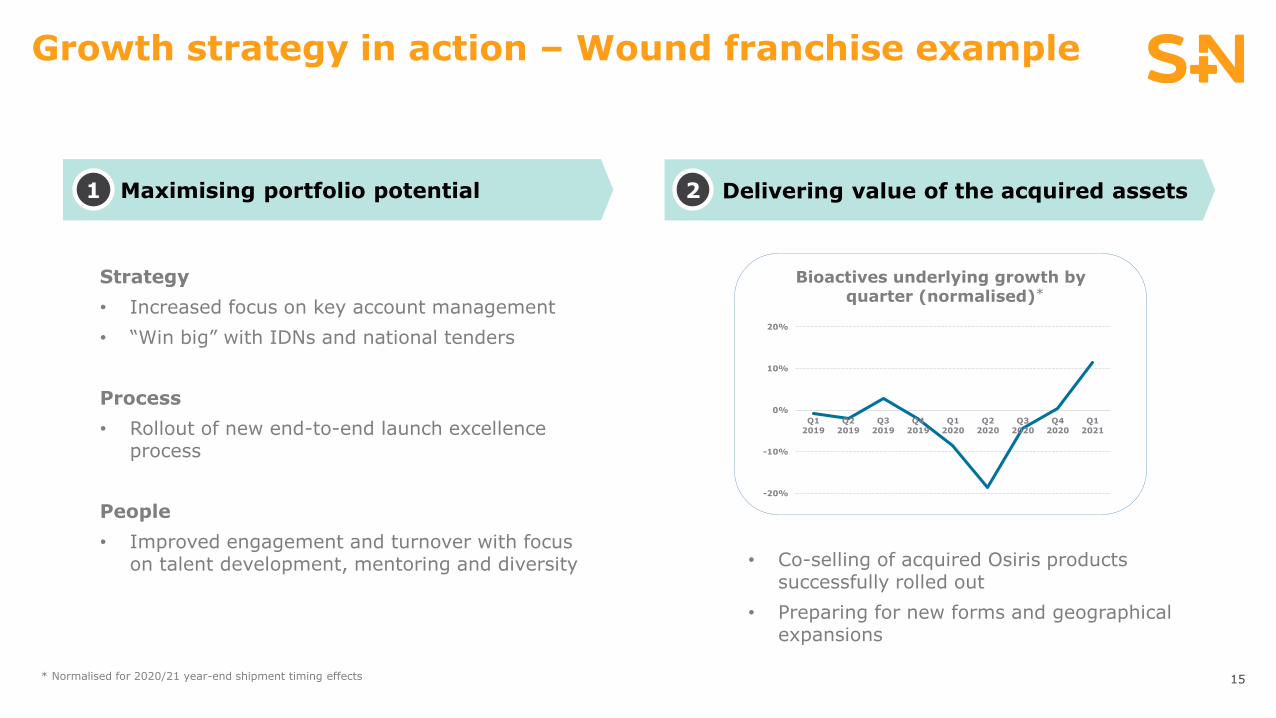
Growth strategy in action – Wound franchise example
15
Bioactives underlying growth by quarter (normalised)
Strategy
• Increased focus on key account management
• “Win big” with IDNs and national tenders
Process
• Rollout of new end-to-end launch excellence process
People
• Improved engagement and turnover with focus on talent development, mentoring and diversity • Co-selling of acquired Osiris products
successfully rolled out
• Preparing for new forms and geographical expansions
-20%
-10%
0%
10%
20%
Q1
2019
Q2
2019
Q3
2019
Q4
2019
Q1
2020
Q2
2020
Q3
2020
Q4
2020
Q1
2021
*
* Normalised for 2020/21 year-end shipment timing effects
Maximising portfolio potential1 Delivering value of the acquired assets2

Progress on key R&D projects
16
Orthopaedics
Sports Medicine & ENT
Advanced Wound Management
Recently launched growth drivers
Key 2021 projects*
OR3O◊ Dual mobility Porous Knee systemHip & Knee implants SYNC Modular Trays New Hip & Knee instruments Streamlined instrument set for THA and TKA
CORI◊ TKARI.HIP Navigation on CORI
Tissue balancing for robotic-assisted TKA
Robotics & digital surgery
CORI TensionerHip 7 Navigation on Kick
EVOS Large Frag/Periprosthetic Broadening EVOS trauma plate portfolioTrauma & Extremities Digital Taylor Spatial Frame
Capsular repair launches in Hip
Advanced Healing launches in Shoulder
INTELLIO◊ Connected Tower
FASTFIX◊ FLEX
DOUBLEFLO◊
Next generation meniscal repair
Arthroscopic tower fluid management
Sports Medicine Joint Repair
Arthroscopic Enabling Technologies
ENT
REGENETEN◊ Expansion Product and region expansion
TULA◊
HALO◊ WEREWOLF◊ ENT Wand
PICO PROTECT
Lyopreserved biotissue
Next generation single-use NPWT
Advanced Wound Bioactives
Advanced Wound Devices
GRAFIX◊, PL XC & PL CORE
STRAVIX◊, PL & MESHED
Lyopreserved biotissue
LEAF◊ 2.0
PICO◊ Region and Indication Expansion
Clinical Decision Support
Blue indicates products from recent acquisitions
Next generation Patient monitoring system
ARIA Home PT Remote physical therapy module
Porous offering for Knee portfolio
Navigation assisted Hip procedures
Increased efficiency in External fixation
*All innovation launches coming after completing relevant regulatory review, clearance and approval processes
Advanced Wound Care
✔
✔
✔
✔
✔ Denotes first regulatory clearance received
Launching expanded pipeline of innovation3

Demonstrated launch excellenceGrowth inflections from new products in recent years
17
3.9%
-5.4%
-28.9%
9.8%
4.4%
11.5%
Q4 2019 Q1 2020 Q2 2020 Q3 2020 Q4 2020 Q1 2021
OR3O launch Q4 2019
6%
8%
14.0%
Q1 2017 Q3 2017 Q1 2018 Q3 2018 Q1 2019 Q3 2019
-2%
-4%
-1.1%-2.1%
0.8%
5.1%
Q3 2018 Q4 2018 Q1 2019 Q2 2019 Q3 2019 Q4 2019
FLOW 90 launch Q2 2019
LENS 4K launch Q3 2019
REGENETEN acquired end 2017
US Hips growth vs peers Sports Medicine Joint Repair
quarterly growth
AET quarterly growth
PICO 7 sNPWT
PICO annual sales
2011 2013 2015 2017 2019
REGENETENBioinductive Implant
OR3O Dual Mobility
LENS 4KSurgical Imaging System
FLOW 90 Wand

Drive further operational improvementOperations transformation and process efficiencies
18
• Five year operations efficiency plan, with work started in late 2019
• Targeting c.$200m of annualised cost savings
• Restructuring costs of c.$350m in total, by end of 2023
Process efficiencies
• Simplify end-to-end processes
• Improve commercial execution and product launches
• Invest in IT and Digital solutions
Operations transformation
• Continuing manufacturing network optimisation
• Outsourcing of warehousing and distribution
• Process transformation, with Lean deployment and greater automation

Continue to respond effectively to COVID
19
• Flexible and updated working environments
• COVID secure sites with deployment of social distancing technology
• Control discretionary costs while COVID outbreak continues
• Support customers in person and remotely
• Transform medical education, with new online platform in 2021
Customers Employees Cost control

Appendices
20

Technical guidance for 2021
21
April 2021
Foreign exchange and acquisitions
Translational FX impact on revenue growth(1) 2.9%
Acquisition impact on revenue growth 1.9%
Non-trading items
Restructuring costs $140-150m
Acquisition and integration costs $35-45m
European Medical Device Regulation (MDR) compliance costs c. $60m
Other
Amortisation of acquisition intangibles $170-180m
Income from associates c. $10m
Net interest(2) $75-80m
Other finance costs c. $15m
Tax rate on trading result 18-19%
(1) Based on the foreign exchange rates prevailing on 23rd April 2021(2) Includes interest associated with IFRS 16 Leases

Franchise revenue analysis
2020 2021
Q1Growth
%
Q2Growth
%
Q3Growth
%
Q4Growth
%
Full YearGrowth
%
Q1Growth
%
Q1Revenue
$m
Orthopaedics (8.3) (34.0) (2.8) (10.2) (14.0) 1.6 540
Knee Implants (10.6) (46.9) (9.5) (16.2) (21.0) (10.3) 212
Hip Implants (8.6) (26.9) 7.1 (0.5) (7.4) 9.1 154
Other Reconstruction 19.4 (51.5) (3.1) (45.6) (26.1) 17.7 25
Trauma & Extremities (7.1) (11.1) (1.4) (1.3) (5.1) 12.0 149
Sports Medicine & ENT (9.5) (33.3) (4.5) (5.2) (13.0) 10.4 373
Sports Medicine Joint Repair (7.1) (32.0) (2.7) (0.3) (10.2) 12.0 198
Arthroscopic Enabling Technologies
(11.2) (32.1) (1.6) (5.0) (12.4) 11.7 146
ENT (15.2) (44.0) (24.8) (33.1) (29.7) (4.6) 29
Advanced Wound Management (4.0) (17.6) (6.1) (4.4) (8.1) 9.3 351
Advanced Wound Care (6.7) (14.6) (6.9) (2.1) (7.5) 4.5 175
Advanced Wound Bioactives (8.6) (18.7) (4.5) (9.9) (10.5) 26.7 116
Advanced Wound Devices 13.0 (23.7) (6.9) 0.2 (4.8) (3.2) 60
Total (7.6) (29.3) (4.2) (7.1) (12.1) 6.2 1,264
22All revenue growth rates are on an underlying basis and without adjustment for number of selling days.
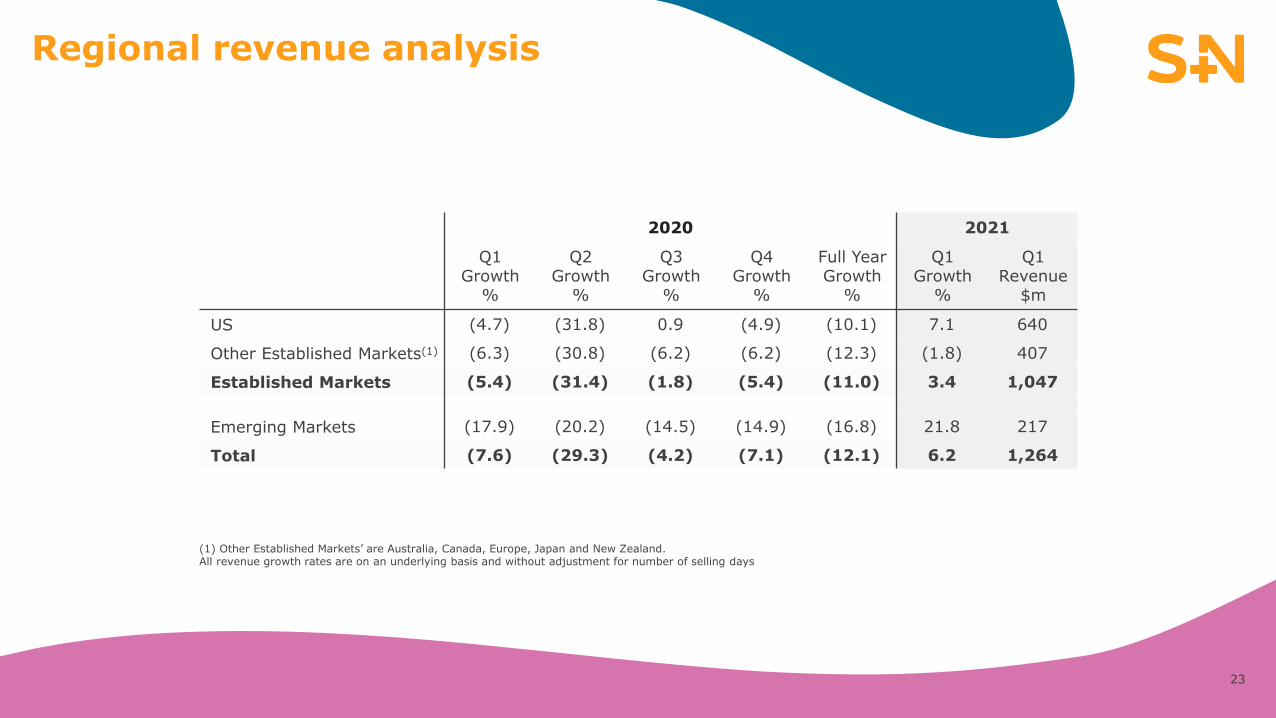
Regional revenue analysis
23
2020 2021
Q1Growth
%
Q2Growth
%
Q3Growth
%
Q4Growth
%
Full YearGrowth
%
Q1Growth
%
Q1Revenue
$m
US (4.7) (31.8) 0.9 (4.9) (10.1) 7.1 640
Other Established Markets(1) (6.3) (30.8) (6.2) (6.2) (12.3) (1.8) 407
Established Markets (5.4) (31.4) (1.8) (5.4) (11.0) 3.4 1,047
Emerging Markets (17.9) (20.2) (14.5) (14.9) (16.8) 21.8 217
Total (7.6) (29.3) (4.2) (7.1) (12.1) 6.2 1,264
(1) Other Established Markets’ are Australia, Canada, Europe, Japan and New Zealand. All revenue growth rates are on an underlying basis and without adjustment for number of selling days

Q1 consolidated revenue analysis
24
Q12021
Q12020
Reportedgrowth
Underlying Growth
Acquisitions/disposals
Currency impact
Consolidated revenue by franchise $m $m % % % %
Orthopaedics 540 497 8.7 1.6 4.3 2.8
Knee Implants 212 230 (7.9) (10.3) - 2.4
Hip Implants 154 137 12.6 9.1 - 3.5
Other Reconstruction 25 21 21.0 17.7 - 3.3
Trauma & Extremities 149 109 36.3 12.0 21.7 2.6
Sports Medicine & ENT 373 328 13.7 10.4 - 3.3
Sports Medicine Joint Repair 198 172 15.2 12.0 - 3.2
Arthroscopic Enabling Technologies 146 126 15.5 11.7 - 3.8
ENT 29 30 (2.2) (4.6) - 2.4
Advanced Wound Management 351 309 13.6 9.3 - 4.3
Advanced Wound Care 175 158 10.5 4.5 - 6.0
Advanced Wound Bioactives 116 91 27.2 26.7 - 0.5
Advanced Wound Devices 60 60 1.3 (3.2) - 4.5
Total 1,264 1,134 11.5 6.2 1.9 3.4

Trading days per quarter
25
Q1 Q2 Q3 Q4 Full year
2019 63 63 63 62 251
2020 62 63 63 64 252
2021 64 64 63 60 251
2022 63 64 63 60 250

Our sustainability strategy and 2020 highlights
8,000 hours of employee volunteering in the
communities in which we live and work.
Target: between 2020 and 2030, contribute 1 million
volunteer hours.
$4.7 million product donations to underserved
communities.
Target: between 2020 and 2030, donate $125 million in
products.
Eight Global Employee Inclusion Groups were
established. Our senior leaders and managers
were trained on inclusion.
Target: empower and promote the inclusion of all.
26
All sites in Memphis (US) began sourcing
renewable electricity, which consumes over 40%
of the Group’s electricity.
Target: achieve an 80% absolute reduction in total life
cycle greenhouse gas emissions by 2050, beginning by
implementing 100% renewable electricity plans at our
facilities in Memphis (US) and Malaysia, and at all of our
strategic manufacturing facilities by 2050.
1,853 tonnes: We sent 7% less waste to landfill
during 2020 compared to the previous year.
Target: achieve zero waste to landfill at our facilities in
Memphis (US) and Malaysia by 2050, and at all of our
strategic manufacturing facilities by 2030.
Started to develop our packaging reduction
roadmap, as well as our packaging sustainability
strategy.
Target: by 2025, incorporate at least 30% post-
consumer recycled content into all non-sterile packaging
materials, as well as incorporating packing materials
from sustainable sources for new packaging parts.
We have started risk mapping our supply chain.
Target: to complete the assessment of all suppliers by
2025, including subsequent tier levels, to assumer
compliance with our sustainability requirements.
Initiated sustainability reviews within New
Product Development.
Target: by 2022, include sustainability review in New
Product Development phase reviews for all new
products and product acquisitions.
PeopleCreating a lasting positive impact on our
communities
PlanetA medical technology business with a
positive impact
ProductsInnovating sustainably

Recommended