Japan Patent
Statistics
as extracted from the
2012 Annual Report
of the
with an Overview and Tables by
Harold C. Wegner
November 24, 2012
Wegner, Japan Patent Statistics (2012)
2
Contents
Overview of Changes 3
Japan Patent Statistics extracted from the 2012 Annual Report 4
Table I Patent Applications Filed in Japan over a Ten Year Period 4
Table II Examination Requests for Applications over a Ten Year Period 5
Table III First Actions for Patent Applications over a Ten Year Period 6
Table IV Japan Patent Applications by Country of Origin (2011) 7
Table IV-A Japan Applications from Europe (2011) 8
Table V Examiners and Appeal Examiners at the JPO 2008-2012 9
Japan Patent Office 2012 Annual Report (extracts only) pp. 10
et. seq.

Wegner, Japan Patent Statistics (2012)
3
Overview of Changes
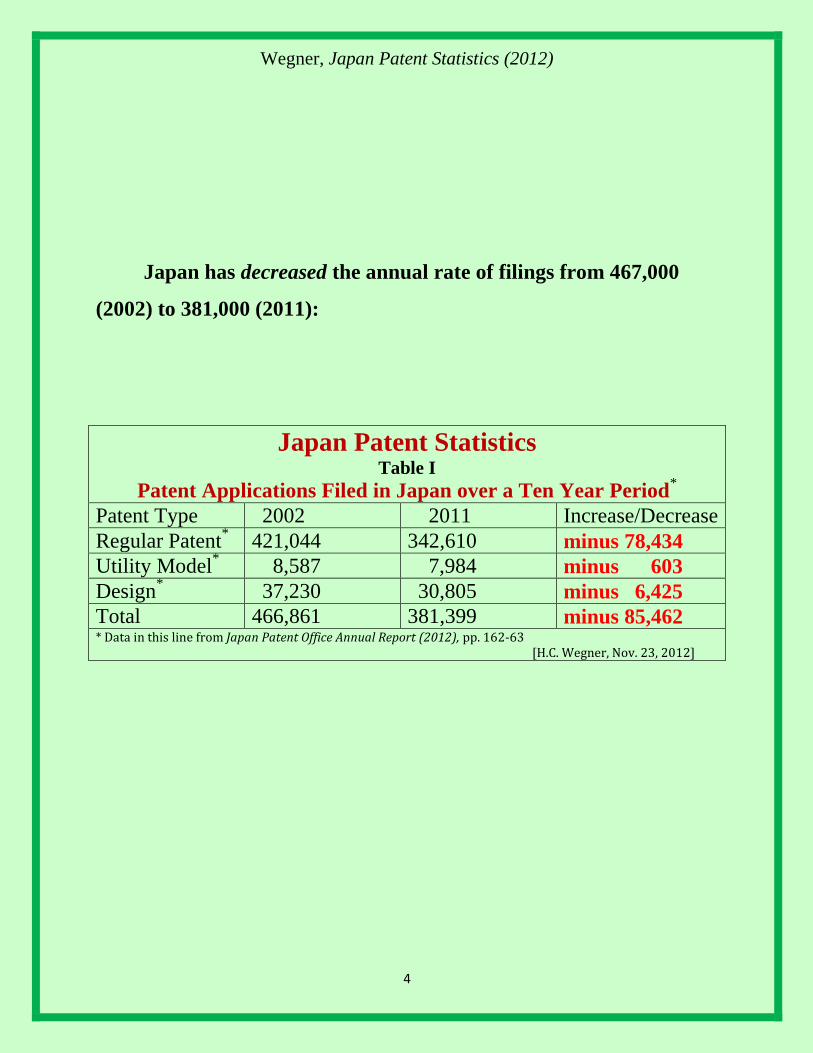
Japan has decreased the annual rate of filings from 467,000 (2002) to
381,000 (2011). See Table I (page 4).
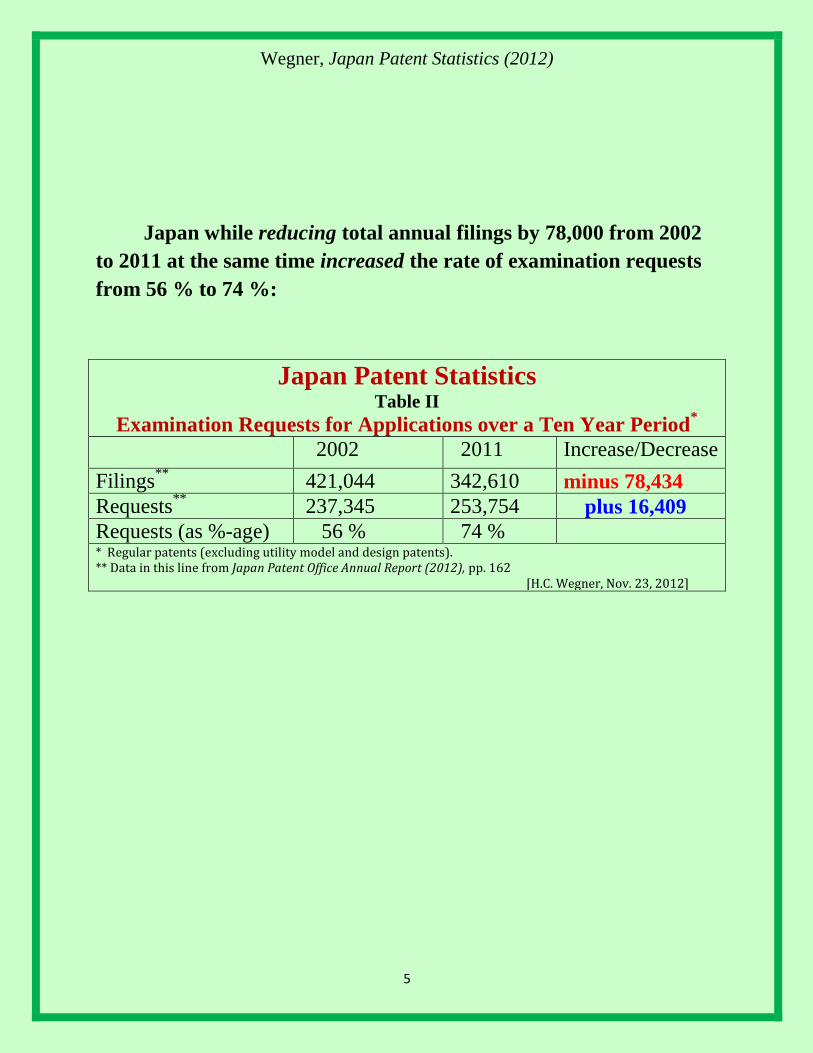
Japan while reducing total annual filings by 78,000 from 2002 to
2011 at the same time increased the rate of examination requests from
56 % to 74 %. See Table II (page 5).
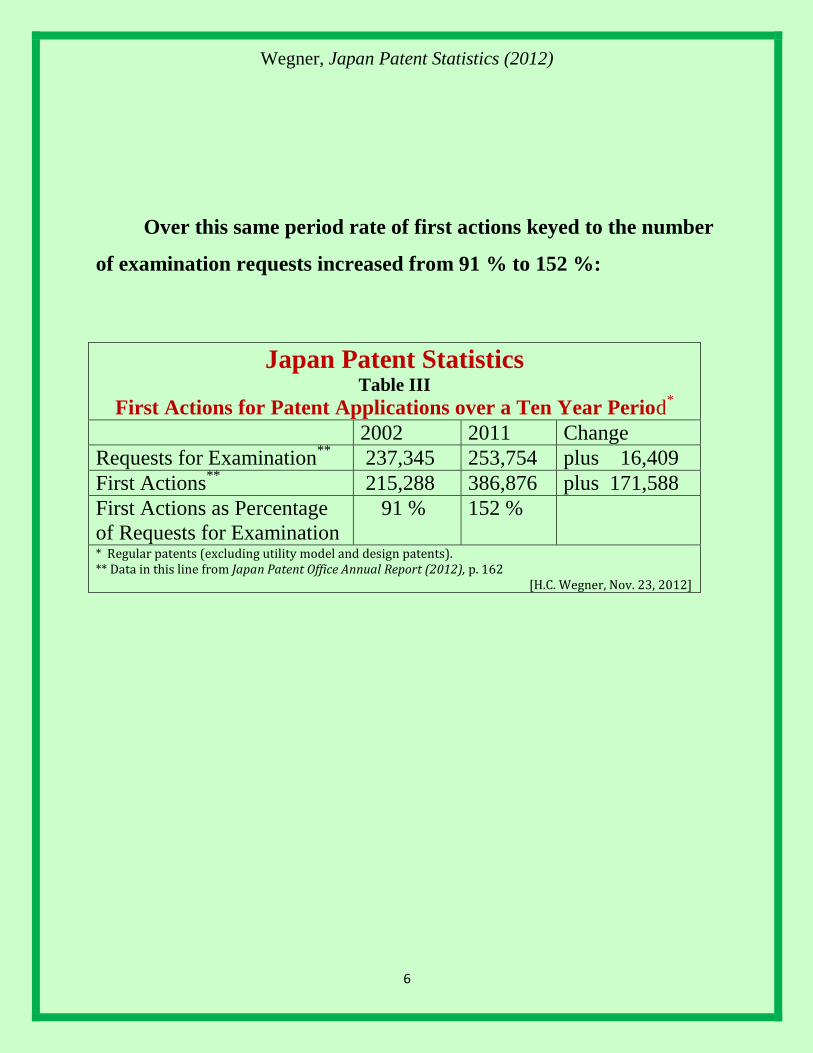
Over this same period rate of first actions keyed to the number of
examination requests increased from 91 % to 152 % See Table III
(page 6).
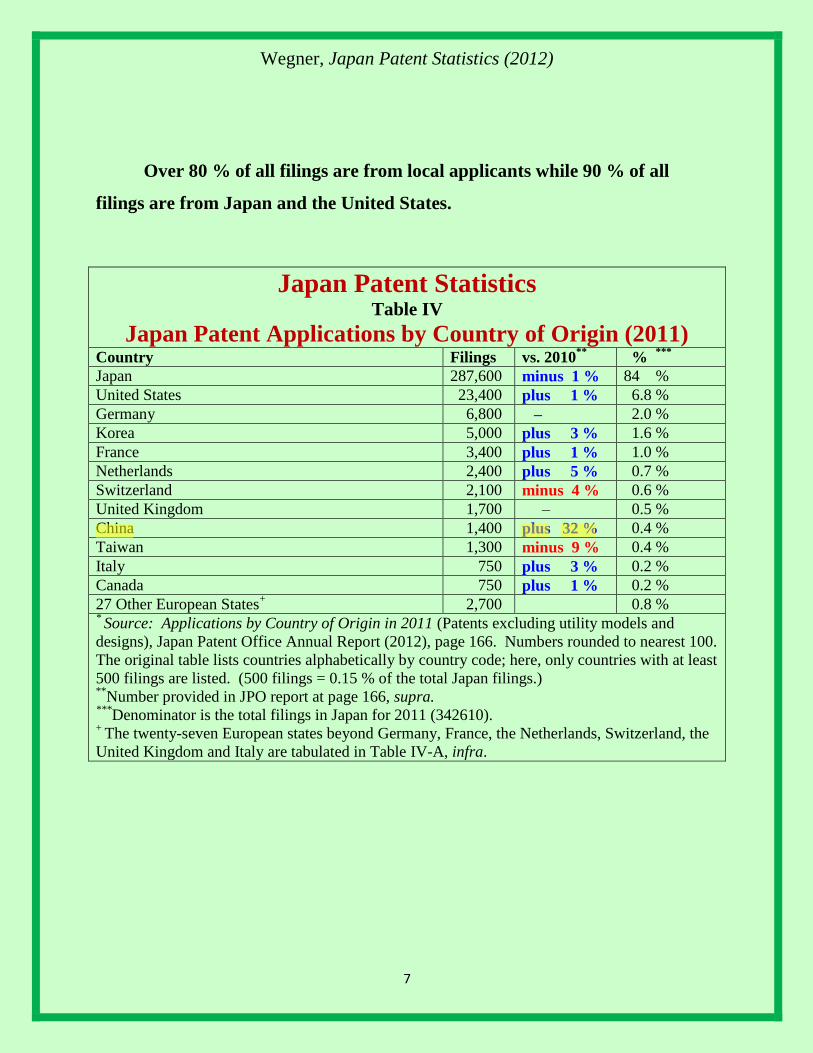
Over 80 % of all filings are from local applicants while 90 % of all
filings are from Japan and the United States. See Tables IV - IV-A
(pages 7-8).
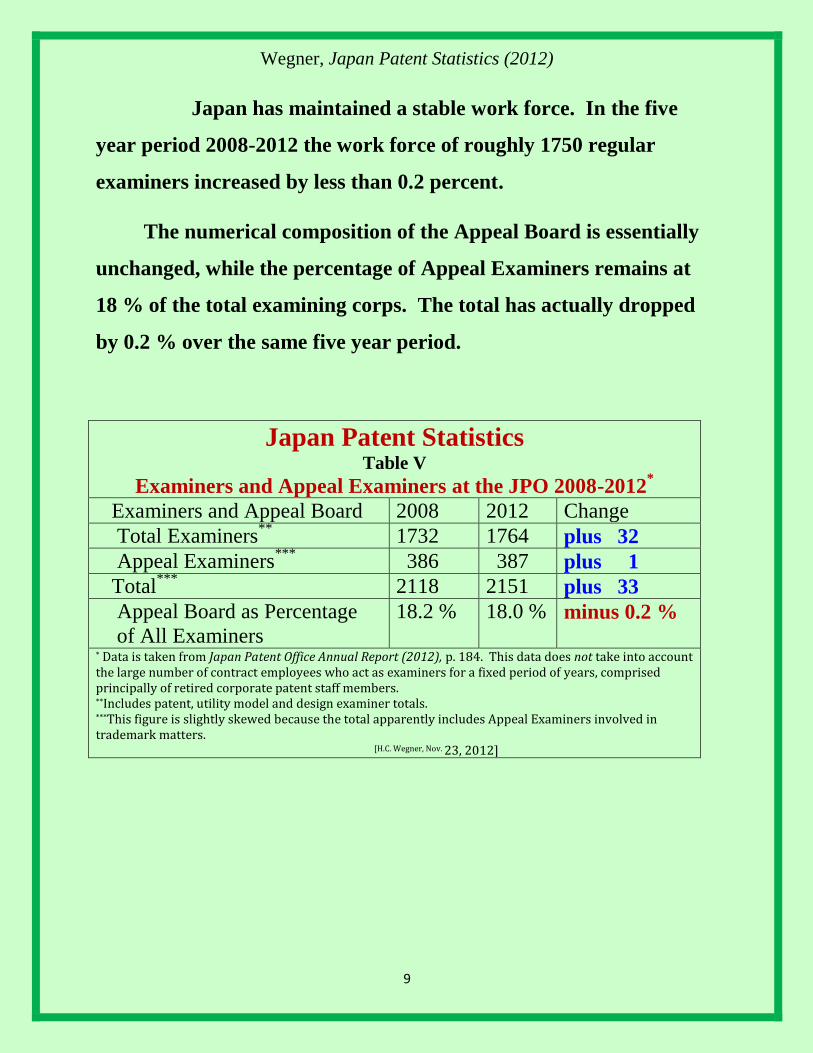
Japan has maintained a stable work force. In the five year period
2008-2012 the work force of roughly 1750 regular examiners increased
by less than 0.2 percent. See Table V (page 9).
The numerical composition of the Appeal Board is essentially
unchanged, while the percentage of Appeal Examiners remains at 18 %
of the total examining corps. The total has actually dropped by 0.2 %
over the same five year period. Id.
Wegner, Japan Patent Statistics (2012)
4
Japan has decreased the annual rate of filings from 467,000
(2002) to 381,000 (2011):
Japan Patent Statistics Table I
Patent Applications Filed in Japan over a Ten Year Period*
Patent Type 2002 2011 Increase/Decrease
Regular Patent* 421,044 342,610 minus 78,434
Utility Model* 8,587 7,984 minus 603
Design* 37,230 30,805 minus 6,425
Total 466,861 381,399 minus 85,462 * Data in this line from Japan Patent Office Annual Report (2012), pp. 162-63 [H.C. Wegner, Nov. 23, 2012]
Wegner, Japan Patent Statistics (2012)
5
Japan while reducing total annual filings by 78,000 from 2002
to 2011 at the same time increased the rate of examination requests
from 56 % to 74 %:
Japan Patent Statistics Table II
Examination Requests for Applications over a Ten Year Period*
2002 2011 Increase/Decrease
Filings**
421,044 342,610 minus 78,434
Requests**
237,345 253,754 plus 16,409
Requests (as %-age) 56 % 74 % * Regular patents (excluding utility model and design patents). ** Data in this line from Japan Patent Office Annual Report (2012), pp. 162 [H.C. Wegner, Nov. 23, 2012]
Wegner, Japan Patent Statistics (2012)
6
Over this same period rate of first actions keyed to the number
of examination requests increased from 91 % to 152 %:
Japan Patent Statistics Table III
First Actions for Patent Applications over a Ten Year Period*
2002 2011 Change
Requests for Examination**
237,345 253,754 plus 16,409
First Actions**
215,288 386,876 plus 171,588
First Actions as Percentage
of Requests for Examination
91 % 152 %
* Regular patents (excluding utility model and design patents). ** Data in this line from Japan Patent Office Annual Report (2012), p. 162 [H.C. Wegner, Nov. 23, 2012]
Wegner, Japan Patent Statistics (2012)
7
Over 80 % of all filings are from local applicants while 90 % of all
filings are from Japan and the United States.
Japan Patent Statistics Table IV
Japan Patent Applications by Country of Origin (2011) Country Filings vs. 2010
** %
***
Japan 287,600 minus 1 % 84 %
United States 23,400 plus 1 % 6.8 %
Germany 6,800 – 2.0 %
Korea 5,000 plus 3 % 1.6 %
France 3,400 plus 1 % 1.0 %
Netherlands 2,400 plus 5 % 0.7 %
Switzerland 2,100 minus 4 % 0.6 %
United Kingdom 1,700 – 0.5 %
China 1,400 plus 32 % 0.4 %
Taiwan 1,300 minus 9 % 0.4 %
Italy 750 plus 3 % 0.2 %
Canada 750 plus 1 % 0.2 %
27 Other European States+ 2,700 0.8 %
* Source: Applications by Country of Origin in 2011 (Patents excluding utility models and
designs), Japan Patent Office Annual Report (2012), page 166. Numbers rounded to nearest 100.
The original table lists countries alphabetically by country code; here, only countries with at least
500 filings are listed. (500 filings = 0.15 % of the total Japan filings.) **
Number provided in JPO report at page 166, supra. ***
Denominator is the total filings in Japan for 2011 (342610). +
The twenty-seven European states beyond Germany, France, the Netherlands, Switzerland, the
United Kingdom and Italy are tabulated in Table IV-A, infra.
Wegner, Japan Patent Statistics (2012)
8
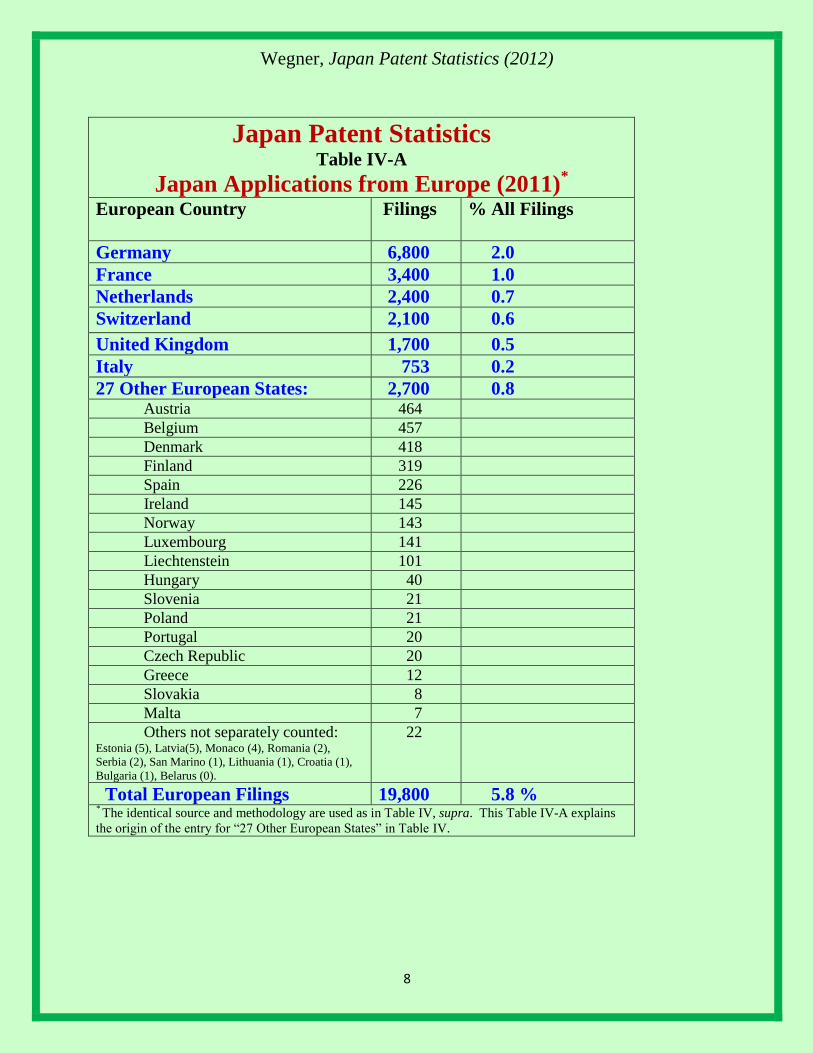
Japan Patent Statistics Table IV-A
Japan Applications from Europe (2011)*
European Country Filings
% All Filings
Germany 6,800 2.0
France 3,400 1.0
Netherlands 2,400 0.7
Switzerland 2,100 0.6
United Kingdom 1,700 0.5
Italy 753 0.2
27 Other European States: 2,700 0.8 Austria 464
Belgium 457
Denmark 418
Finland 319
Spain 226
Ireland 145
Norway 143
Luxembourg 141
Liechtenstein 101
Hungary 40
Slovenia 21
Poland 21
Portugal 20
Czech Republic 20
Greece 12
Slovakia 8
Malta 7
Others not separately counted: Estonia (5), Latvia(5), Monaco (4), Romania (2),
Serbia (2), San Marino (1), Lithuania (1), Croatia (1),
Bulgaria (1), Belarus (0).
22
Total European Filings 19,800 5.8 % * The identical source and methodology are used as in Table IV, supra. This Table IV-A explains
the origin of the entry for “27 Other European States” in Table IV.
Wegner, Japan Patent Statistics (2012)
9
Japan has maintained a stable work force. In the five
year period 2008-2012 the work force of roughly 1750 regular
examiners increased by less than 0.2 percent.
The numerical composition of the Appeal Board is essentially
unchanged, while the percentage of Appeal Examiners remains at
18 % of the total examining corps. The total has actually dropped
by 0.2 % over the same five year period.
Japan Patent Statistics Table V
Examiners and Appeal Examiners at the JPO 2008-2012*
Examiners and Appeal Board 2008 2012 Change
Total Examiners**
1732 1764 plus 32
Appeal Examiners***
386 387 plus 1
Total***
2118 2151 plus 33
Appeal Board as Percentage
of All Examiners
18.2 % 18.0 % minus 0.2 %
* Data is taken from Japan Patent Office Annual Report (2012), p. 184. This data does not take into account the large number of contract employees who act as examiners for a fixed period of years, comprised principally of retired corporate patent staff members. **Includes patent, utility model and design examiner totals. ***This figure is slightly skewed because the total apparently includes Appeal Examiners involved in trademark matters. [H.C. Wegner, Nov. 23, 2012]
Annual Report 2012
Annual Report 2012日本国特許庁Japan Patent Officeaddress 3-4-3, KASUMIGASEKI, CHIYODA-KU, TOKYO, 100-8915, JAPANtelephone +81-3-3581-1101homepage http://www.jpo.go.jp
Annual Report 2012 Part 5
162
Annual Report 2012 Part 5
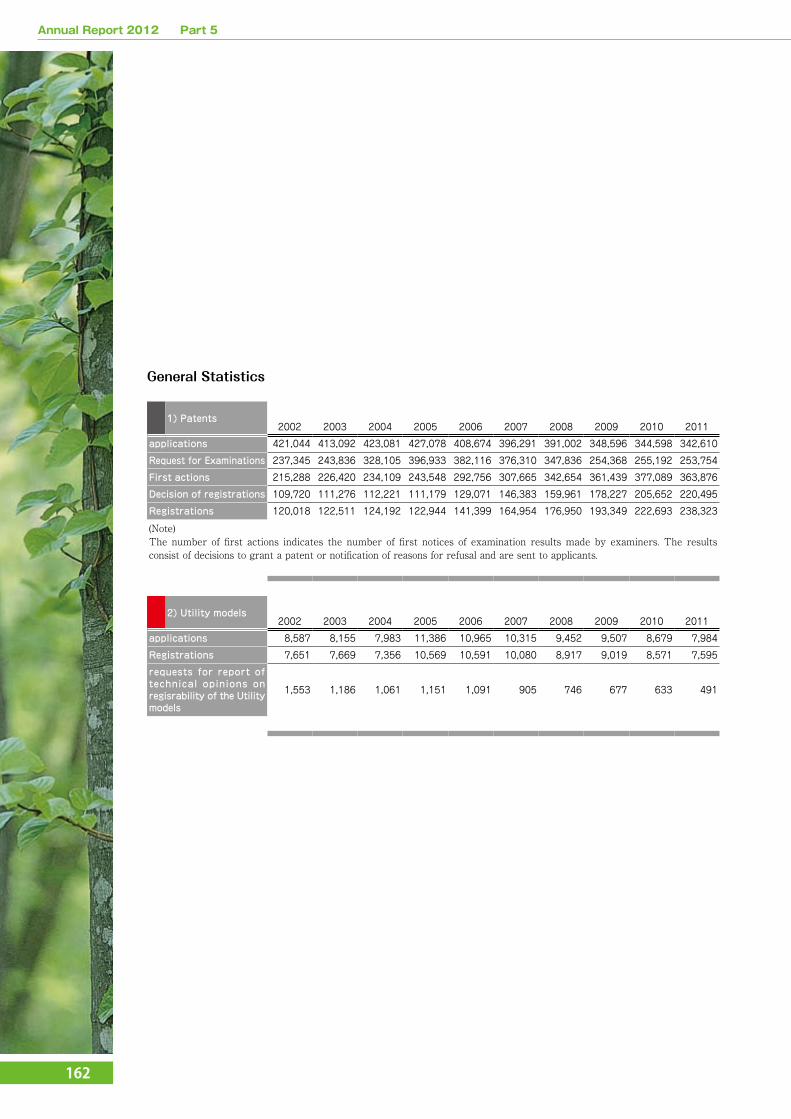
General Statistics
1) Patents2002 2003 2004 2005 2006 2007 2008 2009 2010 2011
applications 421,044 413,092 423,081 427,078 408,674 396,291 391,002 348,596 344,598 342,610
Request for Examinations 237,345 243,836 328,105 396,933 382,116 376,310 347,836 254,368 255,192 253,754
First actions 215,288 226,420 234,109 243,548 292,756 307,665 342,654 361,439 377,089 363,876
Decision of registrations 109,720 111,276 112,221 111,179 129,071 146,383 159,961 178,227 205,652 220,495
Registrations 120,018 122,511 124,192 122,944 141,399 164,954 176,950 193,349 222,693 238,323
(Note)The number of first actions indicates the number of first notices of examination results made by examiners. The results consist of decisions to grant a patent or notification of reasons for refusal and are sent to applicants.
2) Utility models2002 2003 2004 2005 2006 2007 2008 2009 2010 2011
applications 8,587 8,155 7,983 11,386 10,965 10,315 9,452 9,507 8,679 7,984
Registrations 7,651 7,669 7,356 10,569 10,591 10,080 8,917 9,019 8,571 7,595
requests for report of technical opinions on regisrability of the Utility models
1,553 1,186 1,061 1,151 1,091 905 746 677 633 491
Annual Report 2012 Part 5
Stat
istic
s an
d Ap
pend
ixes
Part
5
Annual Report 2012 Part 5
163
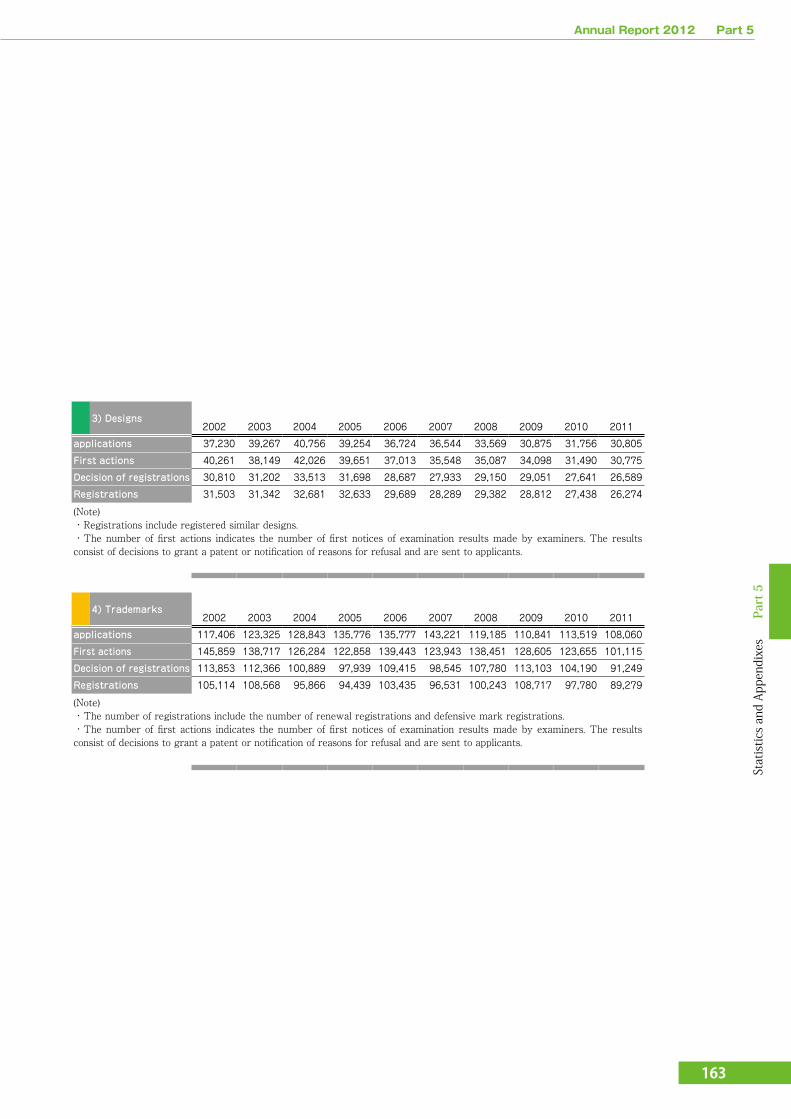
3) Designs2002 2003 2004 2005 2006 2007 2008 2009 2010 2011
applications 37,230 39,267 40,756 39,254 36,724 36,544 33,569 30,875 31,756 30,805
First actions 40,261 38,149 42,026 39,651 37,013 35,548 35,087 34,098 31,490 30,775
Decision of registrations 30,810 31,202 33,513 31,698 28,687 27,933 29,150 29,051 27,641 26,589
Registrations 31,503 31,342 32,681 32,633 29,689 28,289 29,382 28,812 27,438 26,274
(Note) ・Registrations include registered similar designs.・The number of first actions indicates the number of first notices of examination results made by examiners. The results consist of decisions to grant a patent or notification of reasons for refusal and are sent to applicants.
4) Trademarks2002 2003 2004 2005 2006 2007 2008 2009 2010 2011
applications 117,406 123,325 128,843 135,776 135,777 143,221 119,185 110,841 113,519 108,060
First actions 145,859 138,717 126,284 122,858 139,443 123,943 138,451 128,605 123,655 101,115
Decision of registrations 113,853 112,366 100,889 97,939 109,415 98,545 107,780 113,103 104,190 91,249
Registrations 105,114 108,568 95,866 94,439 103,435 96,531 100,243 108,717 97,780 89,279
(Note) ・The number of registrations include the number of renewal registrations and defensive mark registrations.・The number of first actions indicates the number of first notices of examination results made by examiners. The results consist of decisions to grant a patent or notification of reasons for refusal and are sent to applicants.

Annual Report 2012 Part 5
164
Annual Report 2012 Part 5
Japanese and Foreigners
1) patents2002 2003 2004 2005 2006 2007 2008 2009 2010 2011
applicationsJapanese 369,458 362,711 368,416 367,960 347,060 333,498 330,110 295,315 290,081 287,580
Foreigners 51,586 50,381 54,665 59,118 61,614 62,793 60,892 53,281 54,517 55,030
registrationsJapanese 108,515 110,835 112,527 111,088 126,804 145,040 151,765 164,459 187,237 197,594
Foreigners 11,503 11,676 11,665 11,856 14,595 19,914 25,185 28,890 35,456 40,729
(Note) The number of first actions indicates the number of first notices of examination results made by examiners. The results consist of decisions to grant a patent or notification of reasons for refusal and are sent to applicants.
2) Utility models2002 2003 2004 2005 2006 2007 2008 2009 2010 2011
applicationsJapanese 6,938 6,380 6,337 9,421 8,922 8,399 7,717 7,799 6,889 6,305
Foreigners 1,649 1,775 1,646 1,965 2,043 1,916 1,735 1,708 1,790 1,679
registrationsJapanese 6,091 5,914 5,711 8,462 8,523 8,160 7,187 7,361 6,755 5,998
Foreigners 1,560 1,755 1,645 2,107 2,068 1,920 1,730 1,658 1,816 1,597
(Note) "Utility Models" are the numbers of utility model application filings/registrations made under the revised Utility Model Law which came into effect in January, 1994.
3) Designs2002 2003 2004 2005 2006 2007 2008 2009 2010 2011
applicationsJapanese 34,881 36,574 37,565 35,746 33,094 32,202 29,621 27,674 28,083 26,658
Foreigners 2,349 2,693 3,191 3,508 3,630 4,342 3,948 3,201 3,673 4,147
registrationsJapanese 29,550 29,284 30,485 29,971 27,034 25,228 25,986 25,819 24,458 23,042
Foreigners 1,953 2,058 2,196 2,662 2,655 3,061 3,396 2,993 2,980 3,232
(Note) Registrations include the number of registered similar designs.
4) Trademarks2002 2003 2004 2005 2006 2007 2008 2009 2010 2011
applicationsJapanese 100,645 106,957 110,270 114,015 111,754 118,155 95,674 90,474 92,163 84,673
Foreigners 16,761 16,368 18,573 21,761 24,023 25,066 23,511 20,367 21,356 23,387
registrationsJapanese 89,029 92,898 83,013 80,962 88,411 79,836 82,469 88,449 79,338 70,800
Foreigners 16,085 15,670 12,853 13,477 15,024 16,695 17,774 20,268 18,442 18,479
(Note) The number of registrations includes the numbers of renewal registrations, defensive mark registrations and the registrations which are registered through the extension of protections designating Japan under the Madrid Protocol System.
Annual Report 2012 Part 5
166
Annual Report 2012 Part 5
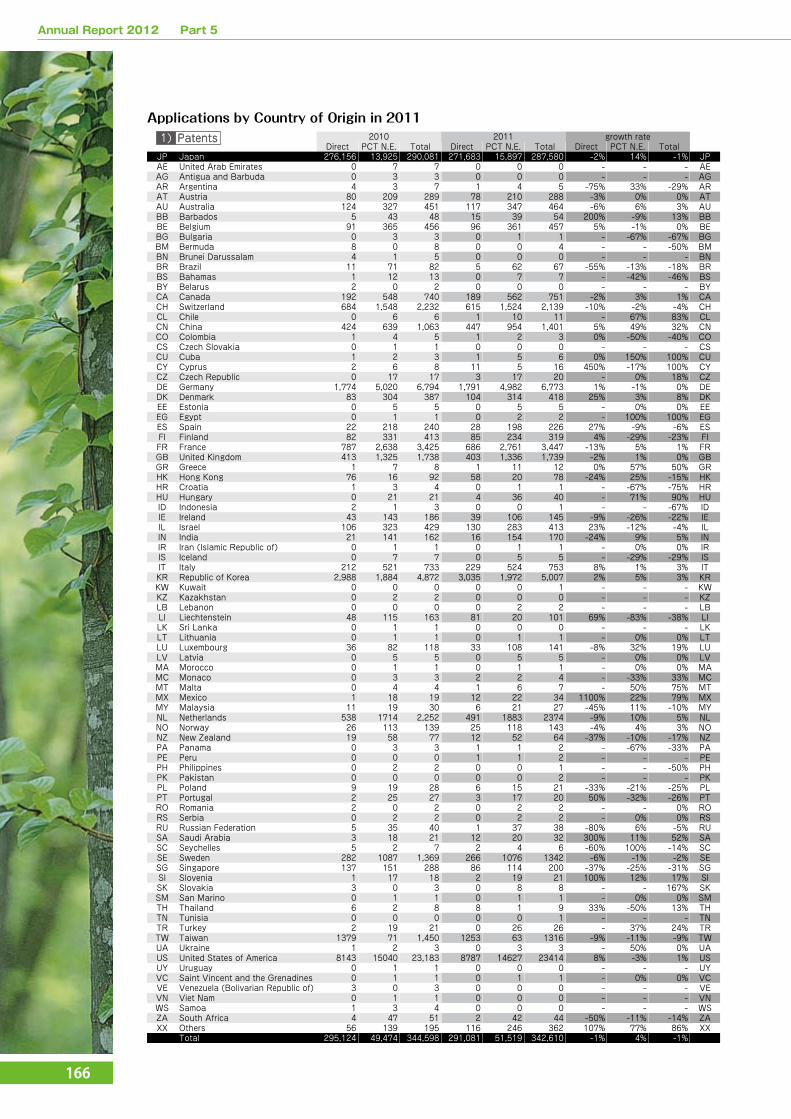
Applications by Country of Origin in 20112010 2011 growth rate
Direct PCT N.E. Total Direct PCT N.E. Total Direct PCT N.E. TotalJP Japan 276,156 13,925 290,081 271,683 15,897 287,580 -2% 14% -1% JPAE United Arab Emirates 0 7 7 0 0 0 - - - AEAG Antigua and Barbuda 0 3 3 0 0 0 - - - AGAR Argentina 4 3 7 1 4 5 -75% 33% -29% ARAT Austria 80 209 289 78 210 288 -3% 0% 0% ATAU Australia 124 327 451 117 347 464 -6% 6% 3% AUBB Barbados 5 43 48 15 39 54 200% -9% 13% BBBE Belgium 91 365 456 96 361 457 5% -1% 0% BEBG Bulgaria 0 3 3 0 1 1 - -67% -67% BGBM Bermuda 8 0 8 0 0 4 - - -50% BMBN Brunei Darussalam 4 1 5 0 0 0 - - - BNBR Brazil 11 71 82 5 62 67 -55% -13% -18% BRBS Bahamas 1 12 13 0 7 7 - -42% -46% BSBY Belarus 2 0 2 0 0 0 - - - BYCA Canada 192 548 740 189 562 751 -2% 3% 1% CACH Switzerland 684 1,548 2,232 615 1,524 2,139 -10% -2% -4% CHCL Chile 0 6 6 1 10 11 - 67% 83% CLCN China 424 639 1,063 447 954 1,401 5% 49% 32% CNCO Colombia 1 4 5 1 2 3 0% -50% -40% COCS Czech Slovakia 0 1 1 0 0 0 - - - CSCU Cuba 1 2 3 1 5 6 0% 150% 100% CUCY Cyprus 2 6 8 11 5 16 450% -17% 100% CYCZ Czech Republic 0 17 17 3 17 20 - 0% 18% CZDE Germany 1,774 5,020 6,794 1,791 4,982 6,773 1% -1% 0% DEDK Denmark 83 304 387 104 314 418 25% 3% 8% DKEE Estonia 0 5 5 0 5 5 - 0% 0% EEEG Egypt 0 1 1 0 2 2 - 100% 100% EGES Spain 22 218 240 28 198 226 27% -9% -6% ESFI Finland 82 331 413 85 234 319 4% -29% -23% FIFR France 787 2,638 3,425 686 2,761 3,447 -13% 5% 1% FRGB United Kingdom 413 1,325 1,738 403 1,336 1,739 -2% 1% 0% GBGR Greece 1 7 8 1 11 12 0% 57% 50% GRHK Hong Kong 76 16 92 58 20 78 -24% 25% -15% HKHR Croatia 1 3 4 0 1 1 - -67% -75% HRHU Hungary 0 21 21 4 36 40 - 71% 90% HUID Indonesia 2 1 3 0 0 1 - - -67% IDIE Ireland 43 143 186 39 106 145 -9% -26% -22% IEIL Israel 106 323 429 130 283 413 23% -12% -4% ILIN India 21 141 162 16 154 170 -24% 9% 5% INIR Iran (Islamic Republic of) 0 1 1 0 1 1 - 0% 0% IRIS Iceland 0 7 7 0 5 5 - -29% -29% ISIT Italy 212 521 733 229 524 753 8% 1% 3% ITKR Republic of Korea 2,988 1,884 4,872 3,035 1,972 5,007 2% 5% 3% KRKW Kuwait 0 0 0 0 0 1 - - - KWKZ Kazakhstan 0 2 2 0 0 0 - - - KZLB Lebanon 0 0 0 0 2 2 - - - LBLI Liechtenstein 48 115 163 81 20 101 69% -83% -38% LILK Sri Lanka 0 1 1 0 0 0 - - - LKLT Lithuania 0 1 1 0 1 1 - 0% 0% LTLU Luxembourg 36 82 118 33 108 141 -8% 32% 19% LULV Latvia 0 5 5 0 5 5 - 0% 0% LVMA Morocco 0 1 1 0 1 1 - 0% 0% MAMC Monaco 0 3 3 2 2 4 - -33% 33% MCMT Malta 0 4 4 1 6 7 - 50% 75% MTMX Mexico 1 18 19 12 22 34 1100% 22% 79% MXMY Malaysia 11 19 30 6 21 27 -45% 11% -10% MYNL Netherlands 538 1714 2,252 491 1883 2374 -9% 10% 5% NLNO Norway 26 113 139 25 118 143 -4% 4% 3% NONZ New Zealand 19 58 77 12 52 64 -37% -10% -17% NZPA Panama 0 3 3 1 1 2 - -67% -33% PAPE Peru 0 0 0 1 1 2 - - - PEPH Philippines 0 2 2 0 0 1 - - -50% PHPK Pakistan 0 0 0 0 0 2 - - - PKPL Poland 9 19 28 6 15 21 -33% -21% -25% PLPT Portugal 2 25 27 3 17 20 50% -32% -26% PTRO Romania 2 0 2 0 2 2 - - 0% RORS Serbia 0 2 2 0 2 2 - 0% 0% RSRU Russian Federation 5 35 40 1 37 38 -80% 6% -5% RUSA Saudi Arabia 3 18 21 12 20 32 300% 11% 52% SASC Seychelles 5 2 7 2 4 6 -60% 100% -14% SCSE Sweden 282 1087 1,369 266 1076 1342 -6% -1% -2% SESG Singapore 137 151 288 86 114 200 -37% -25% -31% SGSI Slovenia 1 17 18 2 19 21 100% 12% 17% SISK Slovakia 3 0 3 0 8 8 - - 167% SKSM San Marino 0 1 1 0 1 1 - 0% 0% SMTH Thailand 6 2 8 8 1 9 33% -50% 13% THTN Tunisia 0 0 0 0 0 1 - - - TNTR Turkey 2 19 21 0 26 26 - 37% 24% TRTW Taiwan 1379 71 1,450 1253 63 1316 -9% -11% -9% TWUA Ukraine 1 2 3 0 3 3 - 50% 0% UAUS United States of America 8143 15040 23,183 8787 14627 23414 8% -3% 1% USUY Uruguay 0 1 1 0 0 0 - - - UYVC Saint Vincent and the Grenadines 0 1 1 0 1 1 - 0% 0% VCVE Venezuela (Bolivarian Republic of) 3 0 3 0 0 0 - - - VEVN Viet Nam 0 1 1 0 0 0 - - - VNWS Samoa 1 3 4 0 0 0 - - - WSZA South Africa 4 47 51 2 42 44 -50% -11% -14% ZAXX Others 56 139 195 116 246 362 107% 77% 86% XX
Total 295,124 49,474 344,598 291,081 51,519 342,610 -1% 4% -1%
1) Patents1) Patents
Annual Report 2012 Part 5
174
Annual Report 2012 Part 5
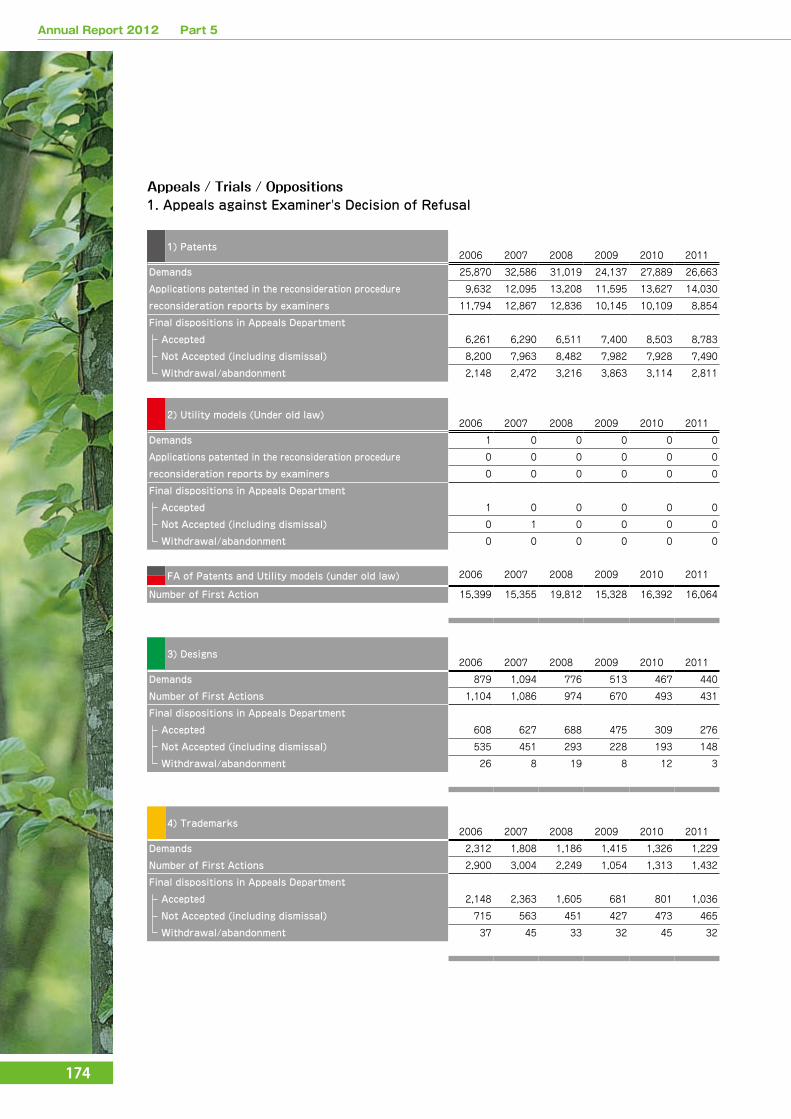
Appeals / Trials / Oppositions1. Appeals against Examiner's Decision of Refusal
1) Patents2006 2007 2008 2009 2010 2011
Demands 25,870 32,586 31,019 24,137 27,889 26,663
Applications patented in the reconsideration procedure 9,632 12,095 13,208 11,595 13,627 14,030
reconsideration reports by examiners 11,794 12,867 12,836 10,145 10,109 8,854
Final dispositions in Appeals Department
Accepted 6,261 6,290 6,511 7,400 8,503 8,783
Not Accepted (including dismissal) 8,200 7,963 8,482 7,982 7,928 7,490
Withdrawal/abandonment 2,148 2,472 3,216 3,863 3,114 2,811
2) Utility models (Under old law)2006 2007 2008 2009 2010 2011
Demands 1 0 0 0 0 0
Applications patented in the reconsideration procedure 0 0 0 0 0 0
reconsideration reports by examiners 0 0 0 0 0 0
Final dispositions in Appeals Department
Accepted 1 0 0 0 0 0
Not Accepted (including dismissal) 0 1 0 0 0 0
Withdrawal/abandonment 0 0 0 0 0 0
FA of Patents and Utility models (under old law) 2006 2007 2008 2009 2010 2011
Number of First Action 15,399 15,355 19,812 15,328 16,392 16,064
3) Designs2006 2007 2008 2009 2010 2011
Demands 879 1,094 776 513 467 440
Number of First Actions 1,104 1,086 974 670 493 431
Final dispositions in Appeals Department
Accepted 608 627 688 475 309 276
Not Accepted (including dismissal) 535 451 293 228 193 148
Withdrawal/abandonment 26 8 19 8 12 3
4) Trademarks2006 2007 2008 2009 2010 2011
Demands 2,312 1,808 1,186 1,415 1,326 1,229
Number of First Actions 2,900 3,004 2,249 1,054 1,313 1,432
Final dispositions in Appeals Department
Accepted 2,148 2,363 1,605 681 801 1,036
Not Accepted (including dismissal) 715 563 451 427 473 465
Withdrawal/abandonment 37 45 33 32 45 32
Annual Report 2012 Part 5
Stat
istic
s an
d Ap
pend
ixes
Part
5
Annual Report 2012 Part 5
175
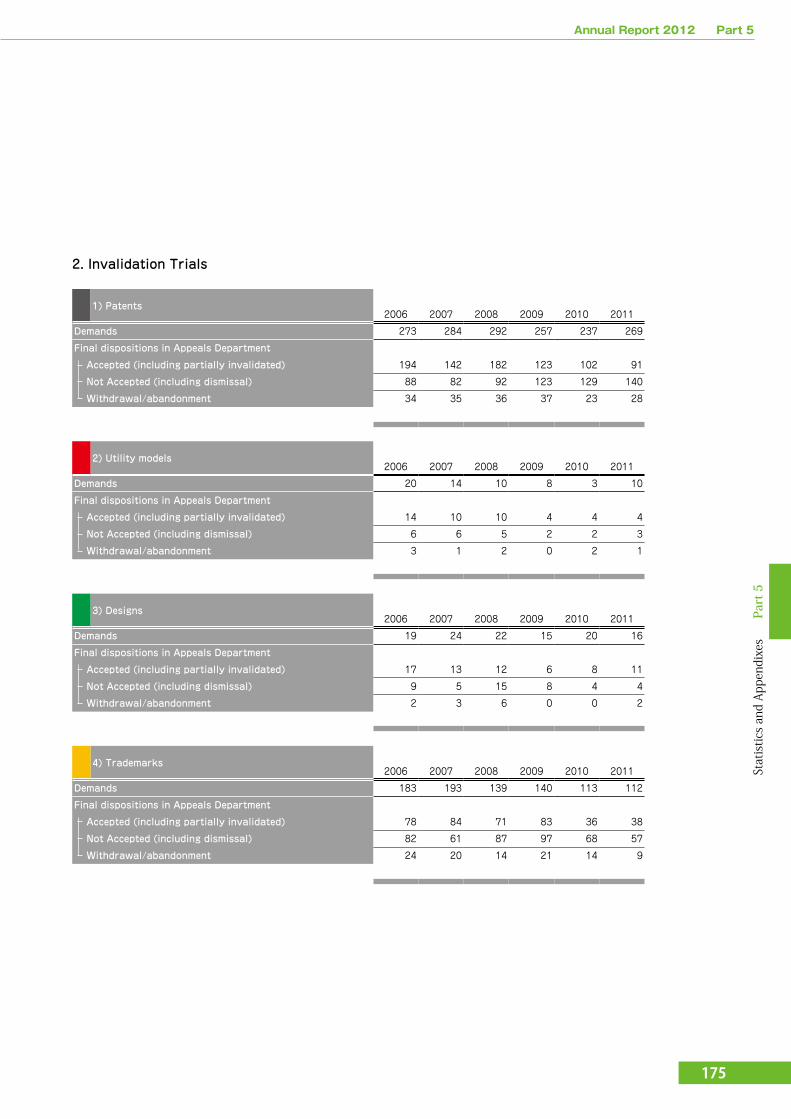
2. Invalidation Trials
1) Patents2006 2007 2008 2009 2010 2011
Demands 273 284 292 257 237 269
Final dispositions in Appeals Department
Accepted (including partially invalidated) 194 142 182 123 102 91
Not Accepted (including dismissal) 88 82 92 123 129 140
Withdrawal/abandonment 34 35 36 37 23 28
2) Utility models2006 2007 2008 2009 2010 2011
Demands 20 14 10 8 3 10
Final dispositions in Appeals Department
Accepted (including partially invalidated) 14 10 10 4 4 4
Not Accepted (including dismissal) 6 6 5 2 2 3
Withdrawal/abandonment 3 1 2 0 2 1
3) Designs2006 2007 2008 2009 2010 2011
Demands 19 24 22 15 20 16
Final dispositions in Appeals Department
Accepted (including partially invalidated) 17 13 12 6 8 11
Not Accepted (including dismissal) 9 5 15 8 4 4
Withdrawal/abandonment 2 3 6 0 0 2
4) Trademarks2006 2007 2008 2009 2010 2011
Demands 183 193 139 140 113 112
Final dispositions in Appeals Department
Accepted (including partially invalidated) 78 84 71 83 36 38
Not Accepted (including dismissal) 82 61 87 97 68 57
Withdrawal/abandonment 24 20 14 21 14 9
Annual Report 2012 Part 5
176
Annual Report 2012 Part 5
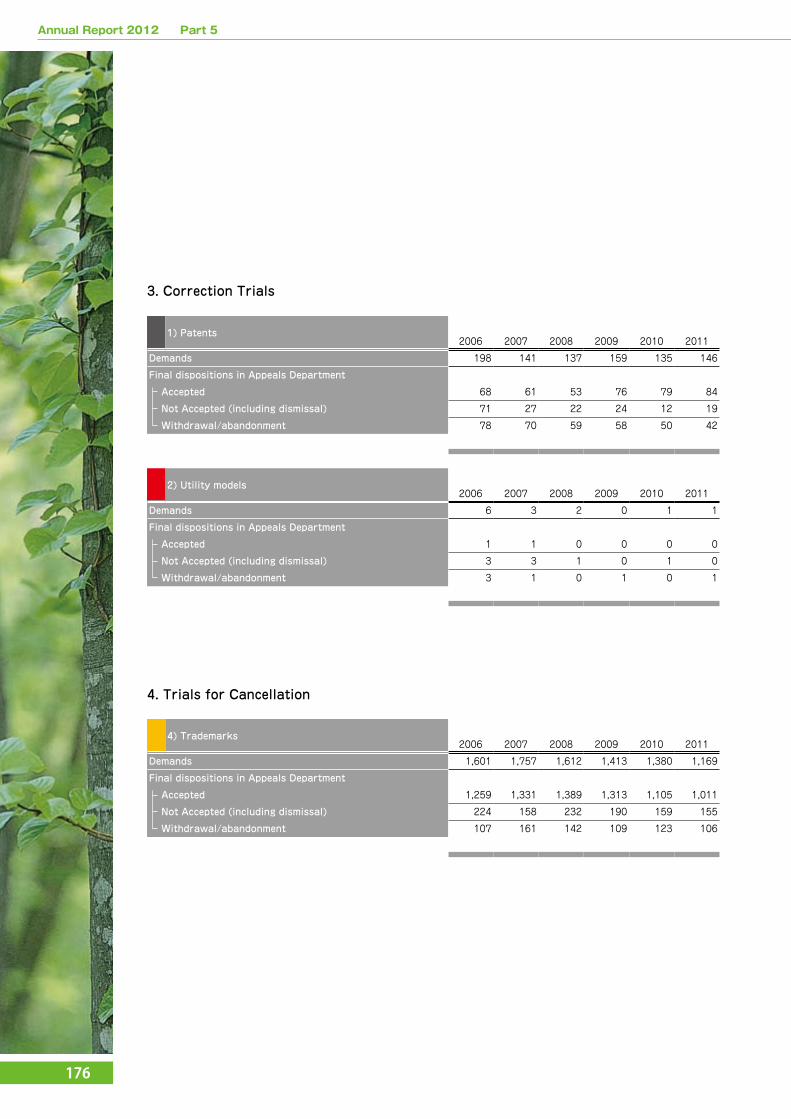
3. Correction Trials
1) Patents2006 2007 2008 2009 2010 2011
Demands 198 141 137 159 135 146
Final dispositions in Appeals Department
Accepted 68 61 53 76 79 84
Not Accepted (including dismissal) 71 27 22 24 12 19
Withdrawal/abandonment 78 70 59 58 50 42
2) Utility models2006 2007 2008 2009 2010 2011
Demands 6 3 2 0 1 1
Final dispositions in Appeals Department
Accepted 1 1 0 0 0 0
Not Accepted (including dismissal) 3 3 1 0 1 0
Withdrawal/abandonment 3 1 0 1 0 1
4. Trials for Cancellation
4) Trademarks2006 2007 2008 2009 2010 2011
Demands 1,601 1,757 1,612 1,413 1,380 1,169
Final dispositions in Appeals Department
Accepted 1,259 1,331 1,389 1,313 1,105 1,011
Not Accepted (including dismissal) 224 158 232 190 159 155
Withdrawal/abandonment 107 161 142 109 123 106

Annual Report 2012 Part 5
Stat
istic
s an
d Ap
pend
ixes
Part
5
Annual Report 2012 Part 5
177
5. Hantei (Advisory Opinion)
1) Patents2006 2007 2008 2009 2010 2011
Demands 23 58 31 32 39 34
Final dispositions in Appeals Department
Accepted 19 19 24 11 16 19
Not Accepted (including dismissal) 15 17 27 17 16 18
Withdrawal/abandonment 3 4 1 1 4 2
2) Utility models2006 2007 2008 2009 2010 2011
Demands 3 1 0 1 2 1
Final dispositions in Appeals Department
Accepted 2 2 1 0 0 0
Not Accepted (including dismissal) 2 0 0 1 0 3
Withdrawal/abandonment 0 0 0 0 0 0
3) Designs2006 2007 2008 2009 2010 2011
Demands 32 35 4 10 19 17
Final dispositions in Appeals Department
Accepted 20 13 7 7 6 11
Not Accepted (including dismissal) 7 26 8 4 7 2
Withdrawal/abandonment 0 2 1 0 0 1
4) Trademarks2006 2007 2008 2009 2010 2011
Demands 14 12 12 7 12 4
Final dispositions in Appeals Department
Accepted 6 5 10 7 6 6
Not Accepted (including dismissal) 6 5 5 1 5 1
Withdrawal/abandonment 0 0 1 1 0 0
Annual Report 2012 Part 5
180
Annual Report 2012 Part 5
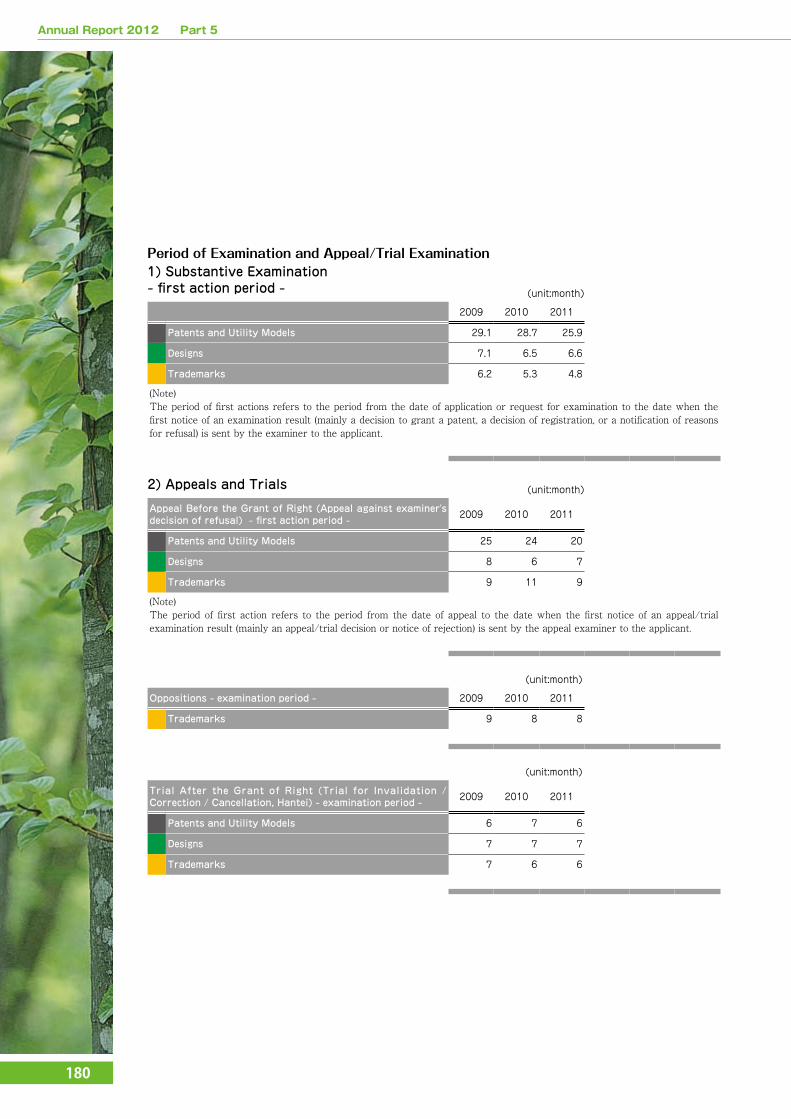
Period of Examination and Appeal/Trial Examination1) Substantive Examination- first action period - (unit:month)
2009 2010 2011
Patents and Utility Models 29.1 28.7 25.9
Designs 7.1 6.5 6.6
Trademarks 6.2 5.3 4.8
(Note)The period of first actions refers to the period from the date of application or request for examination to the date when the first notice of an examination result (mainly a decision to grant a patent, a decision of registration, or a notification of reasons for refusal) is sent by the examiner to the applicant.
2) Appeals and Trials (unit:month)
Appeal Before the Grant of Right (Appeal against examiner's decision of refusal) - first action period - 2009 2010 2011
Patents and Utility Models 25 24 20
Designs 8 6 7
Trademarks 9 11 9
(Note)The period of first action refers to the period from the date of appeal to the date when the first notice of an appeal/trial examination result (mainly an appeal/trial decision or notice of rejection) is sent by the appeal examiner to the applicant.
(unit:month)
Oppositions - examination period - 2009 2010 2011
Trademarks 9 8 8
(unit:month)
Trial After the Grant of Right (Trial for Invalidation / Correction / Cancellation, Hantei) - examination period - 2009 2010 2011
Patents and Utility Models 6 7 6
Designs 7 7 7
Trademarks 7 6 6
Annual Report 2012 Part 5
184
Annual Report 2012 Part 5
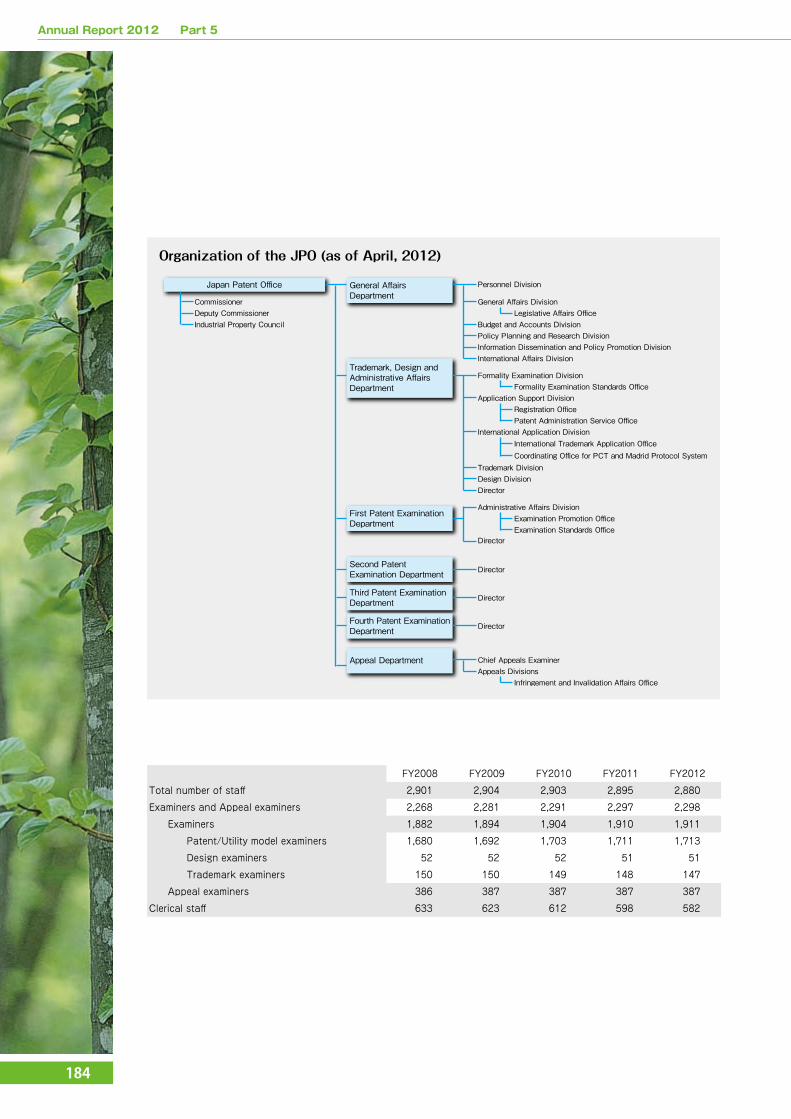
FY2008 FY2009 FY2010 FY2011 FY2012
Total number of staff 2,901 2,904 2,903 2,895 2,880
Examiners and Appeal examiners 2,268 2,281 2,291 2,297 2,298
Examiners 1,882 1,894 1,904 1,910 1,911
Patent/Utility model examiners 1,680 1,692 1,703 1,711 1,713
Design examiners 52 52 52 51 51
Trademark examiners 150 150 149 148 147
Appeal examiners 386 387 387 387 387
Clerical staff 633 623 612 598 582
Organization of the JPO (as of April, 2012)
Coordinating Office for PCT and Madrid Protocol System
Examination Standards Office
First Patent ExaminationDepartment
Trademark Division
Application Support Division
International Trademark Application OfficeInternational Application Division
Policy Planning and Research Division
Registration Office
Appeal Department
Director
DirectorDesign Division
Second PatentExamination Department
Third Patent ExaminationDepartment
Fourth Patent ExaminationDepartment
Infringement and Invalidation Affairs OfficeAppeals Divisions
Examination Promotion OfficeAdministrative Affairs Division
Director
Chief Appeals Examiner
Director
Director
Patent Administration Service Office
Japan Patent Office
Trademark, Design andAdministrative AffairsDepartment
CommissionerDeputy CommissionerIndustrial Property Council
Personnel Division
General Affairs Division
General AffairsDepartment
Budget and Accounts DivisionLegislative Affairs Office
Formality Examination DivisionFormality Examination Standards Office
Information Dissemination and Policy Promotion DivisionInternational Affairs Division
Recommended