Jenny HEATHCOTE
Chronic Hepatitis C“The Non Responder”!
Jenny Heathcote MD
University of Toronto
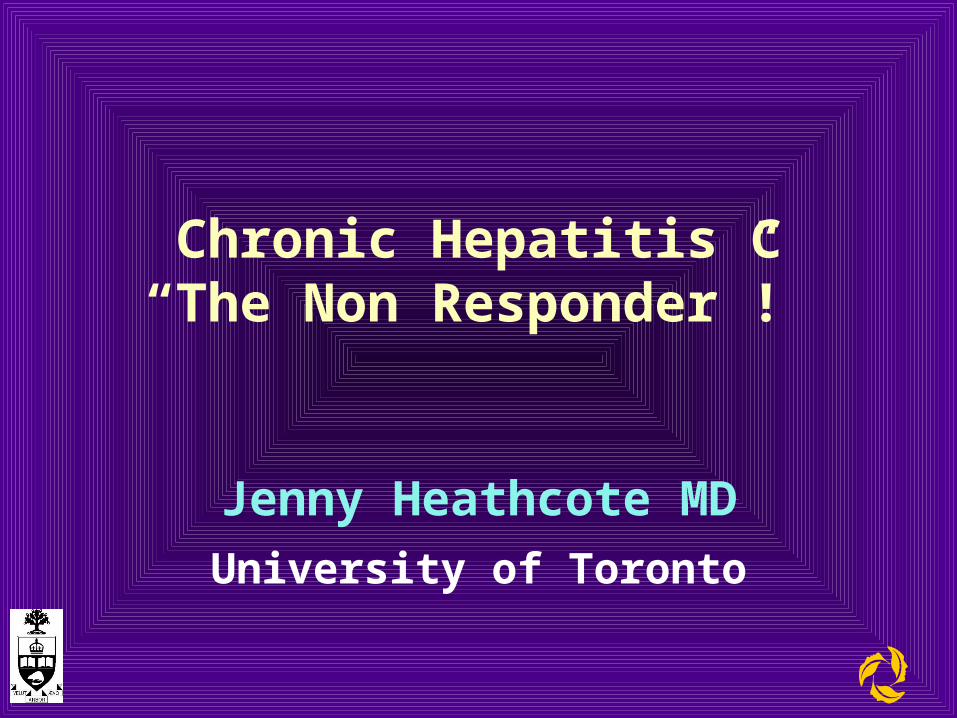
Mr R.H. Canadian First Nation’s Person 54 yrs
July 2000 Routine check up: ALT Tested HCV Ab +ve, (genotype 1a) Viral titre >106c/ml (3x10⁵iu/ml)
Comorbidities Alcohol 60-80g/d 20 yrs Generalized psoriasis 25 yrs BMI 27 (wt 77 kg) No smoking, depression, HIV
Risk Factors: Blood transfusion in 1976 IDU and cocaine snorting 1983-1985
Examination: Normal
Liver biopsy A 1 F 4 + steatohepatitis
Therapy IFN2b 3mu ttw + RBV daily
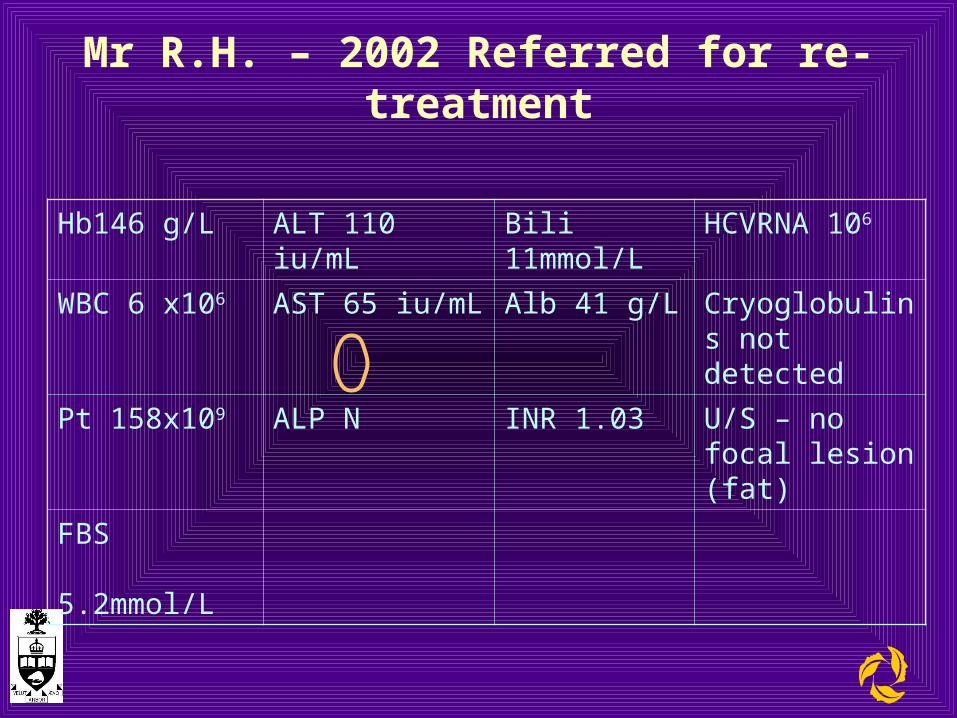
Mr R.H. – 2002 Referred for re-treatment
Hb146 g/L ALT 110 iu/mL Bili 11mmol/L HCVRNA 106
WBC 6 x10⁶ AST 65 iu/mL Alb 41 g/L Cryoglobulins not detected
Pt 158x109 ALP N INR 1.03 U/S – no focal lesion (fat)
FBS 5.2mmol/L
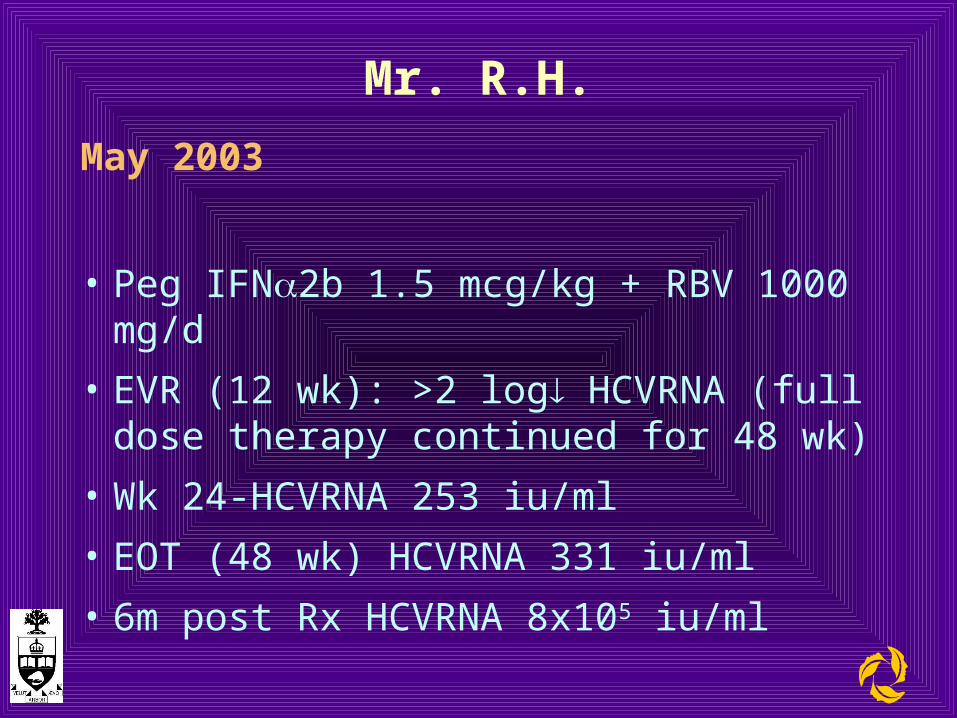
Mr. R.H.
May 2003
• Peg IFN2b 1.5 mcg/kg + RBV 1000 mg/d
• EVR (12 wk): >2 log HCVRNA (full dose therapy continued for 48 wk)
• Wk 24-HCVRNA 253 iu/ml
• EOT (48 wk) HCVRNA 331 iu/ml
• 6m post Rx HCVRNA 8x10⁵ iu/ml
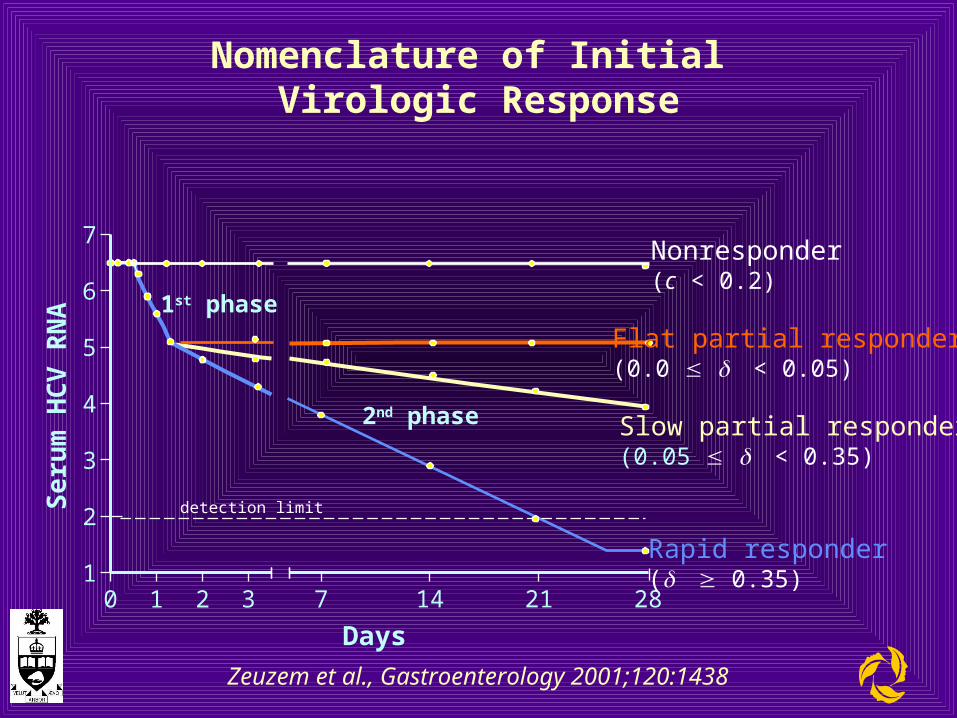
Nomenclature of Initial Virologic Response
0 1 2 31
2
3
4
5
6
7
7 14 21 28
detection limit
Days
Se
rum
HC
V R
NA 1st phase
2nd phase
Flat partial responder(0.0 < 0.05)
Slow partial responder(0.05 < 0.35)
Rapid responder( 0.35)
Nonresponder(c < 0.2)
Zeuzem et al., Gastroenterology 2001;120:1438
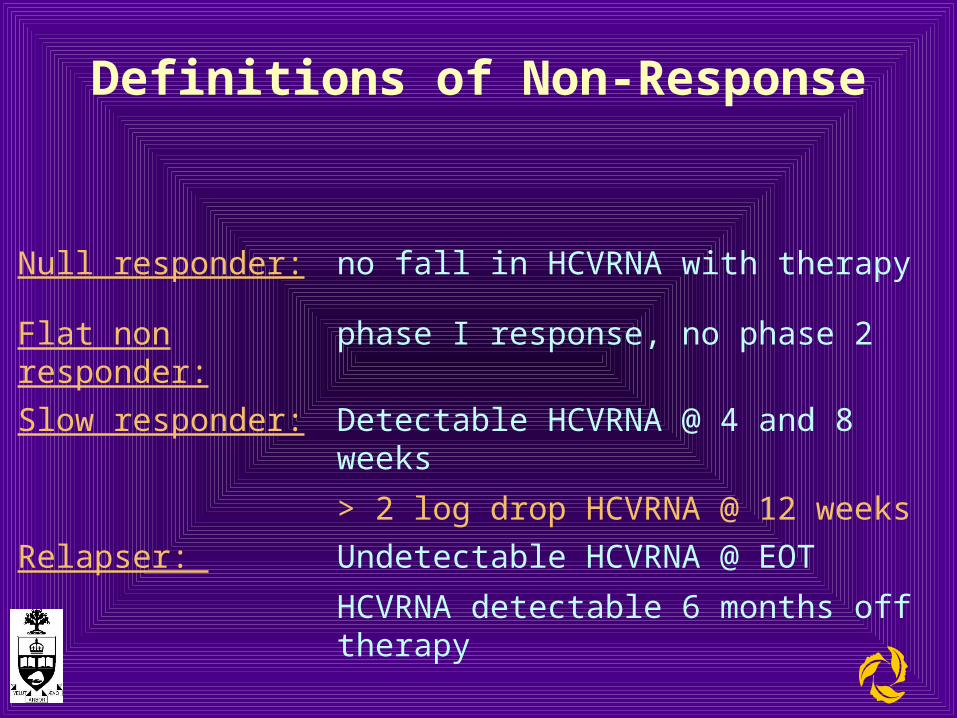
Definitions of Non-Response
Null responder: no fall in HCVRNA with therapy
Flat non responder: phase I response, no phase 2
Slow responder: Detectable HCVRNA @ 4 and 8 weeks
> 2 log drop HCVRNA @ 12 weeks
Relapser: Undetectable HCVRNA @ EOT
HCVRNA detectable 6 months off therapy
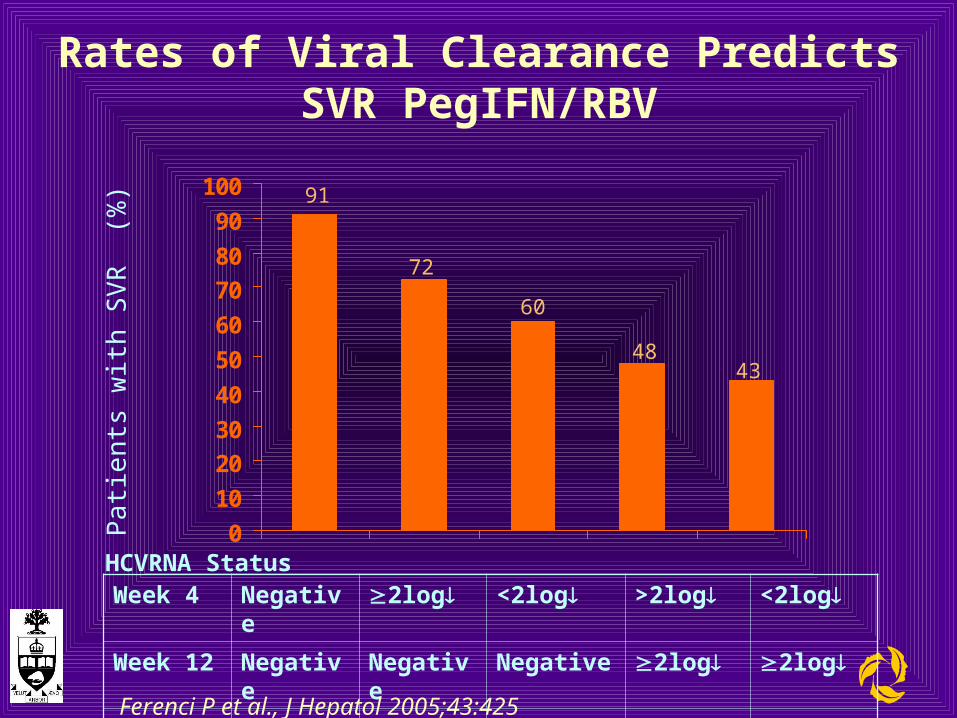
Rates of Viral Clearance Predicts SVR PegIFN/RBV
0
10
20
30
40
50
60
70
80
90
100 91
72
60
4843
Week 4 Negative 2log <2log >2log <2log
Week 12 Negative Negative Negative 2log 2log
Week 24 Negative Negative Negative Negative Negative
HCVRNA Status
Ferenci P et al., J Hepatol 2005;43:425
Pa
tient
s w
ith S
VR
(%
)
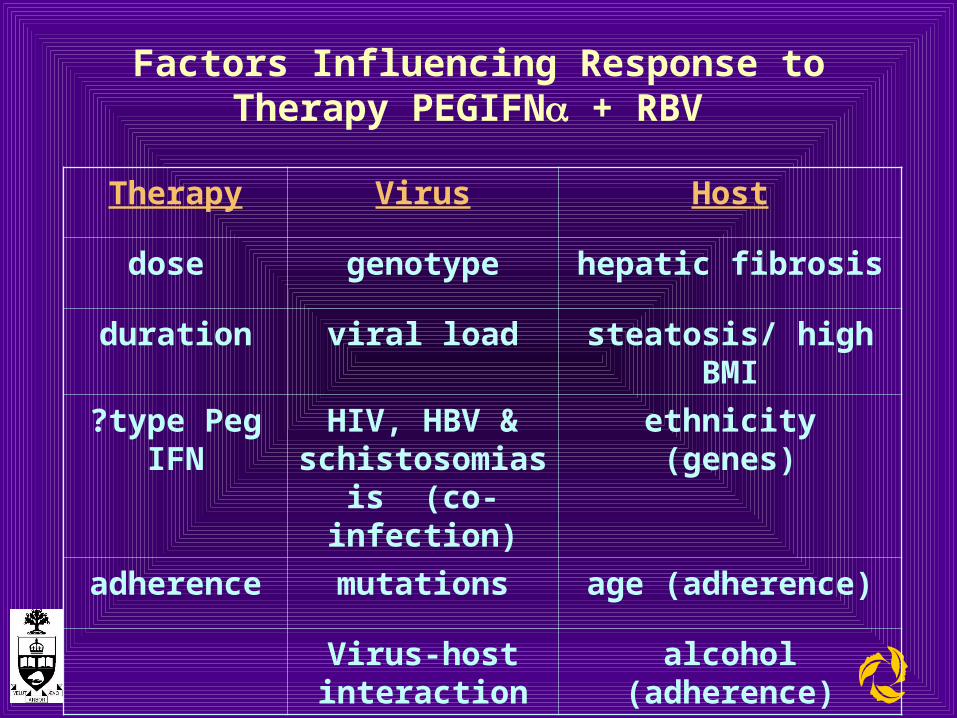
Factors Influencing Response to Therapy PEGIFN + RBV
Therapy Virus Host
dose genotype hepatic fibrosis
duration viral load steatosis/ high BMI
?type Peg IFN
HIV, HBV & schistosomiasis
(co-infection)
ethnicity (genes)
adherence mutations age (adherence)
Virus-host interaction
alcohol (adherence)
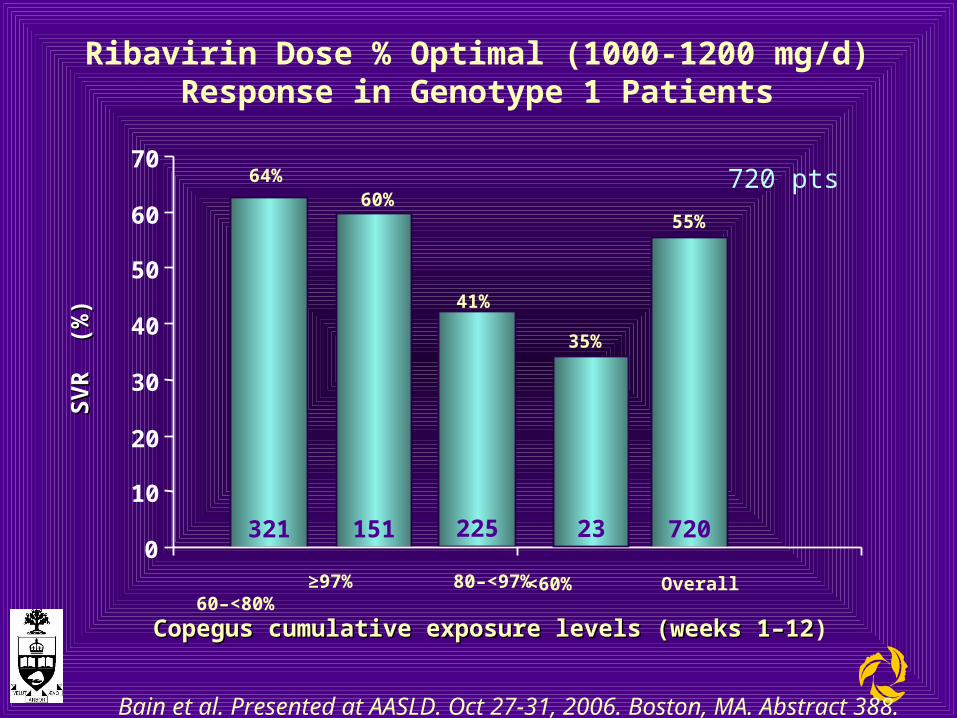
Ribavirin Dose % Optimal (1000-1200 mg/d)Response in Genotype 1 Patients
Copegus cumulative exposure levels (weeks 1–12Copegus cumulative exposure levels (weeks 1–12)
321 151 7202250
10
20
30
40
50
60
70
SV
R
(%)
SV
R
(%)
≥97% 80–<97% 60–<80% <60% Overall
23
64%60%
41%
55%
35%
Bain et al. Presented at AASLD. Oct 27-31, 2006. Boston, MA. Abstract 388.
720 pts
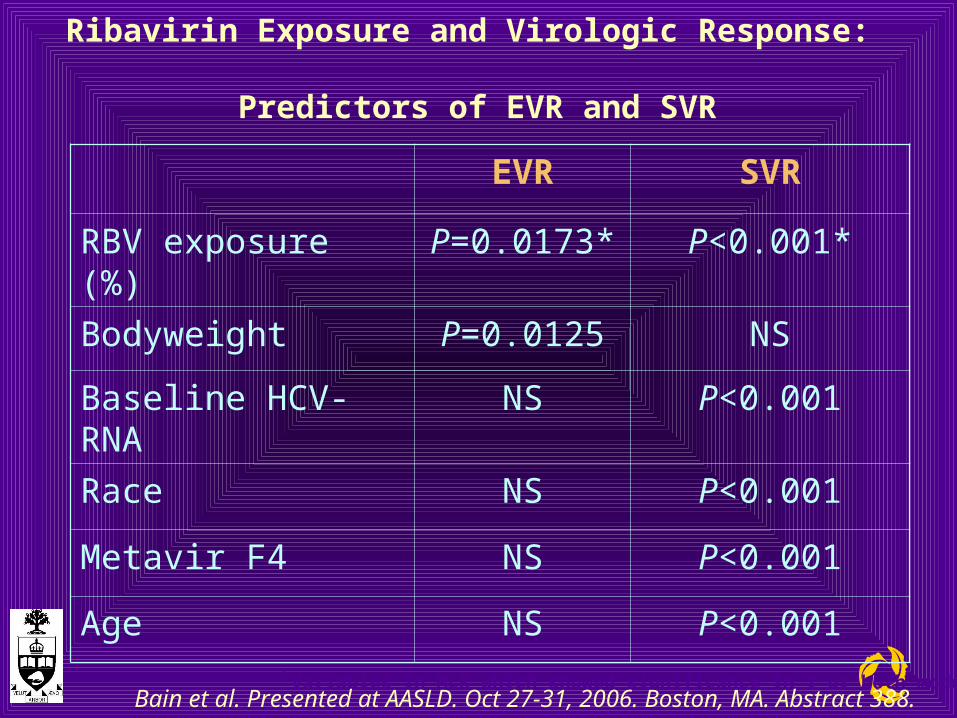
Ribavirin Exposure and Virologic Response: Predictors of EVR and SVR
EVR SVR
RBV exposure (%) P=0.0173* P<0.001*
Bodyweight P=0.0125 NS
Baseline HCV-RNA NS P<0.001
Race NS P<0.001
Metavir F4 NS P<0.001
Age NS P<0.001
*Variables in MLR which showed significance in 1 or both modelsBain et al. Presented at AASLD. Oct 27-31, 2006. Boston, MA. Abstract 388.
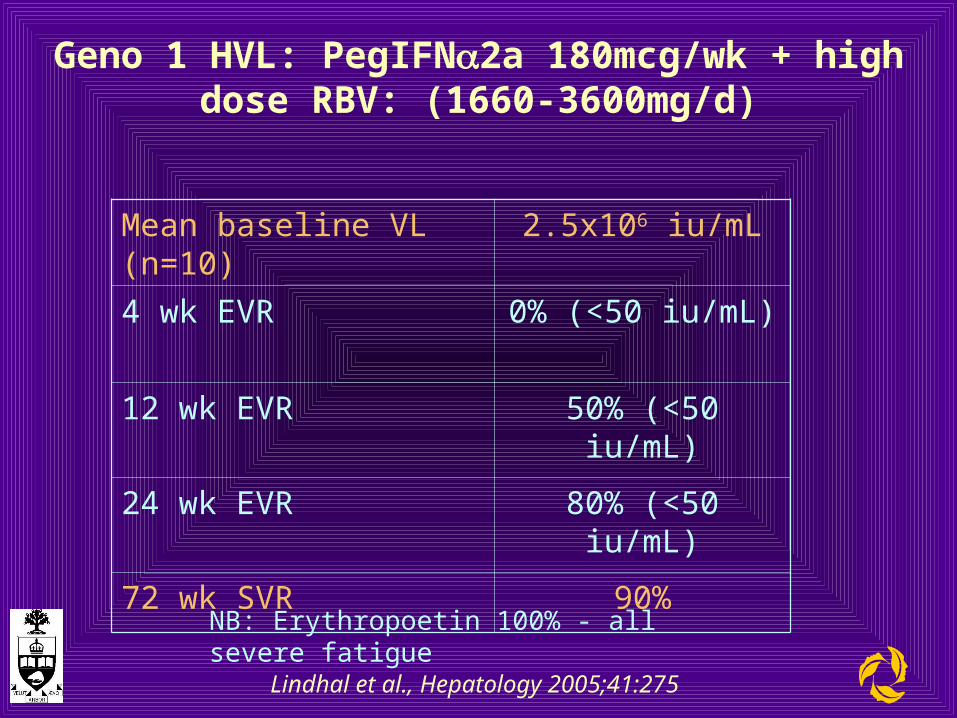
Geno 1 HVL: PegIFN2a 180mcg/wk + high dose RBV: (1660-3600mg/d)
Mean baseline VL (n=10) 2.5x10⁶ iu/mL
4 wk EVR 0% (<50 iu/mL)
12 wk EVR 50% (<50 iu/mL)
24 wk EVR 80% (<50 iu/mL)
72 wk SVR 90%
Lindhal et al., Hepatology 2005;41:275
NB: Erythropoetin 100% - all severe fatigue
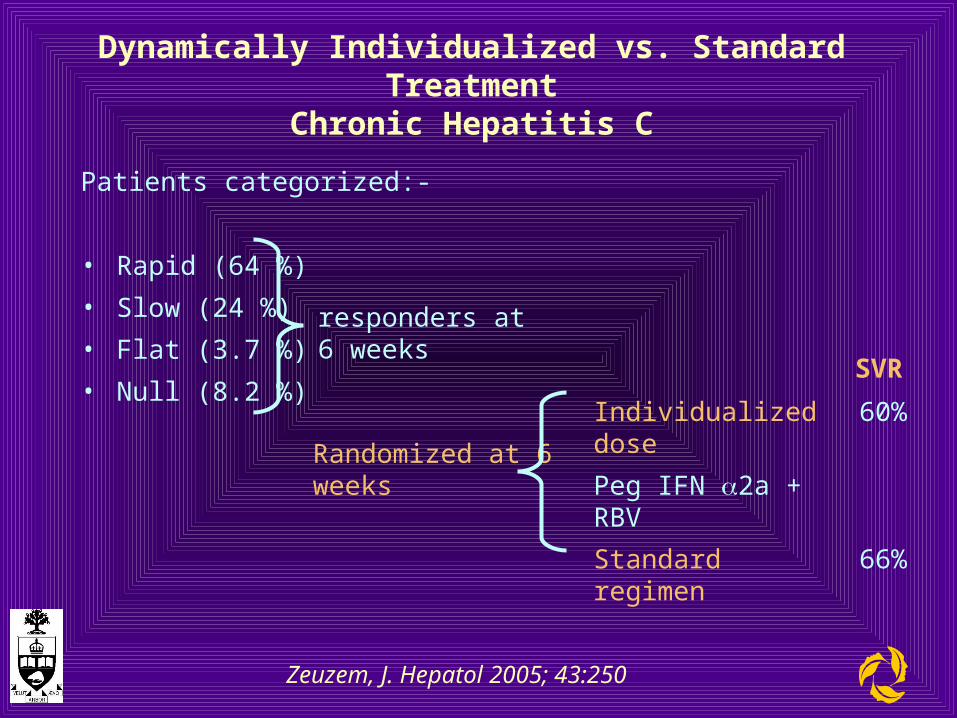
Dynamically Individualized vs. Standard TreatmentChronic Hepatitis C
Patients categorized:-
• Rapid (64 %)
• Slow (24 %)
• Flat (3.7 %)
• Null (8.2 %)
responders at 6 weeks
Zeuzem, J. Hepatol 2005; 43:250
Randomized at 6 weeks
Individualized dose 60%
Peg IFN 2a + RBV
Standard regimen 66%
SVR
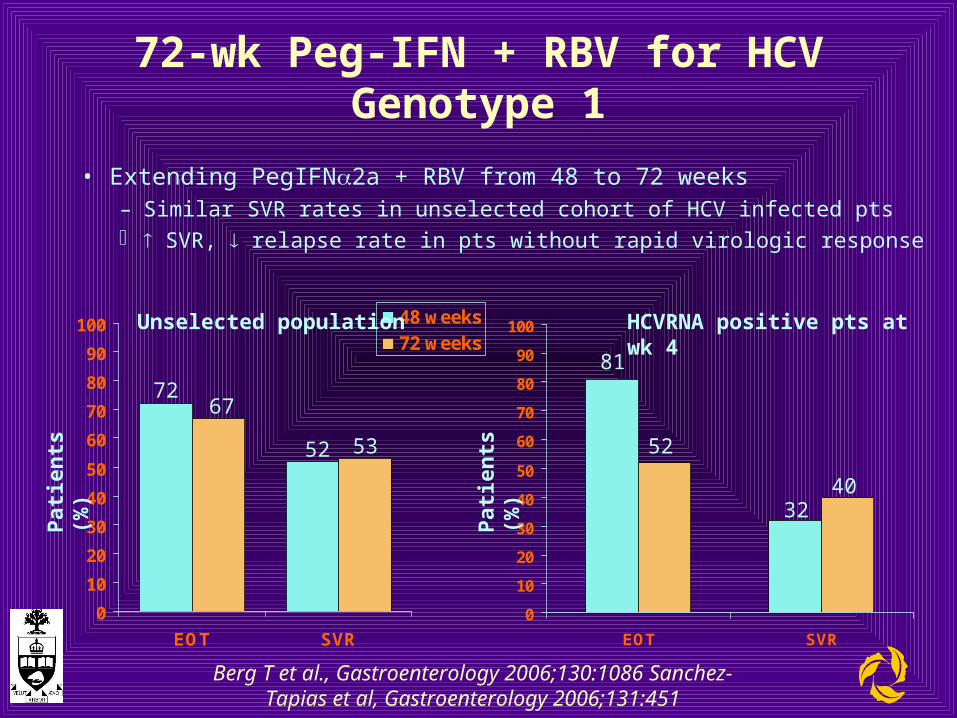
72-wk Peg-IFN + RBV for HCVGenotype 1
• Extending PegIFN2a + RBV from 48 to 72 weeks– Similar SVR rates in unselected cohort of HCV infected pts SVR, relapse rate in pts without rapid virologic response
Berg T et al., Gastroenterology 2006;130:1086 Sanchez-Tapias et al, Gastroenterology 2006;131:451
0
10
20
30
40
50
60
70
80
90
100
EOT SVR
48 weeks72 weeks
7267
52 53
0
10
20
30
40
50
60
70
80
90
100
EOT SVR
81
52
3240
Pat
ien
ts (
%)
Pat
ien
ts (
%)
Unselected population HCVRNA positive pts at wk 4
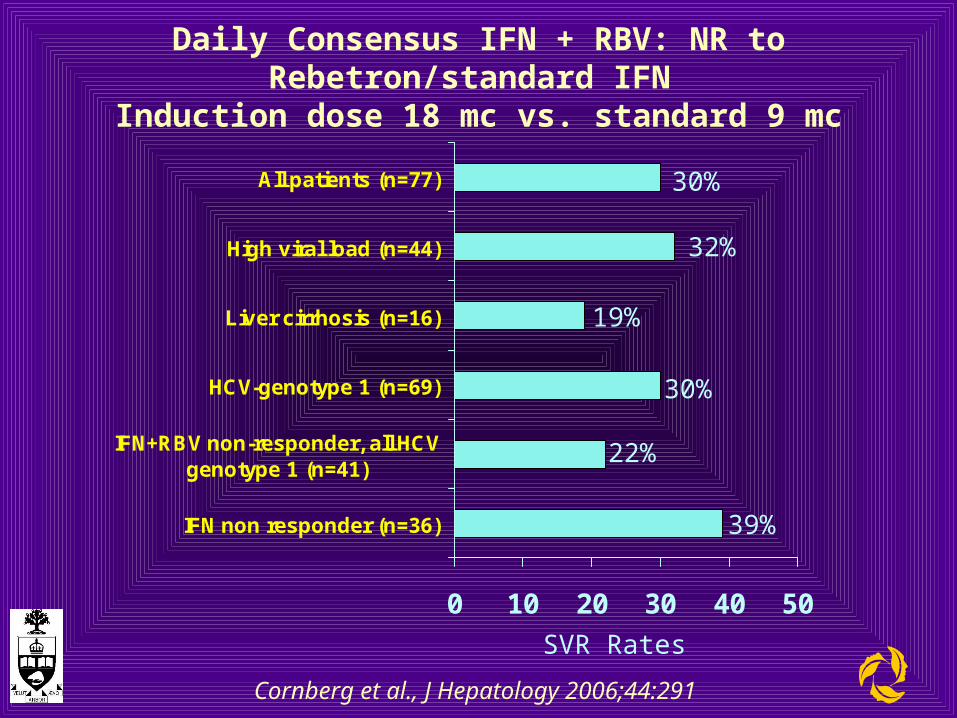
Daily Consensus IFN + RBV: NR to Rebetron/standard IFN Induction dose 18 mc vs. standard 9 mc
0 10 20 30 40 50
IFN non responder (n=36)
IFN+RBV non-responder, all HCVgenotype 1 (n=41)
HCV-genotype 1 (n=69)
Liver cirrhosis (n=16)
High viral load (n=44)
All patients (n=77) 30%
32%
19%
30%
22%
39%
Cornberg et al., J Hepatology 2006;44:291
SVR Rates
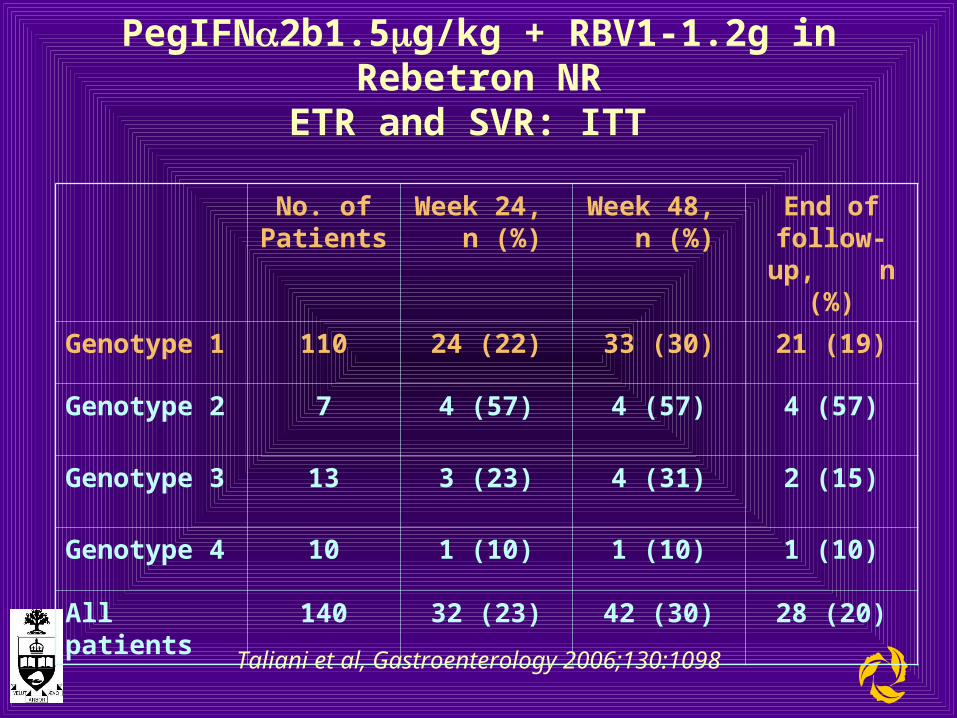
PegIFN2b1.5g/kg + RBV1-1.2g in Rebetron NRETR and SVR: ITT
No. of Patients
Week 24, n (%)
Week 48, n (%)
End of follow-up,
n (%)
Genotype 1 110 24 (22) 33 (30) 21 (19)
Genotype 2 7 4 (57) 4 (57) 4 (57)
Genotype 3 13 3 (23) 4 (31) 2 (15)
Genotype 4 10 1 (10) 1 (10) 1 (10)
All patients 140 32 (23) 42 (30) 28 (20)
Taliani et al, Gastroenterology 2006;130:1098
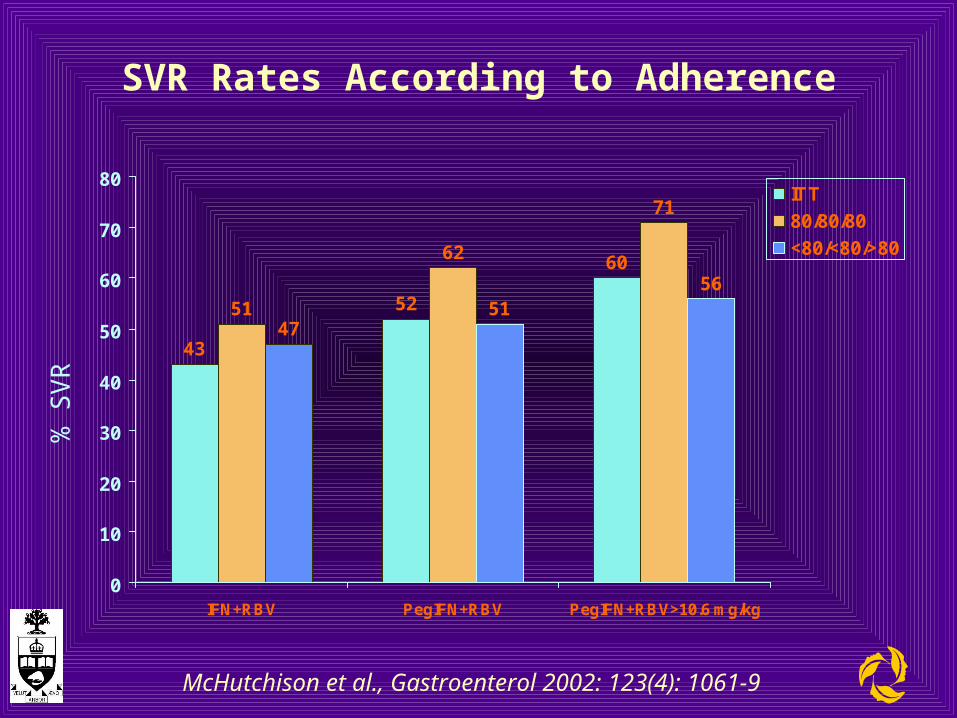
SVR Rates According to Adherence
McHutchison et al., Gastroenterol 2002: 123(4): 1061-9
43
52
60
51
62
71
4751
56
0
10
20
30
40
50
60
70
80
IFN+RBV PegIFN+RBV PegIFN+RBV>10.6 mg/kg
ITT
80/80/80
<80/<80/>80
% S
VR

Proportion of Patients Dispensed >12, 24 or 48 PegIntron Injections:
BIC Enrollees vs. Controls (matched groups)
72%
52%
22%
64%
41%
13%
0%
20%
40%
60%
80%
100%
12+ 24+ 48+
Number of Peg-Intron Injections Dispensed
BIC Control
n=780 n=638 n=333n=780 n=638 n=333
Per
cen
t o
f p
atie
nts
P= 0.0005
P<0.001
P=0.0020
72%
52%
22%
64%
41%
13%
0%
20%
40%
60%
80%
100%
12+ 24+ 48+
Number of Peg-Intron Injections Dispensed
BIC Control
n=780 n=638 n=333n=780 n=638 n=333
Per
cen
t o
f p
atie
nts
P= 0.0005
P<0.001
P=0.0020
Hussein et al, Schering-Plough data presented at ISPOR, Philadelphia, PA, USA, May 20-24, 2006
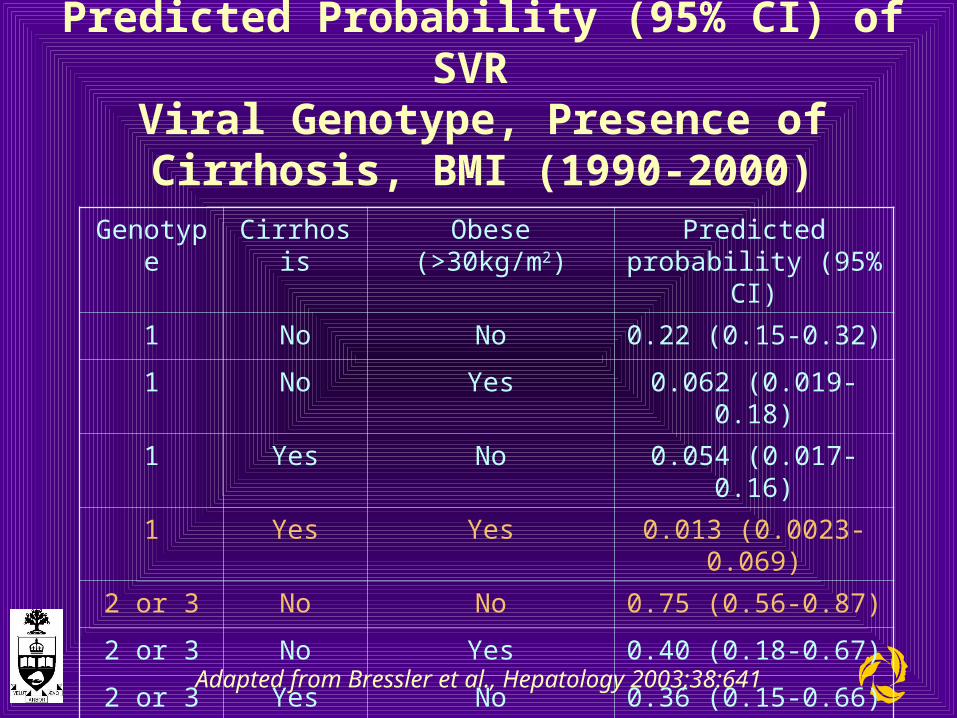
Predicted Probability (95% CI) of SVR Viral Genotype, Presence of Cirrhosis, BMI
(1990-2000)
Adapted from Bressler et al., Hepatology 2003;38:641
Genotype Cirrhosis Obese (>30kg/m2) Predicted probability (95% CI)
1 No No 0.22 (0.15-0.32)
1 No Yes 0.062 (0.019-0.18)
1 Yes No 0.054 (0.017-0.16)
1 Yes Yes 0.013 (0.0023-0.069)
2 or 3 No No 0.75 (0.56-0.87)
2 or 3 No Yes 0.40 (0.18-0.67)
2 or 3 Yes No 0.36 (0.15-0.66)
2 or 3 Yes Yes 0.12 (0.029-0.37)

Viral Factors that Influence Response to Therapy
• Genotype 2>3>4>1
• Baseline viral load (HVL v LVL)
• Viral load decline (RVR v SVR)
• Co-infection (HIV/HBV)
• Quasispecies development
• Virus interferes with function of crucial genes in several antiviral pathways
– ? Host dependent
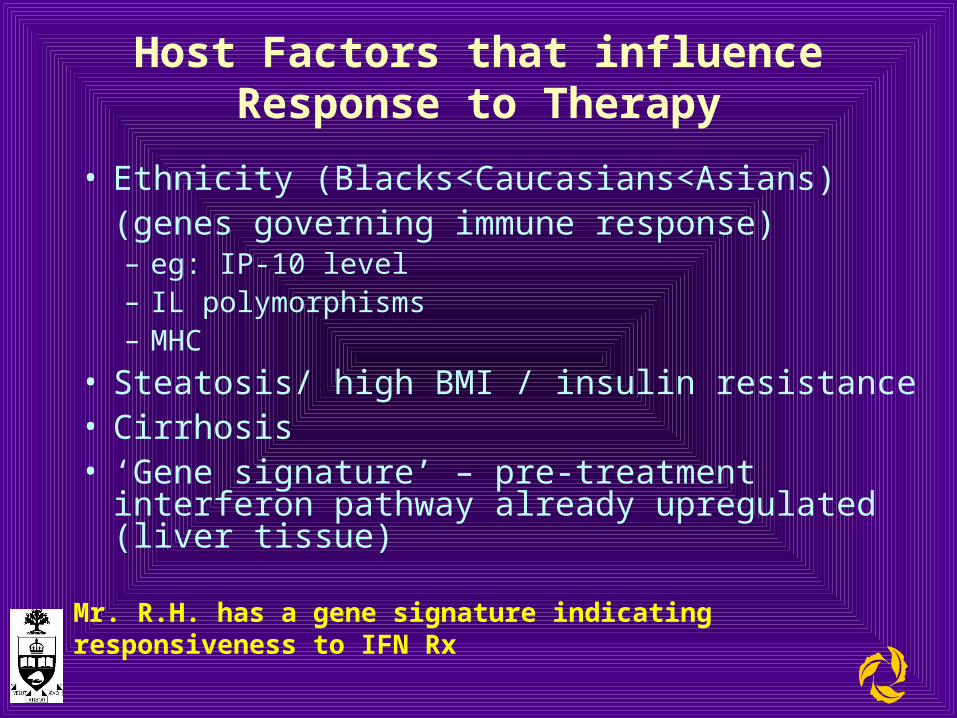
Host Factors that influence Response to Therapy
• Ethnicity (Blacks<Caucasians<Asians)(genes governing immune response) – eg: IP-10 level– IL polymorphisms– MHC
• Steatosis/ high BMI / insulin resistance• Cirrhosis• ‘Gene signature’ – pre-treatment interferon
pathway already upregulated (liver tissue)
Mr. R.H. has a gene signature indicating responsiveness to IFN Rx
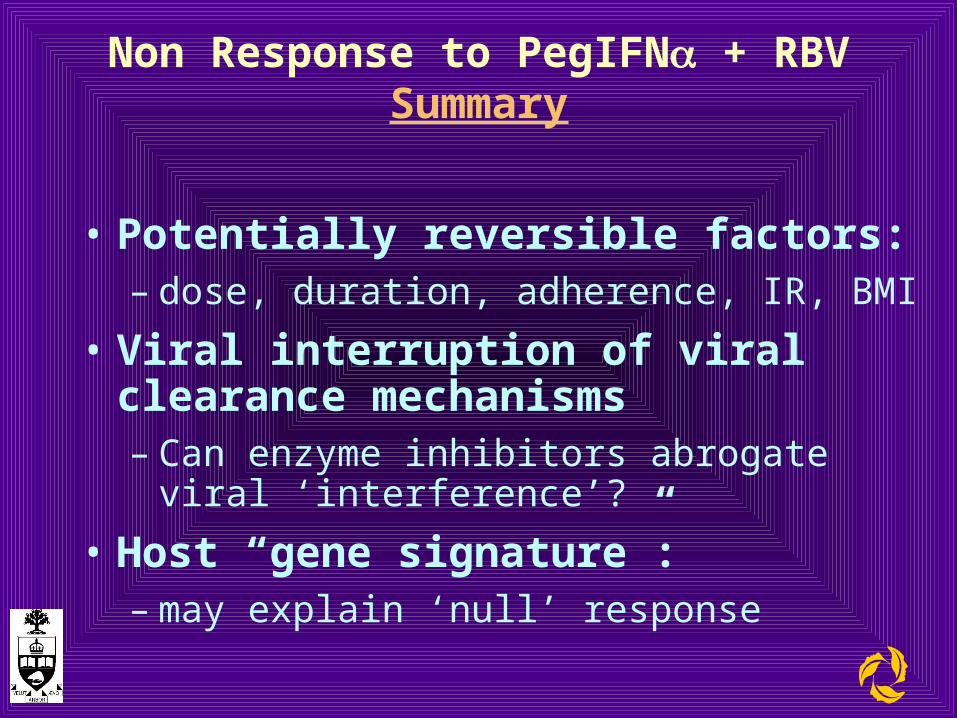
Non Response to PegIFN + RBVSummary
• Potentially reversible factors:– dose, duration, adherence, IR, BMI
• Viral interruption of viral clearance mechanisms– Can enzyme inhibitors abrogate viral
‘interference’?
• Host “gene signature”: – may explain ‘null’ response

QUESTIONS
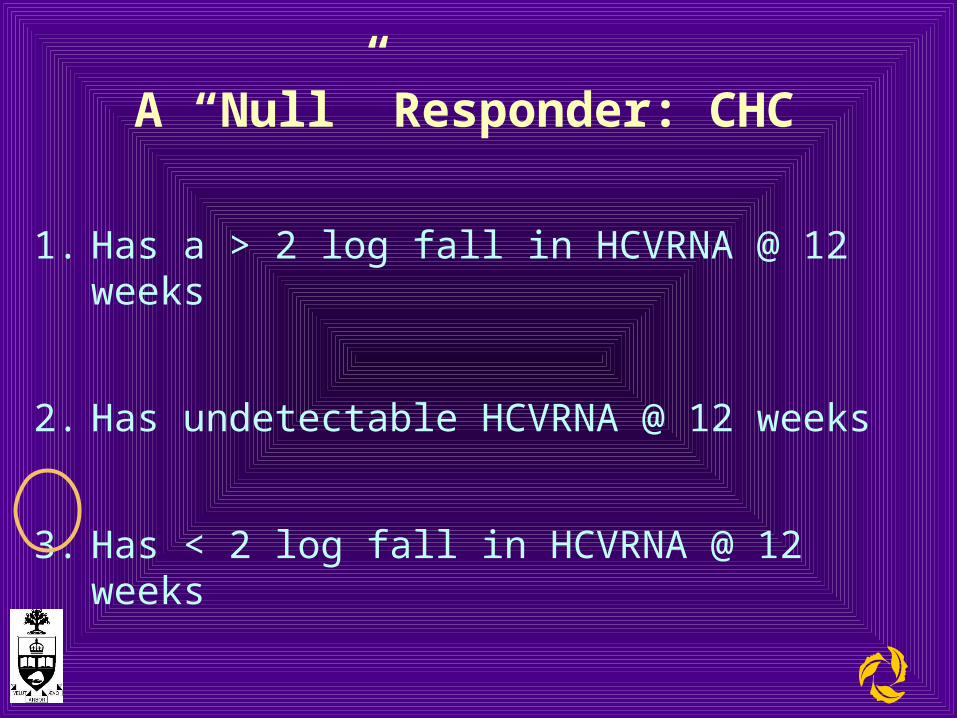
A “Null” Responder: CHC
1. Has a > 2 log fall in HCVRNA @ 12 weeks
2. Has undetectable HCVRNA @ 12 weeks
3. Has < 2 log fall in HCVRNA @ 12 weeks
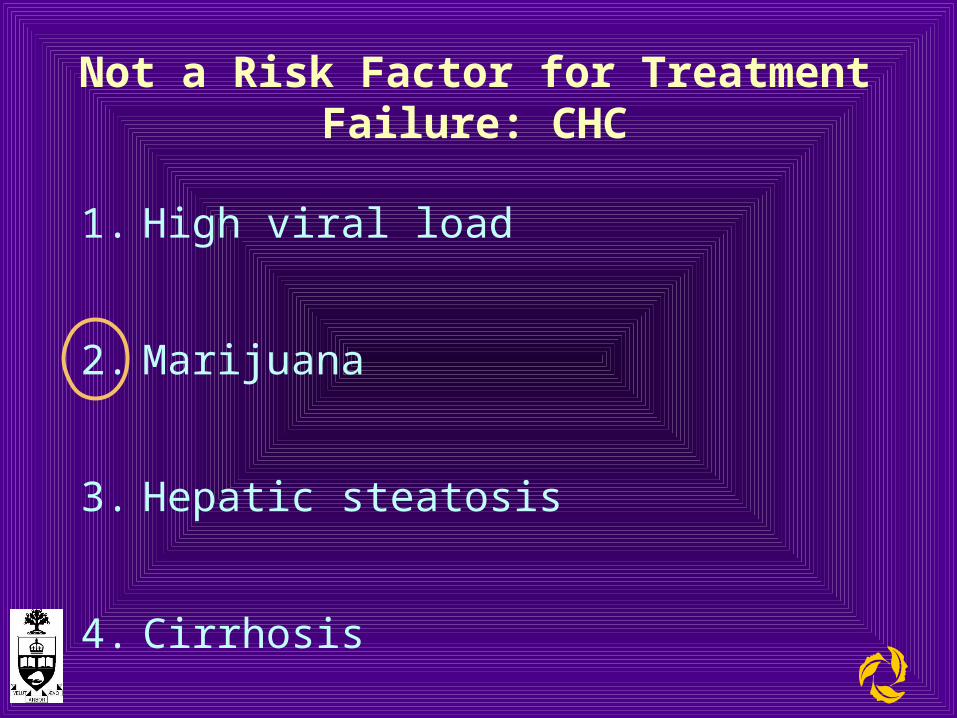
Not a Risk Factor for Treatment Failure: CHC
1. High viral load
2. Marijuana
3. Hepatic steatosis
4. Cirrhosis
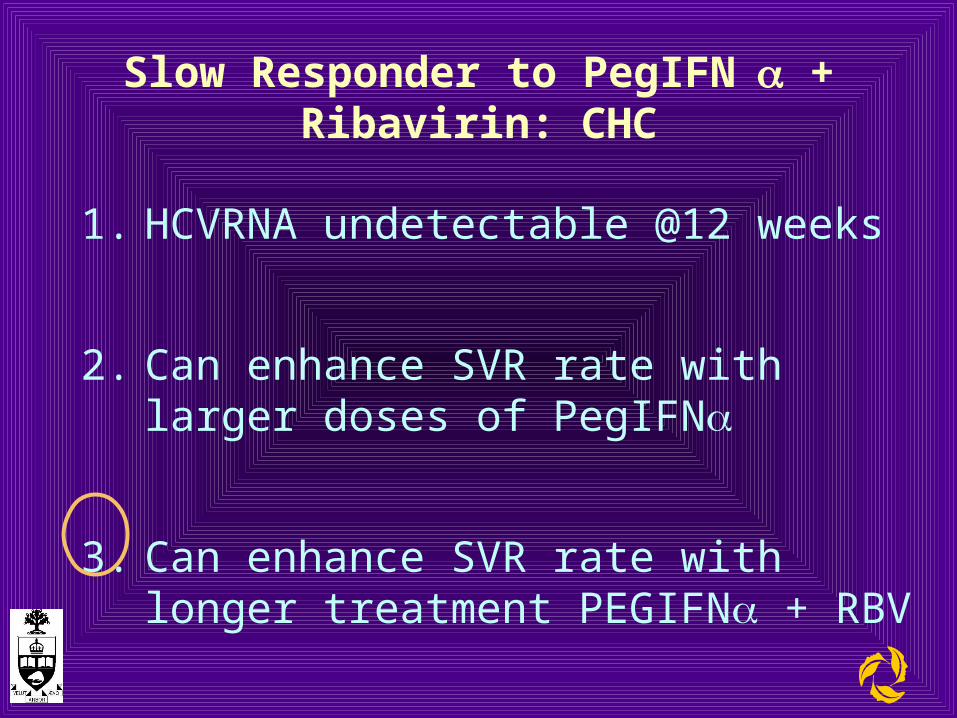
Slow Responder to PegIFN + Ribavirin: CHC
1. HCVRNA undetectable @12 weeks
2. Can enhance SVR rate with larger doses of PegIFN
3. Can enhance SVR rate with longer treatment PEGIFN + RBV
Retreatment of Standard IFN+RBV failures (Genotype 1) with PEGIFN + RBV leads to
SVR rate of:-
1. 50%
2. 30%
3. 20%
4. 0%
Recommended