KUISIONER
Kepada,
Siswa/i Lembaga Bimbingan Belajar SSC (Sony Sugema Collage)
Di Tempat
Dengan hormat,
Saya Eka Wijayani Mahasiswi Jurusan Manajemen Universitas Islam Negeri
(UIN) Malang, saat ini tengah mengadakan penelitian dengan judul “Pengaruh Bauran
Promosi Terhadap Keputusan Memilih Bimbingan Belajar” dalam rangka menyusun
tugas akhir berupa skripsi.
Dengan ini mohon siswa/i Lembaga Bimbingan Belajar SSC (Sony Sugema
Collage) meluangkan waktu untuk mengisi kuesioner ini. Mohon diisi dengan
sebenar-benarnya dan sejujur-jujurnya tanpa dipengaruhi orang lain. Jawaban ini
bersifat rahasia, apapun jawaban yang diberikan tidak ada yang salah karena hanya
untuk kepentingan penelitian dan pengembangan ilmu pengetahuan.
Atas kesediaan dan kerjasama yang baik, peneliti mengucapkan terima kasih.
Hormat Saya,
Eka Wijayani
No. Kuesioner :
IDENTITAS RESPONDEN
Nama : ___________________(Jika tidak keberatan)
Usia : ___________________ (Tahun)
Jenis Kelamin : ___________________ Laki-laki/ perempuan
Pendidikan : SD SMP SMA
Lama mengikuti bimbel : Kurang dari 1 tahun
1 sampai 2 tahun
2 sampai 3 tahun
Beri tanda ceklis (√) atau silang (x) yang sesuai dengan pendapat anda pada tempat
yang telah disediakan
SS : sangat setuju
S : setuju
KS : kurang setuju
TS : tidak setuju
STS : sangat tidak setuju
Variabel (X) bauran promosi
No. Uraian Pernyataan SS S KS TS STS
Periklanan/ advertising (X1)
1. Iklan SSC yang ada di surat kabar menarik perhatian
2. Iklan SSC yang ada di brosur menarik perhatian
3. Iklan SSC yang ada di radio menarik perhatian
4. Iklan SSC yang ada di spanduk menarik perhatian
No. Uraian Pernyataan SS S KS TS STS
Penjualan Personal/ personal selling (X2)
1. Pelayanan yang diberikan oleh staf SSC sangat
memuaskan
2. Staf pengajar SSC memiliki kecakapan berkomunikasi
yang sangat baik
3. SSC memiliki staf pengajar yang ramah
No. Uraian Pernyataan SS S KS TS STS
Promosi Penjualan/ sales promotion (X3)
1. SSC selalu memberikan diskon/ potongan harga paket
bimbingan belajar
2. SSC sering memberikan hadiah (bolpoin, gantungan
kunci, kalender, dll)
3. SSC memberikan kesempatan paket bimbingan belajar
gratis kepada siswa/i berprestasi
No. Uraian Pernyataan SS S KS TS STS
Hubungan Masyarakat/ public relation (X4)
1. SSC sering mengadakan event (acara pendidikan)
2. SSC sering menjadi sponsor di beberapa acara dalam
bidang pendidikan
3. SSC aktif dalam kegiatan social (memberikan
santunan kepada yang membutuhkan)
No. Uraian Pernyataan SS S KS TS ST
S
Pemasaran Langsung/ direct marketing (X5)
1. SSC mempunyai website yang menjelaskan program-
program keunggulan lembaganya
2. SSC memberikan pelayanan melalui media online (e-
mail)
Variabel (Y) Keputusan Memilih
No. Uraian Pernyataan SS S KS TS STS
Keputusan Memilih Bimbingan Belajar (Y)
1.
Secara keseluruhan informasi/ iklan melalui beberapa
media yang dilakukan oleh SSC menjadi salah satu
alasan saya memilih bimbingan belajar SSC
2.
Secara keseluruhan pelayanan yang diberikan oleh
SSC menjadi salah satu alasan saya memilih
bimbingan belajar SSC
3.
Secara keseluruhan promo yang diberikan oleh SSC
menjadi salah satu alasan saya memilih bimbingan
belajar SSC
4.
Secara keseluruhan citra bimbingan belajar SSC
menjadi salah satu asalan saya memilih bimbingan
belajar SSC
5.
Secara keseluruhan komunikasi/ informasi melalui
website dan email menjadi salah satu alasan saya
memilih bimbingan belajar SSC
TERIMA KASIH
Tanda Tangan Responden

No. X1.1 X1.2 X1.3 X1.4 X1 X2.1 X2.2 X2.3 X2 X3.1 X3.2 X3.3 X3 X4.1 X4.2 X4.3 X4 X5.1 X5.2 X5 Y1 Y2 Y3 Y4 Y5 Y
1 4 5 4 4 17 5 5 5 15 5 5 5 15 4 5 5 14 4 4 8 5 5 5 5 5 25
2 4 3 4 3 14 5 5 5 15 4 4 4 12 5 5 5 15 3 4 7 4 3 4 5 4 20
3 3 5 3 4 15 4 5 5 14 5 4 5 14 5 5 5 15 5 4 9 5 4 5 5 4 23
4 3 4 4 3 14 4 5 4 13 5 4 4 13 5 5 5 15 4 4 8 4 4 4 4 4 20
5 3 4 3 4 14 5 5 5 15 5 3 5 13 5 4 5 14 4 3 7 4 5 4 5 4 22
6 5 4 3 5 17 5 5 5 15 5 4 4 13 5 4 5 14 4 4 8 5 5 4 5 4 23
7 4 4 3 3 14 4 4 5 13 5 4 5 14 4 4 4 12 5 4 9 4 5 4 5 4 22
8 5 5 4 4 18 4 4 5 13 5 4 5 14 5 5 5 15 4 3 7 5 4 4 5 3 21
9 5 5 4 4 18 4 5 4 13 5 4 4 13 4 4 4 12 4 3 7 4 4 4 5 3 20
10 3 4 5 3 15 4 4 5 13 4 4 5 13 5 5 5 15 3 4 7 4 4 4 4 4 20
11 3 4 3 4 14 5 5 4 14 4 4 4 12 4 5 5 14 3 4 7 4 4 3 4 3 18
12 4 4 3 5 16 5 5 5 15 5 4 5 14 4 4 4 12 4 4 8 3 3 4 5 5 20
13 4 5 4 5 18 4 4 5 13 5 5 5 15 2 2 5 9 5 4 9 3 4 4 4 4 19
14 5 5 4 4 18 5 5 5 15 4 5 4 13 4 4 5 13 4 4 8 4 4 4 5 5 22
15 3 4 3 4 14 4 4 4 12 3 4 3 10 4 4 4 12 4 5 9 4 4 4 4 4 20
16 4 3 4 3 14 4 4 4 12 3 4 3 10 4 4 4 12 4 5 9 4 4 4 4 4 20
17 4 3 4 3 14 4 4 4 12 4 4 4 12 4 4 4 12 4 4 8 4 4 4 4 4 20
18 4 4 3 4 15 5 4 4 13 4 3 4 11 5 4 4 13 4 4 8 4 4 5 4 4 21
19 3 4 3 4 14 3 4 3 10 2 4 3 9 4 4 4 12 4 4 8 3 4 3 3 4 17
20 5 5 4 4 18 4 5 5 14 4 3 4 11 4 4 4 12 4 4 8 4 4 4 4 4 20
21 3 3 4 4 14 5 4 4 13 3 4 3 10 4 4 4 12 4 4 8 5 4 4 4 4 21
22 5 5 4 4 18 5 4 5 14 5 3 5 13 5 4 5 14 5 5 10 5 5 5 5 5 25
23 3 4 3 4 14 5 4 5 14 5 3 5 13 5 4 4 13 5 4 9 3 4 5 5 4 21
24 5 5 4 4 18 5 4 5 14 5 3 5 13 5 5 5 15 5 5 10 5 5 4 5 5 24
25 4 3 4 4 15 5 4 5 14 5 5 5 15 5 3 5 13 5 5 10 5 4 5 5 4 23

26 4 5 4 5 18 5 5 4 14 5 4 5 14 5 5 4 14 5 5 10 5 5 5 4 5 24
27 4 5 4 4 17 5 4 5 14 5 4 5 14 5 4 5 14 5 5 10 5 5 4 5 5 24
28 3 4 3 4 14 5 5 4 14 5 3 5 13 5 5 4 14 5 5 10 5 4 5 5 5 24
29 4 4 4 4 16 4 4 3 11 4 4 4 12 4 3 3 10 5 4 9 4 4 4 4 3 19
30 5 5 4 4 18 5 5 4 14 5 4 3 12 5 5 5 15 5 5 10 5 5 4 5 5 24
31 3 4 3 4 14 4 4 5 13 4 5 5 14 5 5 5 15 5 4 9 4 4 3 4 4 19
32 3 4 3 4 14 5 5 5 15 5 5 4 14 4 4 5 13 4 4 8 3 4 4 4 3 18
33 5 5 4 4 18 4 4 4 12 5 5 4 14 2 2 4 8 5 4 9 3 4 4 4 3 18
34 5 4 4 4 17 4 4 4 12 5 4 5 14 4 4 4 12 4 4 8 4 4 4 4 4 20
35 4 4 4 4 16 4 4 4 12 4 4 4 12 4 4 4 12 4 4 8 4 4 4 4 5 21
36 5 5 4 4 18 5 5 5 15 5 2 5 12 4 5 5 14 5 4 9 4 5 4 5 5 23
37 5 4 4 5 18 4 4 4 12 5 4 4 13 2 2 4 8 5 4 9 3 4 4 4 3 18
38 4 4 3 3 14 5 5 5 15 5 4 5 14 5 5 5 15 3 4 7 5 5 3 3 3 19
39 2 3 2 3 10 3 3 4 10 4 2 4 10 4 4 5 13 4 4 8 2 4 2 3 1 12
40 5 4 5 4 18 5 5 4 14 5 4 5 14 5 5 4 14 4 4 8 5 5 5 5 4 24
41 5 5 4 4 18 5 5 5 15 5 4 5 14 5 5 4 14 5 4 9 5 5 4 4 4 22
42 4 3 3 4 14 4 4 4 12 4 4 4 12 4 4 4 12 4 4 8 5 4 5 3 3 20
43 5 4 4 5 18 5 5 5 15 5 4 5 14 5 5 5 15 4 4 8 5 5 5 5 3 23
44 3 3 2 4 12 4 4 4 12 5 4 4 13 2 2 4 8 5 4 9 3 4 4 4 3 18
45 4 4 3 4 15 5 5 5 15 4 4 4 12 5 5 5 15 4 5 9 4 4 4 4 3 19
46 5 4 4 5 18 4 5 5 14 4 4 5 13 4 3 4 11 3 3 6 3 4 3 3 3 16
47 4 3 3 3 13 5 5 5 15 5 5 5 15 5 5 5 15 5 4 9 5 5 5 4 5 24
48 3 4 4 4 15 5 5 5 15 4 5 5 14 5 5 4 14 4 5 9 5 5 4 4 4 22
49 4 4 3 5 16 5 5 5 15 5 4 4 13 4 4 5 13 5 4 9 5 5 5 4 4 23
50 5 4 4 5 18 4 4 4 12 4 4 4 12 4 4 4 12 4 4 8 4 4 4 4 4 20
51 3 4 4 3 14 4 4 4 12 4 3 3 10 3 4 4 11 4 4 8 3 4 3 4 3 17
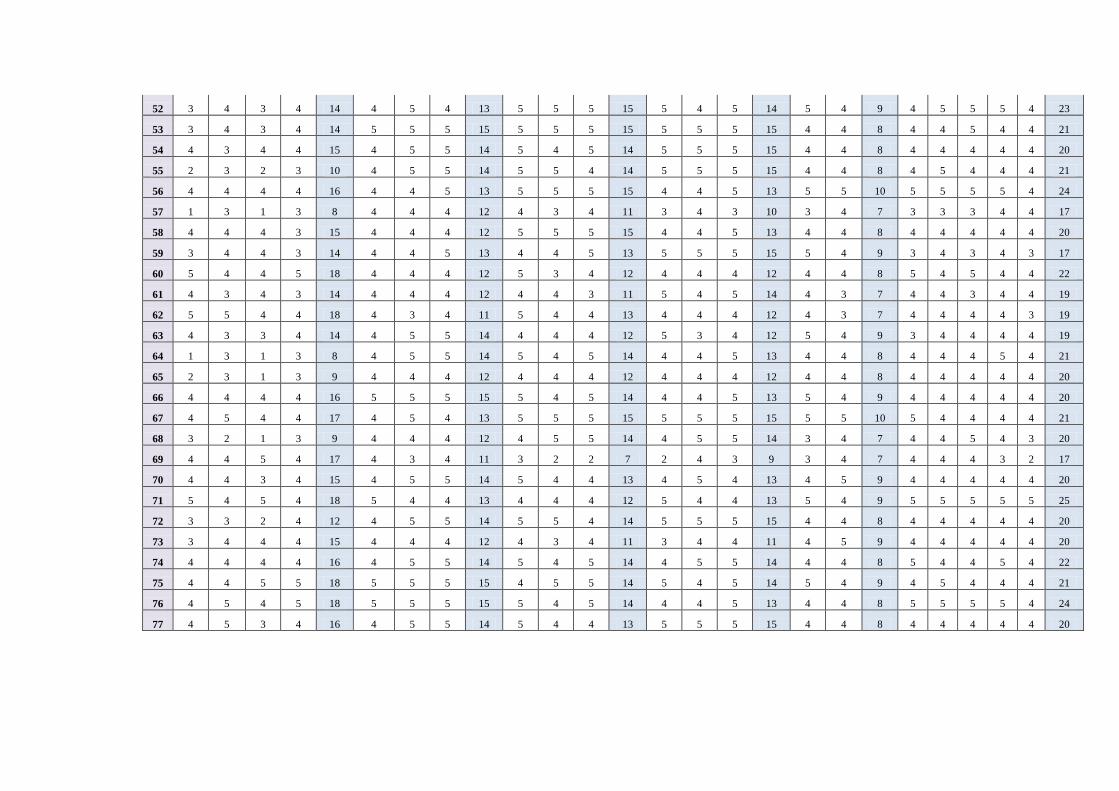
52 3 4 3 4 14 4 5 4 13 5 5 5 15 5 4 5 14 5 4 9 4 5 5 5 4 23
53 3 4 3 4 14 5 5 5 15 5 5 5 15 5 5 5 15 4 4 8 4 4 5 4 4 21
54 4 3 4 4 15 4 5 5 14 5 4 5 14 5 5 5 15 4 4 8 4 4 4 4 4 20
55 2 3 2 3 10 4 5 5 14 5 5 4 14 5 5 5 15 4 4 8 4 5 4 4 4 21
56 4 4 4 4 16 4 4 5 13 5 5 5 15 4 4 5 13 5 5 10 5 5 5 5 4 24
57 1 3 1 3 8 4 4 4 12 4 3 4 11 3 4 3 10 3 4 7 3 3 3 4 4 17
58 4 4 4 3 15 4 4 4 12 5 5 5 15 4 4 5 13 4 4 8 4 4 4 4 4 20
59 3 4 4 3 14 4 4 5 13 4 4 5 13 5 5 5 15 5 4 9 3 4 3 4 3 17
60 5 4 4 5 18 4 4 4 12 5 3 4 12 4 4 4 12 4 4 8 5 4 5 4 4 22
61 4 3 4 3 14 4 4 4 12 4 4 3 11 5 4 5 14 4 3 7 4 4 3 4 4 19
62 5 5 4 4 18 4 3 4 11 5 4 4 13 4 4 4 12 4 3 7 4 4 4 4 3 19
63 4 3 3 4 14 4 5 5 14 4 4 4 12 5 3 4 12 5 4 9 3 4 4 4 4 19
64 1 3 1 3 8 4 5 5 14 5 4 5 14 4 4 5 13 4 4 8 4 4 4 5 4 21
65 2 3 1 3 9 4 4 4 12 4 4 4 12 4 4 4 12 4 4 8 4 4 4 4 4 20
66 4 4 4 4 16 5 5 5 15 5 4 5 14 4 4 5 13 5 4 9 4 4 4 4 4 20
67 4 5 4 4 17 4 5 4 13 5 5 5 15 5 5 5 15 5 5 10 5 4 4 4 4 21
68 3 2 1 3 9 4 4 4 12 4 5 5 14 4 5 5 14 3 4 7 4 4 5 4 3 20
69 4 4 5 4 17 4 3 4 11 3 2 2 7 2 4 3 9 3 4 7 4 4 4 3 2 17
70 4 4 3 4 15 4 5 5 14 5 4 4 13 4 5 4 13 4 5 9 4 4 4 4 4 20
71 5 4 5 4 18 5 4 4 13 4 4 4 12 5 4 4 13 5 4 9 5 5 5 5 5 25
72 3 3 2 4 12 4 5 5 14 5 5 4 14 5 5 5 15 4 4 8 4 4 4 4 4 20
73 3 4 4 4 15 4 4 4 12 4 3 4 11 3 4 4 11 4 5 9 4 4 4 4 4 20
74 4 4 4 4 16 4 5 5 14 5 4 5 14 4 5 5 14 4 4 8 5 4 4 5 4 22
75 4 4 5 5 18 5 5 5 15 4 5 5 14 5 4 5 14 5 4 9 4 5 4 4 4 21
76 4 5 4 5 18 5 5 5 15 5 4 5 14 4 4 5 13 4 4 8 5 5 5 5 4 24
77 4 5 3 4 16 4 5 5 14 5 4 4 13 5 5 5 15 4 4 8 4 4 4 4 4 20
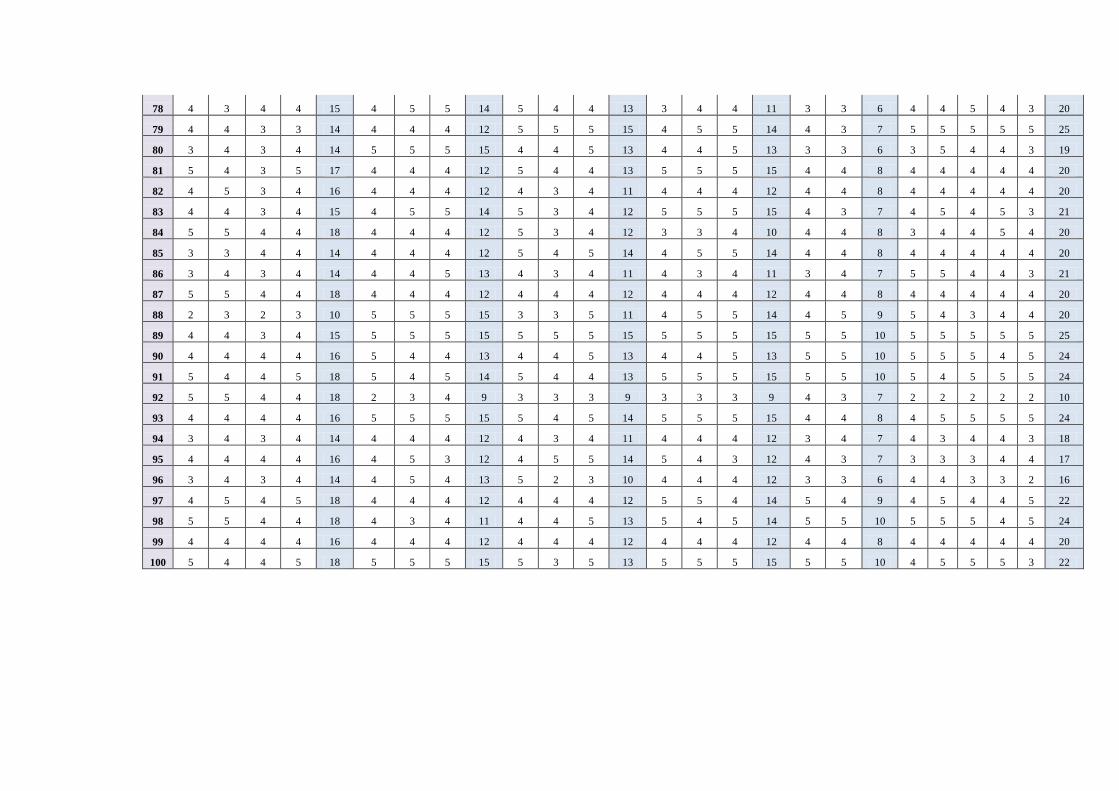
78 4 3 4 4 15 4 5 5 14 5 4 4 13 3 4 4 11 3 3 6 4 4 5 4 3 20
79 4 4 3 3 14 4 4 4 12 5 5 5 15 4 5 5 14 4 3 7 5 5 5 5 5 25
80 3 4 3 4 14 5 5 5 15 4 4 5 13 4 4 5 13 3 3 6 3 5 4 4 3 19
81 5 4 3 5 17 4 4 4 12 5 4 4 13 5 5 5 15 4 4 8 4 4 4 4 4 20
82 4 5 3 4 16 4 4 4 12 4 3 4 11 4 4 4 12 4 4 8 4 4 4 4 4 20
83 4 4 3 4 15 4 5 5 14 5 3 4 12 5 5 5 15 4 3 7 4 5 4 5 3 21
84 5 5 4 4 18 4 4 4 12 5 3 4 12 3 3 4 10 4 4 8 3 4 4 5 4 20
85 3 3 4 4 14 4 4 4 12 5 4 5 14 4 5 5 14 4 4 8 4 4 4 4 4 20
86 3 4 3 4 14 4 4 5 13 4 3 4 11 4 3 4 11 3 4 7 5 5 4 4 3 21
87 5 5 4 4 18 4 4 4 12 4 4 4 12 4 4 4 12 4 4 8 4 4 4 4 4 20
88 2 3 2 3 10 5 5 5 15 3 3 5 11 4 5 5 14 4 5 9 5 4 3 4 4 20
89 4 4 3 4 15 5 5 5 15 5 5 5 15 5 5 5 15 5 5 10 5 5 5 5 5 25
90 4 4 4 4 16 5 4 4 13 4 4 5 13 4 4 5 13 5 5 10 5 5 5 4 5 24
91 5 4 4 5 18 5 4 5 14 5 4 4 13 5 5 5 15 5 5 10 5 4 5 5 5 24
92 5 5 4 4 18 2 3 4 9 3 3 3 9 3 3 3 9 4 3 7 2 2 2 2 2 10
93 4 4 4 4 16 5 5 5 15 5 4 5 14 5 5 5 15 4 4 8 4 5 5 5 5 24
94 3 4 3 4 14 4 4 4 12 4 3 4 11 4 4 4 12 3 4 7 4 3 4 4 3 18
95 4 4 4 4 16 4 5 3 12 4 5 5 14 5 4 3 12 4 3 7 3 3 3 4 4 17
96 3 4 3 4 14 4 5 4 13 5 2 3 10 4 4 4 12 3 3 6 4 4 3 3 2 16
97 4 5 4 5 18 4 4 4 12 4 4 4 12 5 5 4 14 5 4 9 4 5 4 4 5 22
98 5 5 4 4 18 4 3 4 11 4 4 5 13 5 4 5 14 5 5 10 5 5 5 4 5 24
99 4 4 4 4 16 4 4 4 12 4 4 4 12 4 4 4 12 4 4 8 4 4 4 4 4 20
100 5 4 4 5 18 5 5 5 15 5 3 5 13 5 5 5 15 5 5 10 4 5 5 5 3 22
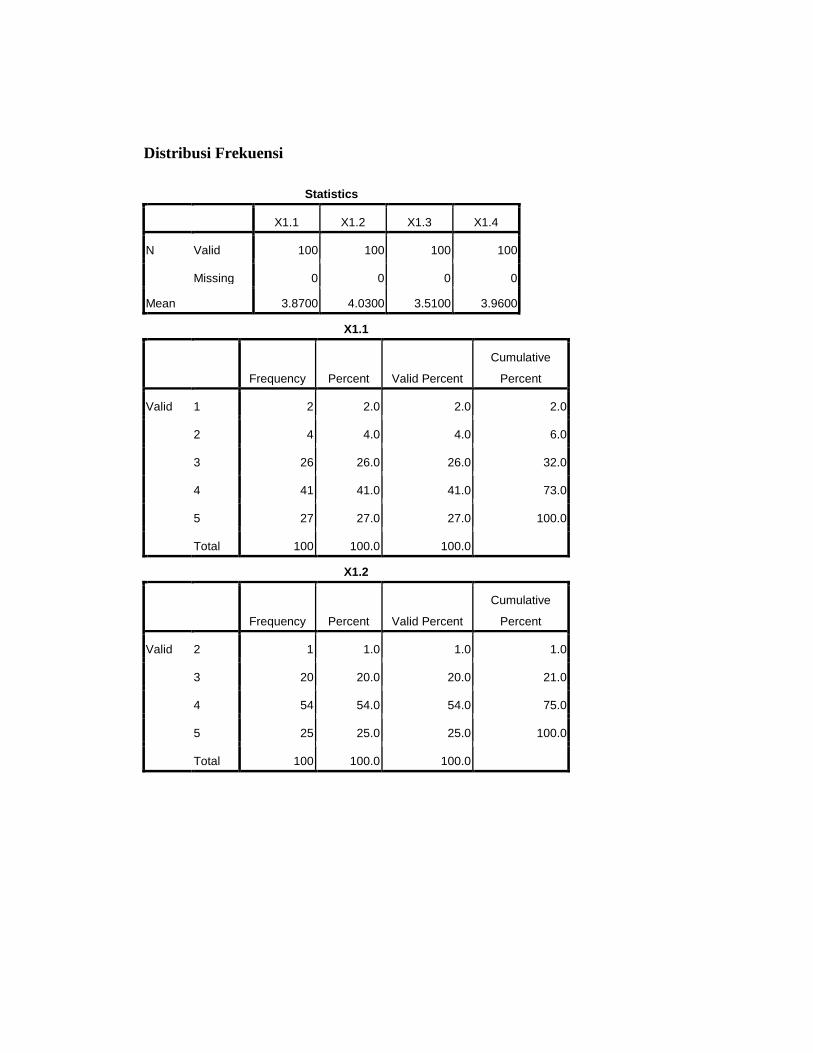
Distribusi Frekuensi
Statistics
X1.1 X1.2 X1.3 X1.4
N Valid 100 100 100 100
Missing 0 0 0 0
Mean 3.8700 4.0300 3.5100 3.9600
X1.1
Frequency Percent Valid Percent
Cumulative
Percent
Valid 1 2 2.0 2.0 2.0
2 4 4.0 4.0 6.0
3 26 26.0 26.0 32.0
4 41 41.0 41.0 73.0
5 27 27.0 27.0 100.0
Total 100 100.0 100.0
X1.2
Frequency Percent Valid Percent
Cumulative
Percent
Valid 2 1 1.0 1.0 1.0
3 20 20.0 20.0 21.0
4 54 54.0 54.0 75.0
5 25 25.0 25.0 100.0
Total 100 100.0 100.0
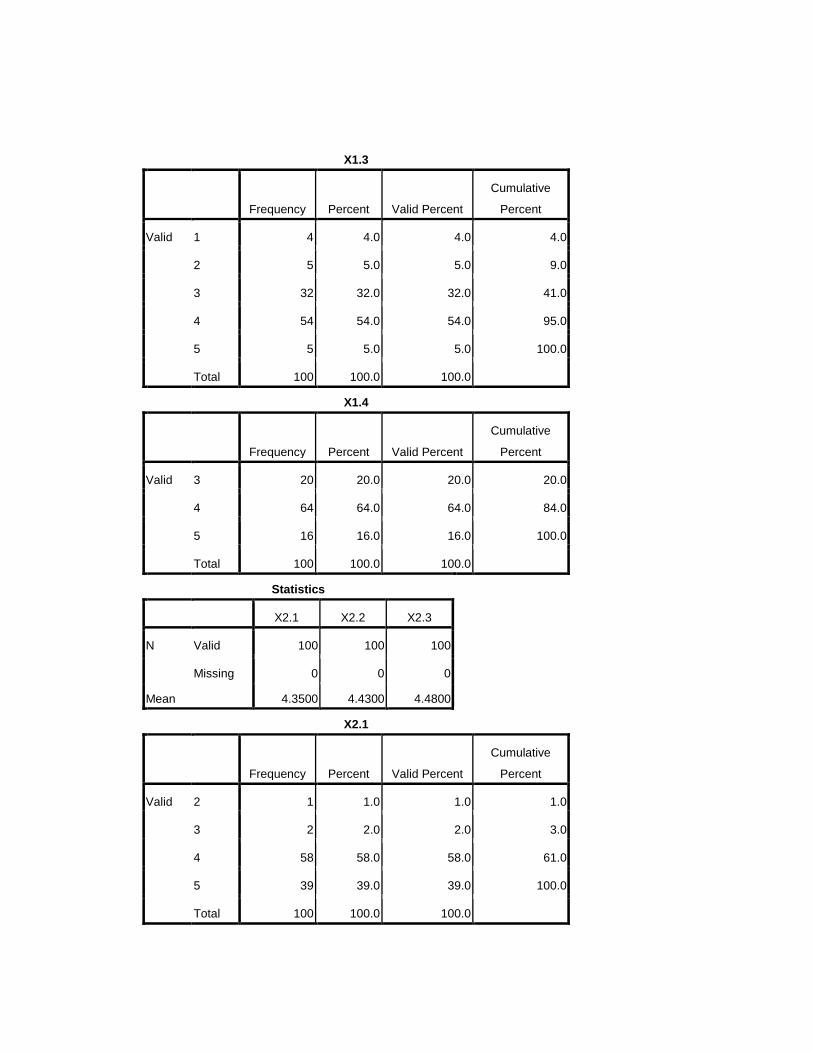
X1.3
Frequency Percent Valid Percent
Cumulative
Percent
Valid 1 4 4.0 4.0 4.0
2 5 5.0 5.0 9.0
3 32 32.0 32.0 41.0
4 54 54.0 54.0 95.0
5 5 5.0 5.0 100.0
Total 100 100.0 100.0
X1.4
Frequency Percent Valid Percent
Cumulative
Percent
Valid 3 20 20.0 20.0 20.0
4 64 64.0 64.0 84.0
5 16 16.0 16.0 100.0
Total 100 100.0 100.0
Statistics
X2.1 X2.2 X2.3
N Valid 100 100 100
Missing 0 0 0
Mean 4.3500 4.4300 4.4800
X2.1
Frequency Percent Valid Percent
Cumulative
Percent
Valid 2 1 1.0 1.0 1.0
3 2 2.0 2.0 3.0
4 58 58.0 58.0 61.0
5 39 39.0 39.0 100.0
Total 100 100.0 100.0

X2.2
Frequency Percent Valid Percent
Cumulative
Percent
Valid 3 5 5.0 5.0 5.0
4 47 47.0 47.0 52.0
5 48 48.0 48.0 100.0
Total 100 100.0 100.0
X2.3
Frequency Percent Valid Percent
Cumulative
Percent
Valid 3 3 3.0 3.0 3.0
4 46 46.0 46.0 49.0
5 51 51.0 51.0 100.0
Total 100 100.0 100.0
Statistics
X3.1 X3.2 X3.3
N Valid 100 100 100
Missing 0 0 0
Mean 4.4900 3.9400 4.3700
X3.1
Frequency Percent Valid Percent
Cumulative
Percent
Valid 2 1 1.0 1.0 1.0
3 6 6.0 6.0 7.0
4 36 36.0 36.0 43.0
5 57 57.0 57.0 100.0
Total 100 100.0 100.0
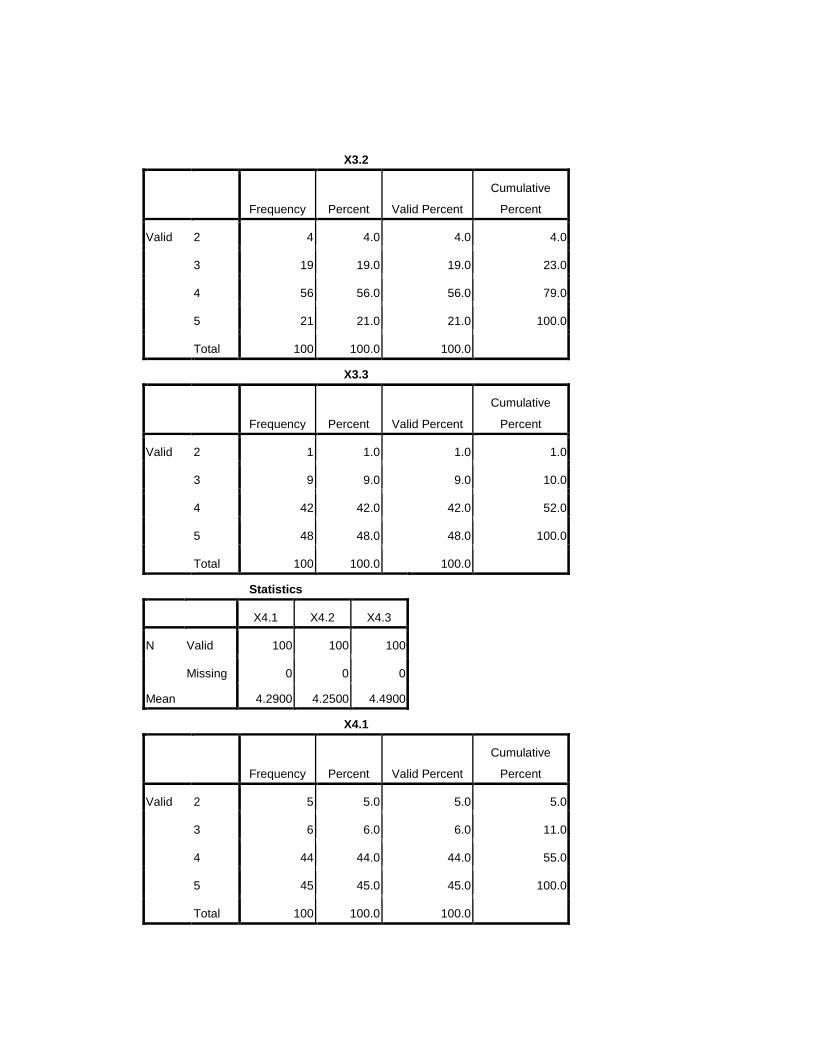
X3.2
Frequency Percent Valid Percent
Cumulative
Percent
Valid 2 4 4.0 4.0 4.0
3 19 19.0 19.0 23.0
4 56 56.0 56.0 79.0
5 21 21.0 21.0 100.0
Total 100 100.0 100.0
X3.3
Frequency Percent Valid Percent
Cumulative
Percent
Valid 2 1 1.0 1.0 1.0
3 9 9.0 9.0 10.0
4 42 42.0 42.0 52.0
5 48 48.0 48.0 100.0
Total 100 100.0 100.0
Statistics
X4.1 X4.2 X4.3
N Valid 100 100 100
Missing 0 0 0
Mean 4.2900 4.2500 4.4900
X4.1
Frequency Percent Valid Percent
Cumulative
Percent
Valid 2 5 5.0 5.0 5.0
3 6 6.0 6.0 11.0
4 44 44.0 44.0 55.0
5 45 45.0 45.0 100.0
Total 100 100.0 100.0
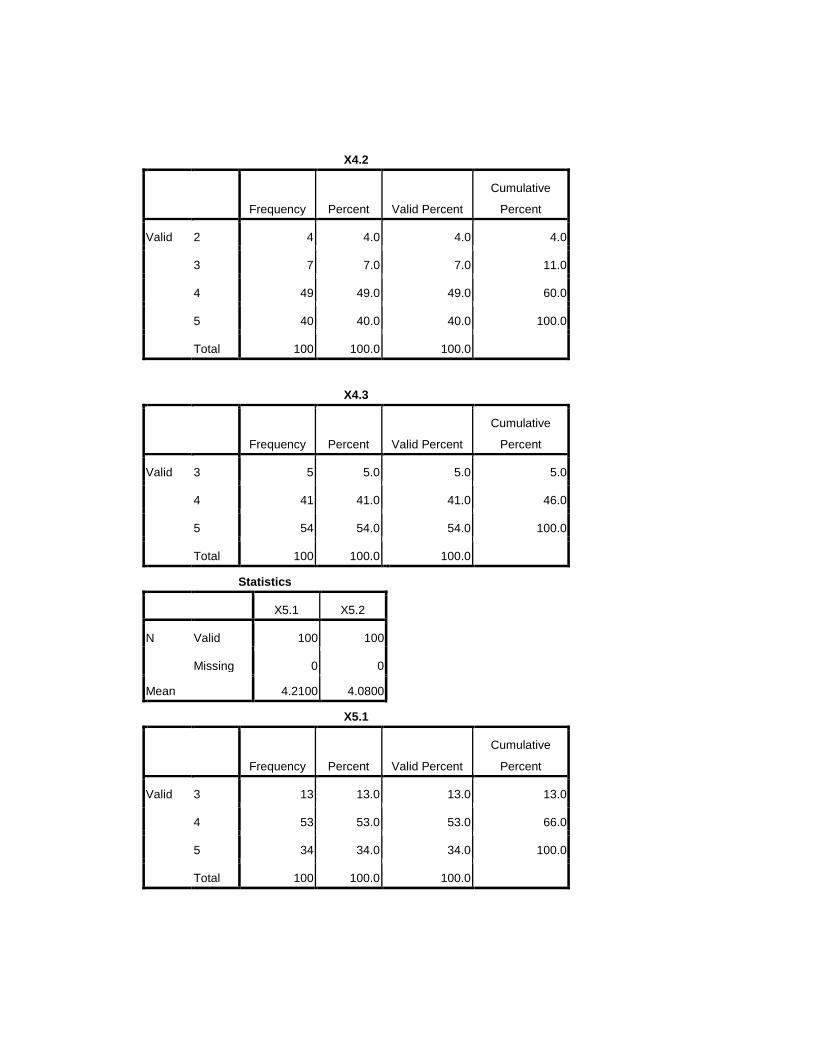
X4.2
Frequency Percent Valid Percent
Cumulative
Percent
Valid 2 4 4.0 4.0 4.0
3 7 7.0 7.0 11.0
4 49 49.0 49.0 60.0
5 40 40.0 40.0 100.0
Total 100 100.0 100.0
X4.3
Frequency Percent Valid Percent
Cumulative
Percent
Valid 3 5 5.0 5.0 5.0
4 41 41.0 41.0 46.0
5 54 54.0 54.0 100.0
Total 100 100.0 100.0
Statistics
X5.1 X5.2
N Valid 100 100
Missing 0 0
Mean 4.2100 4.0800
X5.1
Frequency Percent Valid Percent
Cumulative
Percent
Valid 3 13 13.0 13.0 13.0
4 53 53.0 53.0 66.0
5 34 34.0 34.0 100.0
Total 100 100.0 100.0

X5.2
Frequency Percent Valid Percent
Cumulative
Percent
Valid 3 13 13.0 13.0 13.0
4 66 66.0 66.0 79.0
5 21 21.0 21.0 100.0
Total 100 100.0 100.0
Statistics
Y1 Y2 Y3 Y4 Y5
N Valid 100 100 100 100 100
Missing 0 0 0 0 0
Mean 4.1300 4.2600 4.1200 4.2400 3.8800
Y1
Frequency Percent Valid Percent
Cumulative
Percent
Valid 2 2 2.0 2.0 2.0
3 16 16.0 16.0 18.0
4 49 49.0 49.0 67.0
5 33 33.0 33.0 100.0
Total 100 100.0 100.0
Y2
Frequency Percent Valid Percent
Cumulative
Percent
Valid 2 1 1.0 1.0 1.0
3 5 5.0 5.0 6.0
4 61 61.0 61.0 67.0
5 33 33.0 33.0 100.0
Total 100 100.0 100.0
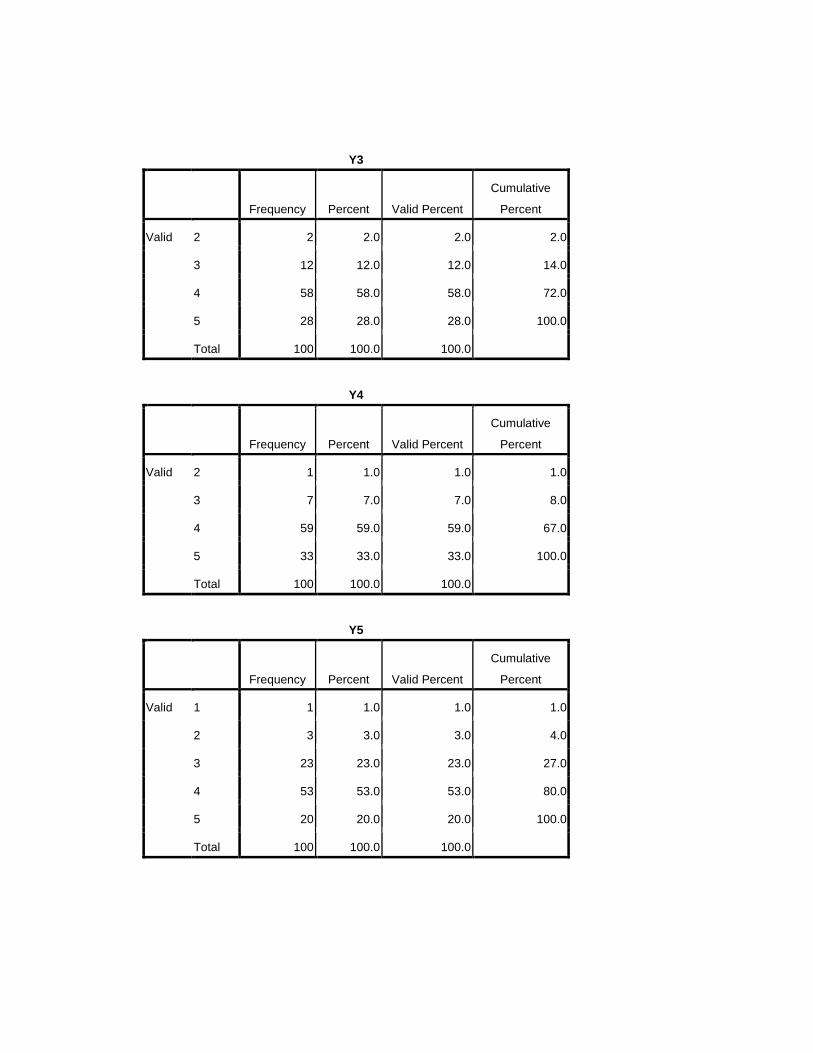
Y3
Frequency Percent Valid Percent
Cumulative
Percent
Valid 2 2 2.0 2.0 2.0
3 12 12.0 12.0 14.0
4 58 58.0 58.0 72.0
5 28 28.0 28.0 100.0
Total 100 100.0 100.0
Y4
Frequency Percent Valid Percent
Cumulative
Percent
Valid 2 1 1.0 1.0 1.0
3 7 7.0 7.0 8.0
4 59 59.0 59.0 67.0
5 33 33.0 33.0 100.0
Total 100 100.0 100.0
Y5
Frequency Percent Valid Percent
Cumulative
Percent
Valid 1 1 1.0 1.0 1.0
2 3 3.0 3.0 4.0
3 23 23.0 23.0 27.0
4 53 53.0 53.0 80.0
5 20 20.0 20.0 100.0
Total 100 100.0 100.0
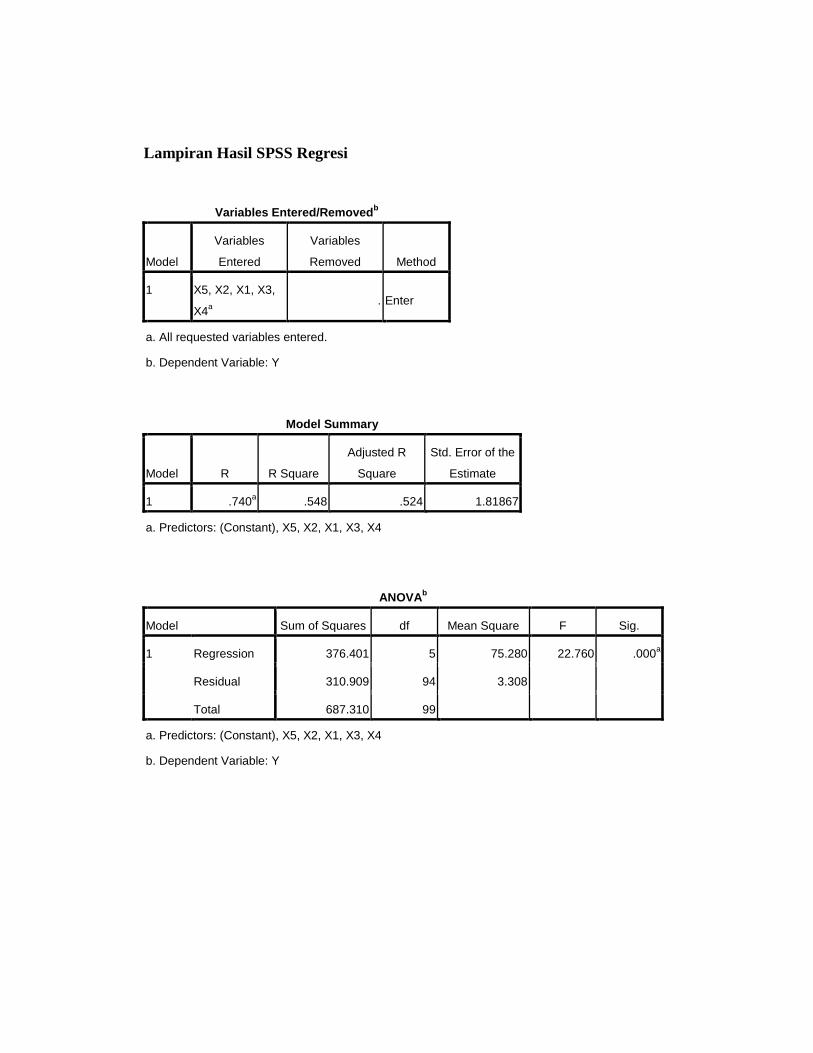
Lampiran Hasil SPSS Regresi
Variables Entered/Removedb
Model
Variables
Entered
Variables
Removed Method
1 X5, X2, X1, X3,
X4a
. Enter
a. All requested variables entered.
b. Dependent Variable: Y
Model Summary
Model R R Square
Adjusted R
Square
Std. Error of the
Estimate
1 .740a .548 .524 1.81867
a. Predictors: (Constant), X5, X2, X1, X3, X4
ANOVAb
Model Sum of Squares df Mean Square F Sig.
1 Regression 376.401 5 75.280 22.760 .000a
Residual 310.909 94 3.308
Total 687.310 99
a. Predictors: (Constant), X5, X2, X1, X3, X4
b. Dependent Variable: Y

Model
Unstandardized
Coefficients
Standardized
Coefficients
t Sig.
Correlations
B Std. Error Beta Zero-order Partial Part
1 (Constant) -3.639 2.339 -1.556 .123
X1 .191 .078 .176 2.455 .016 .268 .245 .170
X2 .415 .168 .219 2.470 .015 .515 .247 .171
X3 .327 .140 .195 2.340 .021 .509 .235 .162
X4 .365 .126 .247 2.900 .005 .499 .287 .201
X5 .830 .186 .330 4.472 .000 .500 .419 .310
a. Dependent Variable: Y
Lampiran Hasil Uji Validitas dan Uji Reliabilitas
Correlations
X1.1 X1.2 X1.3 X1.4 X1
X1.1 Pearson Correlation 1 .532** .660
** .497
** .887
**
Sig. (2-tailed) .000 .000 .000 .000
N 100 100 100 100 100
X1.2 Pearson Correlation .532** 1 .456
** .409
** .751
**
Sig. (2-tailed) .000 .000 .000 .000
N 100 100 100 100 100
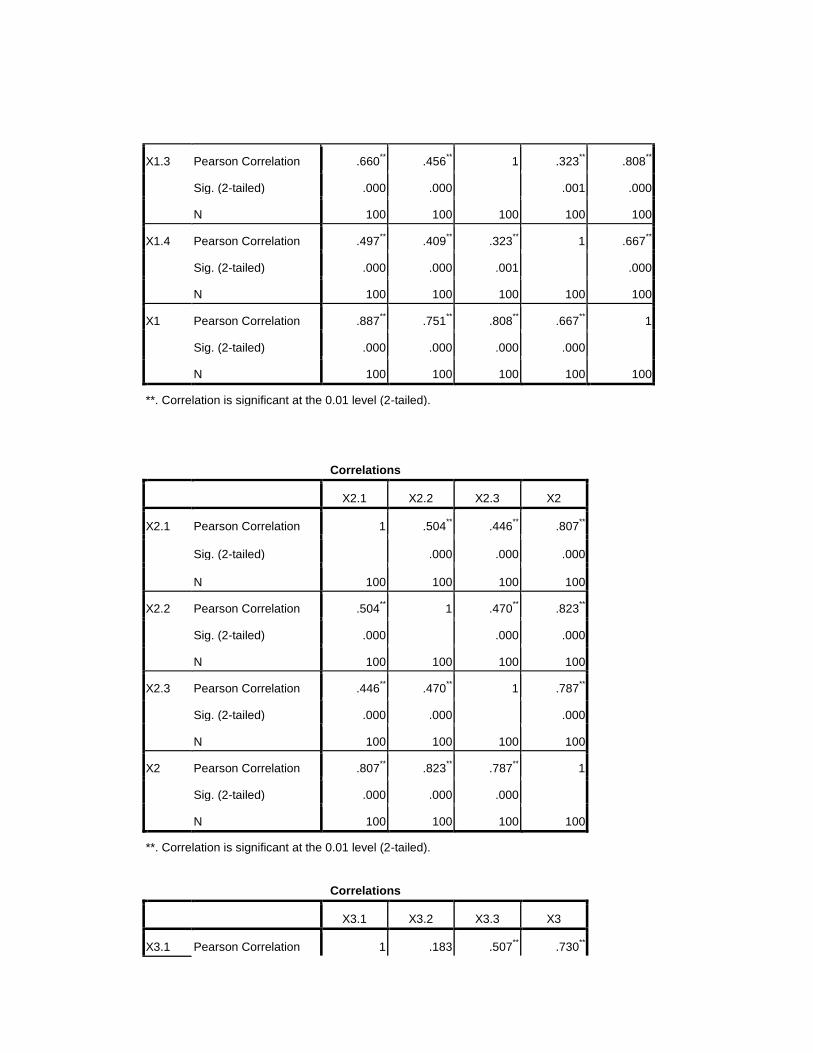
X1.3 Pearson Correlation .660** .456
** 1 .323
** .808
**
Sig. (2-tailed) .000 .000 .001 .000
N 100 100 100 100 100
X1.4 Pearson Correlation .497** .409
** .323
** 1 .667
**
Sig. (2-tailed) .000 .000 .001 .000
N 100 100 100 100 100
X1 Pearson Correlation .887** .751
** .808
** .667
** 1
Sig. (2-tailed) .000 .000 .000 .000
N 100 100 100 100 100
**. Correlation is significant at the 0.01 level (2-tailed).
Correlations
X2.1 X2.2 X2.3 X2
X2.1 Pearson Correlation 1 .504** .446
** .807
**
Sig. (2-tailed) .000 .000 .000
N 100 100 100 100
X2.2 Pearson Correlation .504** 1 .470
** .823
**
Sig. (2-tailed) .000 .000 .000
N 100 100 100 100
X2.3 Pearson Correlation .446** .470
** 1 .787
**
Sig. (2-tailed) .000 .000 .000
N 100 100 100 100
X2 Pearson Correlation .807** .823
** .787
** 1
Sig. (2-tailed) .000 .000 .000
N 100 100 100 100
**. Correlation is significant at the 0.01 level (2-tailed).
Correlations
X3.1 X3.2 X3.3 X3
X3.1 Pearson Correlation 1 .183 .507** .730
**
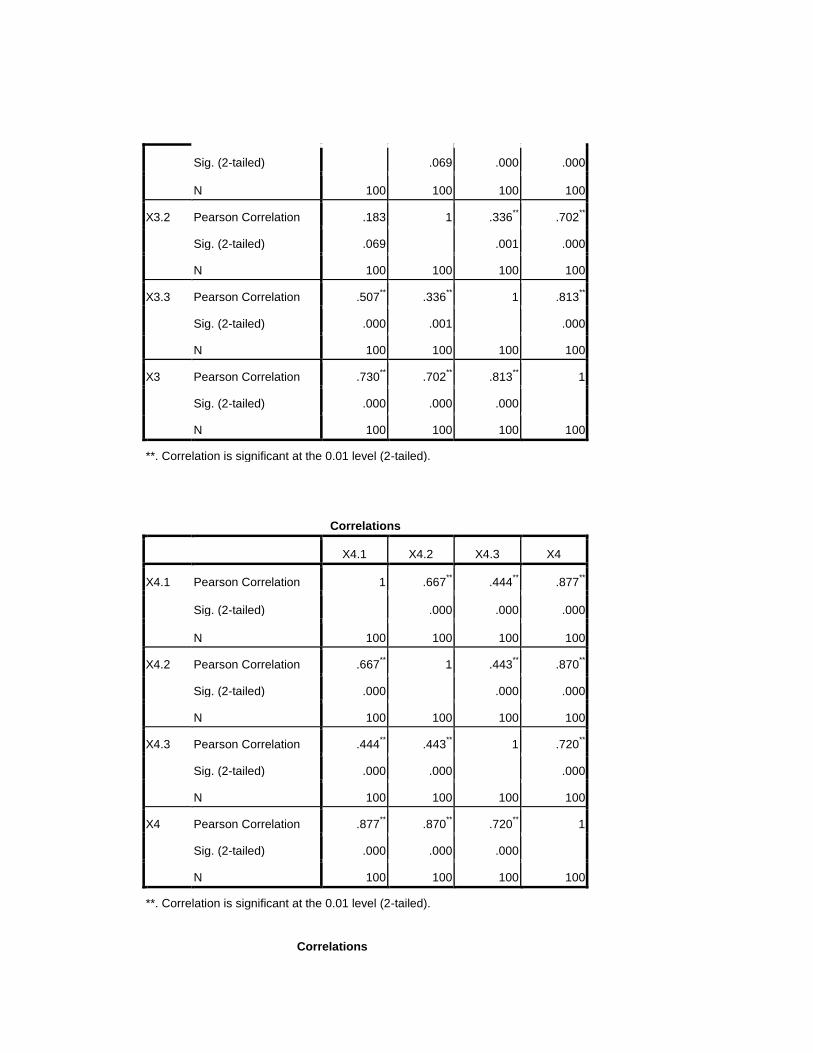
Sig. (2-tailed) .069 .000 .000
N 100 100 100 100
X3.2 Pearson Correlation .183 1 .336** .702
**
Sig. (2-tailed) .069 .001 .000
N 100 100 100 100
X3.3 Pearson Correlation .507** .336
** 1 .813
**
Sig. (2-tailed) .000 .001 .000
N 100 100 100 100
X3 Pearson Correlation .730** .702
** .813
** 1
Sig. (2-tailed) .000 .000 .000
N 100 100 100 100
**. Correlation is significant at the 0.01 level (2-tailed).
Correlations
X4.1 X4.2 X4.3 X4
X4.1 Pearson Correlation 1 .667** .444
** .877
**
Sig. (2-tailed) .000 .000 .000
N 100 100 100 100
X4.2 Pearson Correlation .667** 1 .443
** .870
**
Sig. (2-tailed) .000 .000 .000
N 100 100 100 100
X4.3 Pearson Correlation .444** .443
** 1 .720
**
Sig. (2-tailed) .000 .000 .000
N 100 100 100 100
X4 Pearson Correlation .877** .870
** .720
** 1
Sig. (2-tailed) .000 .000 .000
N 100 100 100 100
**. Correlation is significant at the 0.01 level (2-tailed).
Correlations
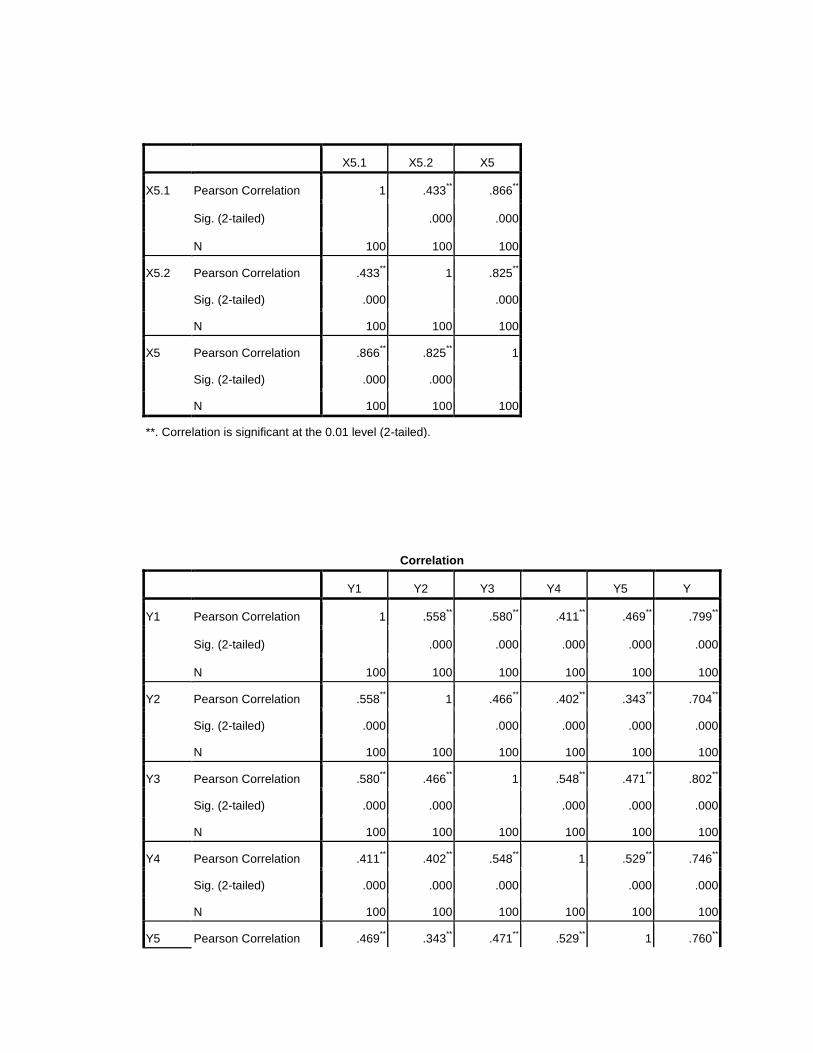
X5.1 X5.2 X5
X5.1 Pearson Correlation 1 .433** .866
**
Sig. (2-tailed) .000 .000
N 100 100 100
X5.2 Pearson Correlation .433** 1 .825
**
Sig. (2-tailed) .000 .000
N 100 100 100
X5 Pearson Correlation .866** .825
** 1
Sig. (2-tailed) .000 .000
N 100 100 100
**. Correlation is significant at the 0.01 level (2-tailed).
Correlation
Y1 Y2 Y3 Y4 Y5 Y
Y1 Pearson Correlation 1 .558** .580
** .411
** .469
** .799
**
Sig. (2-tailed) .000 .000 .000 .000 .000
N 100 100 100 100 100 100
Y2 Pearson Correlation .558** 1 .466
** .402
** .343
** .704
**
Sig. (2-tailed) .000 .000 .000 .000 .000
N 100 100 100 100 100 100
Y3 Pearson Correlation .580** .466
** 1 .548
** .471
** .802
**
Sig. (2-tailed) .000 .000 .000 .000 .000
N 100 100 100 100 100 100
Y4 Pearson Correlation .411** .402
** .548
** 1 .529
** .746
**
Sig. (2-tailed) .000 .000 .000 .000 .000
N 100 100 100 100 100 100
Y5 Pearson Correlation .469** .343
** .471
** .529
** 1 .760
**

Sig. (2-tailed) .000 .000 .000 .000 .000
N 100 100 100 100 100 100
Y Pearson Correlation .799** .704
** .802
** .746
** .760
** 1
Sig. (2-tailed) .000 .000 .000 .000 .000
N 100 100 100 100 100 100
**. Correlation is significant at the 0.01 level (2-tailed).
Case Processing Summary
N %
Cases Valid 100 100.0
Excludeda 0 .0
Total 100 100.0
a. Listwise deletion based on all variables in the
procedure.
Reliability Statistics
Cronbach's
Alpha N of Items
.787 4
Item-Total Statistics
Scale Mean if
Item Deleted
Scale Variance if
Item Deleted
Corrected Item-
Total Correlation
Cronbach's
Alpha if Item
Deleted
X1.1 11.5000 2.758 .737 .655
X1.2 11.3400 3.823 .573 .746
X1.3 11.8600 3.314 .619 .722
X1.4 11.4100 4.305 .491 .785
Scale Statistics
Mean Variance Std. Deviation N of Items
15.3700 5.892 2.42735 4
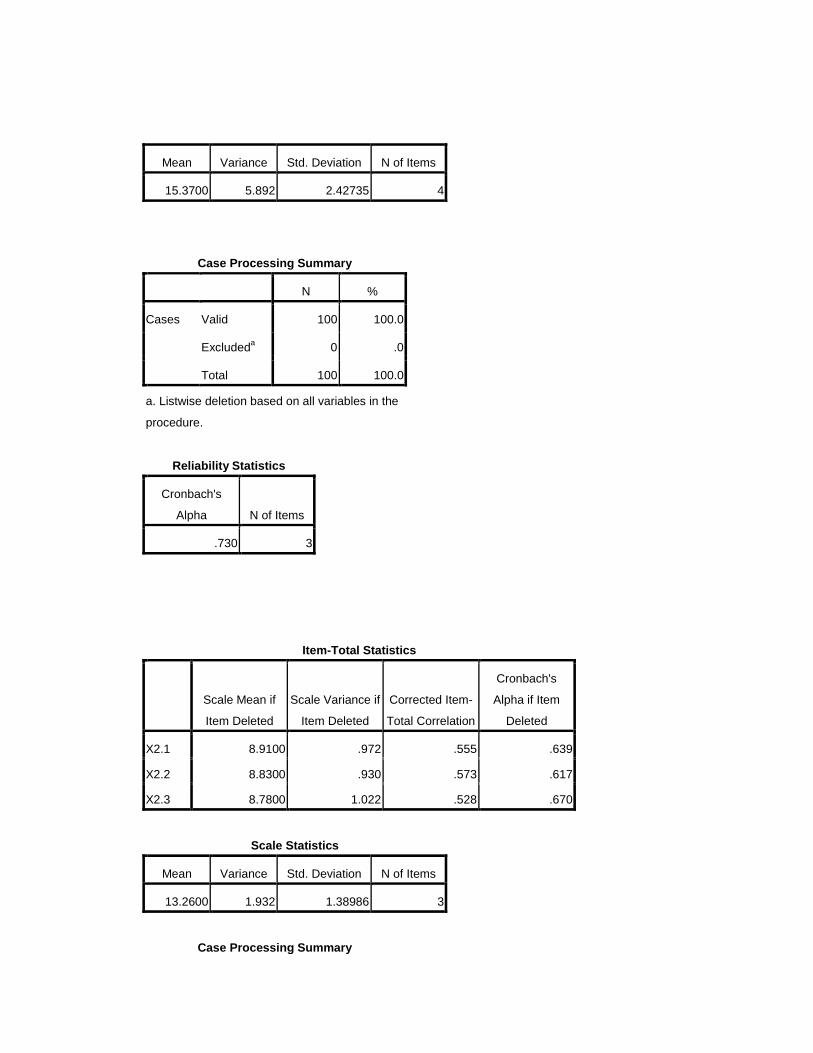
Case Processing Summary
N %
Cases Valid 100 100.0
Excludeda 0 .0
Total 100 100.0
a. Listwise deletion based on all variables in the
procedure.
Reliability Statistics
Cronbach's
Alpha N of Items
.730 3
Item-Total Statistics
Scale Mean if
Item Deleted
Scale Variance if
Item Deleted
Corrected Item-
Total Correlation
Cronbach's
Alpha if Item
Deleted
X2.1 8.9100 .972 .555 .639
X2.2 8.8300 .930 .573 .617
X2.3 8.7800 1.022 .528 .670
Scale Statistics
Mean Variance Std. Deviation N of Items
13.2600 1.932 1.38986 3
Case Processing Summary
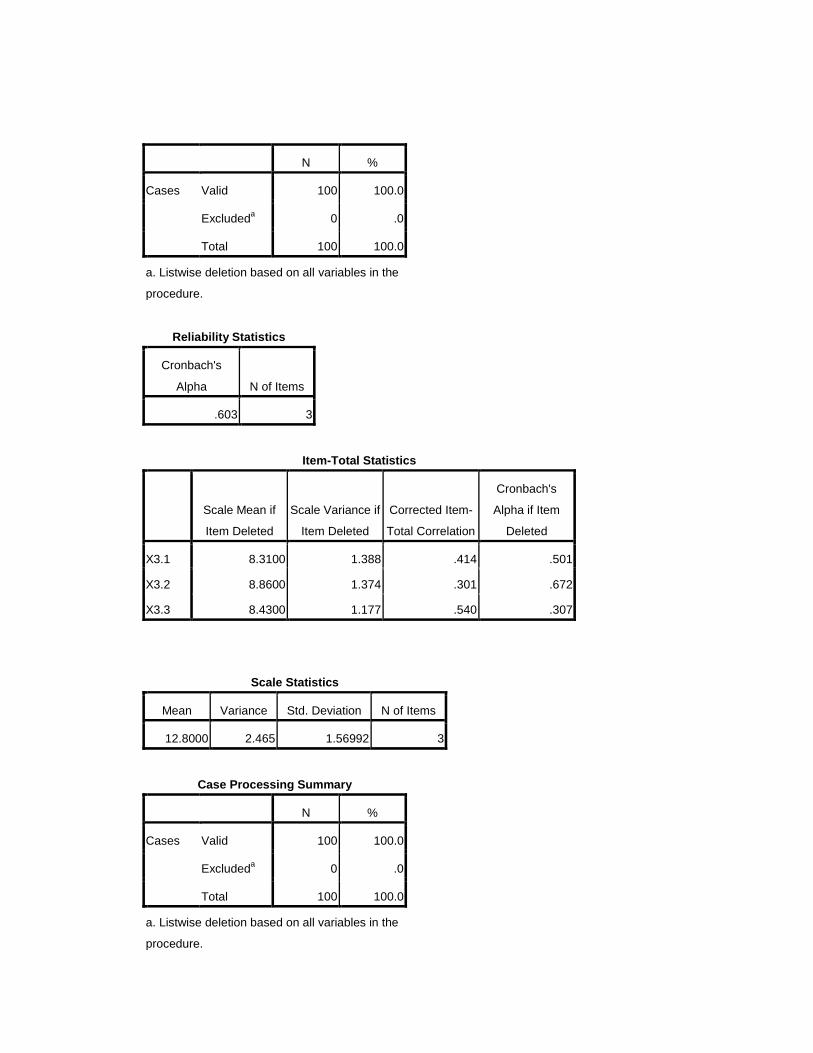
N %
Cases Valid 100 100.0
Excludeda 0 .0
Total 100 100.0
a. Listwise deletion based on all variables in the
procedure.
Reliability Statistics
Cronbach's
Alpha N of Items
.603 3
Item-Total Statistics
Scale Mean if
Item Deleted
Scale Variance if
Item Deleted
Corrected Item-
Total Correlation
Cronbach's
Alpha if Item
Deleted
X3.1 8.3100 1.388 .414 .501
X3.2 8.8600 1.374 .301 .672
X3.3 8.4300 1.177 .540 .307
Scale Statistics
Mean Variance Std. Deviation N of Items
12.8000 2.465 1.56992 3
Case Processing Summary
N %
Cases Valid 100 100.0
Excludeda 0 .0
Total 100 100.0
a. Listwise deletion based on all variables in the
procedure.
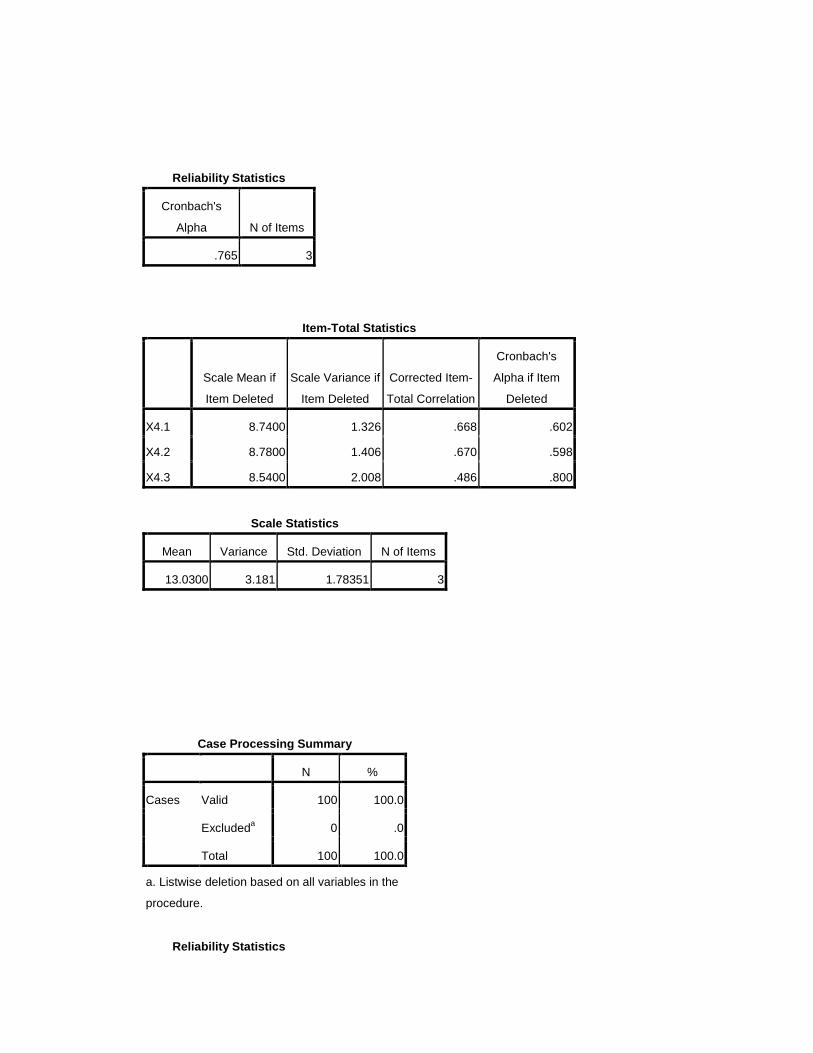
Reliability Statistics
Cronbach's
Alpha N of Items
.765 3
Item-Total Statistics
Scale Mean if
Item Deleted
Scale Variance if
Item Deleted
Corrected Item-
Total Correlation
Cronbach's
Alpha if Item
Deleted
X4.1 8.7400 1.326 .668 .602
X4.2 8.7800 1.406 .670 .598
X4.3 8.5400 2.008 .486 .800
Scale Statistics
Mean Variance Std. Deviation N of Items
13.0300 3.181 1.78351 3
Case Processing Summary
N %
Cases Valid 100 100.0
Excludeda 0 .0
Total 100 100.0
a. Listwise deletion based on all variables in the
procedure.
Reliability Statistics
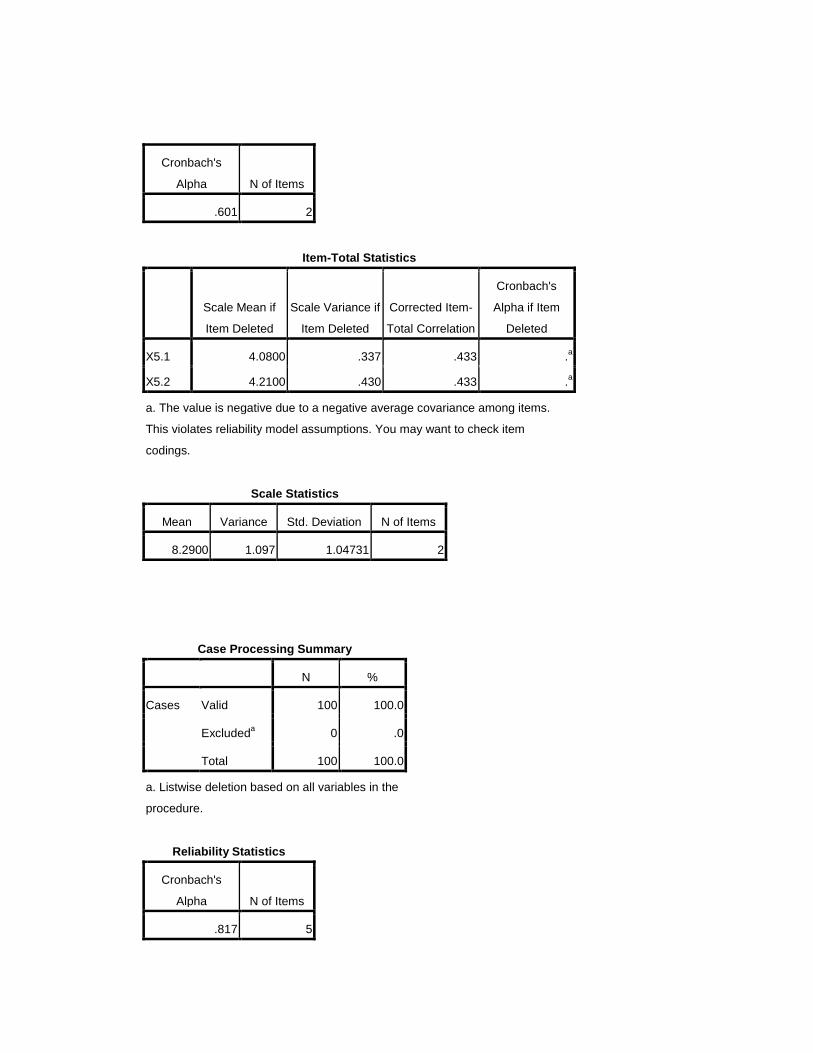
Cronbach's
Alpha N of Items
.601 2
Item-Total Statistics
Scale Mean if
Item Deleted
Scale Variance if
Item Deleted
Corrected Item-
Total Correlation
Cronbach's
Alpha if Item
Deleted
X5.1 4.0800 .337 .433 .a
X5.2 4.2100 .430 .433 .a
a. The value is negative due to a negative average covariance among items.
This violates reliability model assumptions. You may want to check item
codings.
Scale Statistics
Mean Variance Std. Deviation N of Items
8.2900 1.097 1.04731 2
Case Processing Summary
N %
Cases Valid 100 100.0
Excludeda 0 .0
Total 100 100.0
a. Listwise deletion based on all variables in the
procedure.
Reliability Statistics
Cronbach's
Alpha N of Items
.817 5
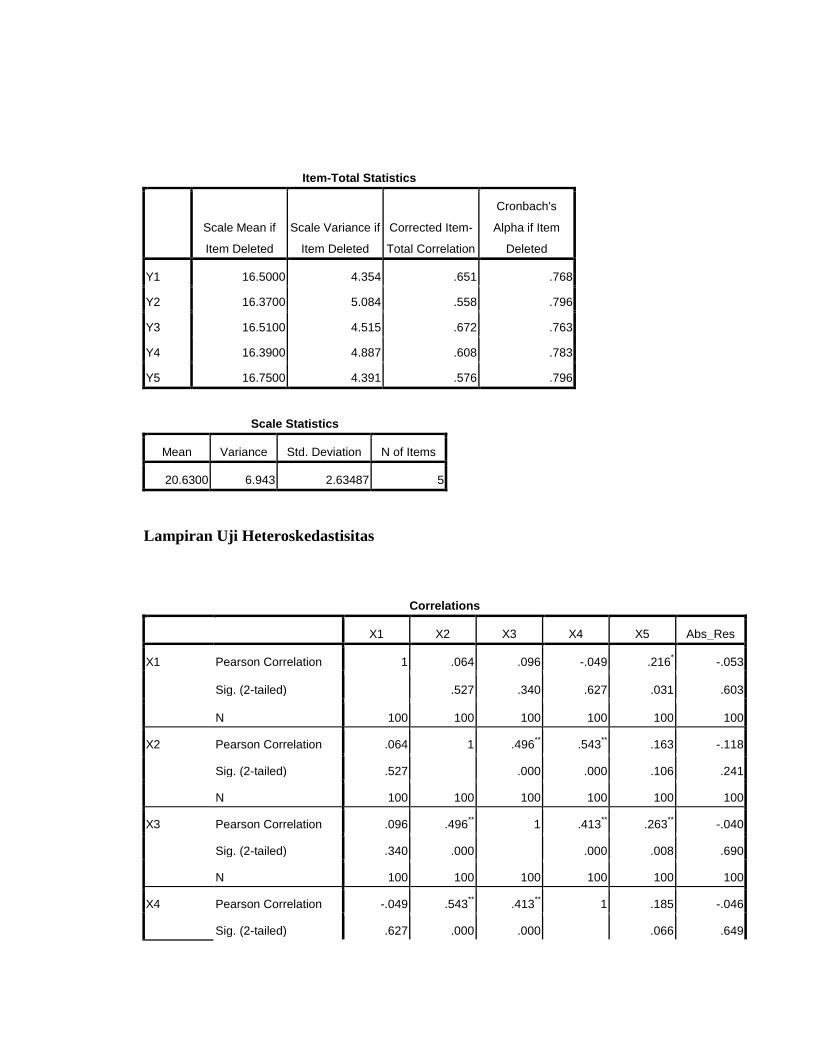
Item-Total Statistics
Scale Mean if
Item Deleted
Scale Variance if
Item Deleted
Corrected Item-
Total Correlation
Cronbach's
Alpha if Item
Deleted
Y1 16.5000 4.354 .651 .768
Y2 16.3700 5.084 .558 .796
Y3 16.5100 4.515 .672 .763
Y4 16.3900 4.887 .608 .783
Y5 16.7500 4.391 .576 .796
Scale Statistics
Mean Variance Std. Deviation N of Items
20.6300 6.943 2.63487 5
Lampiran Uji Heteroskedastisitas
Correlations
X1 X2 X3 X4 X5 Abs_Res
X1 Pearson Correlation 1 .064 .096 -.049 .216* -.053
Sig. (2-tailed) .527 .340 .627 .031 .603
N 100 100 100 100 100 100
X2 Pearson Correlation .064 1 .496** .543
** .163 -.118
Sig. (2-tailed) .527 .000 .000 .106 .241
N 100 100 100 100 100 100
X3 Pearson Correlation .096 .496** 1 .413
** .263
** -.040
Sig. (2-tailed) .340 .000 .000 .008 .690
N 100 100 100 100 100 100
X4 Pearson Correlation -.049 .543** .413
** 1 .185 -.046
Sig. (2-tailed) .627 .000 .000 .066 .649
N 100 100 100 100 100 100
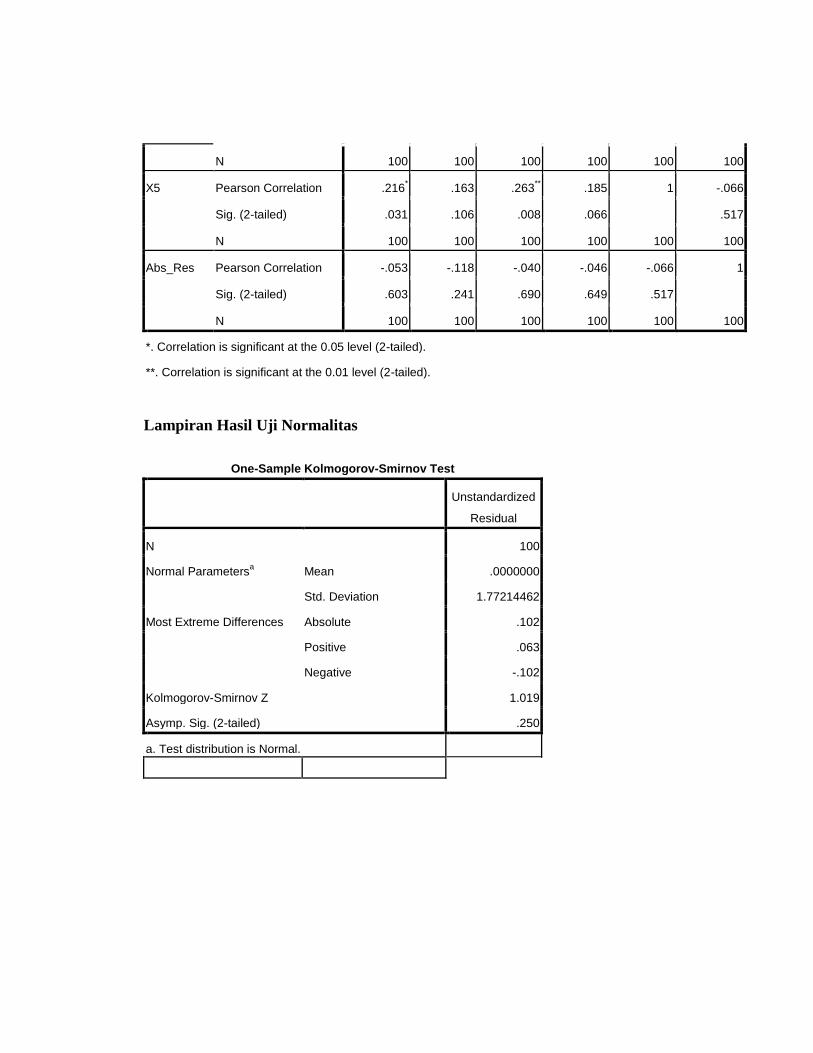
X5 Pearson Correlation .216* .163 .263
** .185 1 -.066
Sig. (2-tailed) .031 .106 .008 .066 .517
N 100 100 100 100 100 100
Abs_Res Pearson Correlation -.053 -.118 -.040 -.046 -.066 1
Sig. (2-tailed) .603 .241 .690 .649 .517
N 100 100 100 100 100 100
*. Correlation is significant at the 0.05 level (2-tailed).
**. Correlation is significant at the 0.01 level (2-tailed).
Lampiran Hasil Uji Normalitas
One-Sample Kolmogorov-Smirnov Test
Unstandardized
Residual
N 100
Normal Parametersa Mean .0000000
Std. Deviation 1.77214462
Most Extreme Differences Absolute .102
Positive .063
Negative -.102
Kolmogorov-Smirnov Z 1.019
Asymp. Sig. (2-tailed) .250
a. Test distribution is Normal.
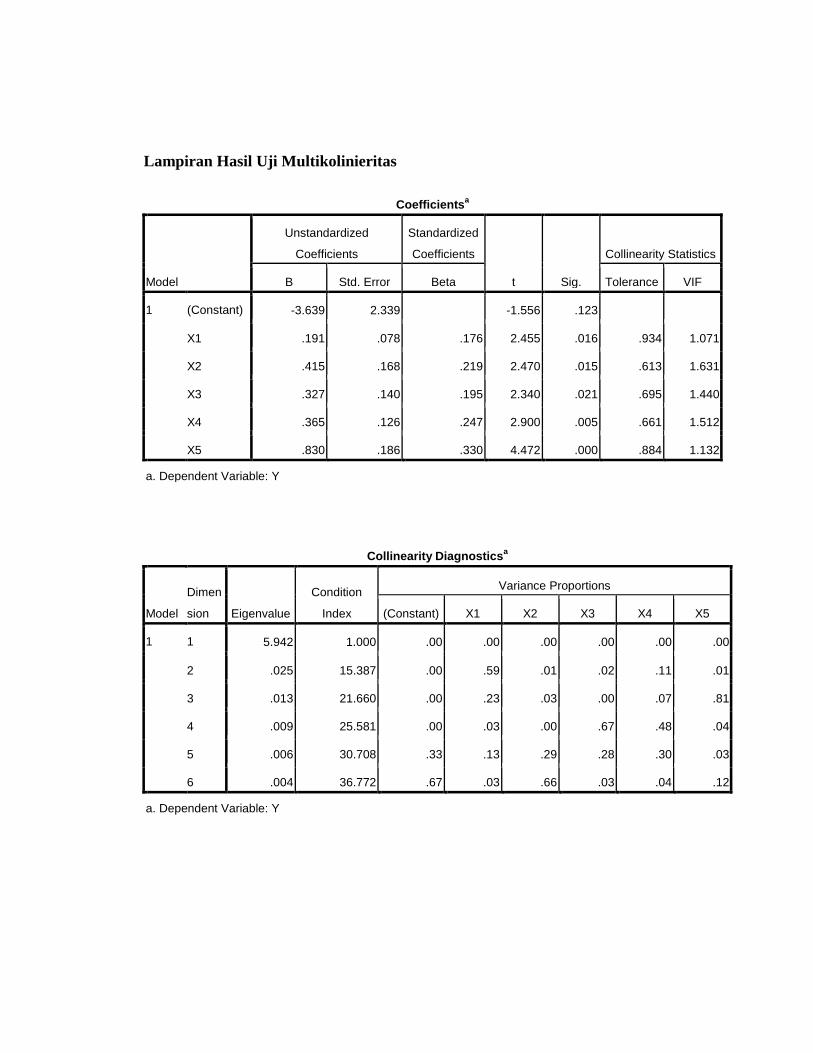
Lampiran Hasil Uji Multikolinieritas
Coefficientsa
Model
Unstandardized
Coefficients
Standardized
Coefficients
t Sig.
Collinearity Statistics
B Std. Error Beta Tolerance VIF
1 (Constant) -3.639 2.339 -1.556 .123
X1 .191 .078 .176 2.455 .016 .934 1.071
X2 .415 .168 .219 2.470 .015 .613 1.631
X3 .327 .140 .195 2.340 .021 .695 1.440
X4 .365 .126 .247 2.900 .005 .661 1.512
X5 .830 .186 .330 4.472 .000 .884 1.132
a. Dependent Variable: Y
Collinearity Diagnosticsa
Model
Dimen
sion Eigenvalue
Condition
Index
Variance Proportions
(Constant) X1 X2 X3 X4 X5
1 1 5.942 1.000 .00 .00 .00 .00 .00 .00
2 .025 15.387 .00 .59 .01 .02 .11 .01
3 .013 21.660 .00 .23 .03 .00 .07 .81
4 .009 25.581 .00 .03 .00 .67 .48 .04
5 .006 30.708 .33 .13 .29 .28 .30 .03
6 .004 36.772 .67 .03 .66 .03 .04 .12
a. Dependent Variable: Y
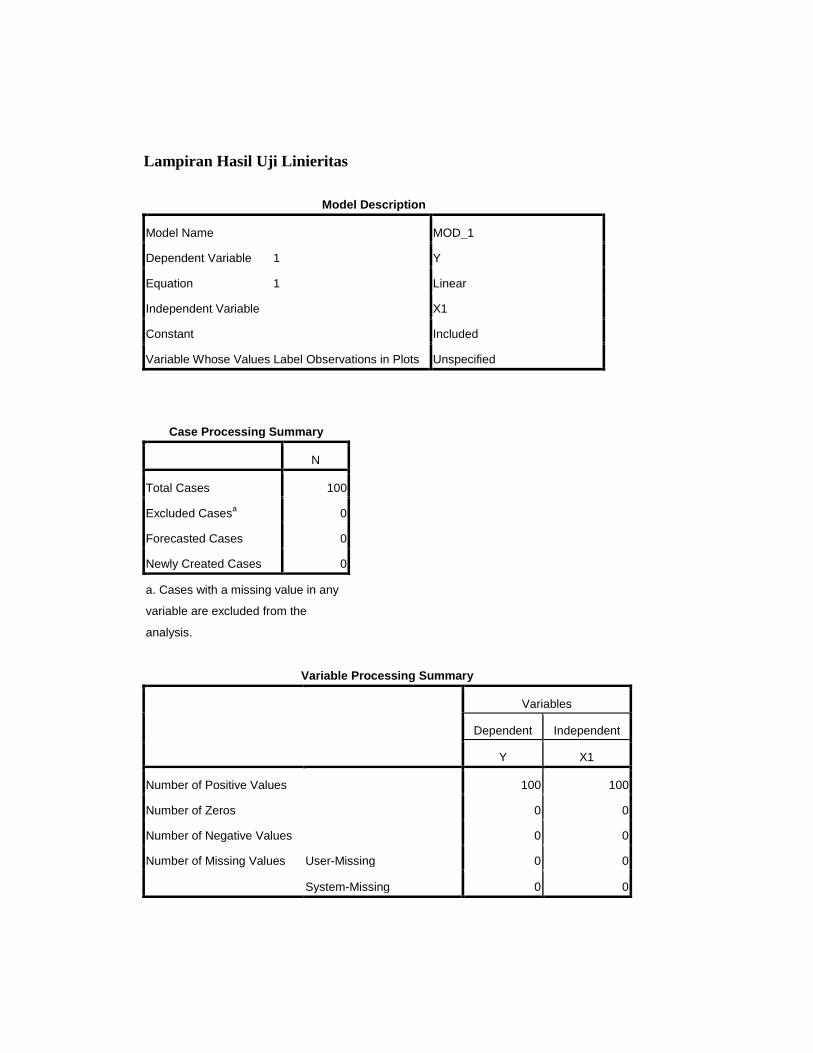
Lampiran Hasil Uji Linieritas
Model Description
Model Name MOD_1
Dependent Variable 1 Y
Equation 1 Linear
Independent Variable X1
Constant Included
Variable Whose Values Label Observations in Plots Unspecified
Case Processing Summary
N
Total Cases 100
Excluded Casesa 0
Forecasted Cases 0
Newly Created Cases 0
a. Cases with a missing value in any
variable are excluded from the
analysis.
Variable Processing Summary
Variables
Dependent Independent
Y X1
Number of Positive Values 100 100
Number of Zeros 0 0
Number of Negative Values 0 0
Number of Missing Values User-Missing 0 0
System-Missing 0 0
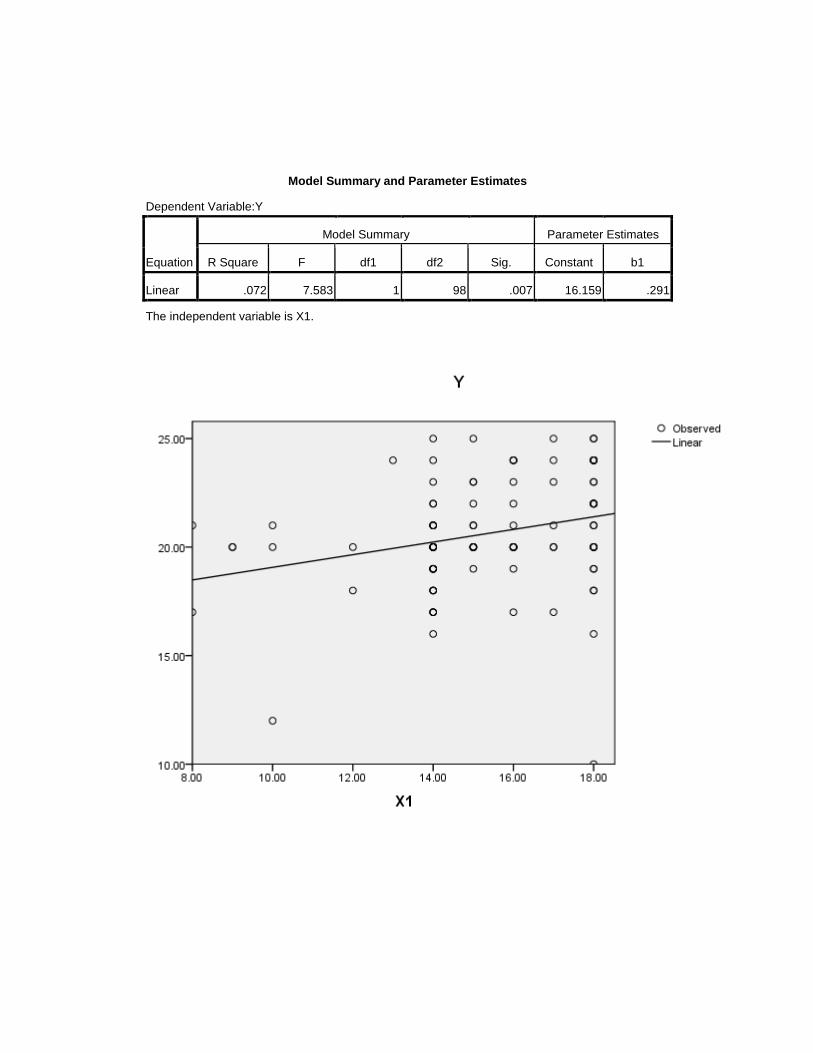
Model Summary and Parameter Estimates
Dependent Variable:Y
Equation
Model Summary Parameter Estimates
R Square F df1 df2 Sig. Constant b1
Linear .072 7.583 1 98 .007 16.159 .291
The independent variable is X1.

Model Description
Model Name MOD_2
Dependent Variable 1 Y
Equation 1 Linear
Independent Variable X2
Constant Included
Variable Whose Values Label Observations in Plots Unspecified
Case Processing Summary
N
Total Cases 100
Excluded Casesa 0
Forecasted Cases 0
Newly Created Cases 0
a. Cases with a missing value in any
variable are excluded from the
analysis.
Variable Processing Summary
Variables
Dependent Independent
Y X2
Number of Positive Values 100 100
Number of Zeros 0 0
Number of Negative Values 0 0
Number of Missing Values User-Missing 0 0
System-Missing 0 0

Model Summary and Parameter Estimates
Dependent Variable:Y
Equation
Model Summary Parameter Estimates
R Square F df1 df2 Sig. Constant b1
Linear .265 35.327 1 98 .000 7.690 .976
The independent variable is X2.
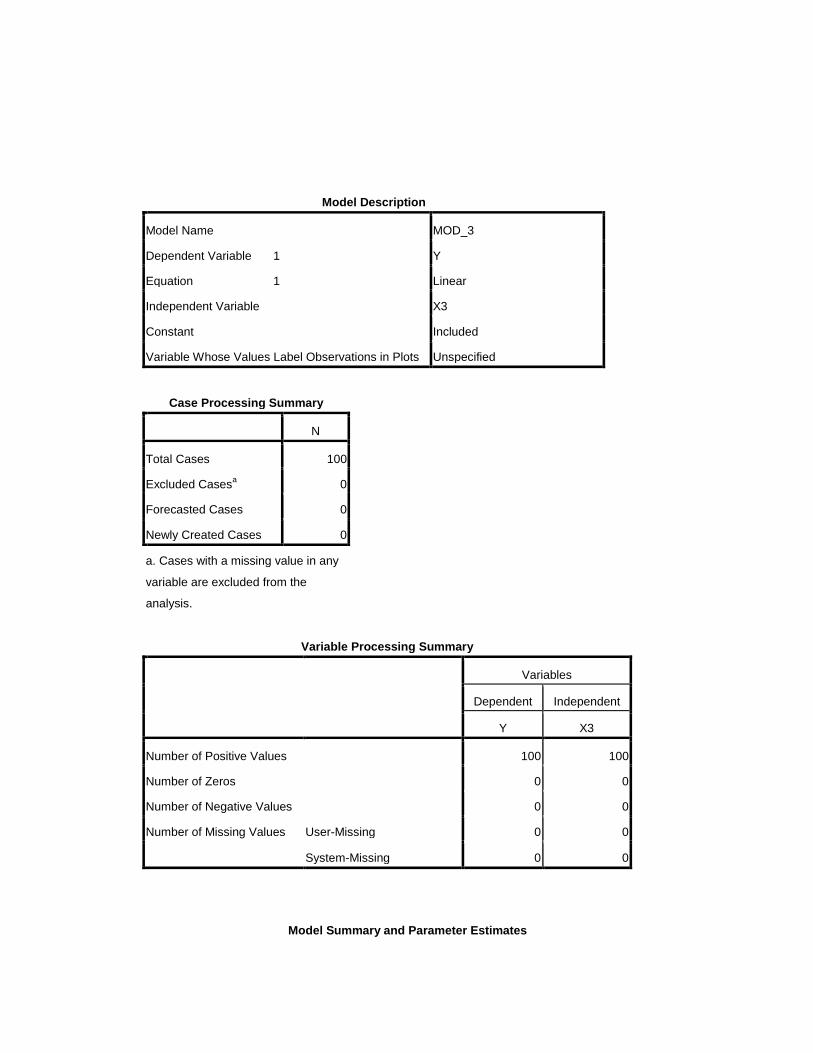
Model Description
Model Name MOD_3
Dependent Variable 1 Y
Equation 1 Linear
Independent Variable X3
Constant Included
Variable Whose Values Label Observations in Plots Unspecified
Case Processing Summary
N
Total Cases 100
Excluded Casesa 0
Forecasted Cases 0
Newly Created Cases 0
a. Cases with a missing value in any
variable are excluded from the
analysis.
Variable Processing Summary
Variables
Dependent Independent
Y X3
Number of Positive Values 100 100
Number of Zeros 0 0
Number of Negative Values 0 0
Number of Missing Values User-Missing 0 0
System-Missing 0 0
Model Summary and Parameter Estimates
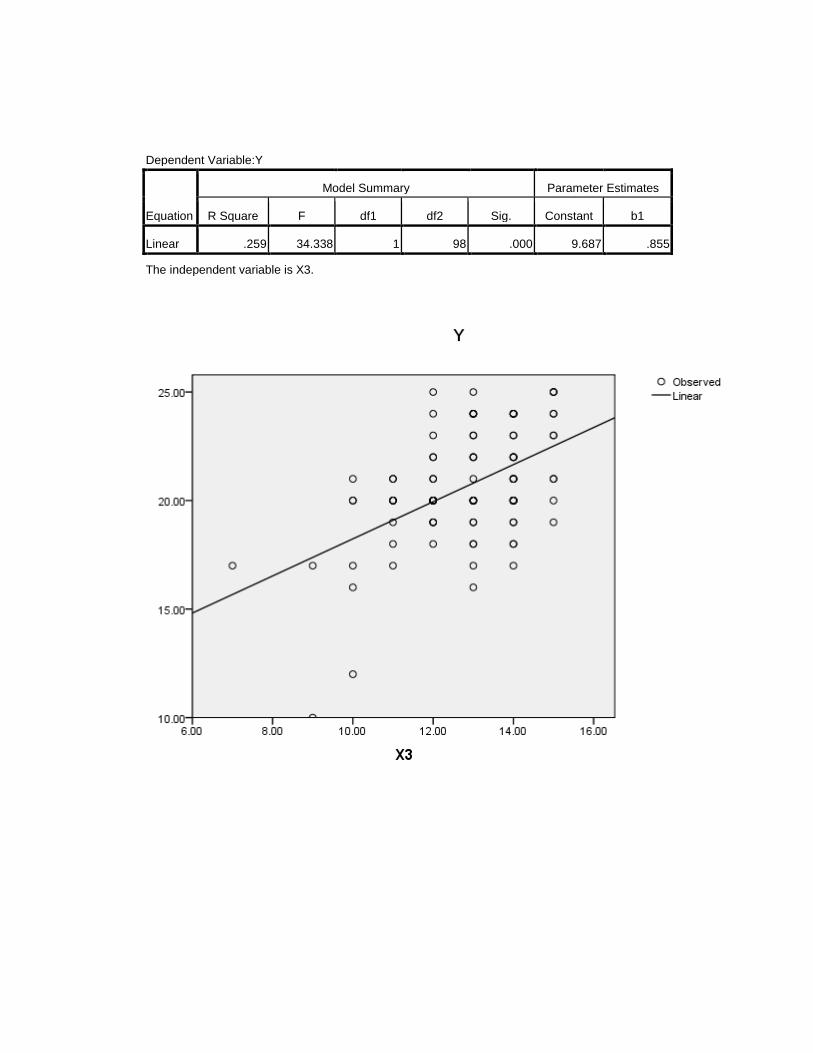
Dependent Variable:Y
Equation
Model Summary Parameter Estimates
R Square F df1 df2 Sig. Constant b1
Linear .259 34.338 1 98 .000 9.687 .855
The independent variable is X3.
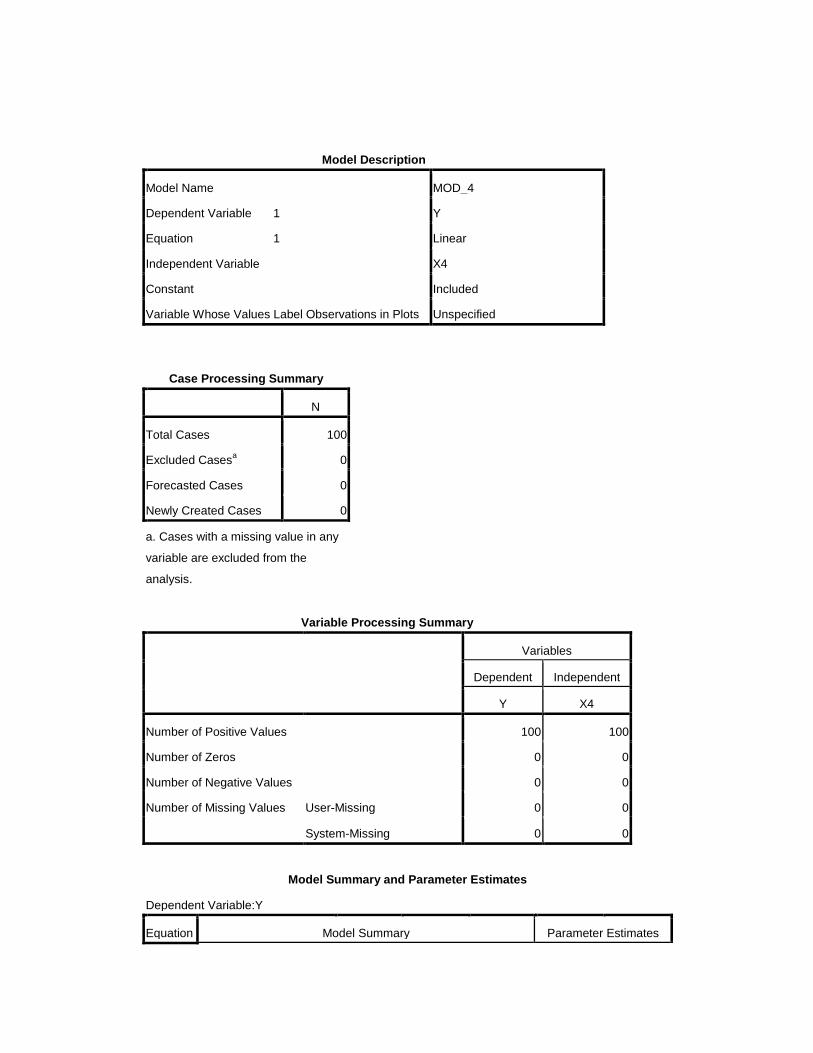
Model Description
Model Name MOD_4
Dependent Variable 1 Y
Equation 1 Linear
Independent Variable X4
Constant Included
Variable Whose Values Label Observations in Plots Unspecified
Case Processing Summary
N
Total Cases 100
Excluded Casesa 0
Forecasted Cases 0
Newly Created Cases 0
a. Cases with a missing value in any
variable are excluded from the
analysis.
Variable Processing Summary
Variables
Dependent Independent
Y X4
Number of Positive Values 100 100
Number of Zeros 0 0
Number of Negative Values 0 0
Number of Missing Values User-Missing 0 0
System-Missing 0 0
Model Summary and Parameter Estimates
Dependent Variable:Y
Equation Model Summary Parameter Estimates

R Square F df1 df2 Sig. Constant b1
Linear .249 32.478 1 98 .000 11.026 .737
The independent variable is X4.
Model Description
Model Name MOD_5
Dependent Variable 1 Y
Equation 1 Linear
Independent Variable X5
Constant Included
Variable Whose Values Label Observations in Plots Unspecified

Case Processing Summary
N
Total Cases 100
Excluded Casesa 0
Forecasted Cases 0
Newly Created Cases 0
a. Cases with a missing value in any
variable are excluded from the
analysis.
Variable Processing Summary
Variables
Dependent Independent
Y X5
Number of Positive Values 100 100
Number of Zeros 0 0
Number of Negative Values 0 0
Number of Missing Values User-Missing 0 0
System-Missing 0 0
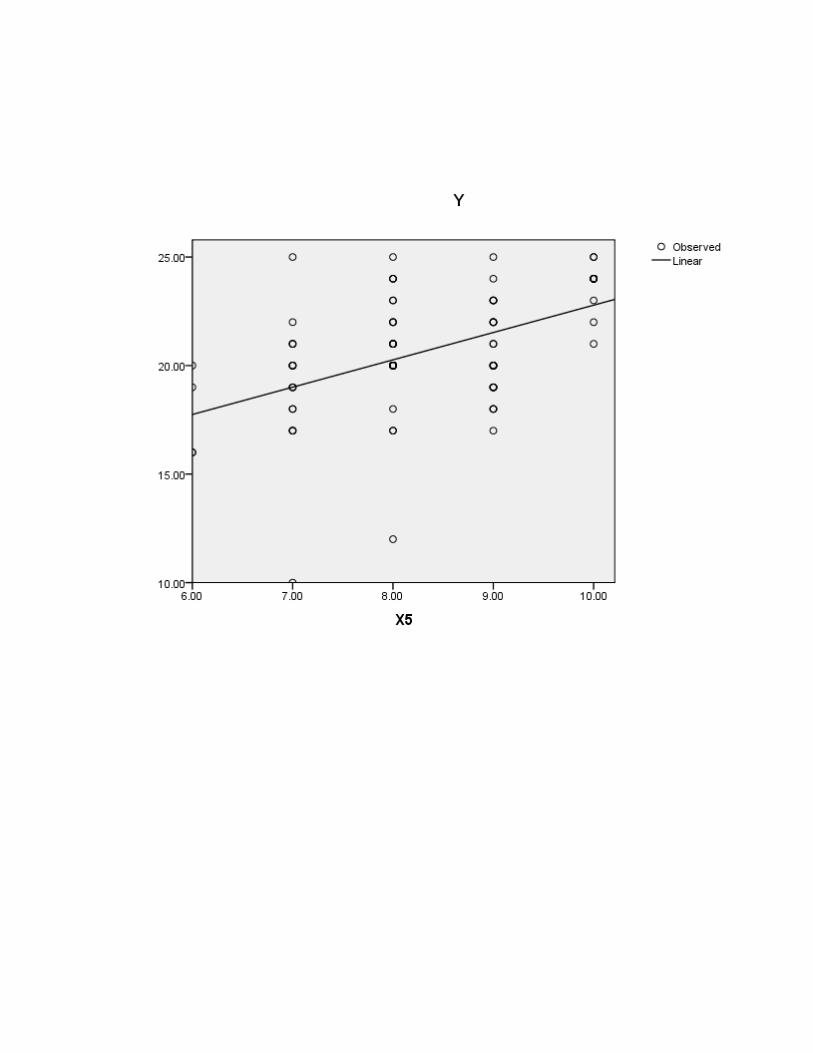
Model Summary and Parameter Estimates
Dependent Variable:Y
Equation
Model Summary Parameter Estimates
R Square F df1 df2 Sig. Constant b1
Linear .250 32.752 1 98 .000 10.192 1.259
The independent variable is X5.
KEMENTERIAN AGAMA
UNIVERSITAS ISLAM NEGERI MAULANA MALIK IBRAHIM MALANG
FAKULTAS EKONOMI
JURUSAN MANAJEMEN Terakreditasi “A”SK BAN-PT Depdiknas Nomor : 024/BAN-PT/ Ak-X/S1/II/2013 Jalan
Gajahyana 50 Malang 65144 Telepon (0341) 558881, Faksimile (0341) 558881
http://www.ekonomi.uin-malang.ac.id; e-mail: [email protected]
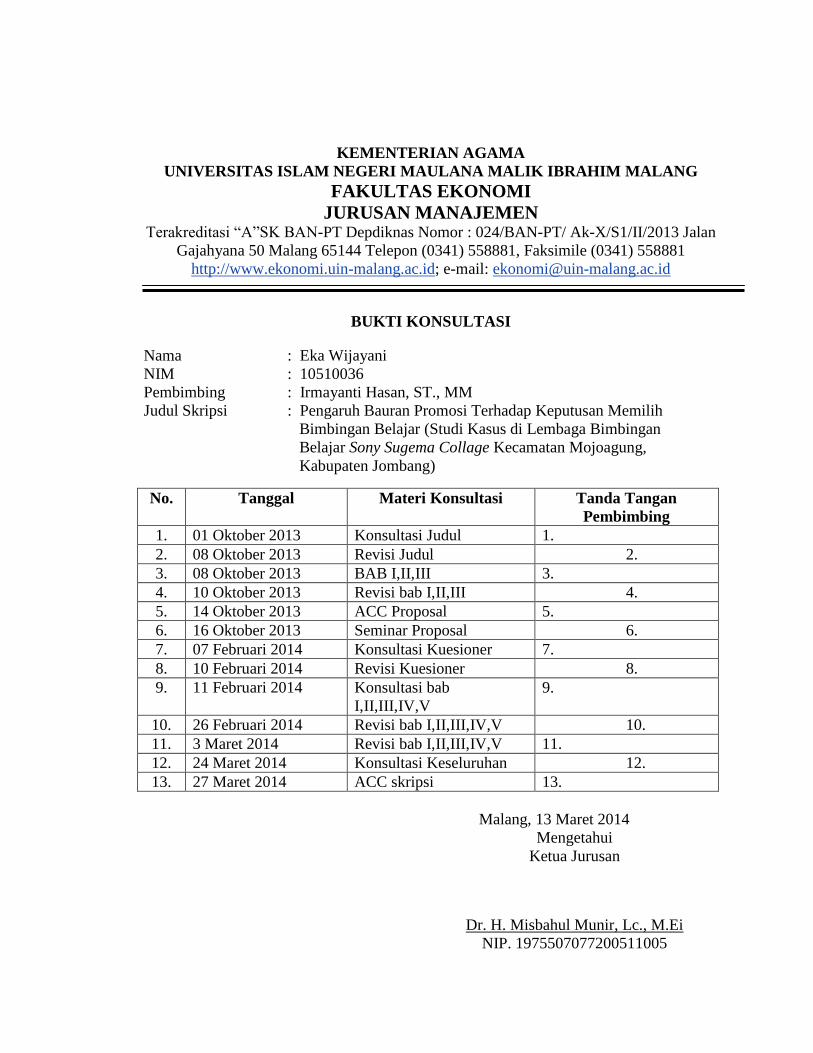
BUKTI KONSULTASI
Nama : Eka Wijayani
NIM : 10510036
Pembimbing : Irmayanti Hasan, ST., MM
Judul Skripsi : Pengaruh Bauran Promosi Terhadap Keputusan Memilih
Bimbingan Belajar (Studi Kasus di Lembaga Bimbingan
Belajar Sony Sugema Collage Kecamatan Mojoagung,
Kabupaten Jombang)
No. Tanggal Materi Konsultasi Tanda Tangan
Pembimbing
1. 01 Oktober 2013 Konsultasi Judul 1.
2. 08 Oktober 2013 Revisi Judul 2.
3. 08 Oktober 2013 BAB I,II,III 3.
4. 10 Oktober 2013 Revisi bab I,II,III 4.
5. 14 Oktober 2013 ACC Proposal 5.
6. 16 Oktober 2013 Seminar Proposal 6.
7. 07 Februari 2014 Konsultasi Kuesioner 7.
8. 10 Februari 2014 Revisi Kuesioner 8.
9. 11 Februari 2014 Konsultasi bab
I,II,III,IV,V
9.
10. 26 Februari 2014 Revisi bab I,II,III,IV,V 10.
11. 3 Maret 2014 Revisi bab I,II,III,IV,V 11.
12. 24 Maret 2014 Konsultasi Keseluruhan 12.
13. 27 Maret 2014 ACC skripsi 13.
Malang, 13 Maret 2014
Mengetahui
Ketua Jurusan
Dr. H. Misbahul Munir, Lc., M.Ei
NIP. 1975507077200511005
BIODATA PENELITI
Nama Lengkap : Eka Wijayani
Tempat, tanggal lahir : Jombang, 02 Juni 1991
Usia : 22 tahun
Alamat Asal : Mojoagung, Jombang
Alamat Malang : Jl. Sunan Kalijaga Dalam Kav.A3
e-mail : [email protected]
PENDIDIKAN FORMAL
1996 – 1998 : TK Tunas Harapan Mojoagung, Jombang
1998 – 2001 : SDN Miagan 2, Mojoagung, Jombang
2001 – 2004 : SMPN 1 Mojoagung, Jombang
2004 – 2010 : SMAN Mojoagung, Jombang
2010 – 2014 : Universitas Islam Negeri Maulana Malik Ibrahim Malang
PENDIDIKAN NON FORMAL
2010 – 2011 : Program Khusus Perkuliahan Bahasa Arab Universitas
Islam Negeri Maulana Malik Ibrahim Malang
2012 : Program Khusus Perkuliahan Bahasa Inggris
Universitas Islam Negeri Maualan Malik Ibrahim
Malang
Recommended