Lap splice over a grouted joint in a lattice girder system K. Lundgren Published in Magazine of Concrete Research, see journal homepage http://www.icevirtuallibrary.com/content/journals “Permission is granted by ICE Publishing to print one copy for personal use. Any other use of these PDF files is subject to reprint fees.”

Delivered by ICEVirtualLibrary.com to:
IP: 129.16.183.37
On: Mon, 30 Aug 2010 14:41:40
Lap splice over a grouted joint in a lattice
girder system
K. Lundgren
Chalmers University of Technology
Load-carrying in two directions in lattice girder slab systems by complementing with lapped reinforcement across
the joints at the construction site was studied. A detailing of load-carrying joints without any reinforcement across
the cast joint was considered. The behaviour of the cast joint between the precast concrete and the in situ cast
concrete is very important. Two different surface treatments were tested in two types of detail tests of the cast joint:
one type in which the cast joint was loaded in shear, and one in tension. Furthermore, the detailing of the joint
between two precast concrete panels was tested in bending in full-scale tests. The detail tests were used to calibrate
a friction model of the cast joint, which was then used in finite-element analyses (FEAs) of the full-scale tests. In
the full-scale tests, the joints were strong enough to carry the applied load; thus, the failure mode was rupture of
the reinforcement in all full-scale tests, and only one crack occurred—in the in situ cast concrete above the joint
between the precast elements. However, the FEAs of the full-scale tests revealed that the detailing was sensitive to
secondary cracking.
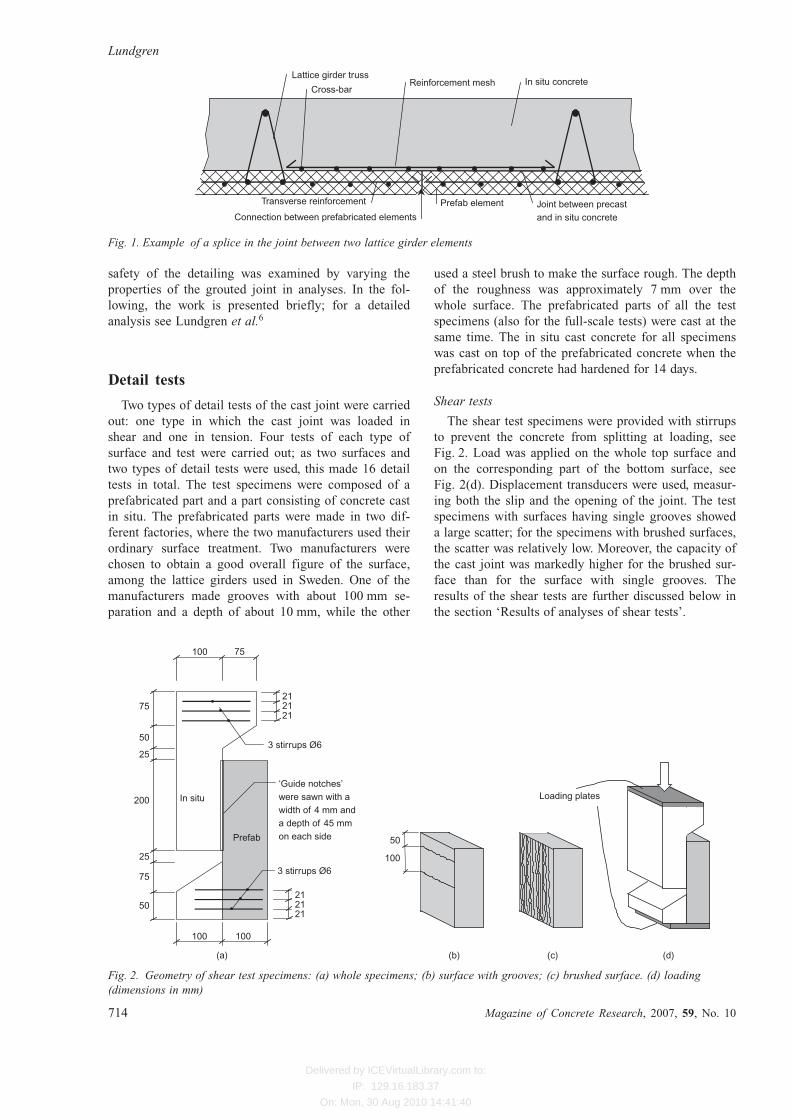
Introduction
To enable load carrying in two directions in lattice
girder systems, transverse reinforcement in the precast
concrete panels needs to be complemented with lapped
reinforcement across the joints at the construction site.
To ease production, it would be beneficial not to have
any reinforcement across the cast joint between the
precast concrete and the in situ cast concrete, as shown
in Fig. 1. However, this raises questions as to whether
the cast joint can transfer the required forces. This was
addressed in the present project. In the studied detailing
of the joint, a reinforcement mesh was placed in the in
situ concrete across the joint, directly on the surface of
the precast elements.
In Lundgren,1 similar joints were studied using two-
dimensional non-linear finite-element analyses (FEA).
The behaviour of the cast joint was described using a
friction model, calibrated from tests on grouted joints
carried out by Nissen et al.2 It was concluded that the
behaviour of the cast joint was very important for the
detailing. More experiments on grouted joints loaded
in shear have been done by, for example, Gohnert.3
Gudmand-Høyer4,5 carried out tests on a detailing simi-
lar to the one studied here. It was a ‘bubbledeck’
intended to be used for load carrying in two directions,
including shear stress transfer through a cast joint with-
out crossing reinforcement. The tests resulted in brittle
failures of the cast joints, which is naturally undesired
behaviour. Therefore, further studies were needed to
investigate whether it is possible to obtain safe solu-
tions with such design of joints.
The behaviour of the joint was studied through a
combination of experiments and non-linear FEAs. The
main reason for this choice of method were to investi-
gate the safety of the studied detail; it was judged that
brittle failure by opening of the grouted joint must be
avoided with a large safety margin. If this were to be
investigated through experiments only, a large number
of full-scale tests would be needed to ensure that the
safety margin against premature brittle failure is large
enough. Therefore, detail tests of the cast joint between
the precast and the in situ concrete were carried out; by
analysing these tests, a friction model of the cast joint
could be calibrated. This model was then used in ana-
lyses of a lattice girder structure, which was also tested
in full-scale experiments. Two types of surfaces of the
precast elements were tested and analysed: a brushed
surface and a surface with single grooves. Finally, the
Department of Civil and Environmental Engineering, Division of
Structural Engineering, Concrete Structures, Chalmers University of
Technology, SE-412 96 Goteborg, Sweden
(MCR 600015) Paper received 2 November 2006; last revised 17
April 2007; accepted 4 June 2007
Magazine of Concrete Research, 2007, 59, No. 10, December, 713–727
doi: 10.1680/macr.2007.59.10.713
713
www.concrete-research.com 1751-763X (Online) 0024-9831 (Print) # 2007 Thomas Telford Ltd
Delivered by ICEVirtualLibrary.com to:
IP: 129.16.183.37
On: Mon, 30 Aug 2010 14:41:40
safety of the detailing was examined by varying the
properties of the grouted joint in analyses. In the fol-
lowing, the work is presented briefly; for a detailed
analysis see Lundgren et al.6
Detail tests
Two types of detail tests of the cast joint were carried
out: one type in which the cast joint was loaded in
shear and one in tension. Four tests of each type of
surface and test were carried out; as two surfaces and
two types of detail tests were used, this made 16 detail
tests in total. The test specimens were composed of a
prefabricated part and a part consisting of concrete cast
in situ. The prefabricated parts were made in two dif-
ferent factories, where the two manufacturers used their
ordinary surface treatment. Two manufacturers were
chosen to obtain a good overall figure of the surface,
among the lattice girders used in Sweden. One of the
manufacturers made grooves with about 100 mm se-
paration and a depth of about 10 mm, while the other
used a steel brush to make the surface rough. The depth
of the roughness was approximately 7 mm over the
whole surface. The prefabricated parts of all the test
specimens (also for the full-scale tests) were cast at the
same time. The in situ cast concrete for all specimens
was cast on top of the prefabricated concrete when the
prefabricated concrete had hardened for 14 days.
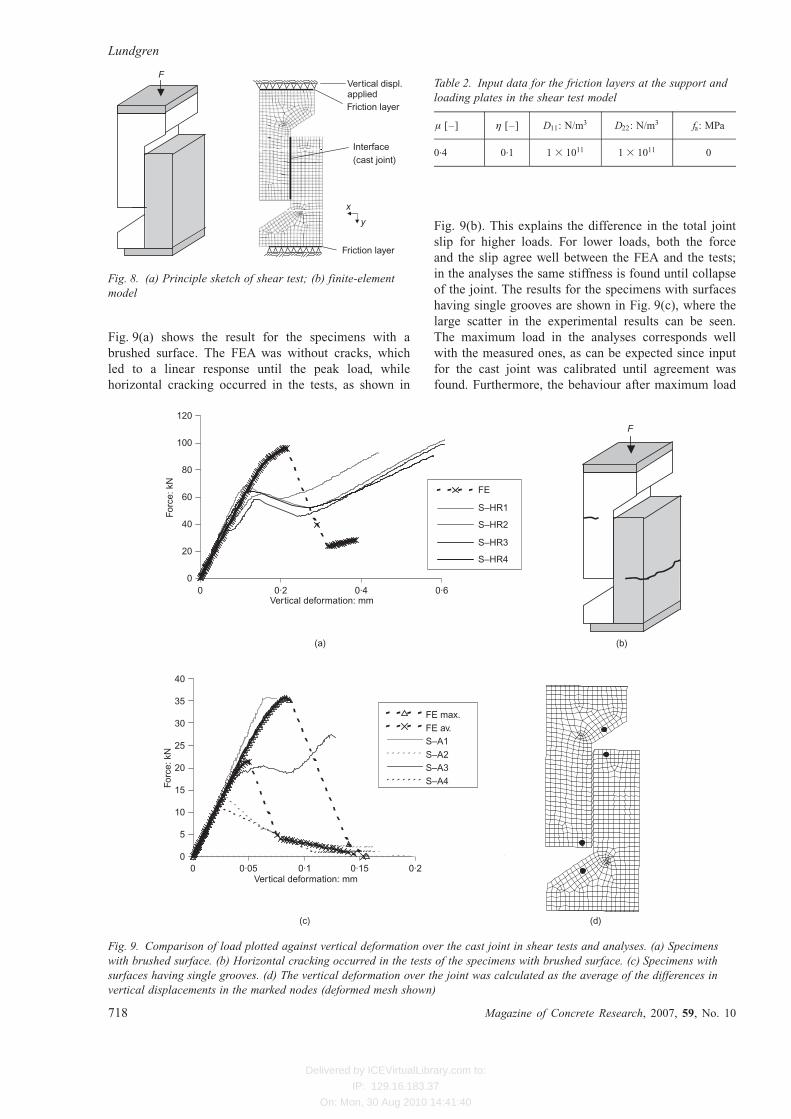
Shear tests
The shear test specimens were provided with stirrups
to prevent the concrete from splitting at loading, see
Fig. 2. Load was applied on the whole top surface and
on the corresponding part of the bottom surface, see
Fig. 2(d). Displacement transducers were used, measur-
ing both the slip and the opening of the joint. The test
specimens with surfaces having single grooves showed
a large scatter; for the specimens with brushed surfaces,
the scatter was relatively low. Moreover, the capacity of
the cast joint was markedly higher for the brushed sur-
face than for the surface with single grooves. The
results of the shear tests are further discussed below in
the section ‘Results of analyses of shear tests’.
Joint between precastand in situ concrete
Cross-barReinforcement mesh
Lattice girder truss
Prefab element
In situ concrete
Transverse reinforcement
Connection between prefabricated elements
Fig. 1. Example of a splice in the joint between two lattice girder elements
In situ
Prefab
75
50
25
200
25
50
75
100
75100
212121
212121
3 stirrups Ø6
‘Guide notches’were sawn with awidth of 4 mm anda depth of 45 mmon each side
3 stirrups Ø6100
(b)(a) (c)
50
Loading plates
(d)
100
Fig. 2. Geometry of shear test specimens: (a) whole specimens; (b) surface with grooves; (c) brushed surface. (d) loading
(dimensions in mm)
Lundgren
714 Magazine of Concrete Research, 2007, 59, No. 10

Delivered by ICEVirtualLibrary.com to:
IP: 129.16.183.37
On: Mon, 30 Aug 2010 14:41:40
Wedge split tests
The wedge split test (WST) was proposed by Lins-
bauer and Tschegg7 to measure the fracture energy
(GF) for homogeneous concrete, and has proved to be a
reliable test method. In this project, the WST was used
to increase knowledge of the joint behaviour for tensile
loading; the adhesive strength and fracture energy of
the joint could be evaluated. In total, eight WSTs were
carried out. As with the shear test specimens, two dif-
ferent treatments of the prefabricated surfaces were
used. The test specimens consisted principally of
200 3 200 3 150 mm3 cubes, where half of the speci-
mens were of prefabricated and half in situ cast con-
crete; see Fig. 3, where a schematic procedure of the
test set-up is shown.
Two steel plates with roller bearings were placed on
top of the wedge test specimens. The splitting force
was applied through a wedging device. Throughout the
tests, the vertical load Fv, the crack mouth opening
displacement (CMOD) and the horizontal displacement
were measured at the same level as the applied load.
The applied horizontal splitting force Fsp was calcu-
lated from the measured vertical load, assuming the
coefficient of friction for the roller bearing to be negli-
gible; according to Karihaloo8 it normally varies be-
tween 0.1% and 0.5%.
The behaviour of the WSTs was similar for both
types of surface, with small scatter in the results. The
difference was the maximum load, which was about
twice as high for specimens with a brushed surface as
for specimens with grooves. The results of the WSTs
are further discussed in the section ‘Results of analyses
of wedge split tests’.
Analyses to calibrate a model of the joint
behaviour
The detail tests were used to calibrate a friction
model of the cast joint. Therefore, non-linear FEAs
were used to model the detail tests. The program
25100
25
(b)
(c) (d)
Prefab
Prefab
28
Fv
In situPrefab
FspFsp
CMOD
200
200
2278
100
200
200
200
4
150
(a) (e) (f)Fig. 3. WST specimens: (a) measurements; (b) three-dimensional sketch; (c) surface with grooves; (d) brushed surface; (e)
measurement of CMOD; ( f ) loading (dimensions in mm)
Lap splice over a grouted joint in a lattice girder system
Magazine of Concrete Research, 2007, 59, No. 10 715

Delivered by ICEVirtualLibrary.com to:
IP: 129.16.183.37
On: Mon, 30 Aug 2010 14:41:40
DIANA 8.1.2 was used in all analyses. All modelling
was made in two dimensions, assuming plane stress.
The concrete was modelled with four-node quadrilat-
eral isoparametric plane stress elements. The cast joint
was modelled with interface elements, with separate
nodes for the precast and the in situ cast concrete, see
Fig. 4. The concrete was modelled with a constitutive
model based on non-linear fracture mechanics. The
smeared crack concept was used, together with a rotat-
ing crack model based on total strain, see TNO.9 The
deformation of one crack was smeared out over one
element. The compressive strength measured in cylin-
der tests was used as input data in the analyses, ranging
from 40.8 to 56.7 MPa. From the measured compres-
sive strengths, the Young’s modulus, tensile strength
and fracture energy were calculated according to
Comite Europeen du Beton (CEB).10 Long-term effects
such as creep and shrinkage were not included. Since
these would have an influence when the joint is sub-
jected to sustained tensile loading, these simplifications
need further studies.
Model of the joint behaviour
The modelling of the joint interaction between the
precast and the in situ cast concrete was of great
importance for the results of the analyses. A friction
model including adhesion was used, where the shear
stresses, �, are limited in relation to the normal stresses,
�n, as
�j j þ � �n � f að Þ ¼ 0 (1)
where
� is the shear stress
� is the coefficient of friction
�n is the normal stress acting on the interface, here
defined as negative when in compression
fa is the adhesive strength.
The friction model is shown in Fig. 5. The coeffi-
cient of friction, �, was assumed to be constant, while
the adhesive strength, fa, was assumed to decrease at
hardening. The hardening parameter k was defined
from the resulting plastic deformations by
_kk ¼ffiffiffiffiffiffiffiffiffiffiffiffiffiffiffiffiffiffiffiffi_uu p2
n þ _uu p2
t
q(2)
where _uu pn is the plastic part of the normal deformation
over the joint and _uu pt is the plastic part of the slip over
the joint.
Important parameters in this model are the adhesive
strength, fa, and coefficient of friction, �. Other para-
meters needed were the dilation parameter � and elastic
stiffnesses D11 and D22. The dilation parameter � de-
scribes the magnitude of normal stresses that are cre-
ated during slip if normal deformation is prevented, or
the magnitude of normal deformations that will take
place during slip if no normal stress is present. The
stiffnesses D11 and D22 describe the relation between
the stresses and the deformations in the elastic range:
D11 for the stress and the deformation in the normal
direction, and D22 for the shear stress and slip.
Calibration procedure
The adhesive strength fa was evaluated and calibrated
with the results from the WSTs. Thereafter, the coeffi-
cient of friction was evaluated and calibrated with the
shear test results. Initially, all calibrations were made
on average values of the experimental results. However,
the test specimens with grooves in the prefabricated
surface showed a large scatter in the shear test results;
therefore two differently calibrated models were used
for those. They used average and maximum values of
the strength, respectively.
The results from the WSTs were organised and stud-
ied with inverse analysis, see Østergaard.11 The inverse
analysis resulted in a bilinear relationship between the
opening of the joint and the adhesive strength. As the
shear stresses and deformations could be assumed to be
negligible in the WSTs, only normal stresses and defor-
mations took place. Therefore, the opening is approxi-
mately equal to the hardening parameter k; thus, the
hardening function for the adhesive strength, fa(k),could be evaluated. This provided starting values for
the input for the FEA, and was later calibrated to more
exact values. The fracture energy of the joint, GF, was
determined as the area under the bilinear plot, see
Fig. 6.
The elastic stiffness D11 must be chosen so large that
the elastic normal deformations in the WSTs are very
In situ castconcrete
Precastconcrete
Interfaceelements
Fig. 4. Modelling with two-dimensional solid elements
describing the concrete and interface elements describing the
cast joint
Normal
stress ( )σn
Shear
stress ( )τ
1 fa
µ
Fig. 5. Friction model used for the interface between the
precast and the in situ cast concrete
Lundgren
716 Magazine of Concrete Research, 2007, 59, No. 10

Delivered by ICEVirtualLibrary.com to:
IP: 129.16.183.37
On: Mon, 30 Aug 2010 14:41:40
small. It was chosen to be 3 3 1011 N/m3 for both types
of surface.
Next, the shear test results were carefully examined.
An approximate maximum shear stress was determined
through the value of the peak load divided by the shear
area. From the WST calibration, a value of fa at maxi-
mum was achieved. As no outer normal stress was
applied in the shear tests, it was assumed that the
normal stress, �n, was zero; this is an approximation as
there can be normal stress locally in the joint, while the
overall equilibrium demands that the average normal
stress is zero. By inserting these approximations in
equation (1), an approximate value of the coefficient of
friction, �, was obtained. After that, � was adjusted to
get the FEA to correspond to the experiments. The
calibrated value of � was 3.7 for the brushed surface
and 1.3 and 2.1 for the surface with single grooves,
average and maximum values respectively, see Fig. 7.
In a first step, an approximate value of the elastic
stiffness D22 was determined by the elastic stiffness in
the test results, from the shear stress divided by the
shear deformation. The elastic stiffness D22 was then
adjusted until the stiffness of the elastic part corre-
sponded between the FEA and the experiments. The
calibrated values of D22 were 4.0 3 1010 N/m3 for the
brushed surface and 3.5 3 1010 N/m3 for the surface
with single grooves. Final calibrated parameters for all
different cases are listed in Table 1.
Model of shear tests
The mesh and boundary conditions of the shear test
model are shown in Fig. 8. The mesh size was 10 mm;
the thickness out of plane was 200 mm for the concrete
elements and 110 mm for the cast joint layer. Friction
layers were modelled at the support and loading plates.
The nodes representing the loading plates were tied in
all directions. Loading was controlled by applying a
vertical displacement on the nodes at the top represent-
ing the loading plate. Chosen input data for the friction
layers at the support and loading plates are shown in
Table 2.
Results of analyses of shear tests
The load plotted against vertical joint slip from the
FEA and the shear tests is presented in Fig. 9. The
vertical joint slip in the analyses was evaluated simi-
larly to how it was measured in the tests, to ease the
comparison. It was calculated as the difference in dis-
placements in nodes that were situated where the meas-
uring devices were placed in the tests; see Fig. 9(d).
fa1
0
fa
0
0·5
1
1·5
2
Grooves av.
Brushed
Grooves max.
f a: M
Pa
fa2
GF � ∫κ
0
fa( )dκ κ
κ2 κ3 κ(a)
0 0·1 0·2κ : mm
(b)
Fig. 6. (a) Bilinear relationship between the adhesive
strength and the hardening parameter and (b) calibrated
values of adhesive strength plotted against hardening
parameter
�6
�4
�2
0
2
4
6Brushed
Grooves av.
Grooves max.
τ: MPa
�4 �2 0 2σn: MPa
Fig. 7. Friction model for all three cases
Table 1. Calibrated parameters of the joint model, input for
FEA
Parameter Brushed,
average
Grooves,
average
Grooves, max.
� [–] 3.7 1.3 2.1
� [–] 0.5 0.5 0.5
D11: N/m3 3 3 1011 3 3 1011 3 3 1011
D22: N/m3 4 3 1010 3.5 3 1010 3.5 3 1010
fa1: MPa 1.58 0.69 0.75
k1: mm 0 0 0
fa2: MPa 0.599 0.109 0.109
k2: mm 0.033 0.05 0.05
fa3: MPa 0 0 0
k3: mm 0.11 0.17 0.17
GF: N/m 59 27 29
Lap splice over a grouted joint in a lattice girder system
Magazine of Concrete Research, 2007, 59, No. 10 717
Delivered by ICEVirtualLibrary.com to:
IP: 129.16.183.37
On: Mon, 30 Aug 2010 14:41:40
Fig. 9(a) shows the result for the specimens with a
brushed surface. The FEA was without cracks, which
led to a linear response until the peak load, while
horizontal cracking occurred in the tests, as shown in
Fig. 9(b). This explains the difference in the total joint
slip for higher loads. For lower loads, both the force
and the slip agree well between the FEA and the tests;
in the analyses the same stiffness is found until collapse
of the joint. The results for the specimens with surfaces
having single grooves are shown in Fig. 9(c), where the
large scatter in the experimental results can be seen.
The maximum load in the analyses corresponds well
with the measured ones, as can be expected since input
for the cast joint was calibrated until agreement was
found. Furthermore, the behaviour after maximum load
FVertical displ.applied
.
x
y
Friction layer
Friction layer
Interface(cast joint)
Fig. 8. (a) Principle sketch of shear test; (b) finite-element
model
Table 2. Input data for the friction layers at the support and
loading plates in the shear test model
� [–] � [–] D11: N/m3 D22: N/m
3 fa: MPa
0.4 0.1 1 3 1011 1 3 1011 0
0
20
40
60
80
100
120
FE
S–HR1
S HR2–
S HR3–
S HR4–
Forc
e: k
NFo
rce:
kN
Vertical deformation: mm
F
FE max.
FE av.
S–A1
S A2–
S A3–
S A4–
Vertical deformation: mm
0 0·2 0·4 0·6
(a) (b)
0
5
10
15
20
25
30
35
40
0 0·05 0·1 0·15 0·2
(c) (d)
Fig. 9. Comparison of load plotted against vertical deformation over the cast joint in shear tests and analyses. (a) Specimens
with brushed surface. (b) Horizontal cracking occurred in the tests of the specimens with brushed surface. (c) Specimens with
surfaces having single grooves. (d) The vertical deformation over the joint was calculated as the average of the differences in
vertical displacements in the marked nodes (deformed mesh shown)
Lundgren
718 Magazine of Concrete Research, 2007, 59, No. 10

Delivered by ICEVirtualLibrary.com to:
IP: 129.16.183.37
On: Mon, 30 Aug 2010 14:41:40
was very brittle in the analyses; in the tests it could
seldom be followed, as it was too brittle.
The normal deformations over the cast joint obtained
in the FEA and the experiments are compared in
Fig. 10. Slightly larger horizontal deformations were
measured in the tests than were obtained in the ana-
lyses. However, the trend with increasing horizontal
deformation just before and especially at maximum
load is similar.
Model of wedge split tests
The geometry of the WST was modelled as shown in
Fig. 11, with mesh size of 8 mm. The support in the
bottom of the WSTwas modelled by locking respective
nodes in the y-direction and the two nodes in the centre
locked in the x-direction. Interface elements were used
to model the cast joint between the precast and in situ
cast concrete.
Results of analyses of wedge split tests
The load plotted against CMOD for the WSTs and
their FEAs are compared in Fig. 12. As can be seen,
the results correspond well, which indicates that the
parameters of the joint are properly calibrated. The
analyses converged until the CMOD was 0.2 mm for
the brushed surface and 0.15 mm for the surface with
grooves; as can be seen in Fig. 12, the solutions there-
after were unstable.
0
20
40
60
80
100
120
FES–HR1S HR2–S HR3–S HR4–
Forc
e: k
N
Horizontal deformation: mm(a)
0
10
20
30
40 FE max.FE av.S–A1S A2–S A3–S A4–
0 0·02 0·04 0·06
Forc
e: k
N
0 0·01 0·02 0·03 0·04Horizontal deformation: mm
(b) (c)
Fig. 10. Comparison of load plotted against horizontal
deformation over the cast joint in shear tests and analyses:
(a) specimens with brushed surface; (b) specimens with
surfaces having single grooves; (c) the horizontal deformation
over the joint was calculated as the average of the differences
in horizontal displacements in the marked nodes (deformed
mesh shown)
Interface(cast joint)
Support
Fsp
Fv/2
Fsp
Fv/2
(a)
(b)
Fig. 11. (a) Principle sketch of WST; (b) finite-element model
0
0·5
1
1·5
2
2·5FE
W–H1
W H2–
W H3–
W H4–
Load
: kN
Load
: kN
CMOD: mm(a)
CMOD: mm(b)
0
0·2
0·4
0·6
0·8
1 0·
1·2
0 0·5 1
W–A1
W A2–
W A3–
W A4–
FE max.
FE av.
0 0·5 1
Fig. 12. Load plotted against CMOD for WSTs and FEAs of
them: (a) specimens with brushed surface; (b) specimens with
surfaces having single grooves
Lap splice over a grouted joint in a lattice girder system
Magazine of Concrete Research, 2007, 59, No. 10 719

Delivered by ICEVirtualLibrary.com to:
IP: 129.16.183.37
On: Mon, 30 Aug 2010 14:41:40
Full-scale tests and analyses
The detailing of the joint between two precast con-
crete panels was tested in bending in full-scale tests.
Three tests of each surface were carried out; as two
surfaces were investigated, this required a total of six
full-scale tests.
Test specimens
The geometry of the full-scale tests was lattice gir-
ders composed of two precast elements next to each
other, with a reinforcement mesh placed directly on the
surface over the joint. Concrete was cast in situ on top,
see Fig. 13. The test specimens had a total width of
500 mm in the plane. The compressive strength of the
concrete was tested on wet stored cylinders,
150 3 300 mm2. The properties of the reinforcement
mesh were tested in tensile tests.
Test set-up and results
The full-scale tests were performed to study the
structural behaviour of the joint in the lattice girder
structure. The test specimens were loaded by two point
loads in four-point bending, see Fig. 14. Strain gauges
were placed on the centre bars of the reinforcement
meshes.
The structural behaviour was similar for all six full-
scale tests, with only one crack in all tests, at mid-span
in the in situ cast concrete over the joint. The failure
mode was rupture of the reinforcement bars in all tests.
A typical load plotted against deformation plot is
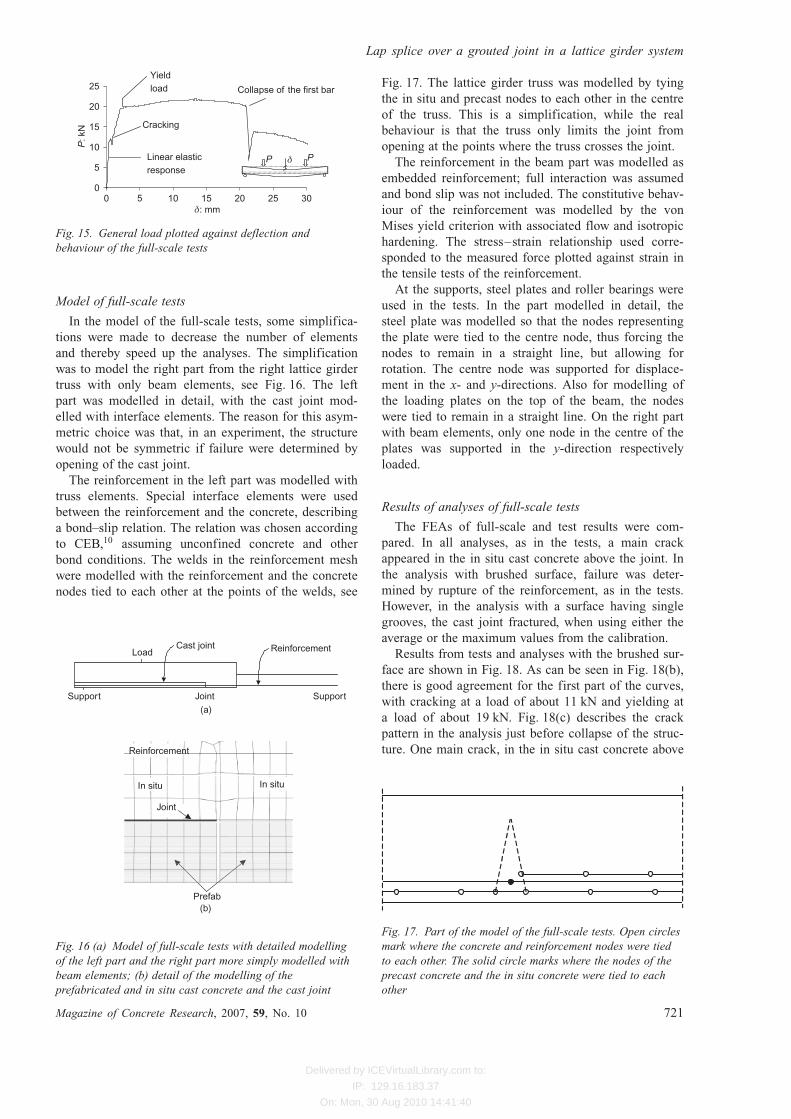
shown in Fig. 15. The structural behaviour corre-
sponded to linear elastic response until a load of about
11 kN. Instantly, the first crack appeared and the load
made a small dip. Thereafter, load and deflection in-
creased to the values of approximately 18–20 kN and
1.6–1.9 mm respectively. At this load, yielding of the
reinforcement occurred and the initiated crack propa-
gated. At the yielding stage, the load remained almost
constant, besides a very small increase of load owing to
hardening of the steel. Semi-collapse occurred when
one of the longitudinal bars ruptured at the load, ap-
proximately at 20 kN and deflection about 18–21 mm.
The remaining longitudinal bars provided further load-
carrying capacity under a decreasing load until they
also ruptured. Total collapse of the structure occurred
at a deflection of about 28–33 mm. The results from
the tests are further described in the section ‘Results of
analyses of full-scale tests’.
1350 1350
(a)
3Ø8 s150 NPs 500
3Ø8 s150 NPs 500
c 15�
50
247
400
35
Girder truss Ø6, 175 high
Ø8
(b)
Fig. 13. Geometry of the tested lattice girder structure: (a) overview; (b) detail at the joint (dimensions in mm)
500600100
2700
P P
150 600500 150
1, 6
100
2, 7 3, 8 4, 9 5, 10
Fig. 14. Test set-up with displacement transducers and loads (dimensions in mm)
Lundgren
720 Magazine of Concrete Research, 2007, 59, No. 10
Delivered by ICEVirtualLibrary.com to:
IP: 129.16.183.37
On: Mon, 30 Aug 2010 14:41:40
Model of full-scale tests
In the model of the full-scale tests, some simplifica-
tions were made to decrease the number of elements
and thereby speed up the analyses. The simplification
was to model the right part from the right lattice girder
truss with only beam elements, see Fig. 16. The left
part was modelled in detail, with the cast joint mod-
elled with interface elements. The reason for this asym-
metric choice was that, in an experiment, the structure
would not be symmetric if failure were determined by
opening of the cast joint.
The reinforcement in the left part was modelled with
truss elements. Special interface elements were used
between the reinforcement and the concrete, describing
a bond–slip relation. The relation was chosen according
to CEB,10 assuming unconfined concrete and other
bond conditions. The welds in the reinforcement mesh
were modelled with the reinforcement and the concrete
nodes tied to each other at the points of the welds, see
Fig. 17. The lattice girder truss was modelled by tying
the in situ and precast nodes to each other in the centre
of the truss. This is a simplification, while the real
behaviour is that the truss only limits the joint from
opening at the points where the truss crosses the joint.
The reinforcement in the beam part was modelled as
embedded reinforcement; full interaction was assumed
and bond slip was not included. The constitutive behav-
iour of the reinforcement was modelled by the von
Mises yield criterion with associated flow and isotropic
hardening. The stress–strain relationship used corre-
sponded to the measured force plotted against strain in
the tensile tests of the reinforcement.
At the supports, steel plates and roller bearings were
used in the tests. In the part modelled in detail, the
steel plate was modelled so that the nodes representing
the plate were tied to the centre node, thus forcing the
nodes to remain in a straight line, but allowing for
rotation. The centre node was supported for displace-
ment in the x- and y-directions. Also for modelling of
the loading plates on the top of the beam, the nodes
were tied to remain in a straight line. On the right part
with beam elements, only one node in the centre of the
plates was supported in the y-direction respectively
loaded.
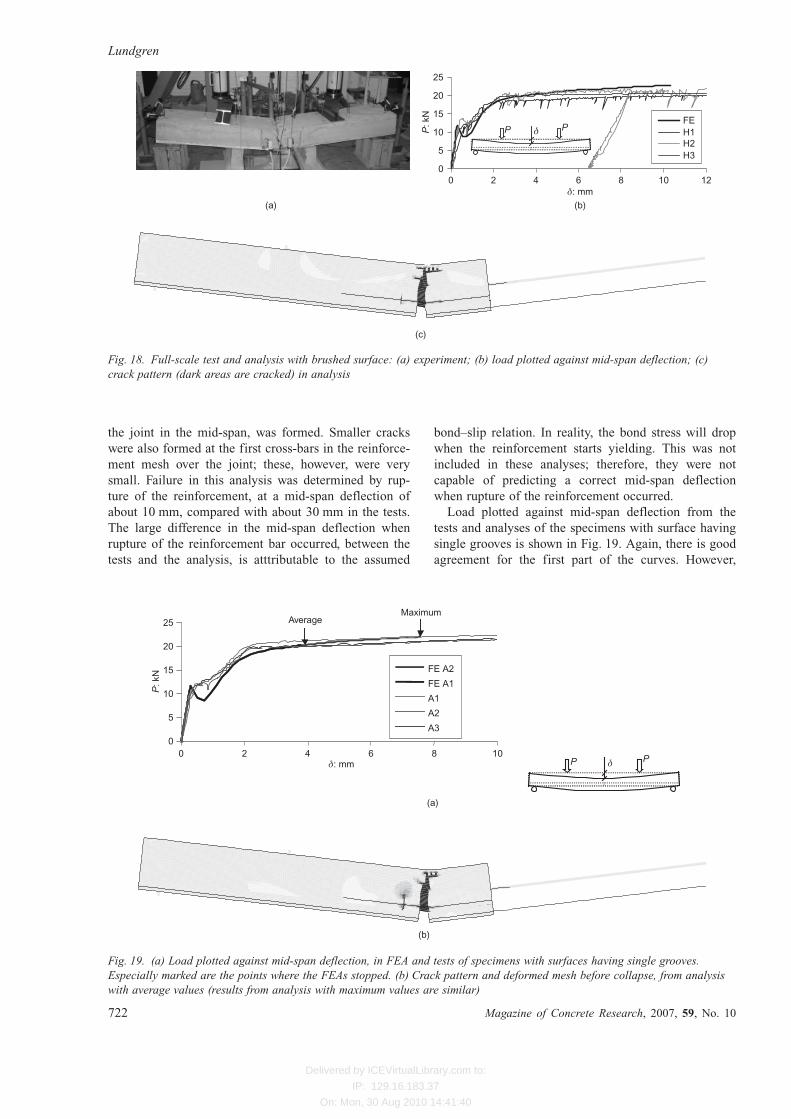
Results of analyses of full-scale tests
The FEAs of full-scale and test results were com-
pared. In all analyses, as in the tests, a main crack
appeared in the in situ cast concrete above the joint. In
the analysis with brushed surface, failure was deter-
mined by rupture of the reinforcement, as in the tests.
However, in the analysis with a surface having single
grooves, the cast joint fractured, when using either the
average or the maximum values from the calibration.
Results from tests and analyses with the brushed sur-
face are shown in Fig. 18. As can be seen in Fig. 18(b),
there is good agreement for the first part of the curves,
with cracking at a load of about 11 kN and yielding at
a load of about 19 kN. Fig. 18(c) describes the crack
pattern in the analysis just before collapse of the struc-
ture. One main crack, in the in situ cast concrete above
5
0
P: k
N
0 5δ: mm
10
15
20
25
10 15 20 25 30
Yieldload
Linear elasticresponse
Collapse of the first bar
Cracking
PP δ
Fig. 15. General load plotted against deflection and
behaviour of the full-scale tests
Support
Load
Joint
Cast joint Reinforcement
In situ In situ
Reinforcement
Joint
Prefab
Support
(a)
(b)
Fig. 16 (a) Model of full-scale tests with detailed modelling
of the left part and the right part more simply modelled with
beam elements; (b) detail of the modelling of the
prefabricated and in situ cast concrete and the cast joint
Fig. 17. Part of the model of the full-scale tests. Open circles
mark where the concrete and reinforcement nodes were tied
to each other. The solid circle marks where the nodes of the
precast concrete and the in situ concrete were tied to each
other
Lap splice over a grouted joint in a lattice girder system
Magazine of Concrete Research, 2007, 59, No. 10 721
Delivered by ICEVirtualLibrary.com to:
IP: 129.16.183.37
On: Mon, 30 Aug 2010 14:41:40
the joint in the mid-span, was formed. Smaller cracks
were also formed at the first cross-bars in the reinforce-
ment mesh over the joint; these, however, were very
small. Failure in this analysis was determined by rup-
ture of the reinforcement, at a mid-span deflection of
about 10 mm, compared with about 30 mm in the tests.
The large difference in the mid-span deflection when
rupture of the reinforcement bar occurred, between the
tests and the analysis, is atttributable to the assumed
bond–slip relation. In reality, the bond stress will drop
when the reinforcement starts yielding. This was not
included in these analyses; therefore, they were not
capable of predicting a correct mid-span deflection
when rupture of the reinforcement occurred.
Load plotted against mid-span deflection from the
tests and analyses of the specimens with surface having
single grooves is shown in Fig. 19. Again, there is good
agreement for the first part of the curves. However,
0
5
10
15
20
25
FEH1H2H3
(c)
PP δ
(a)
P: k
N
0 2 4 6 8 10 12δ: mm
(b)
Fig. 18. Full-scale test and analysis with brushed surface: (a) experiment; (b) load plotted against mid-span deflection; (c)
crack pattern (dark areas are cracked) in analysis
0
5
10
15
20
25
FE A2
FE A1
A1
A2
A3
AverageMaximum
PP δ
(b)
P: k
N
0 2 4 6 8 10δ: mm
(a)
Fig. 19. (a) Load plotted against mid-span deflection, in FEA and tests of specimens with surfaces having single grooves.
Especially marked are the points where the FEAs stopped. (b) Crack pattern and deformed mesh before collapse, from analysis
with average values (results from analysis with maximum values are similar)
Lundgren
722 Magazine of Concrete Research, 2007, 59, No. 10

Delivered by ICEVirtualLibrary.com to:
IP: 129.16.183.37
On: Mon, 30 Aug 2010 14:41:40
both of the analyses stop at a mid-span deflection,
which is a lot smaller than was obtained in the tests;
analysis with average values stops at mid-span deflec-
tion 3.8 mm, and analysis with maximum values at
7.9 mm. In both analyses, the joint opening increased
greatly in the final steps, and thus indicated that
the failure mode in these analyses was opening of the
joint.
Crack patterns in the analyses are shown in Fig. -
19(b). As can be seen, there was one main crack in the
in situ cast concrete above the joint in both of the
analyses, as was the case with the tests. However, in
both of the analyses there was also one crack that
appeared at the location of the first cross-bar in the
reinforcement mesh, which appeared just before maxi-
mum load. Most probably, the appearance of this crack
initiated opening of the joint, which, as already men-
tioned, was the failure mode in both these analyses.
This contradicts what was found in the tests, where
the final failure mode was rupture of the reinforcement.
One reason for the difference might be the choice of
tying the reinforcement to the concrete at the locations
of the cross-bars of the reinforcement mesh. This might
have caused too large a restraint in the analyses com-
pared with the experiments, so that the second crack
was initiated too easily in the analyses. This is con-
firmed when the strain in the reinforcement in the
analyses is compared with what was measured in the
tests, see Fig. 20. Only results from analysis with aver-
age values are shown, but the results were similar in
the analysis with maximum values, and also in the
analysis of the specimen with brushed surface.
When studying the measured strains along the rein-
forcement bar across the joint, it was clear that the
cross-bars had provided very little restraint, as there
was no distinct increase in strain at the location of the
cross-bars. To better correspond to this situation, an
analysis was performed without the ties between the
reinforcement and the concrete at the locations of the
cross-bars, using the average values of calibrated input
for the surface with single grooves. Load plotted
against mid-span deflection from this analysis is com-
pared with test results in Fig. 21(a). As can be seen, the
maximum obtained mid-span deflection was a lot larger
in this analysis than when the ties were included:
12.2 mm compared with 3.8 mm. The failure mode in
this analysis was rupture of the reinforcement with only
one crack in the in situ cast concrete above the joint,
similar to the tests. In Fig. 21(b), the strain in the
reinforcement in the analysis is compared with meas-
ured strain for two load levels. As can be seen, good
agreement is found when no ties were assumed between
the reinforcement and the concrete, much better than
when the ties were present; compare Fig. 20.
Thus, it can be concluded that the analysis without
ties better represents the tested specimen than the
analysis with ties at the locations of the cross-bars in
the reinforcement mesh. This conclusion is based on
the fact that the failure mode in the analysis without
ties corresponds to the one obtained in the test, and that
the strain along the reinforcement bar better corre-
sponds to measured values. Furthermore, it can be con-
cluded that the restraint of the cross-bars has a negative
influence on the behaviour. It is important to note that
in the tested specimens, the reinforcement mesh was
placed directly on the precast concrete, without any
distances. It is therefore most likely that the cross-bars
were not very well confined, and hence did not contri-
bute any major restraint. If, however, the reinforcement
mesh were turned upside down, with the reinforcement
crossing the joint directly on the precast concrete, a
situation with better confined cross-bars would be
achieved. In view of the analysis results here, this
would not be beneficial.
Parameter study in analyses of full-scale tests
It was clear that the grouted joint had sufficient
capacity not to be limiting in the full-scale tests. This
0
500
1000
1500
2000
2500
�250 �150 �50 50 150 250
FE at yielding
FE at cracking
Exp. at yielding
Exp. at cracking
Strain: microstrain
x: mm
Fig. 20. Strain in the reinforcement at some load levels. From
test specimens with single grooves and corresponding
analysis with average values
05
10152025
FE A1
A2 A3
PP δ
0
500
1000
1500
2000
2500 FE at yielding
FE at cracking
at yielding
at cracking
Strain: microstrain
P: k
N
0 5 10 15 20δ: mm
(a)
�250 �150 �50 50 150 250x: mm
(b)
Fig. 21. Results from FEA with average values of surfaces
having single grooves and without ties corresponding to the
welds in the reinforcement. (a) Load plotted against mid-span
deflection; (b) strain in the reinforcement at some load levels
Lap splice over a grouted joint in a lattice girder system
Magazine of Concrete Research, 2007, 59, No. 10 723

Delivered by ICEVirtualLibrary.com to:
IP: 129.16.183.37
On: Mon, 30 Aug 2010 14:41:40
result could also be found in the analyses: for the speci-
mens with surfaces having single grooves, the joint had
sufficient capacity when no restraint from the cross-
bars in the reinforcement mesh was included, while for
the specimens with brushed surface, the joint had suffi-
cient capacity even when the restraint was included.
One very important question is how much safety there
is with the tested design of the joint. For the specimens
with surfaces having single grooves, the analyses in the
previous section already indicate this: if the cross-bars
in the reinforcement mesh were more confined than in
the present tests, the joint would most likely be limit-
ing. Therefore, it cannot be recommended to use the
studied detailing for load-carrying purposes with pre-
fabricated elements having this type of surface.
The specimens with brushed surfaces, on the other
hand, managed to reach rupture of the reinforcement in
the analyses even when full restraint was assumed be-
tween the cross-bars and the concrete. The question is
therefore how sensitive the detailing is. To investigate
this, some variations were examined. The parameters
describing the cast joint obviously have a very strong
influence on the behaviour of the structure. These para-
meters will be influenced by the conditions when the
cover concrete is cast in situ. The conditions at the
construction site can be difficult to control: for exam-
ple, how can it be ensured that there is no dust, snow
or oil from formworks at the surface of the prefabri-
cated concrete when the in situ concrete is cast? It was
judged that this would mainly influence the adhesive
strength.
Furthermore, it needs to be considered that the tests
and FEAs carried out were in two dimensions, with
load-carrying only in one direction. However, in real
applications, the slab will be load-carrying in two
directions. The load-carrying in the main direction will
also create shear stresses in the cast joint, which will
be added to those investigated in this work. In Lundg-
ren et al.6 a simplified way to take this shear stress into
account in the analyses is outlined, which in short
means that the shear stresses acting in the other direc-
tion can be taken into account in a simplified way by
decreasing the adhesive strength.
Owing to these two reasons just discussed, there was
a need to check the extent to which varying values of
the adhesive strength would affect the results. The co-
efficient of friction and also the other parameters of the
joint are mainly dependent on the roughness of the
surface. As this is created in the factory, it is easier to
control. These parameters were therefore not varied.
Thus, two more analyses were carried out for the
specimen with brushed surface
(a) with half the adhesive strength as found in the
calibration of the grouted joint;
(b) with zero adhesion in the grouted joint.
Other values in these two analyses were chosen as in
the original calibration of the brushed surface.
The results from analyses with half adhesive strength
are shown in Fig. 22. The limiting failure mode was
rupture of the reinforcement. Only one main crack
appeared, even though smaller cracks were visible at
the position of the cross-bars of the reinforcement
mesh. However, opening of the joint was probably
0
5
10
15
20
25
FE
H1
H2
H3
P: k
N
0 5 10 15δ: mm
(a)
(b)
PP δ
0
0·005
0·01
0·015
0·02
0
0·0005
0·001
0·0015
0·002
0·0025
0·003
δ x: m
m
δ y: m
m
0 05 510 1015 15δ: mm δ: mm
δy
δx
Fig. 22. Results from FEA of brushed surface with half adhesive strength: (a) load plotted against mid-span deflection;
(b) deformation in the cast joint plotted against mid-span deflection
Lundgren
724 Magazine of Concrete Research, 2007, 59, No. 10
Delivered by ICEVirtualLibrary.com to:
IP: 129.16.183.37
On: Mon, 30 Aug 2010 14:41:40
rather imminent in this case; as can be seen in Fig.
22(b), the opening increased just before the analysis
could not be continued.
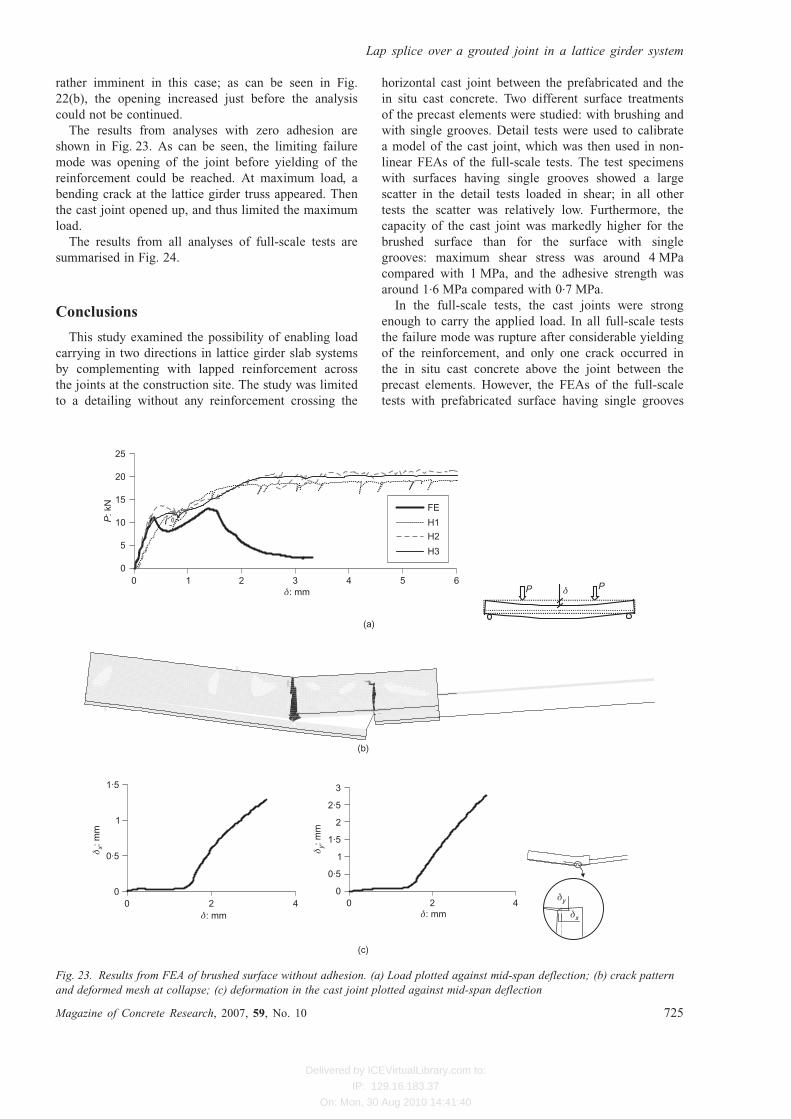
The results from analyses with zero adhesion are
shown in Fig. 23. As can be seen, the limiting failure
mode was opening of the joint before yielding of the
reinforcement could be reached. At maximum load, a
bending crack at the lattice girder truss appeared. Then
the cast joint opened up, and thus limited the maximum
load.
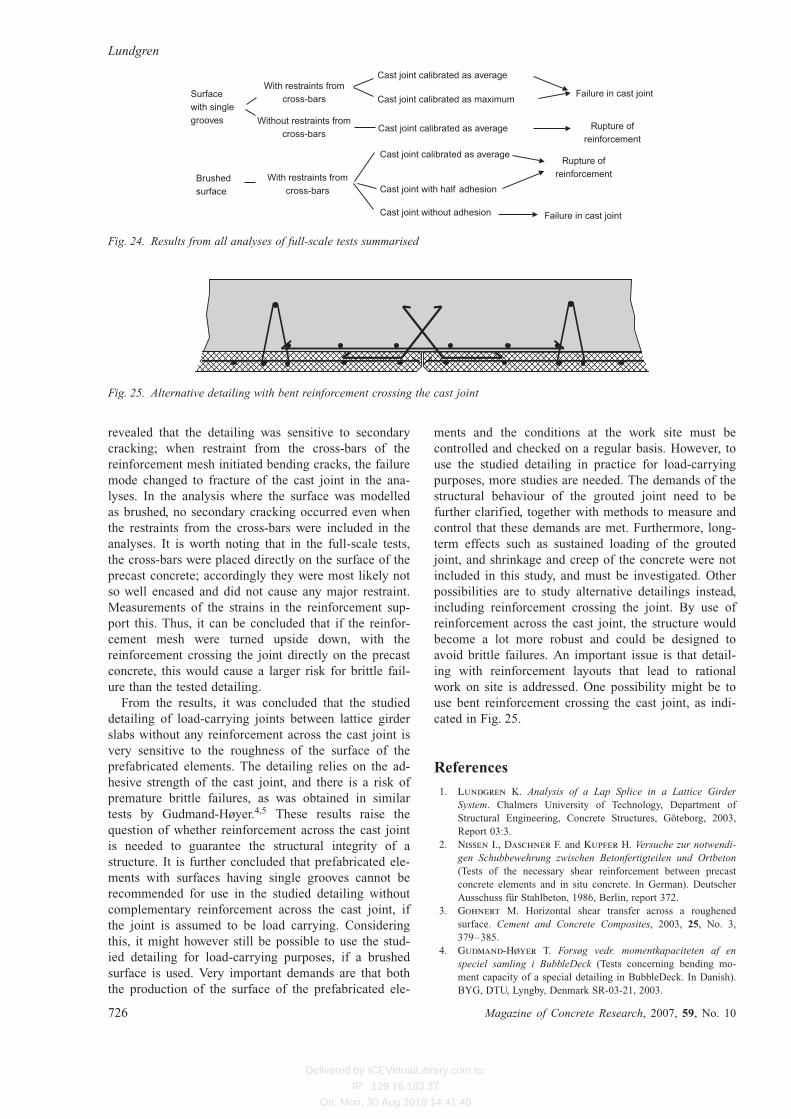
The results from all analyses of full-scale tests are
summarised in Fig. 24.
Conclusions
This study examined the possibility of enabling load
carrying in two directions in lattice girder slab systems
by complementing with lapped reinforcement across
the joints at the construction site. The study was limited
to a detailing without any reinforcement crossing the
horizontal cast joint between the prefabricated and the
in situ cast concrete. Two different surface treatments
of the precast elements were studied: with brushing and
with single grooves. Detail tests were used to calibrate
a model of the cast joint, which was then used in non-
linear FEAs of the full-scale tests. The test specimens
with surfaces having single grooves showed a large
scatter in the detail tests loaded in shear; in all other
tests the scatter was relatively low. Furthermore, the
capacity of the cast joint was markedly higher for the
brushed surface than for the surface with single
grooves: maximum shear stress was around 4 MPa
compared with 1 MPa, and the adhesive strength was
around 1.6 MPa compared with 0.7 MPa.
In the full-scale tests, the cast joints were strong
enough to carry the applied load. In all full-scale tests
the failure mode was rupture after considerable yielding
of the reinforcement, and only one crack occurred in
the in situ cast concrete above the joint between the
precast elements. However, the FEAs of the full-scale
tests with prefabricated surface having single grooves
0
5
10
15
20
25
FE
H1
H2
H3
PP δ
(b)
0
0·5
1
1·5
0
0·5
1
1·5
2
2·5
3
(c)
P: k
N
0 1 2 3 4 5 6δ: mm
(a)
δ x: m
m
δ y: m
m
0 02 24 4δ: mm δ: mm
δy
δx
Fig. 23. Results from FEA of brushed surface without adhesion. (a) Load plotted against mid-span deflection; (b) crack pattern
and deformed mesh at collapse; (c) deformation in the cast joint plotted against mid-span deflection
Lap splice over a grouted joint in a lattice girder system
Magazine of Concrete Research, 2007, 59, No. 10 725
Delivered by ICEVirtualLibrary.com to:
IP: 129.16.183.37
On: Mon, 30 Aug 2010 14:41:40
revealed that the detailing was sensitive to secondary
cracking; when restraint from the cross-bars of the
reinforcement mesh initiated bending cracks, the failure
mode changed to fracture of the cast joint in the ana-
lyses. In the analysis where the surface was modelled
as brushed, no secondary cracking occurred even when
the restraints from the cross-bars were included in the
analyses. It is worth noting that in the full-scale tests,
the cross-bars were placed directly on the surface of the
precast concrete; accordingly they were most likely not
so well encased and did not cause any major restraint.
Measurements of the strains in the reinforcement sup-
port this. Thus, it can be concluded that if the reinfor-
cement mesh were turned upside down, with the
reinforcement crossing the joint directly on the precast
concrete, this would cause a larger risk for brittle fail-
ure than the tested detailing.
From the results, it was concluded that the studied
detailing of load-carrying joints between lattice girder
slabs without any reinforcement across the cast joint is
very sensitive to the roughness of the surface of the
prefabricated elements. The detailing relies on the ad-
hesive strength of the cast joint, and there is a risk of
premature brittle failures, as was obtained in similar
tests by Gudmand-Høyer.4,5 These results raise the
question of whether reinforcement across the cast joint
is needed to guarantee the structural integrity of a
structure. It is further concluded that prefabricated ele-
ments with surfaces having single grooves cannot be
recommended for use in the studied detailing without
complementary reinforcement across the cast joint, if
the joint is assumed to be load carrying. Considering
this, it might however still be possible to use the stud-
ied detailing for load-carrying purposes, if a brushed
surface is used. Very important demands are that both
the production of the surface of the prefabricated ele-
ments and the conditions at the work site must be
controlled and checked on a regular basis. However, to
use the studied detailing in practice for load-carrying
purposes, more studies are needed. The demands of the
structural behaviour of the grouted joint need to be
further clarified, together with methods to measure and
control that these demands are met. Furthermore, long-
term effects such as sustained loading of the grouted
joint, and shrinkage and creep of the concrete were not
included in this study, and must be investigated. Other
possibilities are to study alternative detailings instead,
including reinforcement crossing the joint. By use of
reinforcement across the cast joint, the structure would
become a lot more robust and could be designed to
avoid brittle failures. An important issue is that detail-
ing with reinforcement layouts that lead to rational
work on site is addressed. One possibility might be to
use bent reinforcement crossing the cast joint, as indi-
cated in Fig. 25.
References
1. Lundgren K. Analysis of a Lap Splice in a Lattice Girder
System. Chalmers University of Technology, Department of
Structural Engineering, Concrete Structures, Goteborg, 2003,
Report 03:3.
2. Nissen I., Daschner F. and Kupfer H. Versuche zur notwendi-
gen Schubbewehrung zwischen Betonfertigteilen und Ortbeton
(Tests of the necessary shear reinforcement between precast
concrete elements and in situ concrete. In German). Deutscher
Ausschuss fur Stahlbeton, 1986, Berlin, report 372.
3. Gohnert M. Horizontal shear transfer across a roughened
surface. Cement and Concrete Composites, 2003, 25, No. 3,
379–385.
4. Gudmand-Høyer T. Forsøg vedr. momentkapaciteten af en
speciel samling i BubbleDeck (Tests concerning bending mo-
ment capacity of a special detailing in BubbleDeck. In Danish).
BYG, DTU, Lyngby, Denmark SR-03-21, 2003.
Cast joint calibrated as average
Cast joint with half adhesion
Cast joint without adhesion
Brushedsurface
With restraints fromcross-bars
Surfacewith singlegrooves
Cast joint calibrated as average
Cast joint calibrated as average
Cast joint calibrated as maximum
With restraints fromcross-bars
Without restraints fromcross-bars
Failure in cast joint
Failure in cast joint
Rupture ofreinforcement
Rupture ofreinforcement
Fig. 24. Results from all analyses of full-scale tests summarised
Fig. 25. Alternative detailing with bent reinforcement crossing the cast joint
Lundgren
726 Magazine of Concrete Research, 2007, 59, No. 10

Delivered by ICEVirtualLibrary.com to:
IP: 129.16.183.37
On: Mon, 30 Aug 2010 14:41:40
5. Gudmand-Høyer T. Forsøg vedr. momentkapaciteten af en
samling i BubbleDeck (Tests concerning bending moment capa-
city of a detailing in BubbleDeck. In Danish). BYG, DTU,
Lyngby, Denmark SR-03-20, 2003.
6. Lundgren K., Helgesson J. and Sylven R. Joints in Lattice
Girder Structures. Chalmers University of Technology, Depart-
ment of Civil and Environmental Engineering, Division of
Structural Engineering, Concrete Structures, 2005, Goteborg
Report 2005:9.
7. Linsbauer H. N. and Tschegg E. K. Fracture energy determi-
nation of concrete with cube shaped specimens. Zement und
Beton, 1986, 31, 38–40.
8. Karihaloo B. Fracture Mechanics and Structural Concrete.
Longman, Sydney, Australia, 1995.
9. TNO. DIANA Finite Element Analysis, User’s Manual Release
8.1. TNO Building and Construction Research, Delft, The
Netherlands, 2002.
10. Comite Europeen du Beton. CEB–FIP Model Code 1990.
Bulletin d’Information 213/214. CEB, Lausanne, Switzerland,
1993.
11. Østergaard L. Early-age Fracture Mechanics and Cracking of
Concrete—Experiments and Modelling. PhD thesis, Department
of Civil Engineering, Technical University of Denmark, 2003.
Discussion contributions on this paper should reach the editor by
1 June 2008
Lap splice over a grouted joint in a lattice girder system
Magazine of Concrete Research, 2007, 59, No. 10 727
Recommended