LEARN TO TRADE
eBOOK
Build Your Successful Trading Strategy
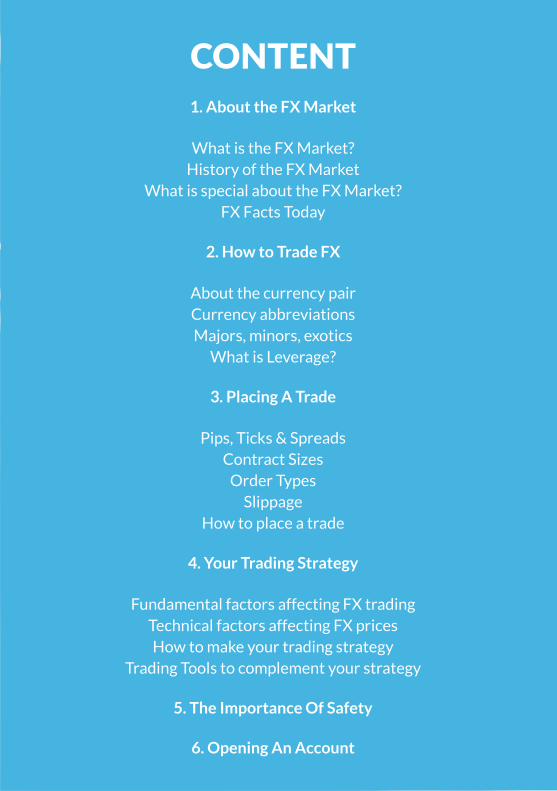
CONTENT1. About the FX Market
What is the FX Market?History of the FX Market
What is special about the FX Market?FX Facts Today
2. How to Trade FX
About the currency pairCurrency abbreviationsMajors, minors, exotics
What is Leverage?
3. Placing A Trade
Pips, Ticks & SpreadsContract Sizes
Order TypesSlippage
How to place a trade
4. Your Trading Strategy
Fundamental factors affecting FX tradingTechnical factors affecting FX pricesHow to make your trading strategy
Trading Tools to complement your strategy
5. The Importance Of Safety
6. Opening An Account
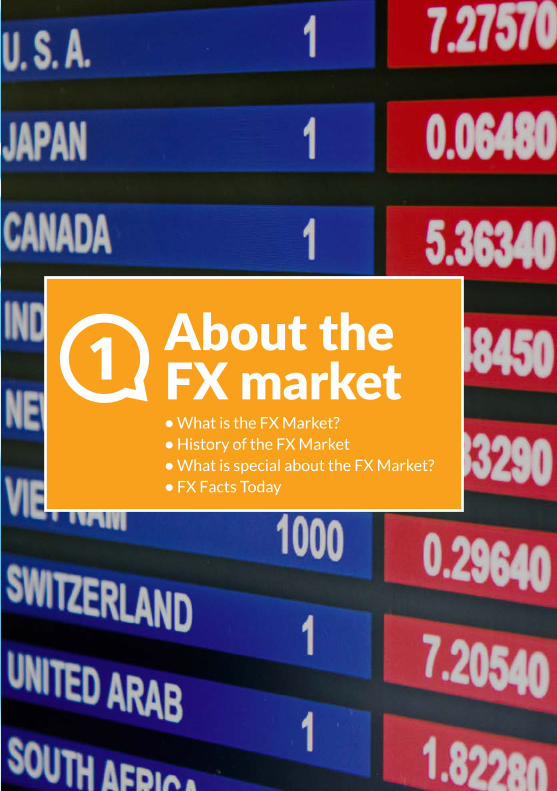
About the FX market• What is the FX Market?• History of the FX Market• What is special about the FX Market?• FX Facts Today
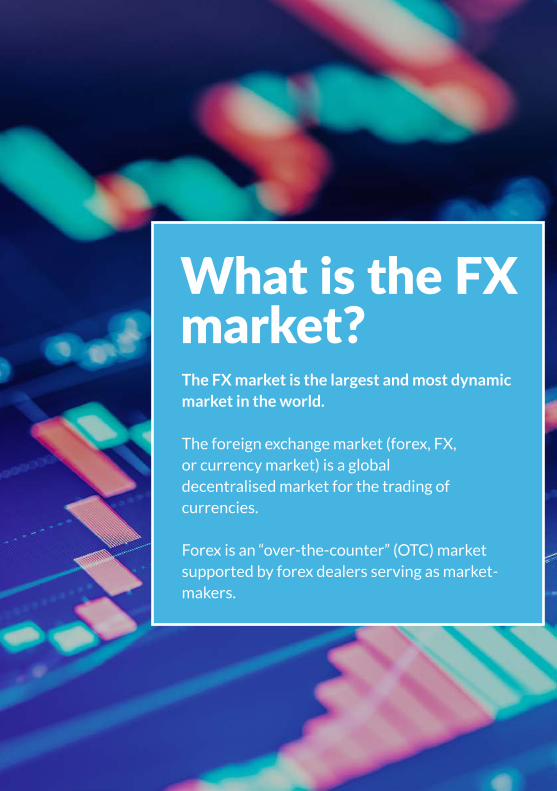
What is the FX market?The FX market is the largest and most dynamic market in the world.
The foreign exchange market (forex, FX, or currency market) is a global decentralised market for the trading of currencies.
Forex is an “over-the-counter” (OTC) market supported by forex dealers serving as market-makers.
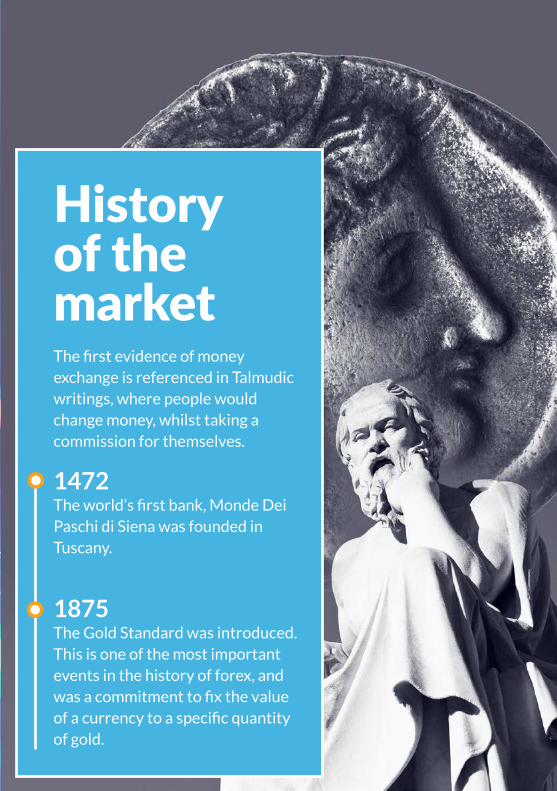
History of the marketThe first evidence of money exchange is referenced in Talmudic writings, where people would change money, whilst taking a commission for themselves.
1472The world’s first bank, Monde Dei Paschi di Siena was founded in Tuscany.
1875The Gold Standard was introduced. This is one of the most important events in the history of forex, and was a commitment to fix the value of a currency to a specific quantity of gold.
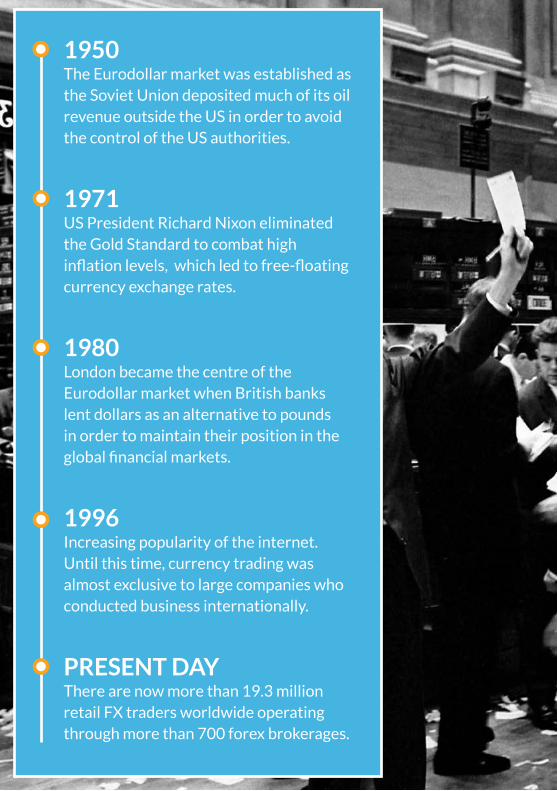
1950The Eurodollar market was established as the Soviet Union deposited much of its oil revenue outside the US in order to avoid the control of the US authorities.
1971US President Richard Nixon eliminated the Gold Standard to combat high inflation levels, which led to free-floating currency exchange rates.
1980London became the centre of the Eurodollar market when British banks lent dollars as an alternative to pounds in order to maintain their position in the global financial markets.
1996Increasing popularity of the internet. Until this time, currency trading was almost exclusive to large companies who conducted business internationally.
PRESENT DAYThere are now more than 19.3 million retail FX traders worldwide operating through more than 700 forex brokerages.
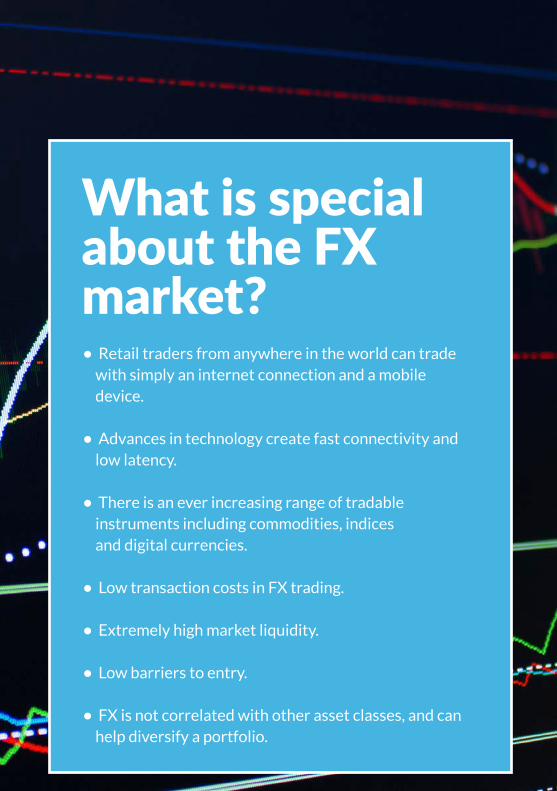
What is special about the FX market?• Retail traders from anywhere in the world can trade with simply an internet connection and a mobile device.
• Advances in technology create fast connectivity and low latency.
• There is an ever increasing range of tradable instruments including commodities, indices and digital currencies.
• Low transaction costs in FX trading.
• Extremely high market liquidity.
• Low barriers to entry.
• FX is not correlated with other asset classes, and can help diversify a portfolio.
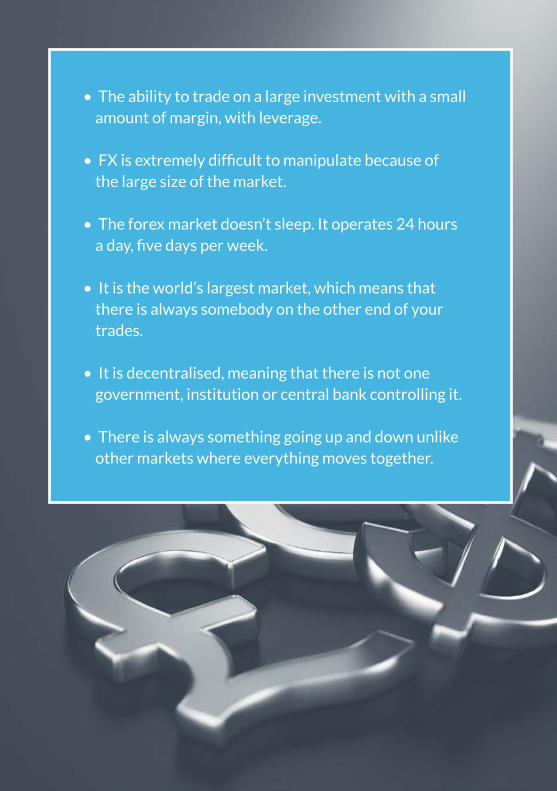
• The ability to trade on a large investment with a small amount of margin, with leverage.
• FX is extremely difficult to manipulate because of the large size of the market.
• The forex market doesn’t sleep. It operates 24 hours a day, five days per week.
• It is the world’s largest market, which means that there is always somebody on the other end of your trades.
• It is decentralised, meaning that there is not one government, institution or central bank controlling it.
• There is always something going up and down unlike other markets where everything moves together.
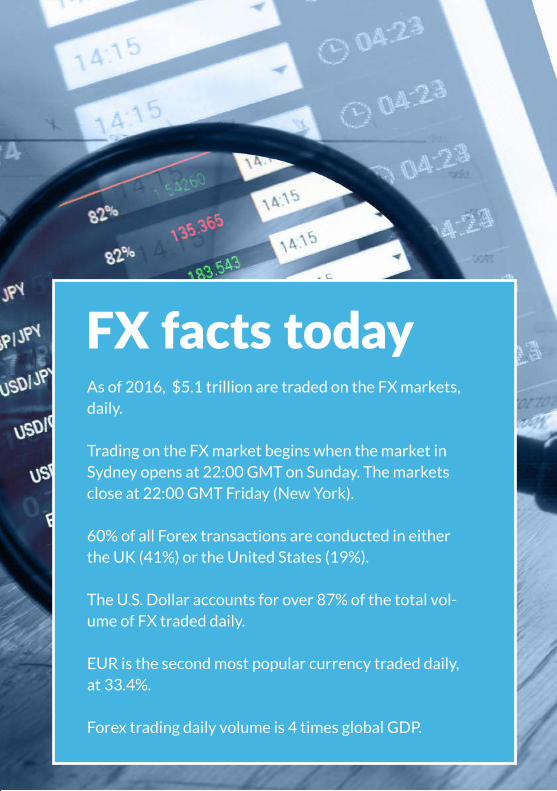
FX facts todayAs of 2016, $5.1 trillion are traded on the FX markets, daily.
Trading on the FX market begins when the market in Sydney opens at 22:00 GMT on Sunday. The markets close at 22:00 GMT Friday (New York).
60% of all Forex transactions are conducted in either the UK (41%) or the United States (19%).
The U.S. Dollar accounts for over 87% of the total vol-ume of FX traded daily.
EUR is the second most popular currency traded daily, at 33.4%.
Forex trading daily volume is 4 times global GDP.

How to trade FX• About the currency pair• Currency Abbreviations• Majors, Minors, Exotics• How FX is quoted• When To Trade• What is Leverage?
How to trade FX• About the currency pair• Currency Abbreviations• Majors, Minors, Exotics• How FX is quoted• When To Trade• What is Leverage?
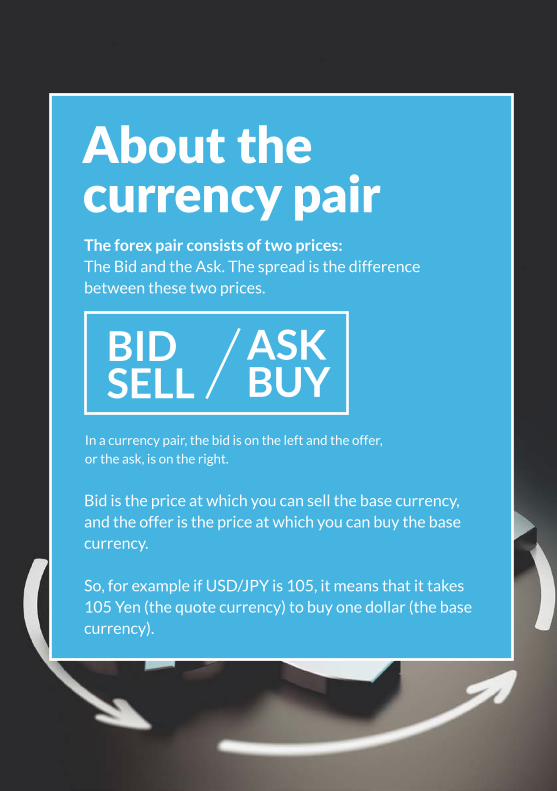
About the currency pairThe forex pair consists of two prices: The Bid and the Ask. The spread is the difference between these two prices.
Bid is the price at which you can sell the base currency, and the offer is the price at which you can buy the base currency.
So, for example if USD/JPY is 105, it means that it takes 105 Yen (the quote currency) to buy one dollar (the base currency).
In a currency pair, the bid is on the left and the offer,
or the ask, is on the right.
BID SELL
ASK BUY
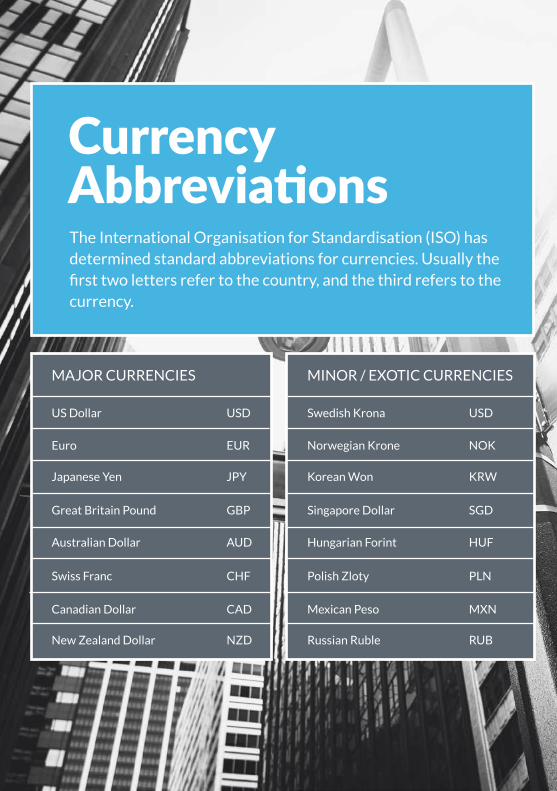
CurrencyAbbreviationsThe International Organisation for Standardisation (ISO) has determined standard abbreviations for currencies. Usually the first two letters refer to the country, and the third refers to the currency.
MAJOR CURRENCIES
US Dollar
Euro
Japanese Yen
Great Britain Pound
Australian Dollar
Swiss Franc
Canadian Dollar
New Zealand Dollar
USD
EUR
JPY
GBP
AUD
CHF
CAD
NZD
MINOR / EXOTIC CURRENCIES
Swedish Krona
Norwegian Krone
Korean Won
Singapore Dollar
Hungarian Forint
Polish Zloty
Mexican Peso
Russian Ruble
USD
NOK
KRW
SGD
HUF
PLN
MXN
RUB
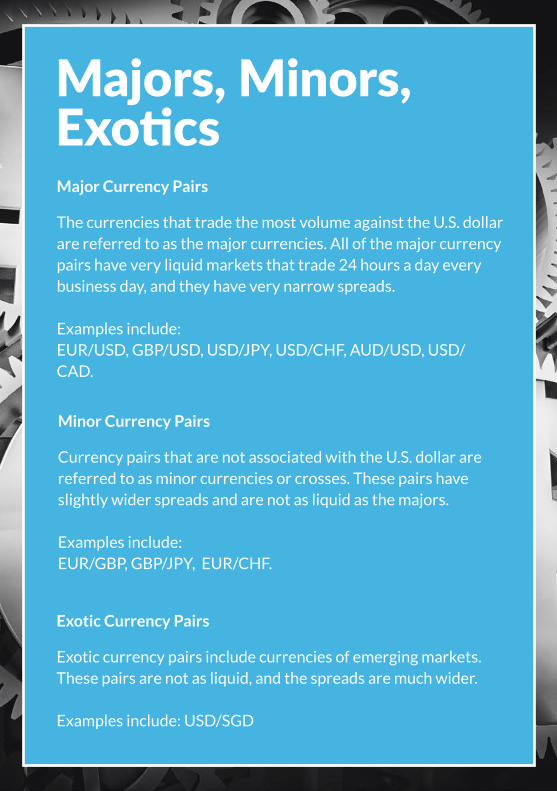
Majors, Minors, ExoticsMajor Currency Pairs
The currencies that trade the most volume against the U.S. dollar are referred to as the major currencies. All of the major currency pairs have very liquid markets that trade 24 hours a day every business day, and they have very narrow spreads.
Examples include: EUR/USD, GBP/USD, USD/JPY, USD/CHF, AUD/USD, USD/CAD.
Minor Currency Pairs
Currency pairs that are not associated with the U.S. dollar are referred to as minor currencies or crosses. These pairs have slightly wider spreads and are not as liquid as the majors.
Examples include:EUR/GBP, GBP/JPY, EUR/CHF.
Exotic Currency Pairs
Exotic currency pairs include currencies of emerging markets. These pairs are not as liquid, and the spreads are much wider.
Examples include: USD/SGD
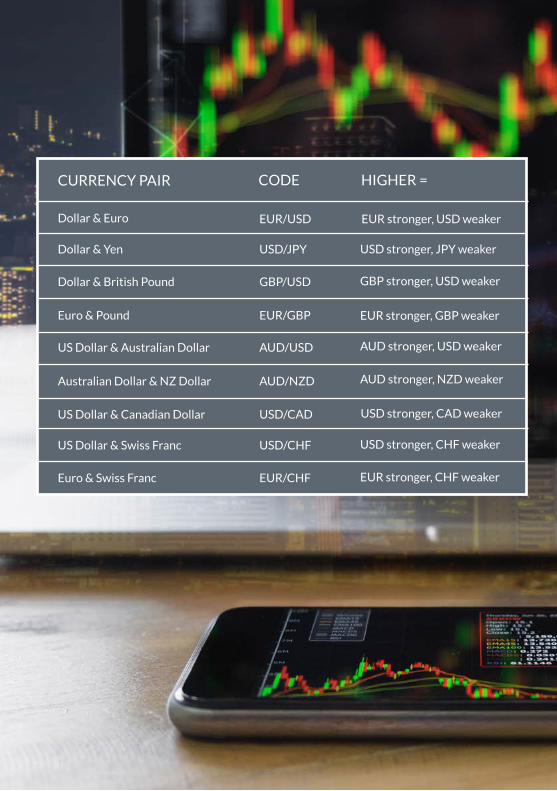
CURRENCY PAIR
Dollar & Euro
Dollar & Yen
Dollar & British Pound
Euro & Pound
US Dollar & Australian Dollar
Australian Dollar & NZ Dollar
US Dollar & Canadian Dollar
US Dollar & Swiss Franc
EUR/USD
USD/JPY
GBP/USD
EUR/GBP
AUD/USD
AUD/NZD
USD/CAD
USD/CHF
CODE HIGHER =
EUR stronger, USD weaker
USD stronger, JPY weaker
GBP stronger, USD weaker
EUR stronger, GBP weaker
AUD stronger, USD weaker
AUD stronger, NZD weaker
USD stronger, CAD weaker
USD stronger, CHF weaker
EUR stronger, CHF weakerEuro & Swiss Franc EUR/CHF
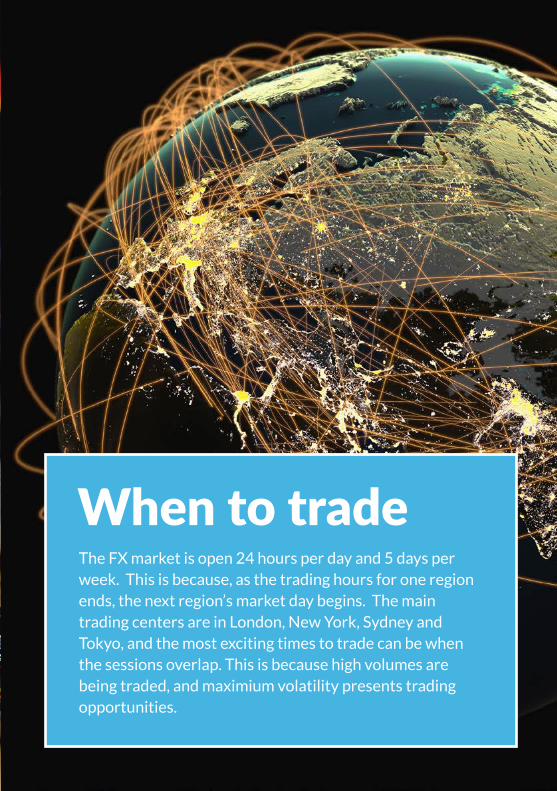
When to tradeThe FX market is open 24 hours per day and 5 days per week. This is because, as the trading hours for one region ends, the next region’s market day begins. The main trading centers are in London, New York, Sydney and Tokyo, and the most exciting times to trade can be when the sessions overlap. This is because high volumes are being traded, and maximium volatility presents trading opportunities.
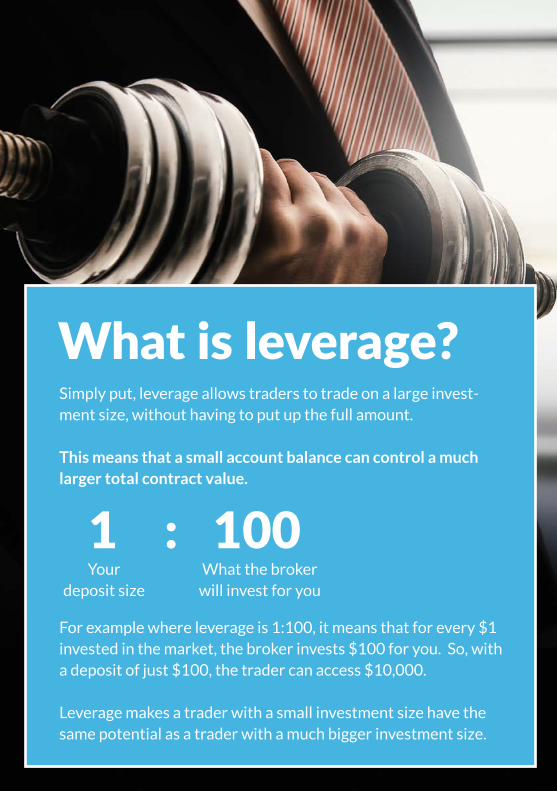
What is leverage?Simply put, leverage allows traders to trade on a large invest-ment size, without having to put up the full amount.
This means that a small account balance can control a much larger total contract value.
For example where leverage is 1:100, it means that for every $1 invested in the market, the broker invests $100 for you. So, with a deposit of just $100, the trader can access $10,000.
Leverage makes a trader with a small investment size have the same potential as a trader with a much bigger investment size.
Your deposit size
What the brokerwill invest for you
1 : 100

Placing a trade• Pips, Ticks & Spreads• Contract Sizes• Order Types• Slippage• How to place a trade
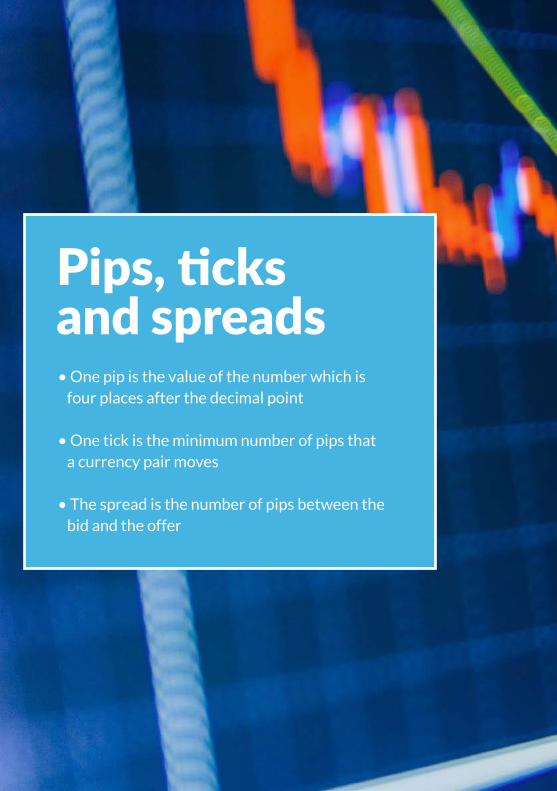
Pips, ticks and spreads• One pip is the value of the number which is four places after the decimal point
• One tick is the minimum number of pips that a currency pair moves
• The spread is the number of pips between the bid and the offer
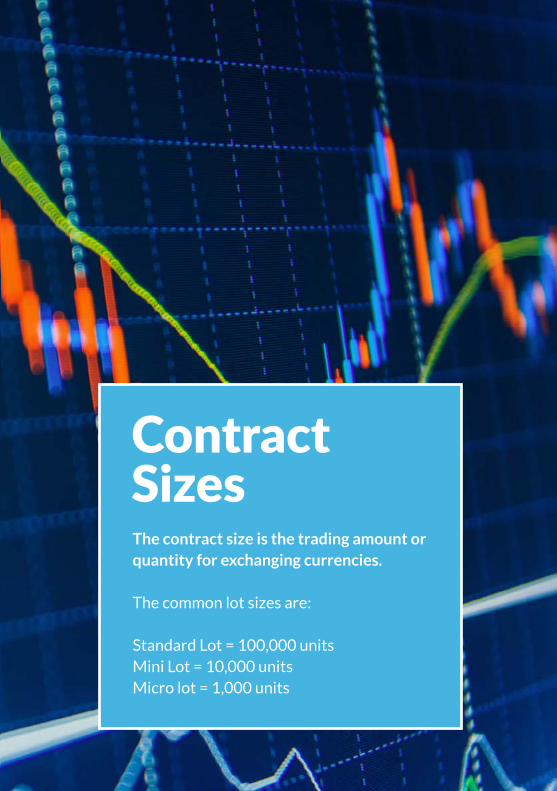
ContractSizesThe contract size is the trading amount or quantity for exchanging currencies.
The common lot sizes are:
Standard Lot = 100,000 unitsMini Lot = 10,000 unitsMicro lot = 1,000 units
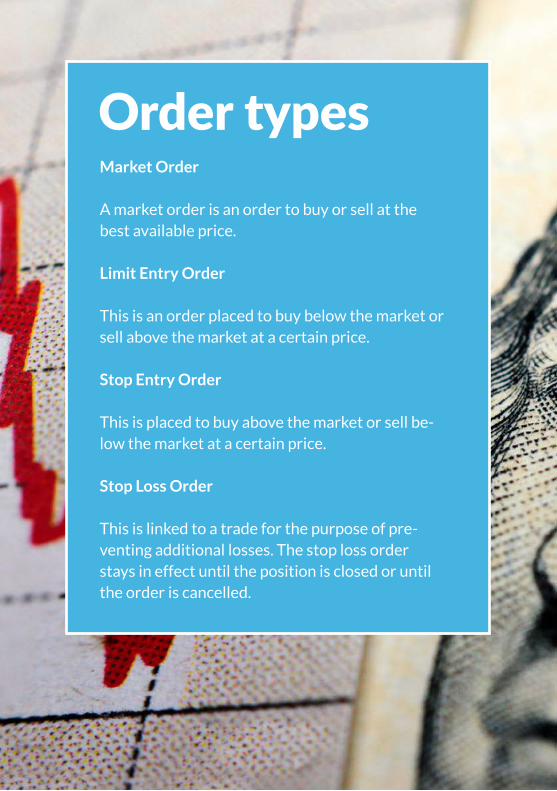
Order typesMarket Order
A market order is an order to buy or sell at the best available price.
Limit Entry Order
This is an order placed to buy below the market or sell above the market at a certain price.
Stop Entry Order
This is placed to buy above the market or sell be-low the market at a certain price.
Stop Loss Order
This is linked to a trade for the purpose of pre-venting additional losses. The stop loss order stays in effect until the position is closed or until the order is cancelled.
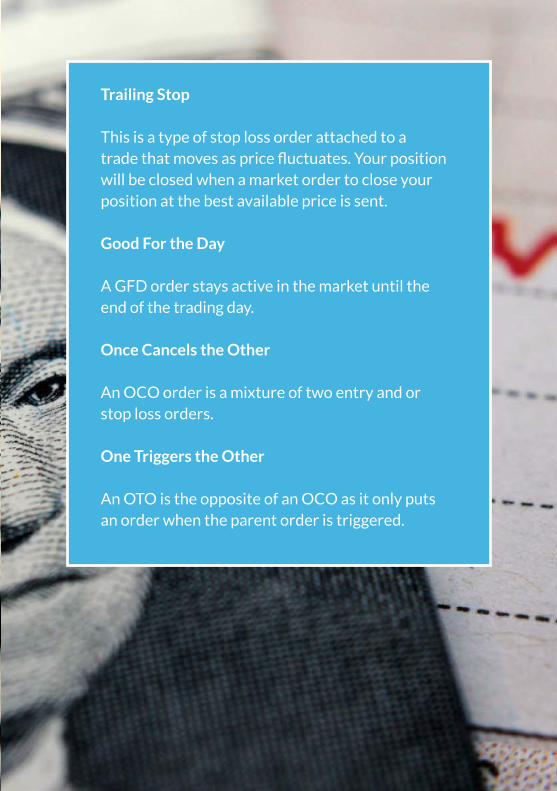
Trailing Stop
This is a type of stop loss order attached to a trade that moves as price fluctuates. Your position will be closed when a market order to close your position at the best available price is sent.
Good For the Day
A GFD order stays active in the market until the end of the trading day.
Once Cancels the Other
An OCO order is a mixture of two entry and or stop loss orders.
One Triggers the Other
An OTO is the opposite of an OCO as it only puts an order when the parent order is triggered.
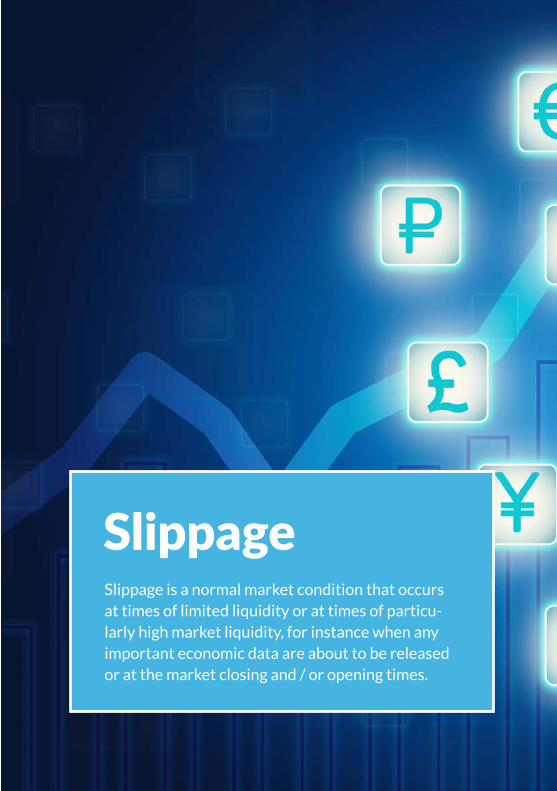
SlippageSlippage is a normal market condition that occurs at times of limited liquidity or at times of particu-larly high market liquidity, for instance when any important economic data are about to be released or at the market closing and / or opening times.
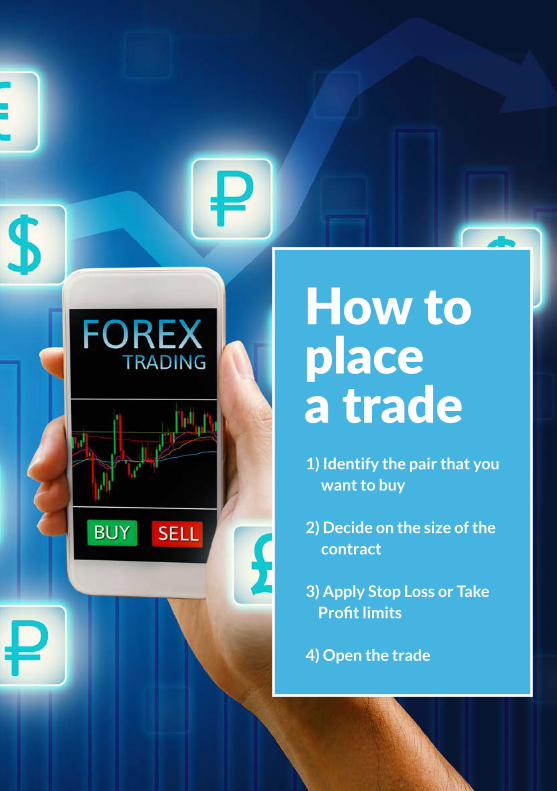
How to placea trade1) Identify the pair that you want to buy
2) Decide on the size of the contract
3) Apply Stop Loss or Take Profit limits
4) Open the trade
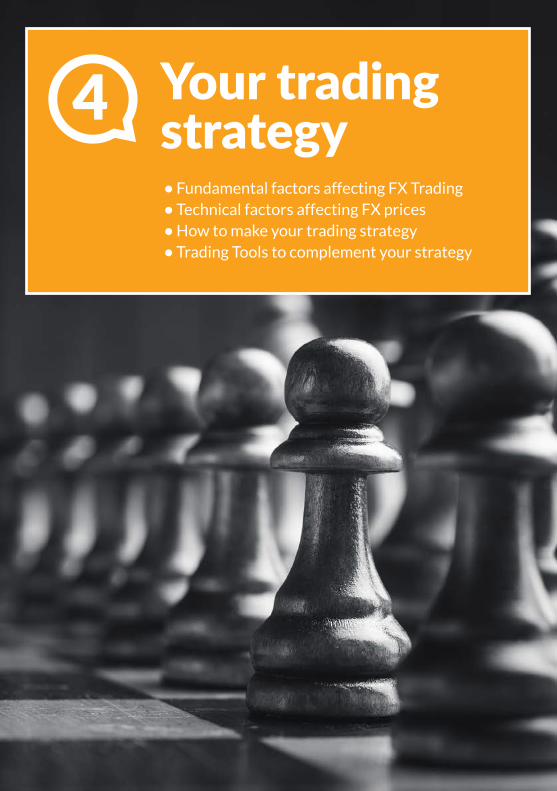
Your trading strategy• Fundamental factors affecting FX Trading• Technical factors affecting FX prices • How to make your trading strategy• Trading Tools to complement your strategy
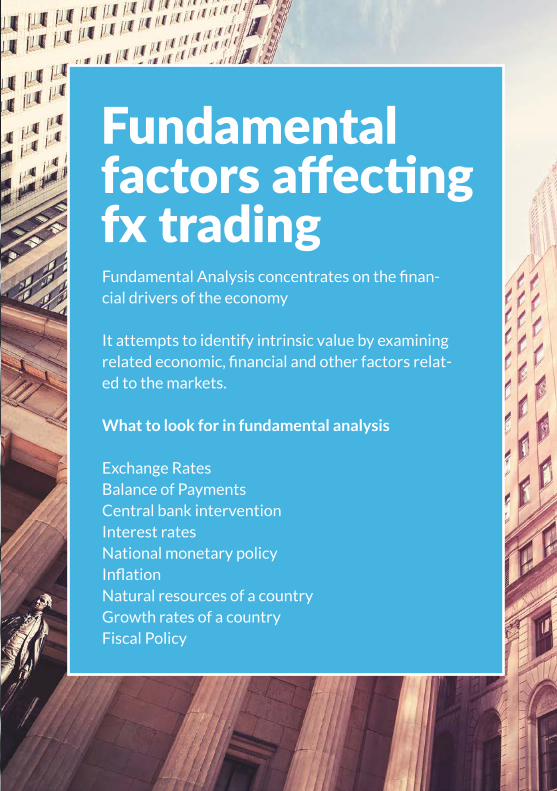
Fundamentalfactors affecting fx tradingFundamental Analysis concentrates on the finan-cial drivers of the economy
It attempts to identify intrinsic value by examining related economic, financial and other factors relat-ed to the markets.
What to look for in fundamental analysis
Exchange RatesBalance of PaymentsCentral bank interventionInterest ratesNational monetary policyInflationNatural resources of a countryGrowth rates of a countryFiscal Policy
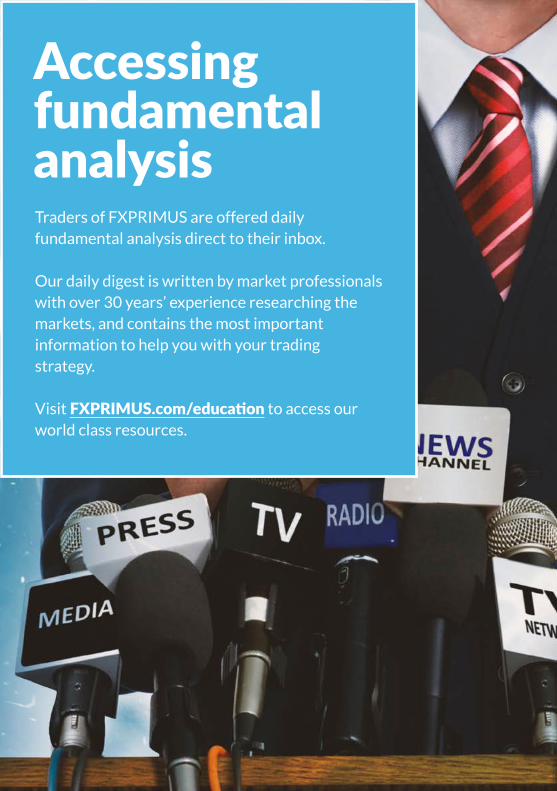
Accessing fundamentalanalysisTraders of FXPRIMUS are offered daily fundamental analysis direct to their inbox.
Our daily digest is written by market professionals with over 30 years’ experience researching the markets, and contains the most important information to help you with your trading strategy.
Visit FXPRIMUS.com/education to access our world class resources.
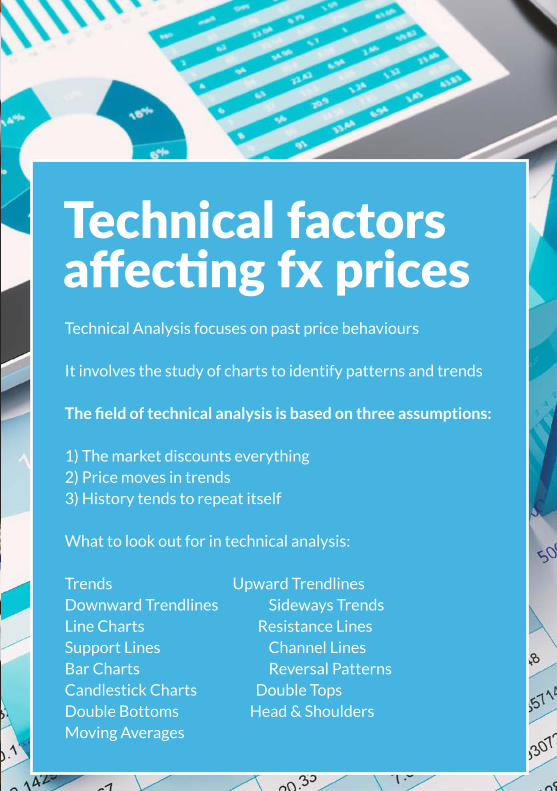
Technical factors affecting fx pricesTechnical Analysis focuses on past price behaviours
It involves the study of charts to identify patterns and trends
The field of technical analysis is based on three assumptions:
1) The market discounts everything2) Price moves in trends3) History tends to repeat itself
What to look out for in technical analysis:
Trends Upward Trendlines Downward Trendlines Sideways TrendsLine Charts Resistance Lines Support Lines Channel LinesBar Charts Reversal Patterns Candlestick Charts Double Tops Double Bottoms Head & ShouldersMoving Averages
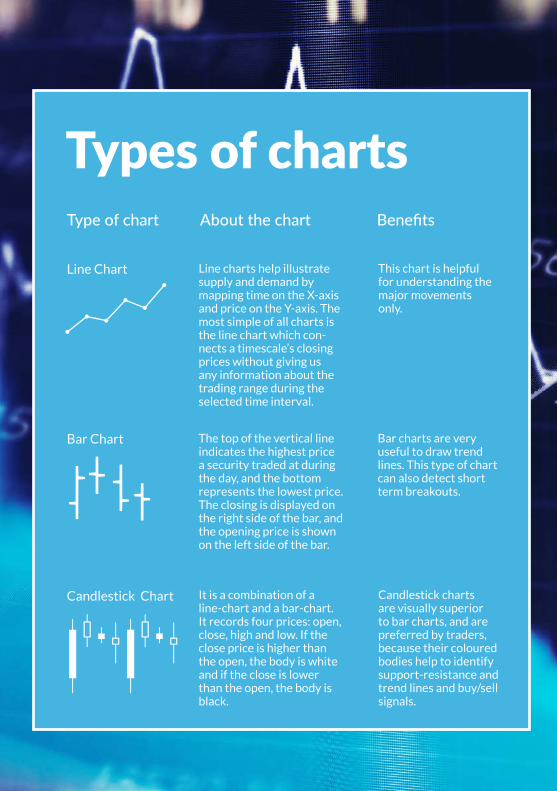
Types of chartsType of chart
Line Chart Line charts help illustrate supply and demand by mapping time on the X-axis and price on the Y-axis. The most simple of all charts is the line chart which con-nects a timescale’s closing prices without giving us any information about the trading range during the selected time interval.
The top of the vertical line indicates the highest price a security traded at during the day, and the bottom represents the lowest price. The closing is displayed on the right side of the bar, and the opening price is shown on the left side of the bar.
It is a combination of a line-chart and a bar-chart. It records four prices: open, close, high and low. If the close price is higher than the open, the body is white and if the close is lower than the open, the body is black.
This chart is helpful for understanding the major movements only.
Bar charts are very useful to draw trend lines. This type of chart can also detect short term breakouts.
Candlestick charts are visually superior to bar charts, and are preferred by traders, because their coloured bodies help to identify support-resistance and trend lines and buy/sell signals.
Bar Chart
Candlestick Chart
About the chart Benefits
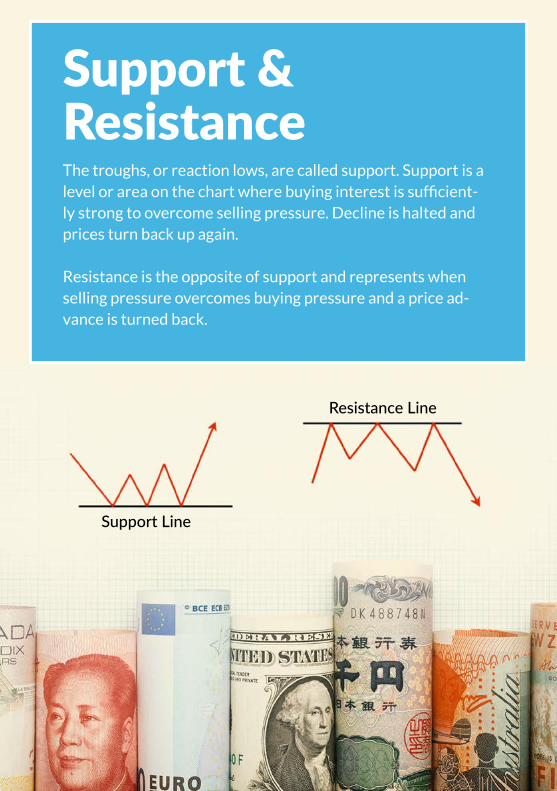
Support & ResistanceThe troughs, or reaction lows, are called support. Support is a level or area on the chart where buying interest is sufficient-ly strong to overcome selling pressure. Decline is halted and prices turn back up again.
Resistance is the opposite of support and represents when selling pressure overcomes buying pressure and a price ad-vance is turned back.
Support Line
Resistance Line
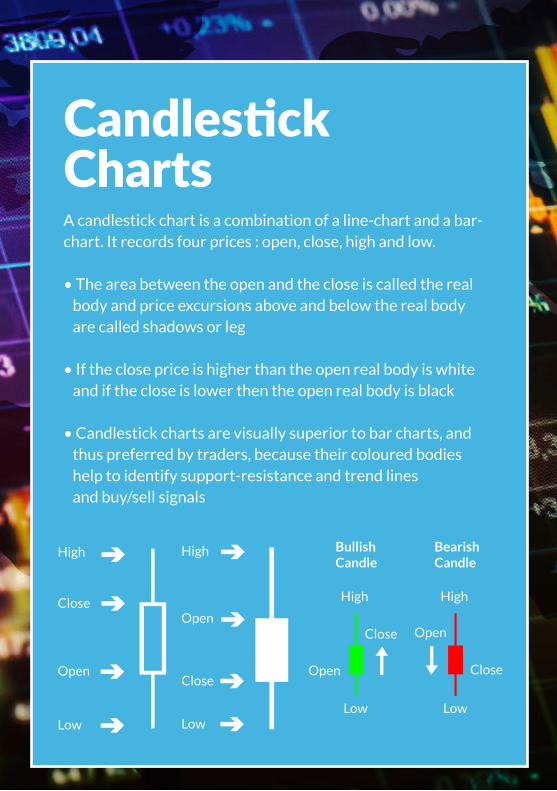
Candlestick ChartsA candlestick chart is a combination of a line-chart and a bar-chart. It records four prices : open, close, high and low.
• The area between the open and the close is called the real body and price excursions above and below the real body are called shadows or leg
• If the close price is higher than the open real body is white and if the close is lower then the open real body is black
• Candlestick charts are visually superior to bar charts, and thus preferred by traders, because their coloured bodies help to identify support-resistance and trend lines and buy/sell signals
High High
Bullish Candle
Bearish Candle
Open Close
Close Open
Low Low
High
Open
Close
Low
High
Close
Open
Low
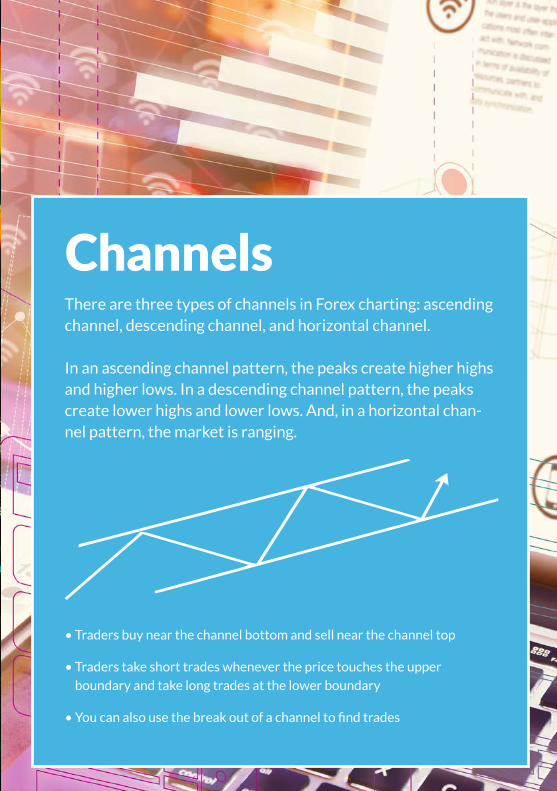
ChannelsThere are three types of channels in Forex charting: ascending channel, descending channel, and horizontal channel.
In an ascending channel pattern, the peaks create higher highs and higher lows. In a descending channel pattern, the peaks create lower highs and lower lows. And, in a horizontal chan-nel pattern, the market is ranging.
• Traders buy near the channel bottom and sell near the channel top
• Traders take short trades whenever the price touches the upper
boundary and take long trades at the lower boundary
• You can also use the break out of a channel to find trades
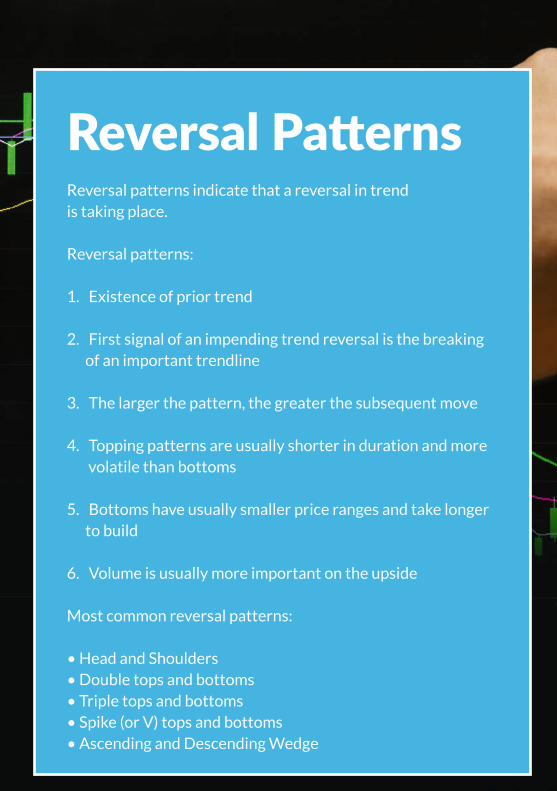
Reversal PatternsReversal patterns indicate that a reversal in trendis taking place.
Reversal patterns:
1. Existence of prior trend
2. First signal of an impending trend reversal is the breaking of an important trendline
3. The larger the pattern, the greater the subsequent move
4. Topping patterns are usually shorter in duration and more volatile than bottoms
5. Bottoms have usually smaller price ranges and take longer to build
6. Volume is usually more important on the upside
Most common reversal patterns:
• Head and Shoulders • Double tops and bottoms • Triple tops and bottoms • Spike (or V) tops and bottoms • Ascending and Descending Wedge
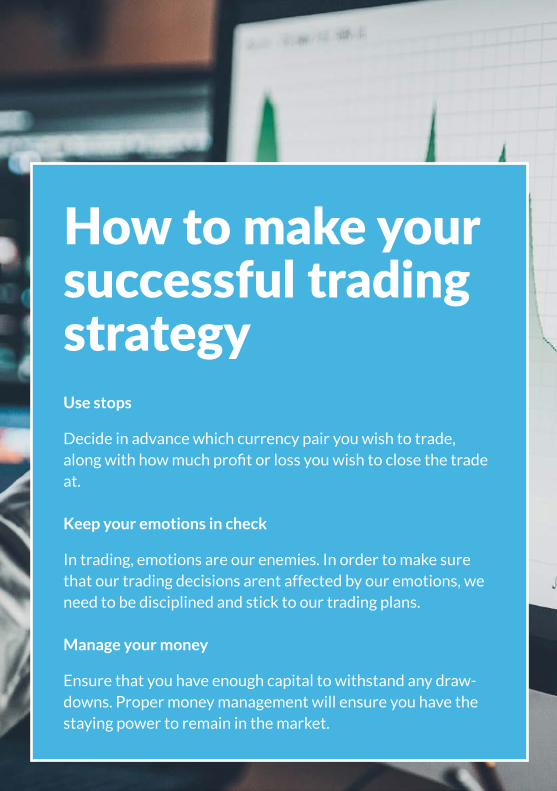
How to make your successful trading strategyUse stops
Decide in advance which currency pair you wish to trade, along with how much profit or loss you wish to close the trade at.
Keep your emotions in check
In trading, emotions are our enemies. In order to make sure that our trading decisions arent affected by our emotions, we need to be disciplined and stick to our trading plans.
Manage your money
Ensure that you have enough capital to withstand any draw-downs. Proper money management will ensure you have the staying power to remain in the market.
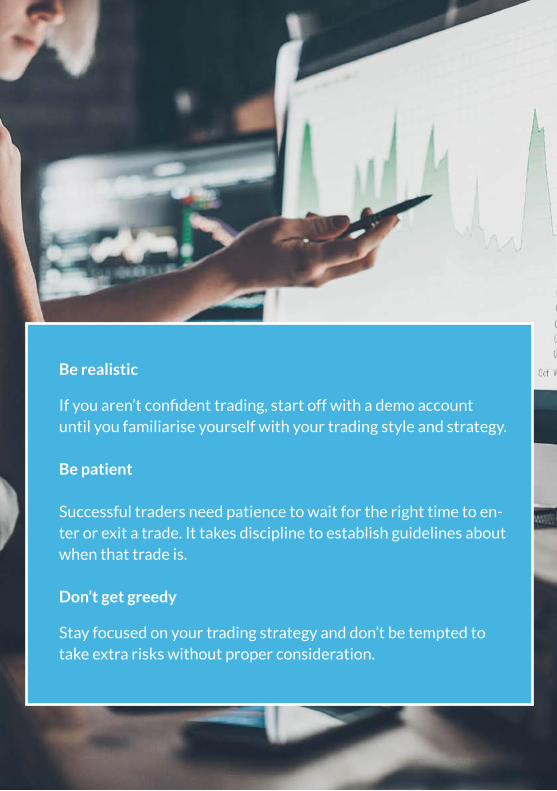
Be realistic
If you aren’t confident trading, start off with a demo account until you familiarise yourself with your trading style and strategy.
Be patient
Successful traders need patience to wait for the right time to en-ter or exit a trade. It takes discipline to establish guidelines about when that trade is.
Don’t get greedy
Stay focused on your trading strategy and don’t be tempted to take extra risks without proper consideration.
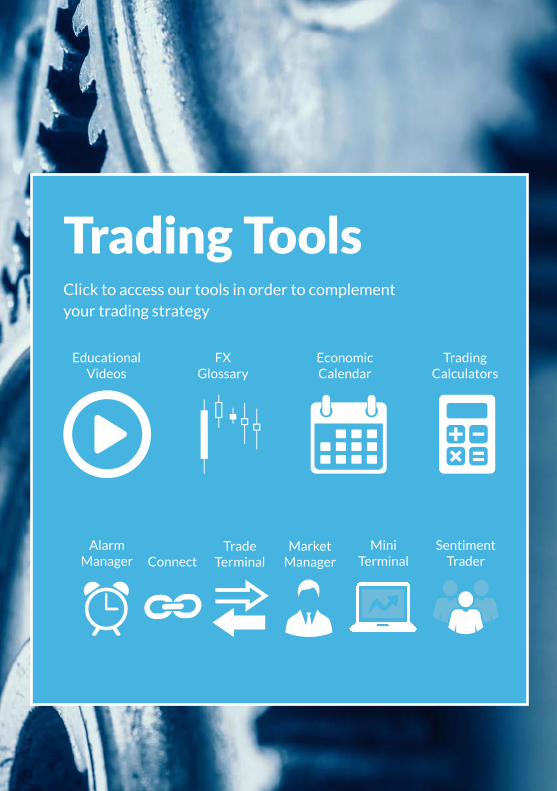
Trading ToolsClick to access our tools in order to complement your trading strategy
Educational Videos
Alarm Manager Connect
Trade Terminal
MarketManager
MiniTerminal
SentimentTrader
FXGlossary
EconomicCalendar
TradingCalculators
The importance of safety
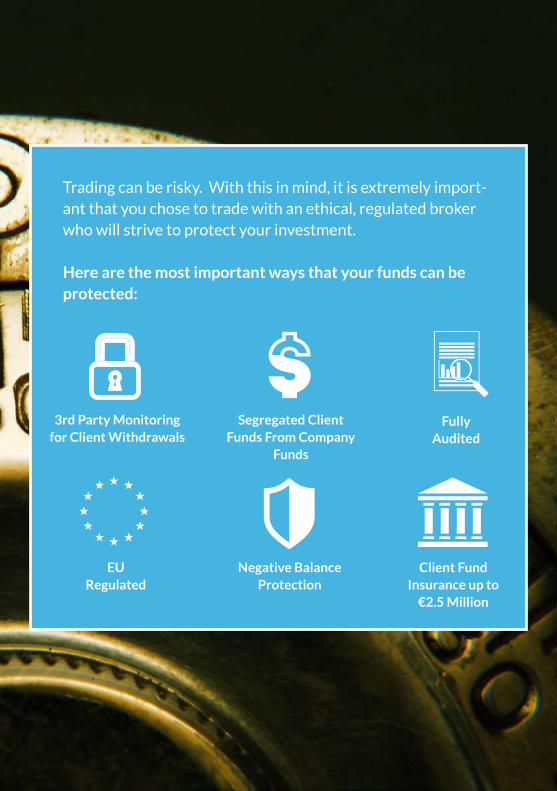
Trading can be risky. With this in mind, it is extremely import-ant that you chose to trade with an ethical, regulated broker who will strive to protect your investment.
Here are the most important ways that your funds can be protected:
3rd Party Monitoringfor Client Withdrawals
EU Regulated
Negative Balance Protection
Client FundInsurance up to
€2.5 Million
Segregated Client Funds From Company
Funds
Fully Audited

Primus Global Ltd (previously known as FX Primus Europe (CY) Ltd), trading under the FXPRIMUS trade name,
is regulated by CySEC (license no. 261/14) and insured by a EUR2.5M policy.
Risk Warning: Please note that forex trading and trading in other leveraged products involves a significant level
of risk and is not suitable for all investors. Trading in financial instruments may result in losses as well as profits
and your losses can be greater than your initial invested capital. Before undertaking any such transactions you
should ensure that you fully understand the risks involved and seek independent advice if necessary.
Read our full risk disclosure.
This information is not directed/intended for distribution to or use by residents of certain countries/jurisdictions
including but not limited to USA, North Korea, Japan, Australia, France and Belgium.
The Company does not offer its services to residents of certain jurisdictions/countries including but not limited
to USA, North Korea, Japan, France, Belgium and Australia.
© 2018 FXPRIMUS is the trade name used by Primus Global Ltd
(previously known as FX Primus Europe (CY) Ltd) and its subsidiary companies. All Rights Reserved.
Recommended