S P E C I A L I S S U E R E V I EW
Low-field benchtop NMR spectroscopy: status and prospectsin natural product analysis†
Teris André van Beek
Laboratory of Organic Chemistry, Wageningen
University, Stippeneng 4, WE Wageningen,
The Netherlands
Correspondence
Teris André van Beek, Laboratory of Organic
Chemistry, Wageningen University,
Stippeneng 4, 6708 WE Wageningen, The
Netherlands.
Email: [email protected]
Abstract
Introduction: Since a couple of years, low-field (LF) nuclear magnetic resonance
(NMR) spectrometers (40–100 MHz) have re-entered the market. They are used for
various purposes including analyses of natural products. Similar to high-field instru-
ments (300–1200 MHz), modern LF instruments can measure multiple nuclei and
record two-dimensional (2D) NMR spectra.
Objective: To review the commercial availability as well as applications, advantages,
limitations, and prospects of LF-NMR spectrometers for the purpose of natural prod-
ucts analysis.
Method: Commercial LF instruments were compared. A literature search was per-
formed for articles using and discussing modern LF-NMR. Next, the articles relevant
to natural products were read and summarised.
Results: Seventy articles were reviewed. Most appeared in 2018 and 2019. Low
costs and ease of operation are most often mentioned as reasons for using LF-NMR.
Conclusion: As the spectral resolution of LF instruments is limited, they are not used
for structure elucidation of new natural products but rather applied for quality con-
trol (QC), forensics, food and health research, process control and teaching.
Chemometric data handling is valuable. LF-NMR is a rapidly developing niche and
new instruments keep being introduced.
K E YWORD S
adulteration, benchtop analysis, education, forensics, low-field NMR, quality control
1 | INTRODUCTION
Until 1960, structure elucidation of natural products was tedious and
time-consuming requiring skill and persistence. It relied almost exclu-
sively on degradative chemistry and elemental analysis requiring
dozens of grams of crystallised material. Often more than 100 years
passed between the first isolation and the final correct structure,
examples being morphine, strychnine and patchoulol. With the advent
of ultraviolet (UV), infrared (IR), mass spectrometry (MS) and nuclear
magnetic resonance (NMR), this all changed and nowadays a new
structure is solved within days or weeks instead of a century.
Of those four spectroscopic techniques, NMR is the most power-
ful one, requiring only sub milligram quantities of amorphous products
for a whole range of highly informative two-dimensional (2D) spectra.
It provides detailed information on the local chemical environment,
connectivity and stereochemistry of individual hydrogen and carbon
†Dedicated to Koji Nakanishi, a kind and eminent natural product chemist, an early user of
NMR and discoverer of the ginkgolides, who passed away on 28 March 2019 at the age of
93.
Received: 31 October 2019 Revised: 14 December 2019 Accepted: 28 December 2019
DOI: 10.1002/pca.2921
This is an open access article under the terms of the Creative Commons Attribution License, which permits use, distribution and reproduction in any medium,
provided the original work is properly cited.
© 2020 The Authors. Phytochemical Analysis published by John Wiley & Sons Ltd
24 Phytochemical Analysis. 2021;32:24–37.wileyonlinelibrary.com/journal/pca
atoms. The basics of NMR were developed in the 1950s and the first
commercial instruments, like the Varian A60 (60 MHz) appeared in
the early 1960s.1 Synthetic organic chemists and natural product
chemists immediately recognised the usefulness of NMR, even if only
for proton (1H) at 60 MHz in one dimension.
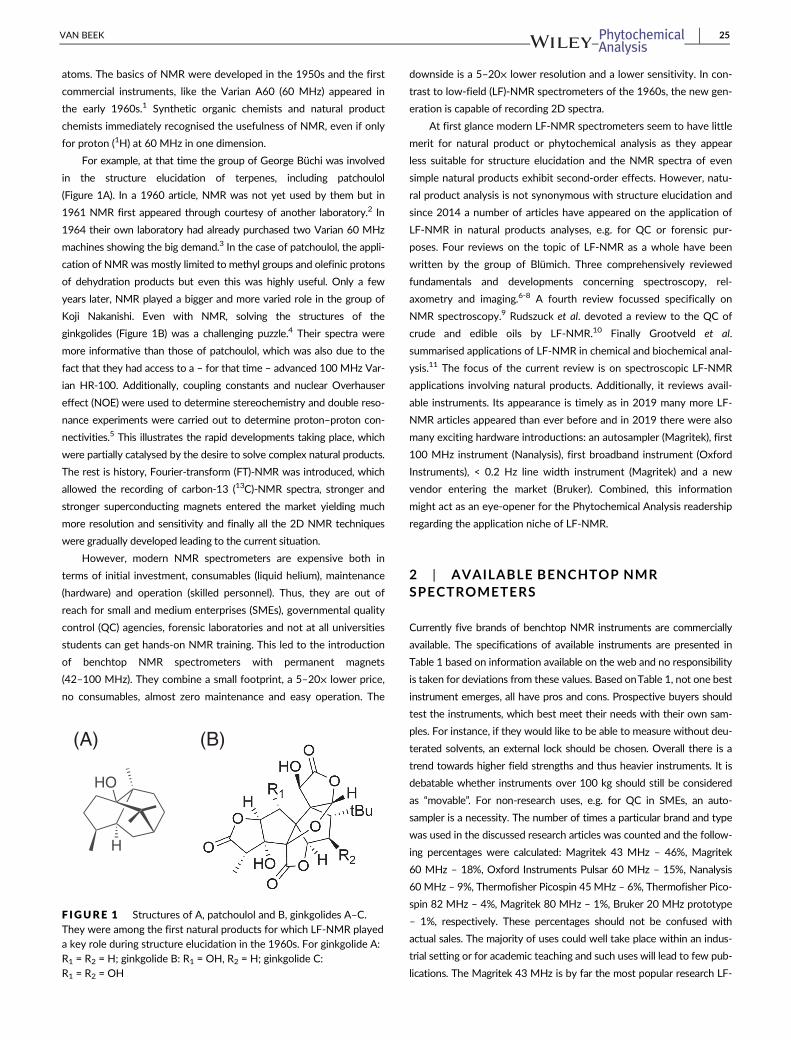
For example, at that time the group of George Büchi was involved
in the structure elucidation of terpenes, including patchoulol
(Figure 1A). In a 1960 article, NMR was not yet used by them but in
1961 NMR first appeared through courtesy of another laboratory.2 In
1964 their own laboratory had already purchased two Varian 60 MHz
machines showing the big demand.3 In the case of patchoulol, the appli-
cation of NMR was mostly limited to methyl groups and olefinic protons
of dehydration products but even this was highly useful. Only a few
years later, NMR played a bigger and more varied role in the group of
Koji Nakanishi. Even with NMR, solving the structures of the
ginkgolides (Figure 1B) was a challenging puzzle.4 Their spectra were
more informative than those of patchoulol, which was also due to the
fact that they had access to a – for that time – advanced 100 MHz Var-
ian HR-100. Additionally, coupling constants and nuclear Overhauser
effect (NOE) were used to determine stereochemistry and double reso-
nance experiments were carried out to determine proton–proton con-
nectivities.5 This illustrates the rapid developments taking place, which
were partially catalysed by the desire to solve complex natural products.
The rest is history, Fourier-transform (FT)-NMR was introduced, which
allowed the recording of carbon-13 (13C)-NMR spectra, stronger and
stronger superconducting magnets entered the market yielding much
more resolution and sensitivity and finally all the 2D NMR techniques
were gradually developed leading to the current situation.
However, modern NMR spectrometers are expensive both in
terms of initial investment, consumables (liquid helium), maintenance
(hardware) and operation (skilled personnel). Thus, they are out of
reach for small and medium enterprises (SMEs), governmental quality
control (QC) agencies, forensic laboratories and not at all universities
students can get hands-on NMR training. This led to the introduction
of benchtop NMR spectrometers with permanent magnets
(42–100 MHz). They combine a small footprint, a 5–20× lower price,
no consumables, almost zero maintenance and easy operation. The
downside is a 5–20× lower resolution and a lower sensitivity. In con-
trast to low-field (LF)-NMR spectrometers of the 1960s, the new gen-
eration is capable of recording 2D spectra.
At first glance modern LF-NMR spectrometers seem to have little
merit for natural product or phytochemical analysis as they appear
less suitable for structure elucidation and the NMR spectra of even
simple natural products exhibit second-order effects. However, natu-
ral product analysis is not synonymous with structure elucidation and
since 2014 a number of articles have appeared on the application of
LF-NMR in natural products analyses, e.g. for QC or forensic pur-
poses. Four reviews on the topic of LF-NMR as a whole have been
written by the group of Blümich. Three comprehensively reviewed
fundamentals and developments concerning spectroscopy, rel-
axometry and imaging.6-8 A fourth review focussed specifically on
NMR spectroscopy.9 Rudszuck et al. devoted a review to the QC of
crude and edible oils by LF-NMR.10 Finally Grootveld et al.
summarised applications of LF-NMR in chemical and biochemical anal-
ysis.11 The focus of the current review is on spectroscopic LF-NMR
applications involving natural products. Additionally, it reviews avail-
able instruments. Its appearance is timely as in 2019 many more LF-
NMR articles appeared than ever before and in 2019 there were also
many exciting hardware introductions: an autosampler (Magritek), first
100 MHz instrument (Nanalysis), first broadband instrument (Oxford
Instruments), < 0.2 Hz line width instrument (Magritek) and a new
vendor entering the market (Bruker). Combined, this information
might act as an eye-opener for the Phytochemical Analysis readership
regarding the application niche of LF-NMR.
2 | AVAILABLE BENCHTOP NMRSPECTROMETERS
Currently five brands of benchtop NMR instruments are commercially
available. The specifications of available instruments are presented in
Table 1 based on information available on the web and no responsibility
is taken for deviations from these values. Based onTable 1, not one best
instrument emerges, all have pros and cons. Prospective buyers should
test the instruments, which best meet their needs with their own sam-
ples. For instance, if they would like to be able to measure without deu-
terated solvents, an external lock should be chosen. Overall there is a
trend towards higher field strengths and thus heavier instruments. It is
debatable whether instruments over 100 kg should still be considered
as “movable”. For non-research uses, e.g. for QC in SMEs, an auto-
sampler is a necessity. The number of times a particular brand and type
was used in the discussed research articles was counted and the follow-
ing percentages were calculated: Magritek 43 MHz – 46%, Magritek
60 MHz – 18%, Oxford Instruments Pulsar 60 MHz – 15%, Nanalysis
60 MHz – 9%, Thermofisher Picospin 45MHz – 6%, Thermofisher Pico-
spin 82 MHz – 4%, Magritek 80 MHz – 1%, Bruker 20 MHz prototype
– 1%, respectively. These percentages should not be confused with
actual sales. The majority of uses could well take place within an indus-
trial setting or for academic teaching and such uses will lead to few pub-
lications. The Magritek 43 MHz is by far the most popular research LF-
(A) (B)
F IGURE 1 Structures of A, patchoulol and B, ginkgolides A–C.They were among the first natural products for which LF-NMR playeda key role during structure elucidation in the 1960s. For ginkgolide A:R1 = R2 = H; ginkgolide B: R1 = OH, R2 = H; ginkgolide C:R1 = R2 = OH
VAN BEEK 25
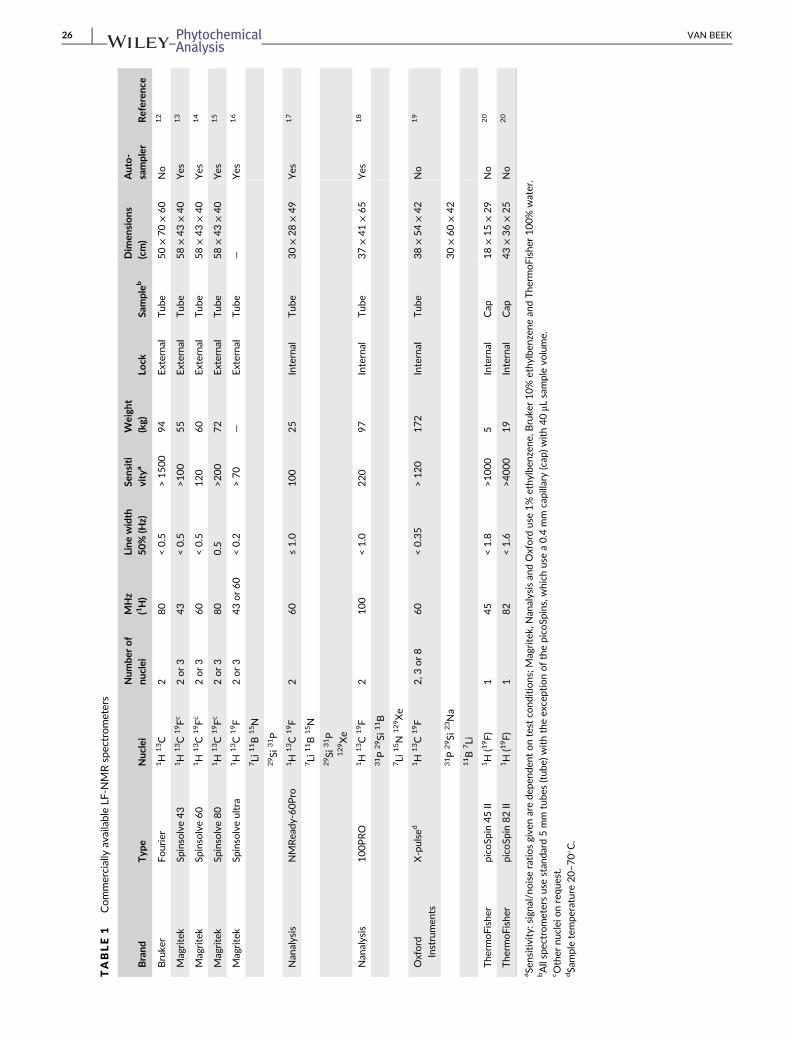
TABLE1
CommerciallyavailableLF
-NMRspectrometers
Brand
Typ
eNuc
lei
Num
berof
nuc
lei
MHz
(1H)
Line
width
50%
(Hz)
Sensiti
vity
a
Weigh
t(kg)
Lock
Sample
b
Dim
ensions
(cm)
Auto-
sampler
Referen
ce
Bruke
rFourier
1H
13C
280
<0.5
>1500
94
Externa
lTube
50×70×60
No
12
Magritek
Spinsolve43
1H
13C
19Fc
2or3
43
<0.5
>100
55
Externa
lTube
58×43×40
Yes
13
Magritek
Spinsolve60
1H
13C
19Fc
2or3
60
<0.5
120
60
Externa
lTube
58×43×40
Yes
14
Magritek
Spinsolve80
1H
13C
19Fc
2or3
80
0.5
>200
72
Externa
lTube
58×43×40
Yes
15
Magritek
Spinsolveultra
1H
13C
19F
2or3
43or60
<0.2
>70
—Externa
lTube
—Yes
16
7Li
11B
15N
29Si
31P
Nan
alysis
NMRea
dy-60Pro
1H
13C
19F
260
≤1.0
100
25
Internal
Tube
30×28×49
Yes
17
7Li
11B
15N
29Si
31P
129Xe
Nan
alysis
100PRO
1H
13C
19F
2100
<1.0
220
97
Internal
Tube
37×41×65
Yes
18
31P
29Si
11B
7Li
15N
129Xe
Oxford
Instrumen
ts
X-pulse
d1H
13C
19F
2,3
or8
60
<0.35
>120
172
Internal
Tube
38×54×42
No
19
31P
29Si
23Na
30×60×42
11B
7Li
The
rmoFishe
rpico
Spin
45II
1H
(19F)
145
<1.8
>1000
5Internal
Cap
18×15×29
No
20
The
rmoFishe
rpico
Spin
82II
1H
(19F)
182
<1.6
>4000
19
Internal
Cap
43×36×25
No
20
aSe
nsitivity:
sign
al/noiseratiosgive
narede
pend
entontest
cond
itions;M
agritek,Nan
alysisan
dOxford
use1%
ethy
lben
zene
,Bruke
r10%
ethy
lben
zenean
dThermoFisher
100%
water.
bAllspectrometersusestan
dard
5mm
tube
s(tub
e)withtheex
ceptionofthepico
Spins,which
usea0.4
mm
capillary
(cap
)with40μL
samplevo
lume.
c Other
nuclei
onrequ
est.
dSa
mpletempe
rature
20–7
0� C
.
26 VAN BEEK
NMR. This is partially caused by the fact that the key players in the LF-
NMR field, Bernhard Blümich and Patrick Giraudeau, have been using
this instrument.
Two more manufacturers of low-field or cryogen-free instru-
ments exist: Anasazi and HTS-110. However, as their spectrometers
cannot be considered as benchtop they are not included inTable 1.
3 | LF-NMR APPLICATIONS
This review is restricted to articles making use of NMR spectroscopy
and commercially available LF-NMR spectrometers. In the following par-
agraph, all LF-NMR applications involving natural products or plant
matrixes have been subdivided in five categories: (1) quality control and
adulteration detection, (2) forensic applications, (3) food and health appli-
cations, (4) process control, and (5) teaching. InTable S1 there is a listing
of relevant papers making use of non-spectroscopic NMR approaches
such as relaxation, diffusion and imaging, or home-built equipment.
3.1 | LF-NMR in quality control and adulterationdetection
This is an important field and the application of NMR in general to
detect food fraud was recently separately reviewed. Some attention
to LF-NMR was given and according to the authors benchtop NMR is
potentially a breakthrough technology in food authentication.21
Parker et al. in 2014 were the first to apply LF-NMR in phytochemi-
cal analysis.22 They wished to detect adulteration of olive oil with hazel-
nut oil. This was highly challenging as these two vegetable oils possess
an almost identical fatty acid (FA) composition, the only difference being
the ~6% higher content of double unsaturated fatty acids (UFAs) of
hazelnut oil. Thus, the peak area ratio of olefinic peaks (~5.3 ppm, also
including H2 of glycerol) versus H1 and H3 of glycerol (~4.2 ppm) was
determined for both oils. This ratio was 1.70 and 1.52 for hazelnut and
olive oil, respectively, but due to natural variation the most extreme
values were almost identical. The final result was that 13% (w/w) hazel-
nut adulteration could be detected with 95% confidence. Additionally,
they used a chemometric approach using the shape of the entire spec-
trum. This allowed for the detection of 11% adulteration with 95% con-
fidence. Thus, the method is not fool-proof, false negatives and
especially false positives will occur occasionally. Compared to an FT-IR
method, the 60 MHz NMRmethod performed better.22
The earlier-mentioned study was summarised in a subsequent arti-
cle by this group together with new results.23 Vegetable oil samples
were diluted 1:1 with chloroform (CHCl3) and measured at 60 MHz.
Integration of various triacylglycerol (TAG) peaks (0.9 ppm = ω-3 CH3;
2.7 ppm = bis-allylic CH2; 5.2 ppm = olefinic peak; remaining FAs are
saturated) allowed to calculate the percentage of ω-3 FAs, polyunsatu-
rated fatty acids (PUFAs), monounsaturated fatty acids (MUFAs) and
saturated fatty acids (SFAs), respectively, and an excellent correspon-
dence was found with gas chromatography flame ionisation detector
(GC-FID) data. Even for a whole range of complex foods, such as rolls,
pies and crisps, a fair correspondence with the labelled SFAs was found.
Through chemometric treatment [principal component analysis (PCA)]
of the LF-NMR data, 10 different vegetable oils could be clearly distin-
guished. Not surprisingly, as the analytes (TAGs) are the same, the
methodology could also distinguish between different types of meats
and detect adulteration of sunflower oil with lard.23 The meat applica-
tion was also separately published.24
Riegel investigated adulteration of olive oil with soybean oil.25 To
this purpose, solutions in CDCl3 of olive oils spiked with 5–60% of
soybean oil were measured at 60 MHz. As soybean oil has a much
higher content of PUFAs, plotting the percentage of bis-allylic protons
against the soybean oil percentage gave a straight line. By means of
this curve the extent of adulteration could be determined. Possible
pitfalls are that beforehand it is not always known which vegetable oil
is used for adulteration and the natural variation in FA composition of
both olive and soybean oil will influence the calibration curve.
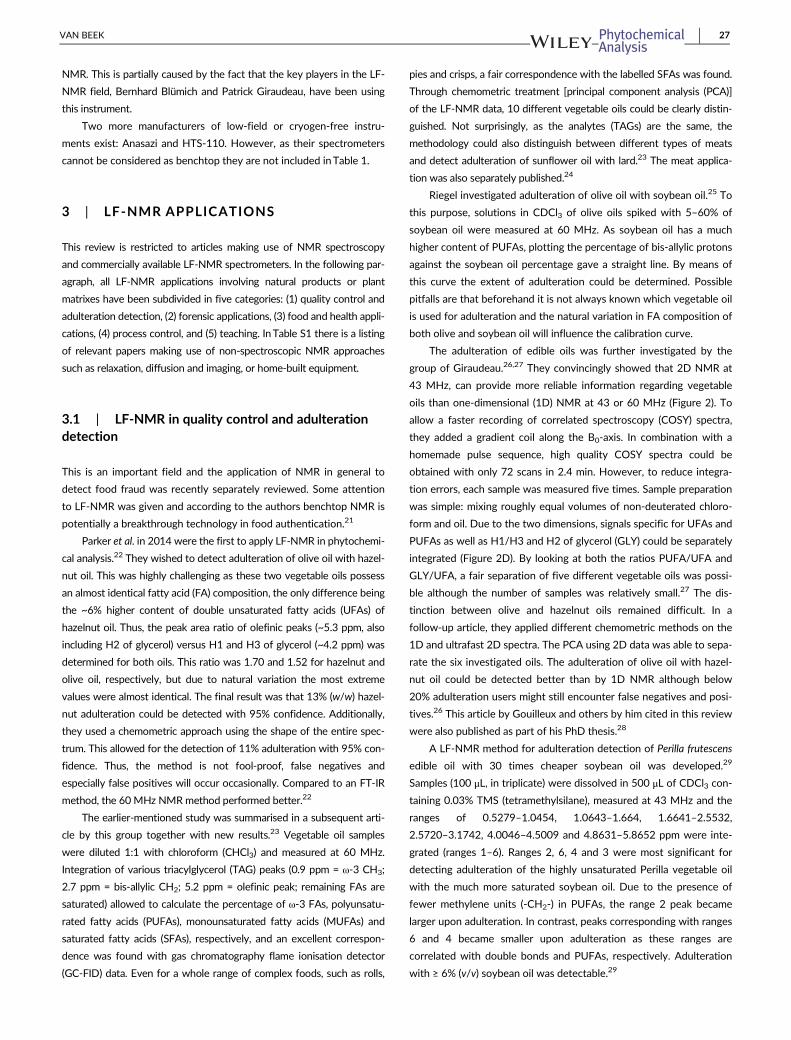
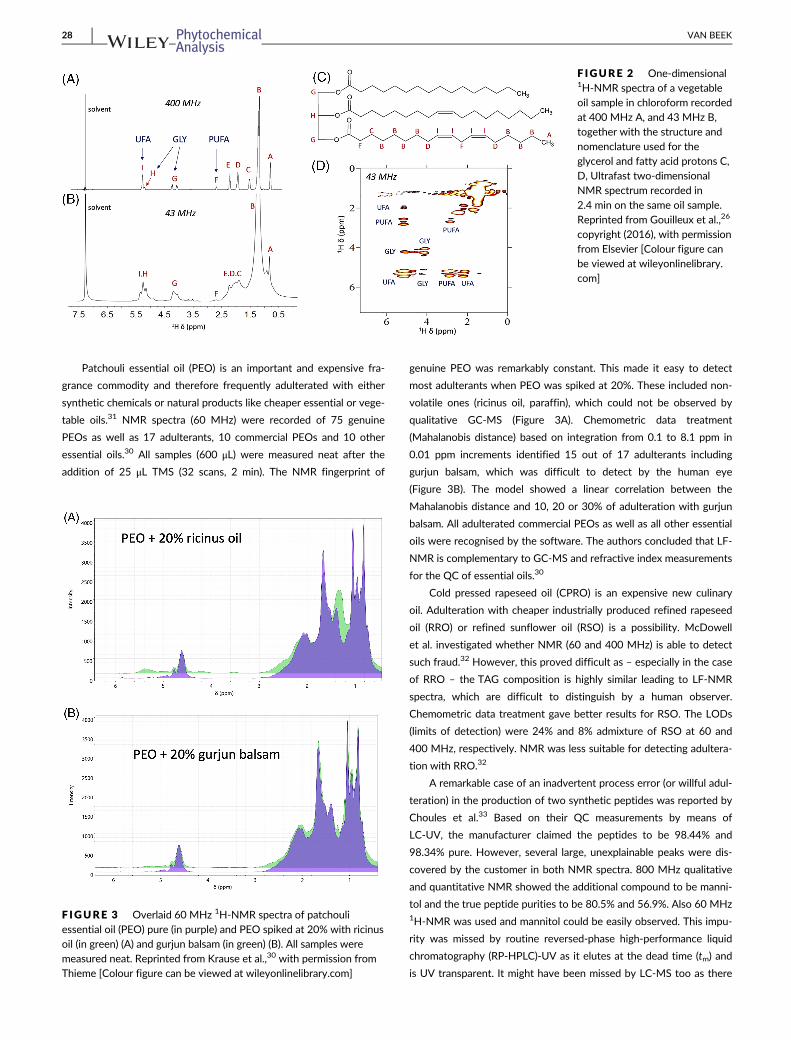
The adulteration of edible oils was further investigated by the
group of Giraudeau.26,27 They convincingly showed that 2D NMR at
43 MHz, can provide more reliable information regarding vegetable
oils than one-dimensional (1D) NMR at 43 or 60 MHz (Figure 2). To
allow a faster recording of correlated spectroscopy (COSY) spectra,
they added a gradient coil along the B0-axis. In combination with a
homemade pulse sequence, high quality COSY spectra could be
obtained with only 72 scans in 2.4 min. However, to reduce integra-
tion errors, each sample was measured five times. Sample preparation
was simple: mixing roughly equal volumes of non-deuterated chloro-
form and oil. Due to the two dimensions, signals specific for UFAs and
PUFAs as well as H1/H3 and H2 of glycerol (GLY) could be separately
integrated (Figure 2D). By looking at both the ratios PUFA/UFA and
GLY/UFA, a fair separation of five different vegetable oils was possi-
ble although the number of samples was relatively small.27 The dis-
tinction between olive and hazelnut oils remained difficult. In a
follow-up article, they applied different chemometric methods on the
1D and ultrafast 2D spectra. The PCA using 2D data was able to sepa-
rate the six investigated oils. The adulteration of olive oil with hazel-
nut oil could be detected better than by 1D NMR although below
20% adulteration users might still encounter false negatives and posi-
tives.26 This article by Gouilleux and others by him cited in this review
were also published as part of his PhD thesis.28
A LF-NMR method for adulteration detection of Perilla frutescens
edible oil with 30 times cheaper soybean oil was developed.29
Samples (100 μL, in triplicate) were dissolved in 500 μL of CDCl3 con-
taining 0.03% TMS (tetramethylsilane), measured at 43 MHz and the
ranges of 0.5279–1.0454, 1.0643–1.664, 1.6641–2.5532,
2.5720–3.1742, 4.0046–4.5009 and 4.8631–5.8652 ppm were inte-
grated (ranges 1–6). Ranges 2, 6, 4 and 3 were most significant for
detecting adulteration of the highly unsaturated Perilla vegetable oil
with the much more saturated soybean oil. Due to the presence of
fewer methylene units (-CH2-) in PUFAs, the range 2 peak became
larger upon adulteration. In contrast, peaks corresponding with ranges
6 and 4 became smaller upon adulteration as these ranges are
correlated with double bonds and PUFAs, respectively. Adulteration
with ≥ 6% (v/v) soybean oil was detectable.29
VAN BEEK 27
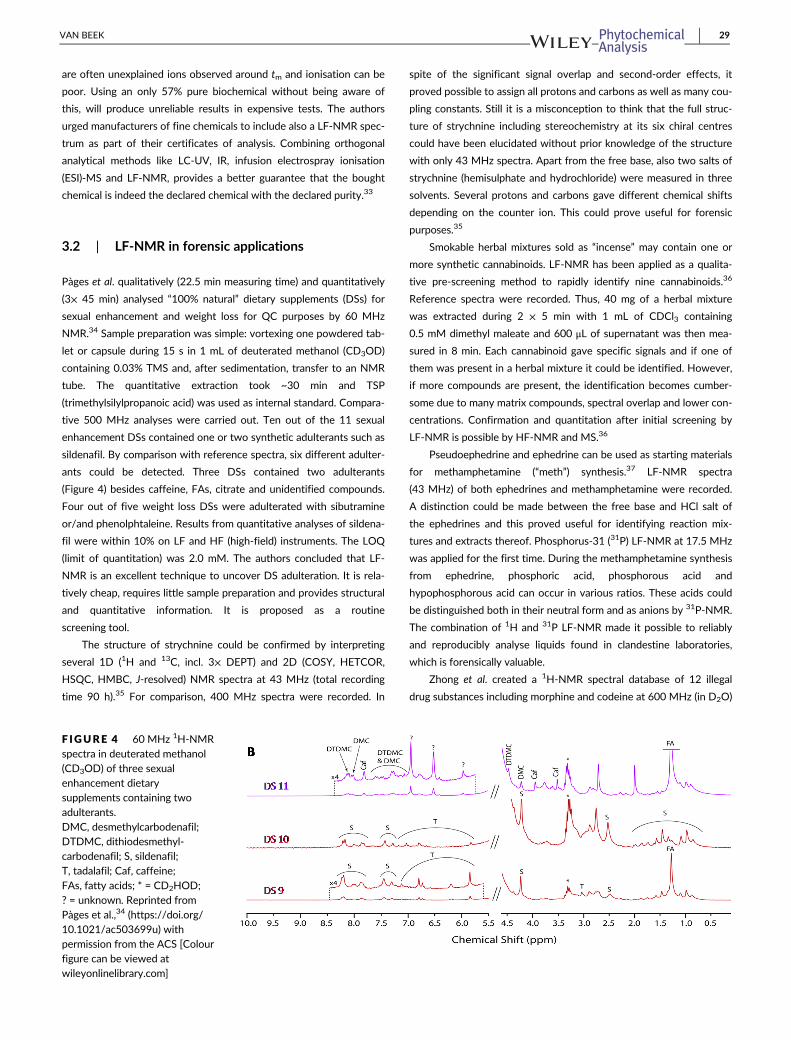
Patchouli essential oil (PEO) is an important and expensive fra-
grance commodity and therefore frequently adulterated with either
synthetic chemicals or natural products like cheaper essential or vege-
table oils.31 NMR spectra (60 MHz) were recorded of 75 genuine
PEOs as well as 17 adulterants, 10 commercial PEOs and 10 other
essential oils.30 All samples (600 μL) were measured neat after the
addition of 25 μL TMS (32 scans, 2 min). The NMR fingerprint of
genuine PEO was remarkably constant. This made it easy to detect
most adulterants when PEO was spiked at 20%. These included non-
volatile ones (ricinus oil, paraffin), which could not be observed by
qualitative GC-MS (Figure 3A). Chemometric data treatment
(Mahalanobis distance) based on integration from 0.1 to 8.1 ppm in
0.01 ppm increments identified 15 out of 17 adulterants including
gurjun balsam, which was difficult to detect by the human eye
(Figure 3B). The model showed a linear correlation between the
Mahalanobis distance and 10, 20 or 30% of adulteration with gurjun
balsam. All adulterated commercial PEOs as well as all other essential
oils were recognised by the software. The authors concluded that LF-
NMR is complementary to GC-MS and refractive index measurements
for the QC of essential oils.30
Cold pressed rapeseed oil (CPRO) is an expensive new culinary
oil. Adulteration with cheaper industrially produced refined rapeseed
oil (RRO) or refined sunflower oil (RSO) is a possibility. McDowell
et al. investigated whether NMR (60 and 400 MHz) is able to detect
such fraud.32 However, this proved difficult as – especially in the case
of RRO – the TAG composition is highly similar leading to LF-NMR
spectra, which are difficult to distinguish by a human observer.
Chemometric data treatment gave better results for RSO. The LODs
(limits of detection) were 24% and 8% admixture of RSO at 60 and
400 MHz, respectively. NMR was less suitable for detecting adultera-
tion with RRO.32
A remarkable case of an inadvertent process error (or willful adul-
teration) in the production of two synthetic peptides was reported by
Choules et al.33 Based on their QC measurements by means of
LC-UV, the manufacturer claimed the peptides to be 98.44% and
98.34% pure. However, several large, unexplainable peaks were dis-
covered by the customer in both NMR spectra. 800 MHz qualitative
and quantitative NMR showed the additional compound to be manni-
tol and the true peptide purities to be 80.5% and 56.9%. Also 60 MHz1H-NMR was used and mannitol could be easily observed. This impu-
rity was missed by routine reversed-phase high-performance liquid
chromatography (RP-HPLC)-UV as it elutes at the dead time (tm) and
is UV transparent. It might have been missed by LC-MS too as there
F IGURE 2 One-dimensional1H-NMR spectra of a vegetableoil sample in chloroform recordedat 400 MHz A, and 43 MHz B,together with the structure andnomenclature used for theglycerol and fatty acid protons C,D, Ultrafast two-dimensionalNMR spectrum recorded in
2.4 min on the same oil sample.Reprinted from Gouilleux et al.,26
copyright (2016), with permissionfrom Elsevier [Colour figure canbe viewed at wileyonlinelibrary.com]
F IGURE 3 Overlaid 60 MHz 1H-NMR spectra of patchouliessential oil (PEO) pure (in purple) and PEO spiked at 20% with ricinusoil (in green) (A) and gurjun balsam (in green) (B). All samples weremeasured neat. Reprinted from Krause et al.,30 with permission fromThieme [Colour figure can be viewed at wileyonlinelibrary.com]
28 VAN BEEK
are often unexplained ions observed around tm and ionisation can be
poor. Using an only 57% pure biochemical without being aware of
this, will produce unreliable results in expensive tests. The authors
urged manufacturers of fine chemicals to include also a LF-NMR spec-
trum as part of their certificates of analysis. Combining orthogonal
analytical methods like LC-UV, IR, infusion electrospray ionisation
(ESI)-MS and LF-NMR, provides a better guarantee that the bought
chemical is indeed the declared chemical with the declared purity.33
3.2 | LF-NMR in forensic applications
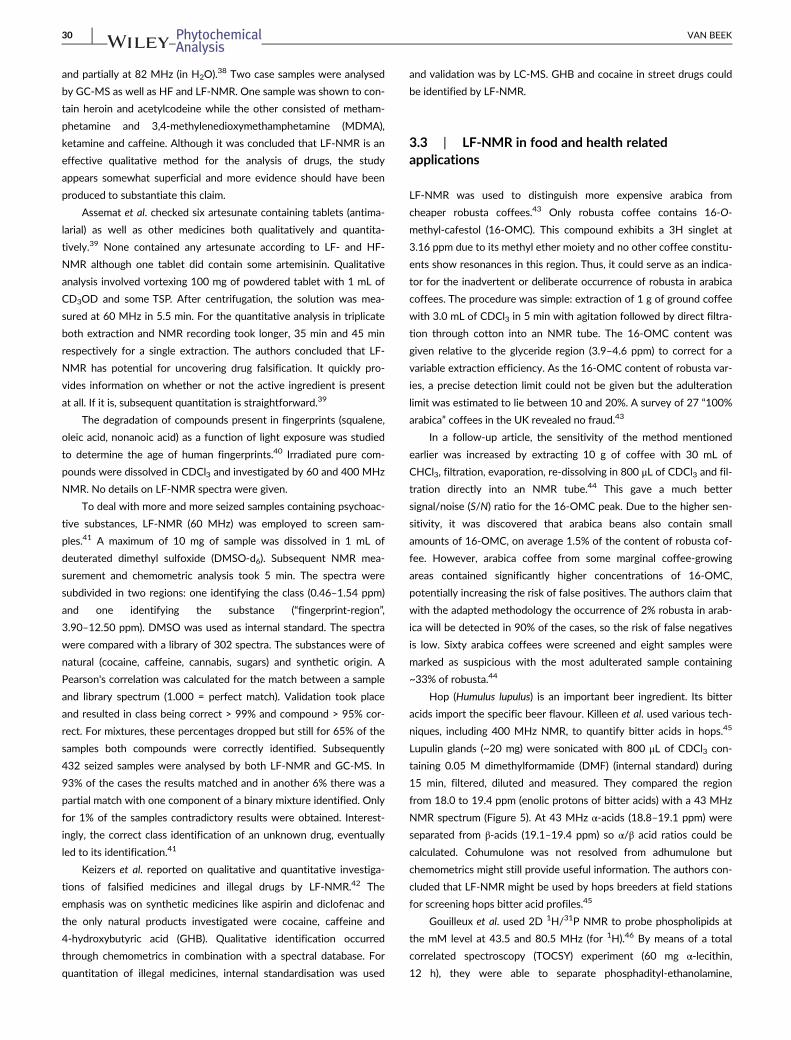
Pàges et al. qualitatively (22.5 min measuring time) and quantitatively
(3× 45 min) analysed “100% natural” dietary supplements (DSs) for
sexual enhancement and weight loss for QC purposes by 60 MHz
NMR.34 Sample preparation was simple: vortexing one powdered tab-
let or capsule during 15 s in 1 mL of deuterated methanol (CD3OD)
containing 0.03% TMS and, after sedimentation, transfer to an NMR
tube. The quantitative extraction took ~30 min and TSP
(trimethylsilylpropanoic acid) was used as internal standard. Compara-
tive 500 MHz analyses were carried out. Ten out of the 11 sexual
enhancement DSs contained one or two synthetic adulterants such as
sildenafil. By comparison with reference spectra, six different adulter-
ants could be detected. Three DSs contained two adulterants
(Figure 4) besides caffeine, FAs, citrate and unidentified compounds.
Four out of five weight loss DSs were adulterated with sibutramine
or/and phenolphtaleine. Results from quantitative analyses of sildena-
fil were within 10% on LF and HF (high-field) instruments. The LOQ
(limit of quantitation) was 2.0 mM. The authors concluded that LF-
NMR is an excellent technique to uncover DS adulteration. It is rela-
tively cheap, requires little sample preparation and provides structural
and quantitative information. It is proposed as a routine
screening tool.
The structure of strychnine could be confirmed by interpreting
several 1D (1H and 13C, incl. 3× DEPT) and 2D (COSY, HETCOR,
HSQC, HMBC, J-resolved) NMR spectra at 43 MHz (total recording
time 90 h).35 For comparison, 400 MHz spectra were recorded. In
spite of the significant signal overlap and second-order effects, it
proved possible to assign all protons and carbons as well as many cou-
pling constants. Still it is a misconception to think that the full struc-
ture of strychnine including stereochemistry at its six chiral centres
could have been elucidated without prior knowledge of the structure
with only 43 MHz spectra. Apart from the free base, also two salts of
strychnine (hemisulphate and hydrochloride) were measured in three
solvents. Several protons and carbons gave different chemical shifts
depending on the counter ion. This could prove useful for forensic
purposes.35
Smokable herbal mixtures sold as “incense” may contain one or
more synthetic cannabinoids. LF-NMR has been applied as a qualita-
tive pre-screening method to rapidly identify nine cannabinoids.36
Reference spectra were recorded. Thus, 40 mg of a herbal mixture
was extracted during 2 × 5 min with 1 mL of CDCl3 containing
0.5 mM dimethyl maleate and 600 μL of supernatant was then mea-
sured in 8 min. Each cannabinoid gave specific signals and if one of
them was present in a herbal mixture it could be identified. However,
if more compounds are present, the identification becomes cumber-
some due to many matrix compounds, spectral overlap and lower con-
centrations. Confirmation and quantitation after initial screening by
LF-NMR is possible by HF-NMR and MS.36
Pseudoephedrine and ephedrine can be used as starting materials
for methamphetamine (“meth”) synthesis.37 LF-NMR spectra
(43 MHz) of both ephedrines and methamphetamine were recorded.
A distinction could be made between the free base and HCl salt of
the ephedrines and this proved useful for identifying reaction mix-
tures and extracts thereof. Phosphorus-31 (31P) LF-NMR at 17.5 MHz
was applied for the first time. During the methamphetamine synthesis
from ephedrine, phosphoric acid, phosphorous acid and
hypophosphorous acid can occur in various ratios. These acids could
be distinguished both in their neutral form and as anions by 31P-NMR.
The combination of 1H and 31P LF-NMR made it possible to reliably
and reproducibly analyse liquids found in clandestine laboratories,
which is forensically valuable.
Zhong et al. created a 1H-NMR spectral database of 12 illegal
drug substances including morphine and codeine at 600 MHz (in D2O)
F IGURE 4 60 MHz 1H-NMRspectra in deuterated methanol(CD3OD) of three sexualenhancement dietarysupplements containing twoadulterants.DMC, desmethylcarbodenafil;DTDMC, dithiodesmethyl-carbodenafil; S, sildenafil;T, tadalafil; Caf, caffeine;
FAs, fatty acids; * = CD2HOD;? = unknown. Reprinted fromPàges et al.,34 (https://doi.org/10.1021/ac503699u) withpermission from the ACS [Colourfigure can be viewed atwileyonlinelibrary.com]
VAN BEEK 29
and partially at 82 MHz (in H2O).38 Two case samples were analysed
by GC-MS as well as HF and LF-NMR. One sample was shown to con-
tain heroin and acetylcodeine while the other consisted of metham-
phetamine and 3,4-methylenedioxymethamphetamine (MDMA),
ketamine and caffeine. Although it was concluded that LF-NMR is an
effective qualitative method for the analysis of drugs, the study
appears somewhat superficial and more evidence should have been
produced to substantiate this claim.
Assemat et al. checked six artesunate containing tablets (antima-
larial) as well as other medicines both qualitatively and quantita-
tively.39 None contained any artesunate according to LF- and HF-
NMR although one tablet did contain some artemisinin. Qualitative
analysis involved vortexing 100 mg of powdered tablet with 1 mL of
CD3OD and some TSP. After centrifugation, the solution was mea-
sured at 60 MHz in 5.5 min. For the quantitative analysis in triplicate
both extraction and NMR recording took longer, 35 min and 45 min
respectively for a single extraction. The authors concluded that LF-
NMR has potential for uncovering drug falsification. It quickly pro-
vides information on whether or not the active ingredient is present
at all. If it is, subsequent quantitation is straightforward.39
The degradation of compounds present in fingerprints (squalene,
oleic acid, nonanoic acid) as a function of light exposure was studied
to determine the age of human fingerprints.40 Irradiated pure com-
pounds were dissolved in CDCl3 and investigated by 60 and 400 MHz
NMR. No details on LF-NMR spectra were given.
To deal with more and more seized samples containing psychoac-
tive substances, LF-NMR (60 MHz) was employed to screen sam-
ples.41 A maximum of 10 mg of sample was dissolved in 1 mL of
deuterated dimethyl sulfoxide (DMSO-d6). Subsequent NMR mea-
surement and chemometric analysis took 5 min. The spectra were
subdivided in two regions: one identifying the class (0.46–1.54 ppm)
and one identifying the substance (“fingerprint-region”,
3.90–12.50 ppm). DMSO was used as internal standard. The spectra
were compared with a library of 302 spectra. The substances were of
natural (cocaine, caffeine, cannabis, sugars) and synthetic origin. A
Pearson's correlation was calculated for the match between a sample
and library spectrum (1.000 = perfect match). Validation took place
and resulted in class being correct > 99% and compound > 95% cor-
rect. For mixtures, these percentages dropped but still for 65% of the
samples both compounds were correctly identified. Subsequently
432 seized samples were analysed by both LF-NMR and GC-MS. In
93% of the cases the results matched and in another 6% there was a
partial match with one component of a binary mixture identified. Only
for 1% of the samples contradictory results were obtained. Interest-
ingly, the correct class identification of an unknown drug, eventually
led to its identification.41
Keizers et al. reported on qualitative and quantitative investiga-
tions of falsified medicines and illegal drugs by LF-NMR.42 The
emphasis was on synthetic medicines like aspirin and diclofenac and
the only natural products investigated were cocaine, caffeine and
4-hydroxybutyric acid (GHB). Qualitative identification occurred
through chemometrics in combination with a spectral database. For
quantitation of illegal medicines, internal standardisation was used
and validation was by LC-MS. GHB and cocaine in street drugs could
be identified by LF-NMR.
3.3 | LF-NMR in food and health relatedapplications
LF-NMR was used to distinguish more expensive arabica from
cheaper robusta coffees.43 Only robusta coffee contains 16-O-
methyl-cafestol (16-OMC). This compound exhibits a 3H singlet at
3.16 ppm due to its methyl ether moiety and no other coffee constitu-
ents show resonances in this region. Thus, it could serve as an indica-
tor for the inadvertent or deliberate occurrence of robusta in arabica
coffees. The procedure was simple: extraction of 1 g of ground coffee
with 3.0 mL of CDCl3 in 5 min with agitation followed by direct filtra-
tion through cotton into an NMR tube. The 16-OMC content was
given relative to the glyceride region (3.9–4.6 ppm) to correct for a
variable extraction efficiency. As the 16-OMC content of robusta var-
ies, a precise detection limit could not be given but the adulteration
limit was estimated to lie between 10 and 20%. A survey of 27 “100%
arabica” coffees in the UK revealed no fraud.43
In a follow-up article, the sensitivity of the method mentioned
earlier was increased by extracting 10 g of coffee with 30 mL of
CHCl3, filtration, evaporation, re-dissolving in 800 μL of CDCl3 and fil-
tration directly into an NMR tube.44 This gave a much better
signal/noise (S/N) ratio for the 16-OMC peak. Due to the higher sen-
sitivity, it was discovered that arabica beans also contain small
amounts of 16-OMC, on average 1.5% of the content of robusta cof-
fee. However, arabica coffee from some marginal coffee-growing
areas contained significantly higher concentrations of 16-OMC,
potentially increasing the risk of false positives. The authors claim that
with the adapted methodology the occurrence of 2% robusta in arab-
ica will be detected in 90% of the cases, so the risk of false negatives
is low. Sixty arabica coffees were screened and eight samples were
marked as suspicious with the most adulterated sample containing
~33% of robusta.44
Hop (Humulus lupulus) is an important beer ingredient. Its bitter
acids import the specific beer flavour. Killeen et al. used various tech-
niques, including 400 MHz NMR, to quantify bitter acids in hops.45
Lupulin glands (~20 mg) were sonicated with 800 μL of CDCl3 con-
taining 0.05 M dimethylformamide (DMF) (internal standard) during
15 min, filtered, diluted and measured. They compared the region
from 18.0 to 19.4 ppm (enolic protons of bitter acids) with a 43 MHz
NMR spectrum (Figure 5). At 43 MHz α-acids (18.8–19.1 ppm) were
separated from β-acids (19.1–19.4 ppm) so α/β acid ratios could be
calculated. Cohumulone was not resolved from adhumulone but
chemometrics might still provide useful information. The authors con-
cluded that LF-NMR might be used by hops breeders at field stations
for screening hops bitter acid profiles.45
Gouilleux et al. used 2D 1H/31P NMR to probe phospholipids at
the mM level at 43.5 and 80.5 MHz (for 1H).46 By means of a total
correlated spectroscopy (TOCSY) experiment (60 mg α-lecithin,
12 h), they were able to separate phosphadityl-ethanolamine,
30 VAN BEEK
phosphaditylinositol and phosphaditylcholine and determine their rel-
ative concentrations. Absolute quantitation proved possible by two
different methods (relaxation reagent or 1H excitation and
magnetisation transfer to 31P) both overcoming long 31P relaxation
times. Both methods had their pros and cons but both yielded fair
accuracy (maximum 0.5–9% deviation) and relative standard devia-
tions (RSDs) (2–5%) making LF-NMR a promising tool for
lipidomics.46
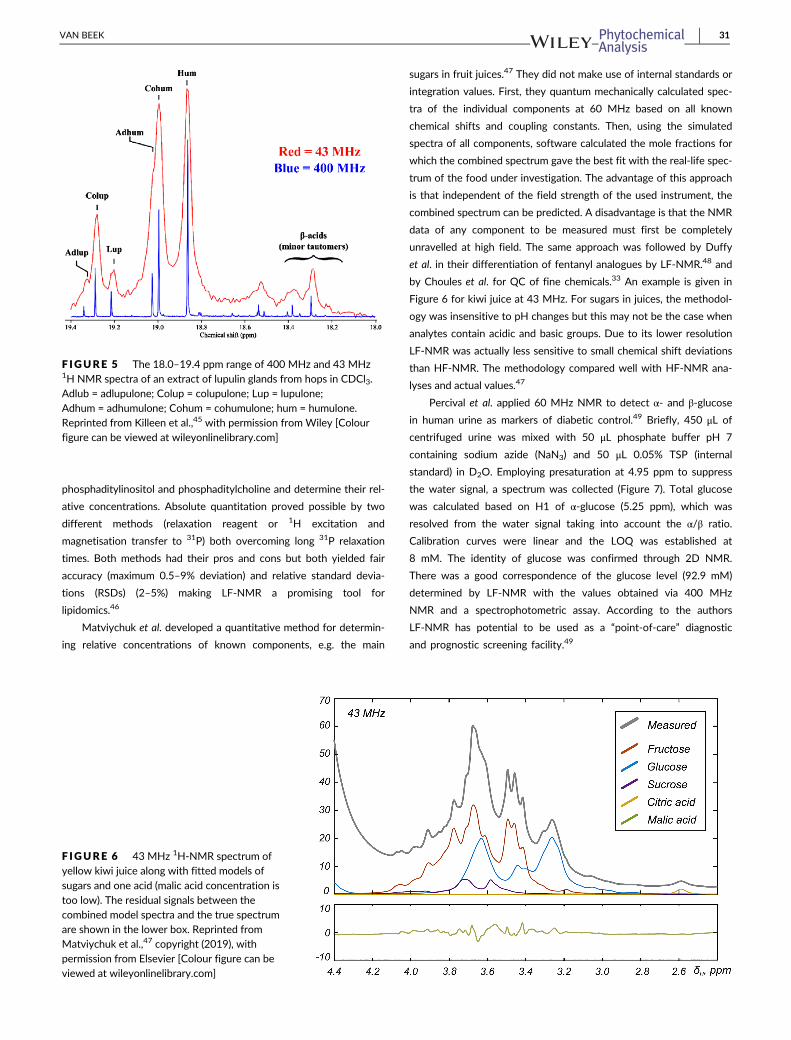
Matviychuk et al. developed a quantitative method for determin-
ing relative concentrations of known components, e.g. the main
sugars in fruit juices.47 They did not make use of internal standards or
integration values. First, they quantum mechanically calculated spec-
tra of the individual components at 60 MHz based on all known
chemical shifts and coupling constants. Then, using the simulated
spectra of all components, software calculated the mole fractions for
which the combined spectrum gave the best fit with the real-life spec-
trum of the food under investigation. The advantage of this approach
is that independent of the field strength of the used instrument, the
combined spectrum can be predicted. A disadvantage is that the NMR
data of any component to be measured must first be completely
unravelled at high field. The same approach was followed by Duffy
et al. in their differentiation of fentanyl analogues by LF-NMR.48 and
by Choules et al. for QC of fine chemicals.33 An example is given in
Figure 6 for kiwi juice at 43 MHz. For sugars in juices, the methodol-
ogy was insensitive to pH changes but this may not be the case when
analytes contain acidic and basic groups. Due to its lower resolution
LF-NMR was actually less sensitive to small chemical shift deviations
than HF-NMR. The methodology compared well with HF-NMR ana-
lyses and actual values.47
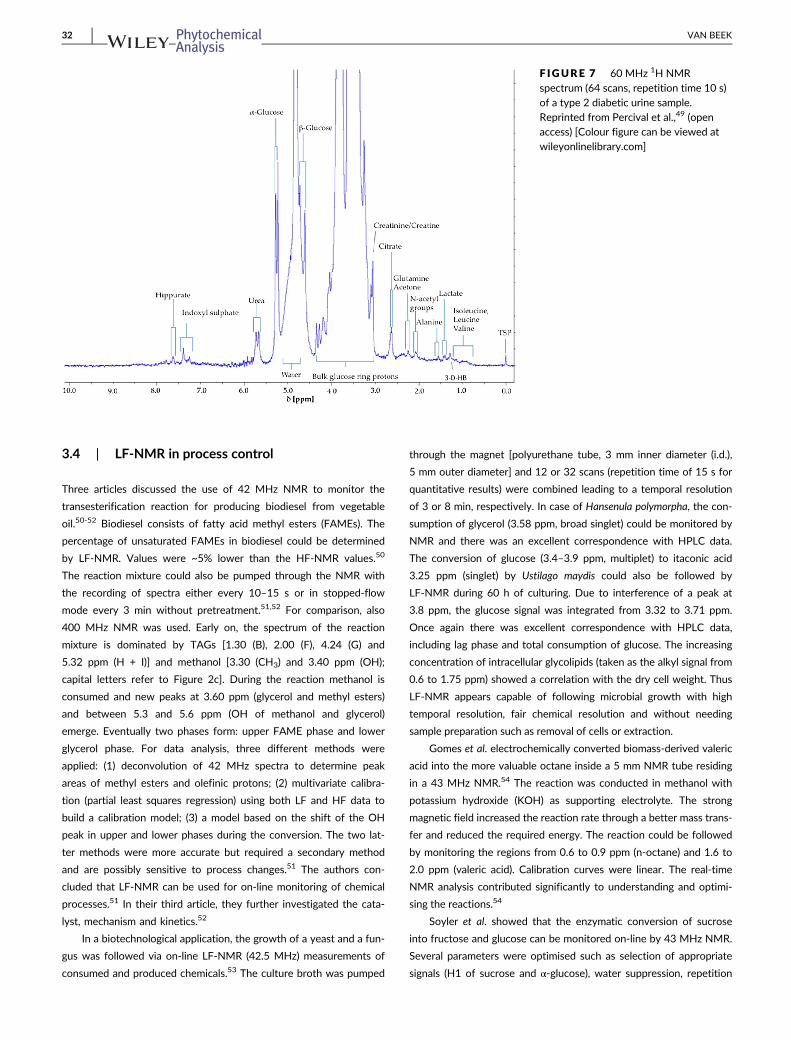
Percival et al. applied 60 MHz NMR to detect α- and β-glucose
in human urine as markers of diabetic control.49 Briefly, 450 μL of
centrifuged urine was mixed with 50 μL phosphate buffer pH 7
containing sodium azide (NaN3) and 50 μL 0.05% TSP (internal
standard) in D2O. Employing presaturation at 4.95 ppm to suppress
the water signal, a spectrum was collected (Figure 7). Total glucose
was calculated based on H1 of α-glucose (5.25 ppm), which was
resolved from the water signal taking into account the α/β ratio.
Calibration curves were linear and the LOQ was established at
8 mM. The identity of glucose was confirmed through 2D NMR.
There was a good correspondence of the glucose level (92.9 mM)
determined by LF-NMR with the values obtained via 400 MHz
NMR and a spectrophotometric assay. According to the authors
LF-NMR has potential to be used as a “point-of-care” diagnostic
and prognostic screening facility.49
F IGURE 5 The 18.0–19.4 ppm range of 400 MHz and 43 MHz1H NMR spectra of an extract of lupulin glands from hops in CDCl3.Adlub = adlupulone; Colup = colupulone; Lup = lupulone;Adhum = adhumulone; Cohum = cohumulone; hum = humulone.Reprinted from Killeen et al.,45 with permission from Wiley [Colourfigure can be viewed at wileyonlinelibrary.com]
F IGURE 6 43 MHz 1H-NMR spectrum ofyellow kiwi juice along with fitted models of
sugars and one acid (malic acid concentration istoo low). The residual signals between thecombined model spectra and the true spectrumare shown in the lower box. Reprinted fromMatviychuk et al.,47 copyright (2019), withpermission from Elsevier [Colour figure can beviewed at wileyonlinelibrary.com]
VAN BEEK 31
3.4 | LF-NMR in process control
Three articles discussed the use of 42 MHz NMR to monitor the
transesterification reaction for producing biodiesel from vegetable
oil.50-52 Biodiesel consists of fatty acid methyl esters (FAMEs). The
percentage of unsaturated FAMEs in biodiesel could be determined
by LF-NMR. Values were ~5% lower than the HF-NMR values.50
The reaction mixture could also be pumped through the NMR with
the recording of spectra either every 10–15 s or in stopped-flow
mode every 3 min without pretreatment.51,52 For comparison, also
400 MHz NMR was used. Early on, the spectrum of the reaction
mixture is dominated by TAGs [1.30 (B), 2.00 (F), 4.24 (G) and
5.32 ppm (H + I)] and methanol [3.30 (CH3) and 3.40 ppm (OH);
capital letters refer to Figure 2c]. During the reaction methanol is
consumed and new peaks at 3.60 ppm (glycerol and methyl esters)
and between 5.3 and 5.6 ppm (OH of methanol and glycerol)
emerge. Eventually two phases form: upper FAME phase and lower
glycerol phase. For data analysis, three different methods were
applied: (1) deconvolution of 42 MHz spectra to determine peak
areas of methyl esters and olefinic protons; (2) multivariate calibra-
tion (partial least squares regression) using both LF and HF data to
build a calibration model; (3) a model based on the shift of the OH
peak in upper and lower phases during the conversion. The two lat-
ter methods were more accurate but required a secondary method
and are possibly sensitive to process changes.51 The authors con-
cluded that LF-NMR can be used for on-line monitoring of chemical
processes.51 In their third article, they further investigated the cata-
lyst, mechanism and kinetics.52
In a biotechnological application, the growth of a yeast and a fun-
gus was followed via on-line LF-NMR (42.5 MHz) measurements of
consumed and produced chemicals.53 The culture broth was pumped
through the magnet [polyurethane tube, 3 mm inner diameter (i.d.),
5 mm outer diameter] and 12 or 32 scans (repetition time of 15 s for
quantitative results) were combined leading to a temporal resolution
of 3 or 8 min, respectively. In case of Hansenula polymorpha, the con-
sumption of glycerol (3.58 ppm, broad singlet) could be monitored by
NMR and there was an excellent correspondence with HPLC data.
The conversion of glucose (3.4–3.9 ppm, multiplet) to itaconic acid
3.25 ppm (singlet) by Ustilago maydis could also be followed by
LF-NMR during 60 h of culturing. Due to interference of a peak at
3.8 ppm, the glucose signal was integrated from 3.32 to 3.71 ppm.
Once again there was excellent correspondence with HPLC data,
including lag phase and total consumption of glucose. The increasing
concentration of intracellular glycolipids (taken as the alkyl signal from
0.6 to 1.75 ppm) showed a correlation with the dry cell weight. Thus
LF-NMR appears capable of following microbial growth with high
temporal resolution, fair chemical resolution and without needing
sample preparation such as removal of cells or extraction.
Gomes et al. electrochemically converted biomass-derived valeric
acid into the more valuable octane inside a 5 mm NMR tube residing
in a 43 MHz NMR.54 The reaction was conducted in methanol with
potassium hydroxide (KOH) as supporting electrolyte. The strong
magnetic field increased the reaction rate through a better mass trans-
fer and reduced the required energy. The reaction could be followed
by monitoring the regions from 0.6 to 0.9 ppm (n-octane) and 1.6 to
2.0 ppm (valeric acid). Calibration curves were linear. The real-time
NMR analysis contributed significantly to understanding and optimi-
sing the reactions.54
Soyler et al. showed that the enzymatic conversion of sucrose
into fructose and glucose can be monitored on-line by 43 MHz NMR.
Several parameters were optimised such as selection of appropriate
signals (H1 of sucrose and α-glucose), water suppression, repetition
F IGURE 7 60 MHz 1H NMRspectrum (64 scans, repetition time 10 s)of a type 2 diabetic urine sample.Reprinted from Percival et al.,49 (openaccess) [Colour figure can be viewed atwileyonlinelibrary.com]
32 VAN BEEK
time (6 s), temperature (29�C), flow rate (0.5 mL/min, i.d. flow cell
4 mm) and integration procedure. The authors concluded that quanti-
tative LF-NMR is an easy and rapid method for the on-line monitoring
of enzymatic reactions.55
3.5 | LF-NMR in teaching
Although NMR can be learned solely by theory, spectra and movies,
gaining hands-on experience with preparing an NMR sample, intro-
ducing it into a spectrometer, recording your own spectrum in real-
time and interpreting it afterwards definitely has added value for stu-
dents. The field strength of the spectrometer is of lesser importance.
Thus, when its 400 MHz research NMR was logistically no longer
available for BSc students, my university acquired a 60 MHz instru-
ment exclusively for teaching. The author of this review was taught
NMR with a book published in 196556 containing only 60 MHz spec-
tra and recorded his first spectrum in 1974 on a 60 MHz machine and
is none the worse for it. With the right choice of compounds, 60 MHz
is as instructive as 400 MHz. The websites of LF-NMR manufacturers
give dozens of examples of applications in education and it can be
concluded that many LF instruments are used for hands-on teaching
of NMR.
Riegel and Leskowitz have nicely summarised the important appli-
cation of LF-NMR in academic teaching.57 There were no phytochem-
ically oriented experiments. Several experiments for teaching NMR to
undergraduates have been published.58-66 One of them deals with
common OTC (over-the-counter) formulations including the natural
products ascorbic acid and caffeine.61 Another experiment is centred
around caffeine.64 At the university of the author, natural products
play a significant role for introducing NMR to students. In the basic
course, all students quantitatively analyse the alcohol content of dif-
ferent liquors according to a quantitative protocol published earlier by
our group.67 Further students check the identity and purity of natural
products such as piperine, anethol and xanthorrhizol isolated by them-
selves through interpretation of the spectra. In another course, also
2D spectra are recorded.
4 | CONCLUSIONS
4.1 | Application area
From the earlier cited articles, it is obvious that there are many oppor-
tunities for modern LF-NMR for the purpose of natural products anal-
ysis. QC uses have until now focussed primarily on TAG profiles of
vegetable oils. TAGs are surely an important group but an additional
reason for their high occurrence may have been that vegetable oils
have functioned as an easily available test substrate to evaluate the
potential of LF-NMR. There only two non-TAG applications, namely
adulteration detection of patchouli essential oil with other oils or syn-
thetic aromas,30 and detection of an undeclared sugar in fine
chemicals.33 The forensic use is more varied. The non-research real-
life application of LF-NMR as a first screening tool of seized drugs
with a large library and automated data treatment is the way to go.41
Food and health applications are varied too, ranging from fraud detec-
tion, metabolite screening of food ingredients,45 lipidomics by means
of 1H- and 31P-NMR,46 and point-of-care metabolomics.49 Potentially
healthcare applications are a huge market for LF-NMR. However, the
demands of high-quality metabolomics (80 MHz, narrow line width,
high sensitivity, autosampler, i.e. heavy and > $100000) and point-of-
care diagnostic use by a general practitioner (hand-held, fast and auto-
mated read-out, i.e. light and < $5000) are unfortunately diametrically
opposed. To bridge this gap is challenging68,69 and in the near future a
shared LF-NMR instrument in a hospital or local healthcare centre is a
more realistic outcome. Even then, to quantify minor metabolites
enrichment and a deuterated solvent may be needed. LF-NMR can be
used to optimise chemical or biotechnological processes. It allows con-
tinuous real-time measurements of reaction kinetics and products and
several examples were given. Finally teaching is an obvious and fre-
quent application area and several articles in the Journal of Chemical
Education describe NMR experiments for undergraduate students.
4.2 | Structure elucidation
The applications confirm that LF-NMR is not that useful for structure
elucidation of unknown compounds other than the simplest ones. At
best one can get an idea about the identity of a major adulterant or
product, which needs to be further proven by HF-NMR, GC-MS or
LC-MS.30,41 LF-NMR can be used to detect known products if one
has previously recorded LF spectra,41 or if one can simulate the LF
spectrum on the basis of chemical shifts and coupling constants
obtained through detailed HF-NMR studies.33,47
4.3 | Sensitivity
In most studies, simply 1D 1H-NMR spectra are recorded and then
sensitivity is not a big issue unless one is dealing with low concentra-
tions. For example, it is less likely that LF-NMR will be applied in the
near future for detecting drugs or minor metabolites in biofluids with-
out enrichment or signal enhancement. The recording of 13C-NMR or
2D spectra is possible on modern LF instruments but can take 24 h or
more. However, COSY spectra can be recorded in less than an hour
for concentrated samples or even in a few minutes on a modified LF
instrument.27 Research is on-going to increase the sensitivity
10000-fold or more through hyperpolarisation. This would accomplish
a 13C spectrum in one scan,70-74 or enable metabolite analysis in
sec.75 SABRE (signal amplification by reversible exchange) is such a
promising technique but it is not universal for all analytes, requires
additional chemicals and logistically it is rather complicated.70-72 This
means LF-NMR would lose one of its strongest points: simplicity.
Interestingly, at the time of submission of this review a PhD project
was being advertised on sensitivity-enhanced benchtop NMR
spectroscopy.76
VAN BEEK 33
4.4 | Resolution
A way to diminish signal overlap is to use 2D diffusion-ordered spec-
troscopy (DOSY) experiments.77,78 Compounds are “separated” in the
second dimension based on their difference in diffusion coefficients.
Although added resolution can be obtained for some mixtures, for
now the approach suffers from several drawbacks such as consider-
ably longer measurement times, non-standard hardware (gradient
coil), higher complexity, incorrect spectra in case of overlapping spec-
tral regions of different compounds, and not being applicable when
compounds have near similar diffusion coefficients. Thus, it does not
appear to be the holy grail for increasing LF-NMR resolution. How-
ever, at higher field strengths (80 MHz) and after further improve-
ments, the methodology is likely to find application for selected
samples. An alternative approach to increase resolution would be to
remove all couplings, like in a projection of a 2D J-resolved spectrum.
Various pulse sequences for this purpose were compared but the
results are disappointing in terms of sensitivity (1% of 1D sensitivity)
and resolution due to the appearance of artefacts.79 Also, apart from
2D J-resolved spectra, all other pulse sequences require hardware
modifications and simplicity is lost, which again is one of advantages
of LF-NMR. Thus, also this approach appears short term doubtful. A
simpler approach is the addition of Lanthanide shift reagents to dis-
perse overlapping signals.80 Two convincing examples after adding
Eu(FOD)3 were shown. Disadvantages are the additional signals of the
shift reagent and the fact that some polar group must be present to
interact with the shift reagent. Febrian et al. obtained increased reso-
lution in 60 MHz spectra of oligopeptides by adding various salts.81
4.5 | As on-line detector
If benchtop NMR could be used as an on-line detector in preparative
chromatography, this would constitute a highly relevant application
for natural product chemists. It has now been shown many times that
LF-NMR is effective in following at-line or – more frequently – on-line
the output of synthetic chemistry (flow reactors) and only few, mostly
recent, articles are cited here.82-89 See the reviews by Giraudeau and
Felpin, and Grootveld et al. for more references.11,90 In some cases,
even the on-line recording of 2D NMR and 13C-NMR spectra proved
possible. However, in synthetic applications concentrations are usu-
ally 100× higher than in chromatography. Four articles describe LF-
NMR as a detector after size exclusion chromatography (SEC)-
NMR.91-94 Höpfner et al. used CHCl3 as solvent in combination with
20 mm i.d. columns. With solvent suppression, analytes could be
observed after data treatment.92 In a follow-up article, they optimised
sensitivity and selectivity.94 Sabatino et al. experienced considerable
band broadening in the NMR detector cell with their 7.5 mm i.d. SEC
columns They concluded that 20 mm i.d. columns are preferred.93 If
LF-NMR is to be used after preparative column chromatography on
silica, solvent problems will worsen as often a gradient is used of
proton-rich solvents like petroleum ether or hexane and ethyl acetate.
A gradient from CHCl3 to acetone or acetonitrile would work better
but CHCl3 is less desirable from an environmental and toxicological
point of view. Preparative RP-HPLC, e.g. with 21 mm i.d. columns and
a gradient from water to acetonitrile constitutes probably a more
workable approach. This would be similar to LC-NMR in the late
1990s but without D2O in the eluent. Solvent suppression in LF-NMR
applications has been investigated by Gouilleux et al.95
4.6 | Prospects
Finally, what will natural products chemists and phytochemists be
using LF-NMR for in the near future? Due to limited sample prepara-
tion requirements, absence of chromatography, universal detection
and the innate quantitative abilities of NMR, there is a bright future
for screening, quality control and adulteration detection of herbal
drugs, plant extracts and pure compounds. Currently, in the field of
plant-based drugs there is only a preliminary communication on using
LF-NMR for QC of Liu Wei Dihuang Wan pills, a TCM (traditional Chi-
nese medicine).96 More applications are bound to follow.
Future publications will mostly originate from academic users but
LF-NMR is of particular interest for SMEs and governmental control
laboratories, which until now could not afford NMR. Potentially this is
a big market. Forensics is another area due to the many natural prod-
ucts (cocaine, morphine, ephedrine, cannabis) or derivatives thereof
(heroin, synthetic cannabinoids) used as illegal drugs. A further use is
in industrial organic synthesis through flow chemistry where the syn-
thesis can be adapted by means of feedback from the NMR detector.
An example is the synthesis of the natural product carpanone.85 In all
such applications chemometric processing of acquired data will prove
essential. It may reveal in an objective manner spectral differences,
which are otherwise difficult to discern. In terms of hardware,
80–100 MHz will remain the maximum but through the development
of more homogeneous magnetic fields, narrower line widths can be
expected, also leading to higher S/N ratios. Finally, it is prudent to
realise the main limitation of LF-NMR, i.e. its limited resolution. For
instance, in the very first LF-NMR article it was tried to detect the
adulteration of olive oil with near-identical hazelnut oil based on TAG
profiles.22 This is almost impossible as the two oils are highly similar.
However, if NMR had not been used as the single analytical technique
but rather in combination with refractive index or GC-FID measure-
ments, the combined analytical information might have been convinc-
ing. In other words, LF-NMR should in some instances not be used as
a stand-alone technique but rather as a complementary technique.
ORCID
Teris André van Beek https://orcid.org/0000-0002-9843-7096
REFERENCES
1. Becker ED. A brief history of nuclear magnetic resonance. Anal Chem.
1993;65(6):295A-302A.
2. Büchi G, Erickson RE, Wakabayashi N. Terpenes. XVI. Constitution of
patchouli alcohol and absolute configuration of cedrene. J Am Chem
Soc. 1961;83(4):927-938.
34 VAN BEEK
3. Büchi G, MacLeod WD Jr, Padilla O. J. Terpenes. XIX. Synthesis of
patchouli alcohol. J Am Chem Soc. 1964;86:4438-4444.
4. Nakanishi K. The ginkgolides. Pure Appl Chem. 1967;14:89-113.
5. Woods MC, Miura I, Nakadaira Y, Terahara A, Maruyama M,
Nakanishi K. The ginkgolides. V. Some aspects of their NMR spectra.
Tetrahedron Lett. 1967;8:321-326.
6. Blümich B. Introduction to compact NMR: A review of methods.
Trends Anal Chem (TRAC). 2016;83:2-11.
7. Blümich B, Singh K. Desktop NMR and its applications from materials
science to organic chemistry. Angew Chem Int Ed. 2018;57(24):6996-
7010.
8. Blümich B. Low-field and benchtop NMR. J Magn Reson. 2019;306:
27-35.
9. Singh K, Blümich B. NMR spectroscopy with compact instruments.
Trends Anal Chem (TRAC). 2016;83:12-26.
10. Rudszuck T, Förster E, Nirschl H, Guthausen G. Low-field NMR for
quality control on oils. Magn Reson Chem. 2019;57:577-593.
11. Grootveld M, Percival B, Gibson M, et al. Progress in low-field bench-
top NMR spectroscopy in chemical and biochemical analysis. Anal
Chim Acta. 2019;1067:11-30.
12. Bruker. The Fourier Benchtop, Bruker, https://www.bruker.com/
fileadmin/user_upload/8-PDF-Docs/MagneticResonance/NMR/
brochures/Fourier_Brochure.pdf, accessed on October 4, 2019.
13. Magritek. Spinsolve 43, http://www.magritek.com/wp-content/
uploads/2018/04/Spinsolve-Brochure-Apr-18.pdf, accessed on
October 11, 2019.
14. Magritek. Spinsolve 60, http://www.magritek.com/wp-content/
uploads/2018/04/Spinsolve-60-Carbon-Brochure-Apr-18.pdf,
accessed on October 11, 2019.
15. Magritek. Spinsolve 80, Personal Communication 2019.
16. Magritek. Spinsolve Ultra, https://go.magritek.com/hubfs/Emails/
Spinsolve_Brochures/Spinsolve%20ULTRA%20Product%20Brochure.
pdf, accessed on October 28, 2019.
17. Nanalysis. NMReady-60PRO, https://static1.squarespace.com/static/
5707ede0d210b8708e037a1e/t/58756ca46b8f5bb4102cb332/
1484090535593/170109-60PRO-Brochure-web.pdf, accessed on
October 10, 2019.
18. Nanalysis. 100PRO, https://static1.squarespace.com/static/
5707ede0d210b8708e037a1e/t/5d8395ed959dbe10bfc1cd47/
1568904688390/NANA_100PRO_Brochure-Q-Web-R1-sm.pdf,
accessed on October 10, 2019.
19. Oxford. X-Pulse, https://nmr.oxinst.com/assets/uploads/MagRes/
Brochures/X-Pulse%20brochure_Web.pdf, accessed on October
10, 2019.
20. ThermoFisher. picoSpin Series II, https://assets.thermofisher.com/
TFS-Assets/CAD/Specification-Sheets/NMR-SII-SpecSheet-416.pdf,
accessed on October 13, 2019.
21. Sobolev AP, Thomas F, Donarski J, et al. Use of NMR applications to
tackle future food fraud issues. Trends Food Sci Technol. 2019;91:
347-353.
22. Parker T, Limer E, Watson AD, Defernez M, Williamson D, Kate KE.
60 MHz 1H NMR spectroscopy for the analysis of edible oils. Trends
Anal Chem (TRAC). 2014;57:147-158.
23. Gerdova A, Defernez M, Jakes W, et al. 60 MHz 1H NMR spectros-
copy of triglyceride mixtures. In: Capozzi F, Laghi L, Belton PS, eds.
Magnetic Resonance in Food Science: Defining Food by Magnetic Reso-
nance. Cambridge: Royal Society of Chemistry; 2015:17-30.
24. Jakes W, Gerdova A, Defernez M, et al. Authentication of beef versus
horse meat using 60 MHz 1H NMR spectroscopy. Food Chem. 2015;
175:1-9.
25. Riegel SD. Determination of olive oil adulteration with 60-MHz
benchtop NMR spectrometry. Am Lab. 2015;47(2):16-19.
26. Gouilleux B, Marchand J, Charriera B, Remaud GS, Giraudeau P. High-
throughput authentication of edible oils with benchtop ultrafast 2D
NMR. Food Chem. 2018;244:153-158.
27. Gouilleux B, Charrier B, Akoka S, Felpin F-X, Rodriguez-Zubiri M,
Giraudeau P. Ultrafast 2D NMR on a benchtop spectrometer: Applica-
tions and perspectives. Trends Anal Chem (TRAC). 2016;83:65-75.
28. Gouilleux B. Gradient-based methods on a benchtop spectrometer.
New perspectives for low-field NMR spectroscopy. PhD Thesis,
Université de Nantes, October 18, 2017.
29. Kim JH, Lee HJ, Kwon K, Chun HS, Ahn S, Kim BH. A 43 MHz low-
field benchtop 1H nuclear magnetic resonance method to discrimi-
nate perilla oil. J Oleo Sci. 2018;67(5):507-513.
30. Krause A, Wu Y, Tian R, van Beek TA. Is low-field NMR a complemen-
tary tool to GC-MS in quality control of essential oils? A case study:
Patchouli essential oil. Planta Med. 2018;84(12-13):953-963.
31. van Beek TA, Joulain D. The essential oil of patchouli, Pogostemon
cablin: A review. Flavour Fragr J. 2018;33(1):6-51.
32. McDowell D, Defernez M, Kemsley EK, Elliott CT, Koidis A. Low vs
high field 1H NMR spectroscopy for the detection of adulteration of
cold pressed rapeseed oil with refined oils. LWT-Food Sci Technol.
2019;111:490-499.
33. Choules MP, Bisson J, Simmler C, et al. NMR reveals an undeclared
constituent in custom synthetic peptides. J Pharm Biomed Anal. 2020;
178–112915:1-6.34. Pàges G, Gerdova A, Williamson D, Gilard V, Martino R, Malet-
Martino M. Evaluation of a benchtop cryogen-free low-field 1H NMR
spectrometer for the analysis of sexual enhancement and weight loss
dietary supplements adulterated with pharmaceutical substances.
Anal Chem. 2014;86(23):11897-11904.
35. Singh K, Blümich B. Desktop NMR for structure elucidation and iden-
tification of strychnine adulteration. Analyst. 2017;142(9):1459-1470.
36. Assemat G, Dubocq F, Balayssac S, Lamoureux C, Malet-Martino M,
Gilard V. Screening of "spice" herbal mixtures: From high-field to low-
field proton NMR. Forensic Sci Int. 2017;279:88-95.
37. Bogun B, Moore S. 1H and 31P benchtop NMR of liquids and solids
used in and/or produced during the manufacture of methamphet-
amine by the HI reduction of pseudoephedrine/ephedrine. Forensic
Sci Int. 2017;278:68-77.
38. Zhong Y, Huang K, Luo Q, et al. The application of a desktop NMR
spectrometer in drug analysis. Int J Anal Chem. 2018;3104569;1-7.
39. Assemat G, Balayssac S, Gerdova A, et al. Benchtop low-field 1H
nuclear magnetic resonance for detecting falsified medicines. Talanta.
2019;196:163-173.
40. Bray EL, Hayden TR. Effects of light on the structure of select organic
compounds commonly found in latent fingerprints. In Proceedings of
American Chemical Society. 2019;CHED-1213. Washington, DC:
American Chemical Society.
41. Antonides LH, Brignall RM, Costello A, et al. Rapid identification of
novel psychoactive and other controlled substances using low-field1H NMR spectroscopy. ACS Omega. 2019;4(4):7103-7112.
42. Keizers PHJ, Bakker F, Ferreira J, et al. Benchtop NMR spectroscopy
in the analysis of substandard and falsified medicines as well as illegal
drugs. J Pharm Biomed Anal. 2020;178–112939:1-10.43. Defernez M, Wren E, Watson AD, et al. Low-field 1H NMR spectros-
copy for distinguishing between arabica and robusta ground roast
coffees. Food Chem. 2017;216:106-113.
44. Gunning Y, Defernez M, Watson AD, et al. 16-O-Methylcafestol is
present in ground roast arabica coffees: Implications for authenticity
testing. Food Chem. 2018;248:52-60.
45. Killeen DP, Watkins OC, Sansom CE, Andersen DH, Gordon KC,
Perry NB. Fast sampling, analyses and chemometrics for plant breed-
ing: bitter acids, xanthohumol and terpenes in lupulin glands of hops
(Humulus lupulus). Phytochem Anal. 2017;28:50-57.
46. Gouilleux B, Vous Christensen N, Malmos KG, Vosegaard T. Analyti-
cal evaluation of low-field 31P NMR spectroscopy for lipid analysis.
Anal Chem. 2019;91(4):3035-3042.
47. Matviychuk Y, Yeo J, Holland DJ. A field-invariant method for quanti-
tative analysis with benchtop NMR. J Magn Reson. 2019;298:35-47.
VAN BEEK 35
48. Duffy J, Urbas A, Niemitz M, Lippa K, Marginean I. Differentiation of
fentanyl analogues by low-field NMR spectroscopy. Anal Chim Acta.
2019;1049:161-169.
49. Percival BC, Grootveld M, Gibson M, et al. Low-field, benchtop NMR
spectroscopy as a potential tool for point-of-care diagnostics of met-
abolic conditions: Validation, protocols and computational models.
High Throughput. 2018;8(2):1-33.
50. Garro Linck Y, Killner MHM, Danieli E, Blümich B. Mobile low-field1H NMR spectroscopy desktop analysis of biodiesel production. Appl
Magn Reson. 2013;44:41-53.
51. Killner MHM, Garro Linck Y, Danieli E, Rohwedder JJR, Blümich B.
Compact NMR spectroscopy for real-time monitoring of a biodiesel
production. Fuel. 2015;139:240-247.
52. Singh K, Kumar SP, Blümich B. Monitoring the mechanism and kinet-
ics of a transesterification reaction for the biodiesel production with
low field 1H NMR spectroscopy. Fuel. 2019;243:192-201.
53. Kreyenschulte D, Paciok E, Regestein L, Blümich B, Büchs J. Online
monitoring of fermentation processes via non-invasive low-field
NMR. Biotechnol Bioeng. 2015;112(9):1810-1821.
54. Gomes BF, Holzhäuser FJ, Lobo CMS, et al. Sustainable electro-
coupling of the biogenic valeric acid under in situ low-field nuclear
magnetic resonance conditions. ACS Sustainable Chem Eng. 2019;7
(22):18288-18296.
55. Soyler A, Bouillaud D, Farjon J, Giraudeau P, Oztop MH. Real-time
benchtop NMR spectroscopy for the online monitoring of sucrose
hydrolysis. LWT - Food Sci Technol. 2020;118–108832:1-7.56. Dyer JR. Applications of Absorption Spectroscopy of Organic Com-
pounds. Englewood Cliffs, NJ: Prentice-Hall; 1965.
57. Riegel SD, Leskowitz GM. Benchtop NMR spectrometers in academic
teaching. Trends Anal Chem (TRAC). 2016;83:27-38.
58. Isaac-Lam MF. Analysis of bromination of ethylbenzene using a
45 MHz NMR spectrometer: An undergraduate organic chemistry
laboratory experiment. J Chem Educ. 2014;91(8):1264-1266.
59. Bonjour JL, Pitzer JM, Frost JA. Introducing high school students to
NMR spectroscopy through percent composition determination using
low-field spectrometers. J Chem Educ. 2015;92(3):529-533.
60. Isaac-Lam MF. Determination of alcohol content in alcoholic bever-
ages using 45 MHz benchtop NMR spectrometer. Int J Spectrosc.
2016;2526946;1-8.
61. Zivkovic A, Bandolik JJ, Skerhut AJ, et al. Quantitative analysis of
multicomponent mixtures of over-the-counter pain killer drugs by
low-field NMR spectroscopy. J Chem Educ. 2017;94(1):121-125.
62. Edgar M, Percival BC, Gibson M, et al. Benchtop NMR spectroscopy
and spectral analysis of the cis- and trans-stilbene products of the
Wittig reaction. J Chem Educ. 2019;96(9):1938-1947.
63. Araneda J, Riegel S, ChuT. Beginners guide to qNMR: introduction of
qNMR to undergraduates. In Proceedings of American Chemical
Society. 2019;CHED-0082:Washington, DC: American Chemical
Society.
64. Kent JE, Bell NGA. Molecular properties of caffeine explored by
NMR: A benchtop NMR experiment for undergraduate physical-
chemistry laboratories. J Chem Educ. 2019;96(4):786-791.
65. Yearty KL, Glessner CE, Morrison RW. Developing and implementing
multioutcome experiments in undergraduate teaching laboratories to
promote student ownership of the experience: An example multi-
outcome experiment for the oxidation of alcohols. J Chem Educ.
2019;96(10):2194-2201.
66. Singh AJ, AlmasZayya, Manz B, Spencer JL, Northcote PT, Dykstra R,
Coy A. Applications of a Benchtop NMR Spectrometer in an Under-
graduate Chemistry Laboratory, http://www.asahilab.co.jp/dl/ma/
p03.pdf, accessed on December 8, 2019.
67. van Beek TA, van Veldhuizen A, Lelyveld GP, Piron I, Lankhorst PP.
Quantitation of bilobalide and ginkgolides A, B, C and J by means of
nuclear magnetic resonance spectroscopy. Phytochem Anal. 1993;4
(6):261-268.
68. Korvink JG, MacKinnon N, Badilita V, Jouda M. “Small is beautiful” inNMR. J Magn Reson. 2019;306:112-117.
69. Dupre A, Lei K-M, Mak P-I, Martins RP, Peng WK. Micro- and
nanofabrication NMR technologies for point-of-care medical applica-
tions – a review. Microelectron Eng. 2019;209:66-74.
70. Richardson PM, Parrott AJ, Semenova O, Nordon A, Duckett SB,
Halse ME. SABRE hyperpolarization enables high-sensitivity 1H and13C benchtop NMR spectroscopy. Analyst. 2018;143(14):3442-3450.
71. Robinson AD, Richardson PM, Halse ME. Hyperpolarised 1H–13Cbenchtop NMR spectroscopy. Appl Sci. 2019;9(1173):1-14.
72. Semenova O, Richardson PM, Parrott AJ, Nordon A, Halse ME,
Duckett SB. Reaction monitoring using SABRE-hyperpolarized bench-
top (1 T) NMR spectroscopy. Anal Chem. 2019;91(10):6695-6701.
73. Gołowicz D, Kazimierczuk K, Urba�nczyk M, Ratajczyk T. Monitoring
hydrogenation reactions using benchtop 2D NMR with extraordinary
sensitivity and spectral resolution. ChemistryOpen. 2019;8(2):
196-200.
74. Kim KH, Choic JW, Kima CS, Jeong K. Parahydrogen-induced polari-
zation in the hydrogenation of lignin-derived phenols using
Wilkinson's catalyst. Fuel. 2019;255-115845:1-5.
75. Korchak S, Emondts M, Mamone S, Blümich B, Glöggler S. Production
of highly concentrated and hyperpolarized metabolites within sec-
onds in high and low magnetic fields. Phys Chem Chem Phys. 2019;21
(41):22849-22856.
76. University of York. Sensitivity-enhanced benchtop NMR spectros-
copy, https://www.findaphd.com/phds/project/sensitivity-enhanced-
benchtop-nmr-spectroscopy/?p105619, accessed on October
25, 2019.
77. Assemat G, Gouilleux B, Bouillaud D, et al. Diffusion-ordered spec-
troscopy on a benchtop spectrometer for drug analysis. J Pharm
Biomed Anal. 2018;160:268-275.
78. McCarney ER, Dykstra R, Galvosas P. Evaluation of benchtop NMR
diffusion ordered spectroscopy for small molecule mixture analysis.
Magn Reson Imaging. 2019;56:103-109.
79. Castaing-Cordier T, Bouillaud D, Bowyer P, Goncalves O,
Giraudeau P, Farjon J. Highly resolved pure-shift spectra on compact
NMR spectrometer. ChemPhysChem. 2019;20(5):736-744.
80. Singh K, Blümich B. Compact NMR spectroscopy with shift reagents.
Appl Magn Reson. 2016;47(10):1135-1146.
81. Febrian R, Ona WJ, Araneda JF, Riegel SD, Bracher PJ. Benchtop
NMR spectroscopy of prebiotically-relevant peptide reactions
enabled by salt-induced chemical shift dispersion. ACS Earth Space
Chem. 2020; ahead of print. https://doi.org/10.1021/
acsearthspacechem.9b00221
82. Sans V, Porwol L, Dragone V, Cronin L. A self optimizing synthetic
organic reactor system using real-time in-line NMR spectroscopy.
Chem Sci. 2015;6(2):1258-1264.
83. Elipe MVS, Milburn RR. Monitoring chemical reactions by low-field
benchtop NMR at 45MHz: pros and cons. Magn Reson Chem. 2016;
54(6):437-443.
84. Granda JM, Donina L, Dragone V, Long D-L, Cronin L. Controlling an
organic synthesis robot with machine learning to search for new reac-
tivity. Nature. 2018;559(7714):377-381.
85. Cortés-Borda D, Wimmer E, Gouilleux B, et al. An autonomous self-
optimizing flow reactor for the synthesis of natural product
carpanone. J Org Chem. 2018;83(23):14286-14299.
86. Kern S, Wander L, Meyer K, et al. Flexible automation with compact
NMR spectroscopy for continuous production of pharmaceuticals.
Anal Bioanal Chem. 2019;411(14):3037-3046.
87. Friebel A, Ev H, Münnemann K, Hasse H. Reaction monitoring by
benchtop NMR spectroscopy using a novel stationary flow reactor
setup. Ind Eng Chem Res. 2019;58(39):18125-18133.
88. Knox ST, Parkinson S, Stone R, Warren NJ. Benchtop flow-NMR for
rapid online monitoring of RAFT and free radical polymerisation in
batch and continuous reactors. Polym Chem. 2019;10(35):4774-4778.
36 VAN BEEK
89. Rubens M, Van Herck J, Junkers T. Automated polymer synthesis
platform for integrated conversion targeting based on inline benchtop
NMR. ACS Macro Lett. 2019;8(11):1437-1441.
90. Giraudeau P, Felpin F-X. Flow reactors integrated with in-line moni-
toring using benchtop NMR spectroscopy. React Chem Eng. 2018;3
(4):399-413.
91. Räntzsch V, Wilhelma M, Guthausen G. Hyphenated low-field NMR
techniques: Combining NMR with NIR, GPC/SEC and rheometry.
Magn Reson Chem. 2016;54(6):494-501.
92. Höpfner J, Ratzsch K-F, Botha C, Wilhelm. Medium resolution1H-NMR at 62 MHz as a new chemically sensitive online detector for
size-exclusion chromatography (SEC–NMR). Macromol Rapid
Commun. 2018;39–1700766:1-7.93. Sabatino P, van Engelen M, Eghbali H, et al. Advances in hyphenating
size-exclusion chromatography with nuclear magnetic resonance
spectroscopy for polymer analysis. LC•GC Europe. 2019;32(April):
182-189.
94. Botha C, Höpfner J, Mayerhöfer B, Wilhelm M. On-line SEC-MR-
NMR hyphenation: optimization of sensitivity and selectivity on a
62 MHz benchtop NMR spectrometer. Polym Chem. 2019;10(18):
2230-2246.
95. Gouilleux B, Charrier B, Akokaa S, Giraudeau P. Gradient-based sol-
vent suppression methods on a benchtop spectrometer. Magn Reson
Chem. 2017;55(2):91-98.
96. van Beek TA, Yang H, Chen B. Keynote Lecture at the 9th Annual
Meeting of the Specialty Committee of TCM Pharmaceutical
Analysis & International Conference onTCM Pharmaceutical Analysis,
Nanchang, China, 13–15 June 2018.
SUPPORTING INFORMATION
Additional supporting information may be found online in the
Supporting Information section at the end of this article.
How to cite this article: van Beek TA. Low-field benchtop
NMR spectroscopy: status and prospects in natural product
analysis. Phytochemical Analysis. 2021;32:24–37. https://doi.
org/10.1002/pca.2921
VAN BEEK 37
Recommended