Page | 1
FOUNDATION IN NATURAL AND BUILT
ENVIRONMENT
MATHEMATICS (MTH10304)
STATISTIC SURVEY PROJECT
GROUP MEMBERS:
CHAN PEI SHAN (0318350)
YEO DOR EEN (0316224)
TAN ZHAO MING (0318724)
HOOI ZHAO HONG (0318564)

Page | 2
TABLE OF CONTENTS
INTRODUCTION PAGE 3
OBJECTIVES PAGE 4
METHODOLOGY PAGE 5-6
SURVEY QUESTIONNAIRES PAGE 7-9
STATISTICS ANALYSIS PAGE 10-20
CONCLUSION PAGE 21-22

Page | 3
INTRODUCTION
Our survey focused on a very common chronic disease, which is called
Diabetes mellitus, commonly known as diabetes. Diabetes is known to develop due
to a high level of blood glucose and some other commonly known symptoms such
as excessive thirst and production of large amount of urine.
Even though diabetes is a very common disease, not much people know
about some facts about it. Through this survey, we had prepared some questions
relating to some facts of diabetes, such as the types of diabetes, transmission of
diabetes and the death rate of the disease all over the world. We also included
some not commonly known facts about diabetes like the sugar level of severe
diabetes patients and the fact that which gender is more likely to be diagnose with
diabetes.
What we want to learn through this survey is the knowledge the people of a
certain gender and age towards diabetes, and then analyze the ratio of the answer
from our respondents so that we can learn how much the society understands about
the lifestyles of diabetes patients. Also, we wanted to compare the results from our
respondents to know their thoughts on what they think the patients live like, and
their understanding towards the disease.

Page | 4
OBJECTIVES
We had chosen to focus on male respondents for our survey question. So our
objectives of the survey is firstly, to test the knowledge of male young adults about
diabetes, because people often misunderstood the symptoms of diabetic patients.
Secondly is to analyze the difference of how people view diabetic symptoms, as
some people look at diabetes as a very severe chronic disease while others think of
less severe. Thirdly is to get an accurate result from different people as we have a
minimum of 200 targets and so that we could create a fair statistic to compare the
results. And lastly is to complete everything and then come to a conclusion of the
aim of our survey.

Page | 5
METHODOLOGY
Since we were targeting 200 male young adults for the survey, each of us
were responsible to survey 50 male respondents each, and for a fair result each of
us surveyed 25 males of aged 21 to 25 and the rest aged 25 to 30. Because the age
ranged from 21 to 30, we went to two places for the survey, which was in Taylor’s
Lakeside Campus itself and in Sunway Pyramid mall. We spent 3 days of
surveying from 6th of November to 8th of November, and then gathered the
information together to do the statistics analysis.
Zhao Hong (Ben) surveying a male
respondent age 21 to 25. This was in
Block D Level 4, in front of the
classrooms.
Zhao Ming surveying a male
respondent aged ranged 26 to 30. We
met him at Block D Level 4 as well.

Page | 6
After gathering all the completed survey forms, each of us analyze our own
50 forms and then gathered all the information together to make our statistics
analysis for this report. We first discuss with each other about the calculations
needed and diagrams to portray the information, and we transfer the information
onto the report.
Pei Shan analysing the reponse from the forms.
Doreen typing out part of the report.

Page | 7
SURVEY QUESTIONNAIRE
1. Which age group does you belongs to?
21-25 26-30
Symptoms of diabetes
2. What gender is more likely to be diagnosed with diabetes?
Male Female
3. Ratio of diabetic patients in Malaysia?
1 out of 10
2-3 out of 10
4-5 out of 10
5-7 out of 10
8 out of 10
4. How many types of diabetes are there?
2
3
4
5
5. Which year has the highest rate of diabetes patients?
2000-2002
2002-2004
2004-2006
2006-2008
2008-2010
2010-2012
6. What stage is more likely to be diagnose with diabetes?
Infants and children
Teenagers
Young adults
Grown adults
Senior citizens
7. How diabetes is most likely transmitted?
Lack of exercise
Saliva transmission
Genetics
High sugar level diet
Sexual transmission
Unhygienic lifestyle
8. What is the sugar level of severe diabetic patients?
4-5 mmol/L
5-6 mmol/L
6-8 mmol/L
9-10 mmol/L

Page | 8
9. What are the symptoms of diabetes?
Frequent Urination
Swelling on legs
Loss of appetite
Weight gain
Often feeling fatigue
Lack of concentration
Often numbness
Blurred vision
10. How does diabetes affect one’s daily lifestyle the most?
Troublesome to family
Financial problems due to medication fees
Feeling depression towards life
The need to watch what you put into your mouth
Controlling lifestyle (nonetheless exercise or diet)
11. Death rate of diabetes?
10%-20%
20%-30%
30%-50%
50%-70%
70%-90%
Prevention and curing of diabetes
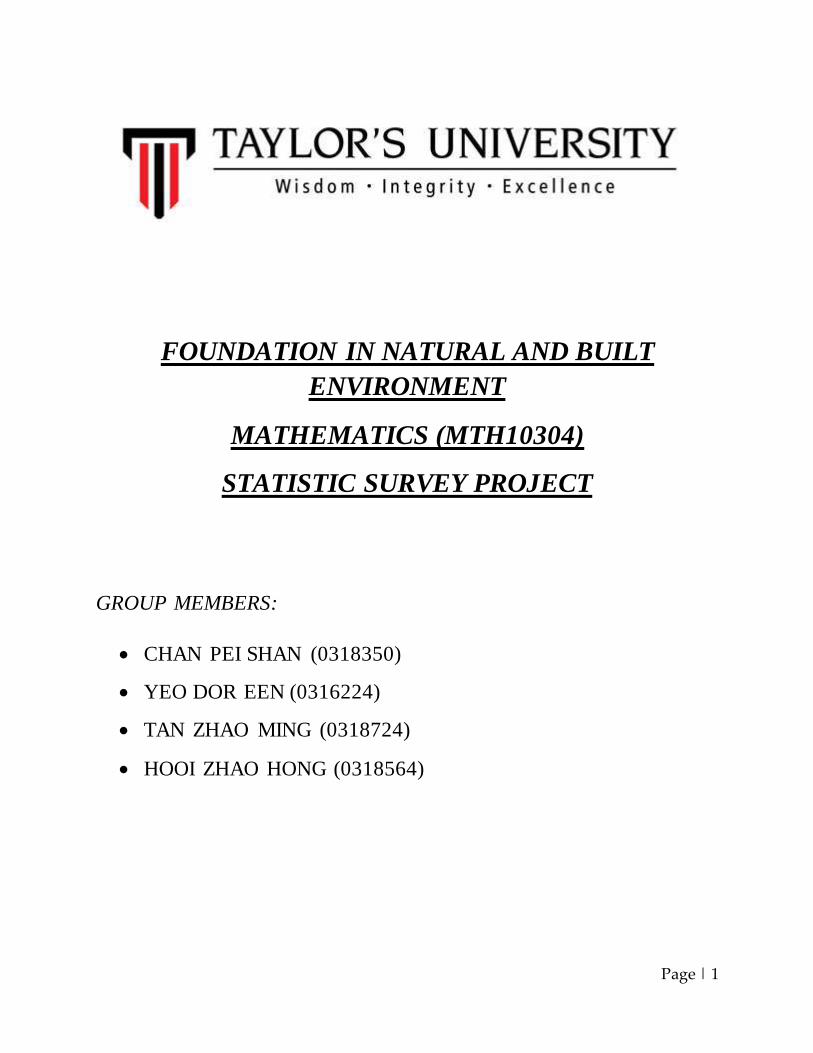
12. Prevention rate of diabetes?
10%-20%
20%-30%
30%-50%
50%-70%
70%-90%
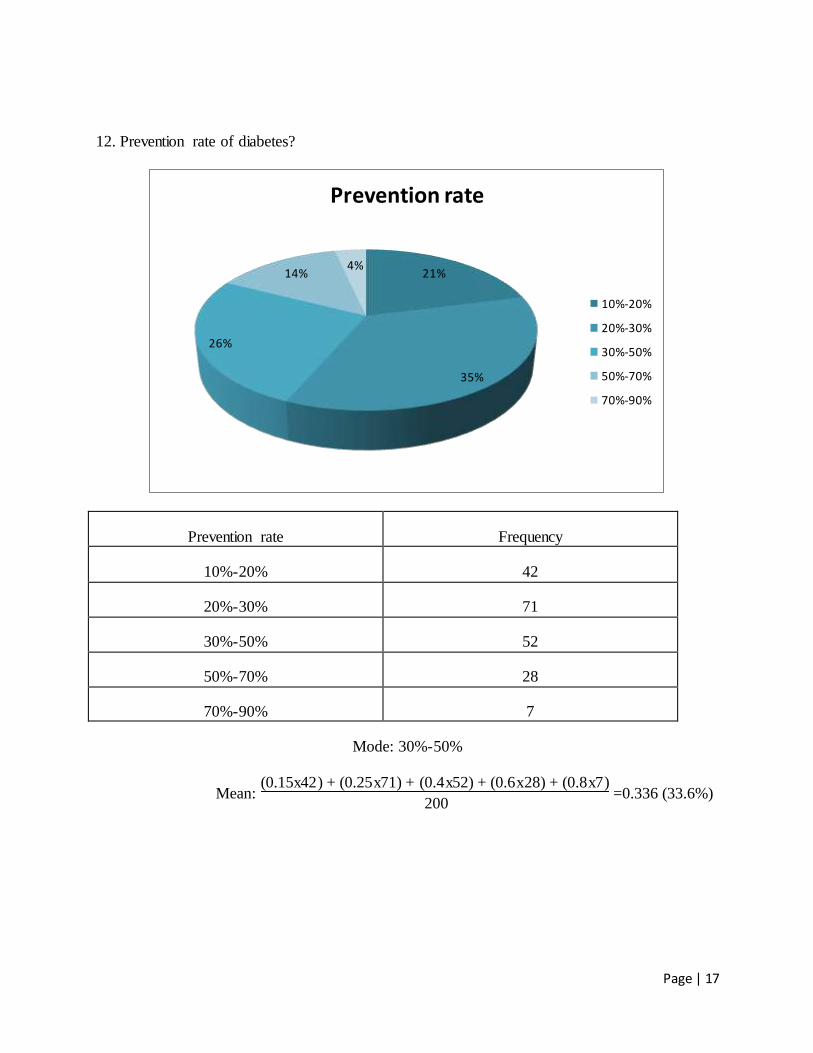
13. Most efficient way to prevent diabetes?
Exercise frequently
Watching blood pressure carefully
Avoid smoking
Avoid alcohol
Watching your diet
14. Curing fees of diabetes every 6 months (medication, operation, checkups)?
RM100-RM200
RM200-RM300
RM300-RM450
RM450-RM600
RM600-RM750

Page | 9
15. Lastly, success rate of curing diabetes?
10%-20%
20%-30%
30%-40%
40%-60%
60%-80%

Page | 10
STATISTICS ANALYSIS
1. Which age group does you belongs to?
Age 21-25 26-30
Frequency 100 100
2. What gender is more likely to be diagnosed with diabetes?
Gender Male Female
Frequency 103 97
Mode: Male
50%50%
Age Group
21-25
26-30
51%49%
Gender
Male
Female

Page | 11
3. Ratio of diabetic patients in Malaysia?
Ratio 1 out of 10 2-3 out of 10 4-5 out of 10 5-7 out of 10 8 out of 10
Frequency 30 78 60 27 5
Mode: 2-3 out of 10
Mean: (1x30) + (2.5x78) + (4.5x60) + (6x27) + (8x5)
200 =3.49
4. How many types of diabetes are there?
No. of types 2 3 4 5
Frequency 47 96 49 8
Mode: 3 types
15%
39%30%
13%
3%
Ratio
1 out of 10
2-3 out of 10
4-5 out of 10
5-7 out of 10
8 out of 10
23%
48%
25%
4%
No. of types
2 types
3 types
4 types
5 types

Page | 12
5. Which year has the highest rate of diabetes patients?
Year 2000-2002 2002-2004 2004-2006 2006-2008 2008-2010 2010-2012
Frequency 9 20 32 11 58 70
Mode: 2010-2012
6. What stage is more likely to be diagnose with diabetes?
Stage Infants and children
Teenagers Young adults
Grown adults
Senior citizens
Frequency 0 13 13 64 110
Mode: Senior citizens
4% 10%
16%
6%
29%
35%
Rate of year
2000-2002
2002-2004
2004-2006
2006-2008
2008-2010
2010-2012
0%
6% 7%
32%55%
Stage
Infants and children
Teenagers
Young adults
Grown adults
Senior citizens

Page | 13
7. How diabetes is mostly transmitted?
Reason of
diabetes
Lack of
exercise
Saliva
transmission
Genetics High sugar
level diet
Sexual
transmission
Unhygienic
lifestyle
Frequency 18 2 57 102 8 3
Mode: High sugar level diet
8. What is the sugar level of severe diabetic patients?
Sugar level 4-5 mmol/L 5-6 mmol/L 6-8 mmol/L 9-10 mmol/L
Frequency 5 44 87 64
Mode: 6-8 mmol/L
9%
1%
28%
51%
4%
7%
Reason of diabetes
Lack of exercise
Saliva transmission
Genetics
High sugar level diet
Sexual transmission
Unhygienic lifestyle
2%
22%
44%
32%
Sugar level
4-5 mmol/L
5-6 mmol/L
6-8 mmol/L
9-10 mmol/L

Page | 14
9. What are the symptoms of diabetes? (Can choose more than one)
Symptoms Frequency
Frequent urination 35
Swelling on legs 53
Loss of appetite 50
Weight gain 61
Often feeling fatigue 41
Lack of concentration 35
Often numbness 12
Blurred vision 28
Mode: Weight gain
11%
17%
16%
19%
13%
11%
4%9%
Symptoms
Frequent urination
Swelling on legs
Loss of appetite
Weight gain
Often feeling fatigue
Lack of concentration
Often numbness
Blurred vision

Page | 15
10. How does diabetes affect one’s daily lifestyle the most?
Consequences Frequency
Troublesome to family 50
Financial problem due to medication fees 51
Feeling depression towards life 42
The need to watch what you put into your mouth 33
Controlling lifestyle (nonetheless exercise or diet) 24
Mode: Financial problem due to medication fees
25%
25%21%
17%
12%
Consequences
Troublesome to family
Financial problem due to medication fees
Feeling depression towards life
The need to watch what you put into your mouth
Controlling lifestyle (nonetheless exercise or diet)

Page | 16
11. Death rate of diabetes?
Death rate Frequency
10%-20% 17
20%-30% 38
30%-50% 84
50%-70% 46
70%-90% 15
Mode: 30%-50%
Mean: (0.15x17) + (0.25x38) + (0.4x84) + (0.6x46) + (0.8x15)
200 =0.426 (42.6%)
8%
19%
42%
23%
8%
Death rate
10%-20%
20%-30%
30%-50%
50%-70%
70%-90%
Page | 17
12. Prevention rate of diabetes?
Prevention rate Frequency
10%-20% 42
20%-30% 71
30%-50% 52
50%-70% 28
70%-90% 7
Mode: 30%-50%
Mean: (0.15x42) + (0.25x71) + (0.4x52) + (0.6x28) + (0.8x7)
200 =0.336 (33.6%)
21%
35%
26%
14%4%
Prevention rate
10%-20%
20%-30%
30%-50%
50%-70%
70%-90%
Page | 18
13. Most efficient way to prevent diabetes?
Prevention way Frequency
Exercise frequently 52
Watching blood pressure carefully 47
Avoid smoking 21
Avoid alcohol 17
Watching your diet 63
Mode: Watching your diet
26%
23%10%
9%
32%
Prevention way
Exercise frequently
Watching blood pressure
carefully
Avoid smoking
Avoid alcohol
Watching your diet

Page | 19
14. Curing fees of diabetes every 6 months (medication, operation, checkups)?
Curing fees Frequency
RM100-RM200 13
RM200-RM300 26
RM300-RM450 72
RM450-RM600 53
RM600-RM750 36
Mode: RM300-RM450
Mean: (150x13) + (250x26) + (375x72) + (525x53) + (675x36)
200 = RM437.86
6%13%
36%
27%
18%
Curing fees
RM100-RM200
RM200-RM300
RM300-RM450
RM450-RM600
RM600-RM750

Page | 20
15. Lastly, success rate of curing diabetes?
Success rate Frequency
10%-20% 38
20%-30% 60
30%-40% 62
40%-60% 31
60%-80% 9
Mode: 30%-40%
Mean: (0.15x38) + (0.25x60) + (0.35x62) + (0.5x31) + (0.7x9)
200 = 0.321 (32.1%)
19%
30%31%
15%5%
Success rate
10%-20%
20%-30%
30%-40%
40%-60%
60%-80%

Page | 21
CONCLUSION
In conclusion, we had come up with the statistics analysis of the ratio and
mode. We came up with common and uncommon questions and all the questions,
where some were to test the respondents’ understanding towards diabetes, while
some were about estimating, mostly the numerical questions.
There were some questions which were difficult to estimate. More people
assumed that male were more likely to be diagnose with diabetes, which had a
frequency of 103, whilst for female there is a close frequency of 97. The mode of
the ratio of diabetic patients in Malaysia is 2 to 3 out of 10 Malaysians. As the
world is more developed and advance, the respondents had assumed that the recent
years of 2010 to 2012 has the highest rate of diabetic patients. More people think
that financial is a more severe problem when it comes to a diabetic patient’s
lifestyle, as they have to visit the doctor more often than normal people. And that
lead to questions about the medication fees of the patients every 6 months, and that
more people had chosen the answer of RM300 to RM450, which was a more
neutral answer of the 5 answers we provided. And for the mode of the 3
percentages questions, were the death rate of 30% to 50%, prevention rate of 30%
to 50%, and curing rate of 30% to 40%. All the 3 questions had a mode towards
neutral.
While for the questions that tests the understanding level of the respondents,
firstly is to test them the types of diabetics there is, and the mode is 3 different
types. Next is the stage of a human who were more likely to be diagnose with
diabetes, and senior citizens got the highest frequency of 110. The mode for
transmission of diabetes is high sugar level diet of 102, and secondly comes
genetics, of 57. The sugar level of severe diabetic patients were mostly 6 to 8

Page | 22
mmol/L chosen by the respondents, where mmol/L means millimoles per litre.
More respondents think that watching one’s diet is more likely to prevent diagnosis
of diabetes. The last question is a question where the respondents can choose more
than one answer, which is about the symptoms of diabetes. Most of the answers’
frequency were equally distributed, but the mode of weight gain with a frequency
of 61, then comes swelling on arms and legs of 53, and in third place is loss of
appetite of 50.
After an analysis of this survey, it shows that the understanding level of
diabetes of male aged 21 to 30 in total, is fairly high, but there were some
respondents who does not really understand the disease. But overall, the responses
were mostly accurate about diabetes and fair enough for us to make a comparison.
Recommended


![[JOHOR 2013] Additional Mathematics Project Work - HOUSEHOLD EXPENDITURE SURVEY](https://img.pdfslide.net/doc/110x75/55cfe3a55503467d968b565e/johor-2013-additional-mathematics-project-work-household-expenditure-survey.jpg)