INTERIM RESULTS 2020
MAY 2020

Forward-looking statements
Certain statements in this document do not comprise reported financial results or historical information, but forward-
looking statements. These statements are predictions of or indicate future events, trends, future prospects, objectives,
earnings, savings or plan and include, but are not limited to, statements regarding volume growth, increases in market
share, exchange rate fluctuations, shareholder return and cost reductions. Forward-looking statements are sometimes,
but not always, identified by their use of a date in the future or such words as “believe”, “continue”, “anticipate”, “ongoing”,
“expect”, “will”, “could”, “may”, “intend”, “plan”, “could”, “may”, and “endeavour”.
By their nature, forward-looking statements are inherently predictive, speculative and involve inherent risks and
uncertainties, because they relate to events and depend on circumstances that may or may not occur in the future. If one
or more of these risks materialise, or should underlying assumptions prove incorrect, our actual results may differ
materially from those anticipated.
There are a number of factors that could cause actual results and developments to differ materially from those expressed
or implied by these forward-looking statements. These factors include, but are not limited to: changes in economic or
political conditions and changes to the associated legal, regulatory and tax environments; lower than expected
performance of existing or new products and the impact thereof on the Group’s future revenue, cost structure and capital
expenditure; the Group’s ability to expand its portfolio; skills shortage; changes in foreign exchange rates and a lack of
market liquidity which holds up the repatriation of earnings; increased competition, slower than expected customer
growth and reduced customer retention; acquisitions and divestments of Group businesses and assets and the pursuit of
new, unexpected strategic opportunities; the extent of any future write-downs or impairment charges on the Group’s
assets; the impact of legal or other proceedings against the Group; uncontrollable increases to legacy defined benefit
liabilities and higher than expected costs or capital expenditures.
When relying on forward-looking statements to make investment decisions, you should carefully consider both these
factors and other uncertainties and events. Forward-looking statements apply only as of the date on which they are
made, and we do not undertake any obligation to update or revise any of them, whether as a result of new information,
future events or otherwise.

H1 2020
OVERVIEW
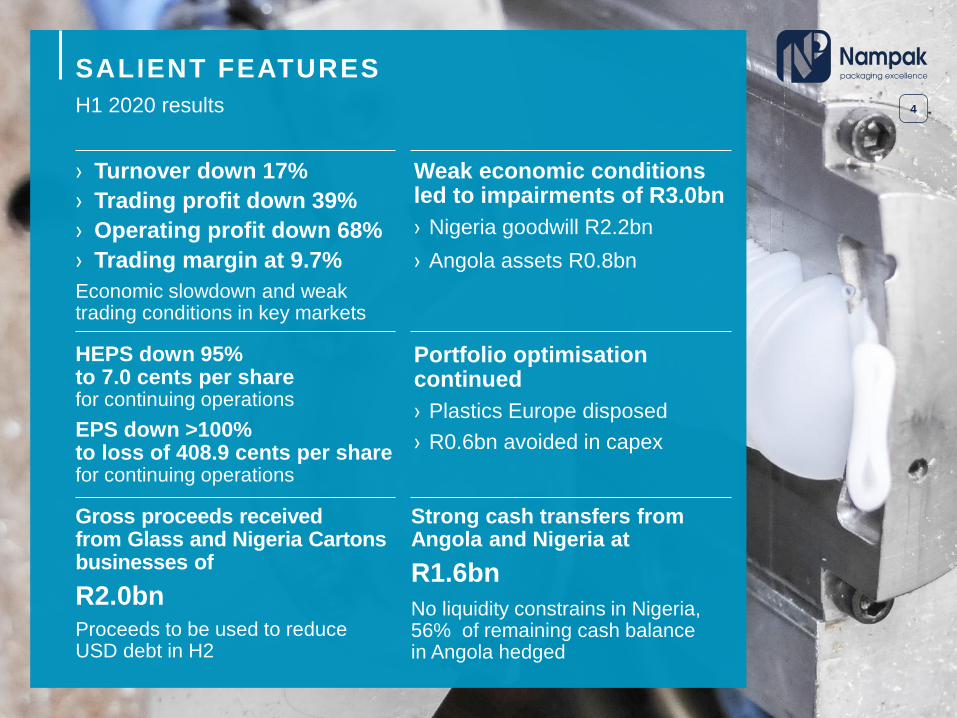
› Turnover down 17%
› Trading profit down 39%
› Operating profit down 68%
› Trading margin at 9.7%
Economic slowdown and weak trading conditions in key markets
SALIENT FEATURES
4H1 2020 results
HEPS down 95% to 7.0 cents per sharefor continuing operations
EPS down >100%to loss of 408.9 cents per share for continuing operations
Gross proceeds receivedfrom Glass and Nigeria Cartons businesses of
R2.0bnProceeds to be used to reduceUSD debt in H2
Weak economic conditions led to impairments of R3.0bn
› Nigeria goodwill R2.2bn
› Angola assets R0.8bn
Portfolio optimisation continued
› Plastics Europe disposed
› R0.6bn avoided in capex
Strong cash transfers from Angola and Nigeria at
R1.6bn
No liquidity constrains in Nigeria, 56% of remaining cash balancein Angola hedged

5
R1.9bn proceeds available to settle USD-denominated debt
EXECUTING ON PORTFOLIO OPTIMISATION
C O M P L E T E D
› Sale of Glass – R1.4bn net of contractual true-ups
» Gross proceeds of R1.6bn receivedin March 2020
» Competition authorities approvals receivedin February 2020
› Nigeria Cartons – R0.4bn (€28m)
» Competition authorities received inJanuary 2020
› Plastics Europe
» Nominal value but positive impact on Group long term liabilities
» Disposed of with R538m (GBP25m) pension fund liability
» Avoided ~R600m in replacement capital expenditure
› Sold intermediate bulk containers – R27m
I N P R O G R E S S
› Restructuring of DivFood and Plastics
» 17% headcount reduction at Vanderbiljpark
» Exiting unprofitable SKUs
» Consolidating sites
› Improving competitiveness
» Labour savings
» Aligning employment cost structures tomarket rates
› Simplifying portfolio
» Review of business units and SKUs
» Exiting complex products
» Shift patterns and overall productivity levels
› Site consolidation
› Further portfolio optimisation

6
R3.0BN IMPAIRMENTS DRIVENBY WEAK MARKET CONDITIONS
Low oil price coupled with COVID-19 accelerated write-downs
NIGERIA
› Goodwill impaired by R2.2bn
› Deteriorating market conditions
» Pricing pressure
» Slower future growth
» Overcapacity in market, 3 lines including 1 idle line
› Assessed impact of COVID-19, accelerated impairments
› Low oil price coupled with COVID-19
» Limit beverage can market growth
» Reduced foreign currency availability
» Significant slowdown of economic growth
› Liquidity shortage expected
» Only produce to extent operations are ableto source forex, no funding from Group
› Increased country risk = higher WACC
› Operational assets in tact – 1bn cansper annum capability
» Increased capacity = no capex required in short/medium term
ANGOLA
› Asset impaired by R0.8bn
› >200% devaluation of Angolan kwanza vs US dollar since 1 January 2018
» Lead to extremely high inflation
» Lagging wages and labour rates
» Reduced consumer buying power
» Temporary move away from cans to glass and plastic packaging (backwardly integrated customers)
› Low oil price coupled with COVID-19
» Further depress market growth
» Reduced foreign currency availability
» Contraction of economy
› Weak prospects for next 12-24 months further worsened by impact of COVID-19
› Increased country risk = higher WACC
› L1 conversion halted due to COVID-19
› Headcount reduced to <50% of original employees to limit impact on profitability
› Adequate raw materials until end of September

7Contraction of key markets expected for 2020
LOWER DISPOSABLE INCOME POST COVID -19 = SLOWER ECONOMIC RECOVERY
8
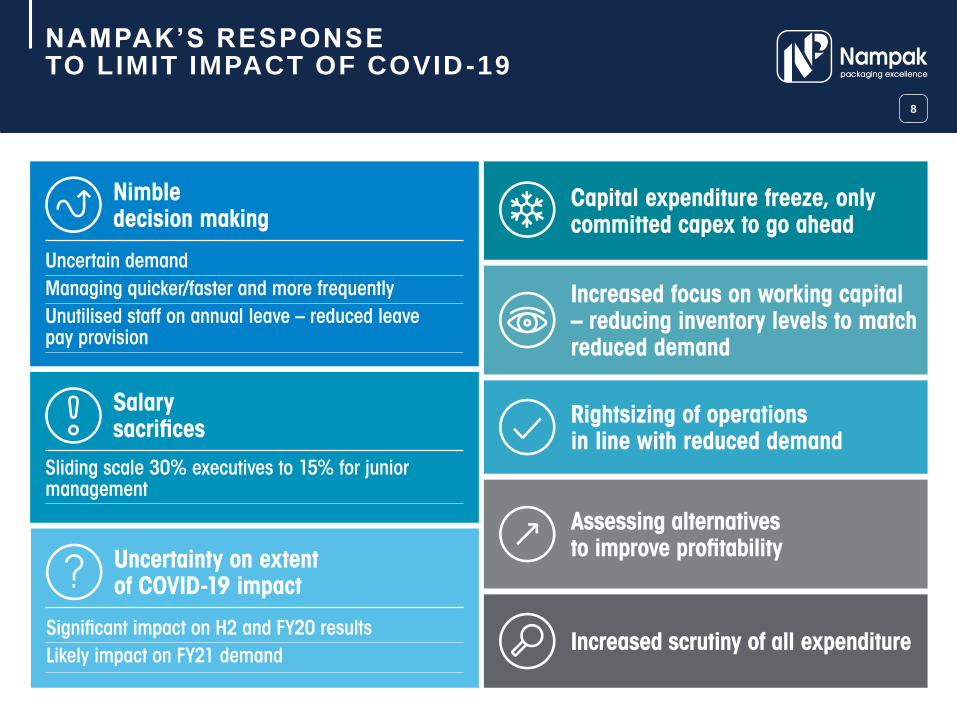
NAMPAK’S RESPONSE TO LIMIT IMPACT OF COVID-19
OPERATIONAL
REVIEW

10
BEVCAN NIGERIA CONTINUED TO GROW, WEAK TRADING CONDITIONS ELSEWHERE
Impairments recognised in Angola and Nigeria
SOUTH AFRICA
› Bevcan SA
› Lower results» Beverage market decline due to weak economy
– Subdued consumer spending
» Volumes negatively impacted
» Lower end sales to Angola
» Slow ramp-up of second competitor
» Maintained substantial market share
› DivFood
› Made significant loss » Lost key contract end of H1 2019
» Food cans subdued – lower volumes for fish, meat and fruit cans
» Diversified can demand improved for tinplate aerosols and shoe polish
REST OF AFRICA
› Bevcan Angola
› Kwanza devaluation significantly impacted demand» Consumer purchasing power impacted by lagging
wage inflation
» R0.8bn (US$51.4 million) impairment of assets
» Actively managing current situation
» ~49% headcount reduction
» Economic recovery timing uncertain due to oil/COVID-19
› Liquidity sustained for the period» R842m transferred from Angola
» Kwanza bond programme has provided R1.9bn shield against devaluation of Kwanza over last two years
› Completion of L1 conversion delayed by COVID-19
› Bevcan Nigeria
› Continued volume growth – malt and beer categories» Stable market share
» Operational improvements increased total utilisation capability to ~1 billion cans per annum
» Best safety record for the Group
› Good liquidity, R794m transferred
› R2.2bn goodwill impairment » Low oil price impacts Angolan and Nigerian economies,
higher WACC and revised forecasts
› General metals packaging » Weak demand in Nigeria and Kenya
METALS
R million H1 2020 H1 2019 % ∆
Revenue 4 553 5 698 (20)
Trading profit 429 737 (42)
Margin (%) 9.4 12.9

SOUTH AFRICA
› Resilient performance
» Revenue marginally down limited by fire at key customer‘s premises
» Improved profitability, turnaround yielding results
» Demand for closures improved
» Higher allocations for crates business
» Strong March sales for certain products due to COVID-19
» Weaker demand for conical cartons
› Focus on improving profitability continues
» Managing costs
» Working capital improvements
11
PLASTICS SA RETURNED TO PROFITABILITY
Weak economic conditions in Zimbabwe limited demand
REST OF AFRICA
› Challenging economic conditions in Zimbabwe adversely impacted results
» Lower demand due to hyperinflation
» Limited supply of raw materials
» Operations are self-funding
– No cash injections from Group since April 2018
– Customers and exports enable raw material purchases
PLASTICS
R million H1 2020 H1 2019 % ∆
Revenue 1 438 1 570 (8)
Trading profit 157 174 (10)
Margin (%) 10.9 11.1

› Zimbabwe Hunyani
› Good performance
» Healthy demand for tobacco cases
» Less impacted by disposable income shifts
» Revenue and margin growth
» Good cost control
› Export volumes
» Hub for tobacco cases
› Liquidity remains challenging
» Production dependent on ability to source raw materials
› Cash generative
» No additional funding extended to operations
» Self funding since April 2018
12
PAPER MARGINS IMPROVED
Cartons disposal impacts results, focused approach on cost management yielding benefits
› Nigeria Cartons
› Divested business for €28m (R444m)
» Disposed on effective 31 December 2019
» Classified as continuing operation in both periods, but as an asset held for sale at 30 September 2019
» Current period only includes 3 months vs 6 months trading in prior period
» Proceeds received in January 2020
» Protected shareholder value
› Zambia and Malawi
› Improved profitability for restructured operations
» Zambia now hub for conical cartons
» Malawi packing for local market
– Lower overheads
› Zambia strategy yielding results
» Limited volume growth due to tough economic environment
PAPER
R million H1 2020 H1 2019 % ∆
Revenue 528 614 (14)
Trading profit 133 94 41
Margin (%) 25.2 15.3

FINANCIAL
REVIEW

Group revenue down 17%
R6.5bnimpacted by weak trading conditions in key markets
RESULTS SUMMARY
14Continuing operations
R1.6bn cashtransferred from Angola andNigeria pleasing with good liquidity and transfer rate of 130% from these countries
Trading profit down 39% to
R633mdue to a loss in DivFood, poor demand in Angola, weak tradingconditions in South Africa and Zimbabwe, partially offset bygood trading in Bevcan Nigeria
Operating profit down 68% to
R287madversely impacted by foreign exchange devaluations, restructuring costs and a net capital loss
Cash generated from total operations
R667mup 277% from R177m
Gross proceeds of R2.0bn received from disposals
R1.6bnnet of contractual true-ups and selling costs to be used to reduce USD debt

RESULTS SUMMARY
15Continuing and discontinued operations
Loss per share from continuing
operations of 408.9 cents
compared to earnings per share
of 137.4 cents in prior period
impacted by challenging trading
conditions, impairments, loss on
disposals and forex devaluationsHEPS from continuing
operations down 95% to
7.0 cents from 130.0 cents
Asset impairments of
R3.0bn› Nigeria goodwill R2.2bn
› Angola assets R0.8bn
HEPS from total operations
down 100% to 0.3 cents from
115.7 cents
Loss per share from total
operations of 336.0 cents
compared to earnings per
share of 107.8 cents in prior period
assisted by net profit on disposal
from discontinued operations
Profit for the period for
discontinued operations
of R470m primarily from NPE
disposal partially offset by loss
on disposal of Glass division

16
RESULTS IMPACTED BY IMPAIRMENTS AND CURRENCY DEVALUATIONS
Continuing operations
› Revenue down as a result of weaker trading conditions in South Africa, Angola and Zimbabwe, partially offset by Bevcan Nigeria’s pleasing result.
› Trading profit down as Divfood made a significant trading loss, materially reduced volumes in Angola due to kwanza devaluation and lagging wage inflation, decline in South African beverage can market and lower demand in plastic businessesin Zimbabwe.
› Forex losses of R170m in Angola increased >100% as Kwanza devalued 46% and lower hedging due to cash backed LC requirement. Forex losses of R49m as Nigerian Naira began devaluing in March 2020.
› Capital items include a net loss of R148m on disposal on Cartons Nigeria partially offset by insurance proceeds of R83m.
› 2019 restated for IAS 21:15 application for RBZ agreement in Zimbabwe. Hyperinflationary economy led to monetary gain.
› Operating profit lower due to significantly lower Angolan profitability, Divfood losses and higherforex losses
› Net finance costs up 12%. Excluding interest expense of R69m on adoption of IFRS 16 and RBZ interest received, comparable net interest down 21%.
› Goodwill impairment of R2.2bn recognised in Nigeria and R0.8bn in Angolan assets due toweak economic conditions, increased WACCand lower expected future profitability.
› Capital items excluded from HEPS of 7.0 cents
STATEMENT OF COMPREHENSIVE INCOME
R million H1 2020
Restated
H1 2019 % ∆
Revenue 6 519 7 882 (17)
Trading profit 633 1 032 (39)
Net devaluation losses in Angola and Nigeria (219) (21)
Capital items (46) 65
Net impact of devaluation in Zimbabwe (29) (123)
Restructuring and other costs (52) (59)
Operating profit 287 894 (68)
Net finance costs (169) (151) (12)
Share of net profit from associates & joint
ventures(1) (1) 0
Profit before net impairments 117 742 (>100)
Net impairment (losses)/reversals (3 040) 43 (>100)
(Loss)/profit before tax (2 923) 785 (>100)
Tax benefit 65 59 (>100)
(Loss)/profit for the year (2 858) 844 (>100)
EPS (cents) (408.9) 137.4 (>100)
HEPS (cents) 7.0 130.0 (95)

SEGMENTAL REVENUE H1 2020
17
METALSREVENUE
R4 553m-20%
TRADING PROFIT
R429m-42%
PLASTICSREVENUE
R1 438m-8%
TRADING PROFIT
R157m-10%
PAPERREVENUE
R528m-14%
TRADING PROFIT
R133m+41%
Continuing operations
18
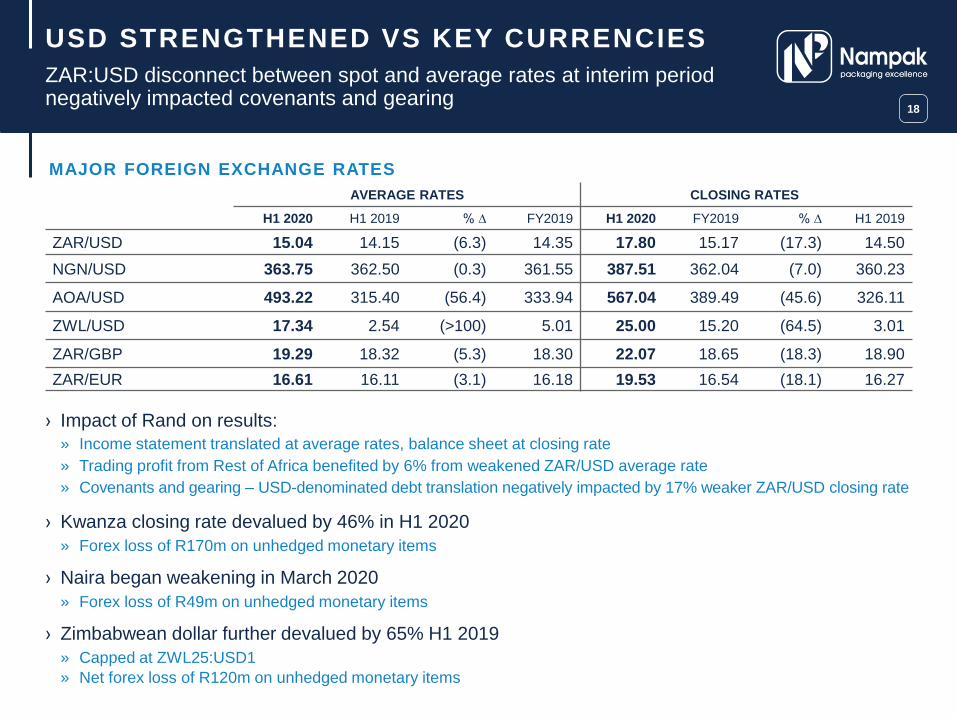
ZAR:USD disconnect between spot and average rates at interim period negatively impacted covenants and gearing
USD STRENGTHENED VS KEY CURRENCIES
› Impact of Rand on results:
» Income statement translated at average rates, balance sheet at closing rate
» Trading profit from Rest of Africa benefited by 6% from weakened ZAR/USD average rate
» Covenants and gearing – USD-denominated debt translation negatively impacted by 17% weaker ZAR/USD closing rate
› Kwanza closing rate devalued by 46% in H1 2020
» Forex loss of R170m on unhedged monetary items
› Naira began weakening in March 2020
» Forex loss of R49m on unhedged monetary items
› Zimbabwean dollar further devalued by 65% H1 2019
» Capped at ZWL25:USD1
» Net forex loss of R120m on unhedged monetary items
MAJOR FOREIGN EXCHANGE RATES
AVERAGE RATES CLOSING RATES
H1 2020 H1 2019 % ∆ FY2019 H1 2020 FY2019 % ∆ H1 2019
ZAR/USD 15.04 14.15 (6.3) 14.35 17.80 15.17 (17.3) 14.50
NGN/USD 363.75 362.50 (0.3) 361.55 387.51 362.04 (7.0) 360.23
AOA/USD 493.22 315.40 (56.4) 333.94 567.04 389.49 (45.6) 326.11
ZWL/USD 17.34 2.54 (>100) 5.01 25.00 15.20 (64.5) 3.01
ZAR/GBP 19.29 18.32 (5.3) 18.30 22.07 18.65 (18.3) 18.90
ZAR/EUR 16.61 16.11 (3.1) 16.18 19.53 16.54 (18.1) 16.27

19
Continuing operations
TAX RECONCILIATION
RECONCILIATION OF STATUTORY TO EFFECTIVE TAX RATE
% H1 2020
Restated
H1 2019 FY2019
Statutory tax rate 28.0 28.0 28.0
Foreign tax rate differential (21.1) (15.5) (13.9)
Withholding and other foreign taxes paid 8.7 6.1 6.2
Disallowed expenses and other 5.2 1.0 (6.8)
Effective tax rate before Angola
and Zimbabwe impacts 20.8 19.6 13.5
Tax effects of the following:
Impairment of Bevcan Nigeria goodwill (12.3) – –
Impairment of assets – Angola (3.4) – –
Reversal of deferred tax asset and
deferred tax not recognised in Angola (2.4) (33.4) 33.3
Loss on disposal of Cartons Nigeria (1.5) – –
Adjusted tax rate before Zimbabwe 1.2 (13.8) 46.8
Tax effect of Zimbabwe conversion
to RTGS – 6.3 –
Tax effect of Zimbabwe hyperinflation,
exchange losses and loan receivable 1.0 - 6 441.7
Effective group tax rate 2.2 (7.5) 6 488.5
Tax effect of impairment of goodwill pertaining to Bevcan Nigeria reducedthe effective tax rate
Tax impact of impairment on assets on loss before tax and deferred tax liability in Angola
Tax impact of exchange rate devaluation in Angola on the tax base of non-monetary assets and deferred tax assets not raised due to uncertainty of future taxable profit streams and law changes in Angola
Tax effects of Zimbabwe becoming a hyperinflationary economy in FY2019
Effective tax rate at half year materially impacted by impairments, Angola trading conditions and tax law change
Effect of operations in multiple jurisdictions with different tax rates impacted by normalised profit before tax
Withholding tax in foreign jurisdictions primarily applicable to interest and technical fees
Disallowed expenses relates to interestin UK and disallowed expenses inAfrican operations
Tax rate before Angola and Zimbabwe tax impacts well managed at 20.8%

20
GROSS PROCEEDS OF R2.0BN RECEIVED FROM SALE OF GLASS AND CARTONS
Discontinued operations
› Classified as asset held for sale in March 2018. Delayed disposal due to size of deal, complexities and competition authorities approval being required
› Transaction effective 31 March 2020 with gross proceeds of R1.57bn received on 30 March 2020
» To be adjusted by difference between planned and actual net working capital value at effective date and F1 rebuild
» Expect net R1.41bn proceeds after contractual true-ups adjustments and selling costs
› Overall volumes limited by challenging production
› Depreciation at Group level ceased from 1 April 2018 in accordance with IFRS 5 as carrying value of asset would primarily be recovered from disposal
› Classified as asset held for sale in September 2019
› Disposal completed in December 2019
» Challenging UK dairy market impacted by vertical integration
» Sold for nominal amount in line with exit strategy
» Net liabilities of R302m disposed of inclusive of R538m (GBP25m) defined benefit fund liability
» Disposal costs of R128m includes 1 year contribution to pension fund, contractual true up costs and advisory fees
» Credit foreign currency translation reserve of R378m recycled on disposal
» Further operating losses avoided
» Capex of R600m avoided
GLASS BUSINESS
R million H1 2020 H1 2019 % ∆
Revenue 791 764 4
Trading profit 88 89 (1)
Margin (%) 11.1 11.6
Net loss from operations (19) (105) 82
Net loss on disposal (25) – (100)
Net loss (incl. disposal
impact) (44) (105) 58
PLASTICS EUROPE
R million H1 2020 H1 2019 % ∆
Revenue 131 571 (77)
Trading (loss)/profit (18) (73) 75
Margin (%) (13.7) (12.8)
Net loss from operations (37) (85) 56
Net profit on disposal 552 – 100
Net profit (incl. disposal
impact)515 (85) >100

› PPE
» Capex of R407m well controlled. Weaker ZAR:USD exchange rate increased value of US dollar functional operations’ PPE, offset by Angolan R0.8bn (US$51.4m) asset impairment. Movement includes R1.4bn for IFRS16 right of use assets capitalised.
› Goodwill
» R2.2bn (US$130.4m) Bevcan Nigeria goodwill impaired. Goodwill impacted by weaker ZAR:USD rate
› Assets held for sale and discontinued operation
» NPE disposed of effective 13 December 2019
» Glass division disposal effective 31 March 2020
» Remaining R38m relates to DivFood Botswana
› Liquid bonds
» Significant proceeds received since March 2019
» Proceeds from bonds received in full on maturity
› Bank balances
» Includes gross proceeds from Glass and Cartons Nigeria disposals
› Equity
» Adversely impacted by impairments, devaluationof Zimbabwean dollar and forex losses partially offsetby net profit on disposals
› Non-current liabilities
» Increase vs 30 September 2019 due to capitalisation of IFRS 16 finance leases
› Current liabilities
» USPP US$115m to be settled using long term facility E
» Will further strengthen short term liquidity ratios
21
R3.0bn impairments
STRONG SHORT TERM LIQUIDITY RATIOS
ABRIDGED STATEMENT OF FINANCIAL POSITION
R million H1 2020
Restated
H1 2019 % ∆ FY 2019
Property, plant, equipment
and investment property 8 427 7 738 9 7 195
Goodwill and other intangibles 2 215 3 755 (41) 3 904
Liquid bonds and other loan
receivables 192 1 572 (88) 862
Other non-current assets 131 677 (80) 451
Non-current assets 10 965 13 742 (20) 12 412
Liquid bonds and loans 270 12 >100 40
Bank balances 3 494 1 966 78 1 463
Other current assets 6 236 6 263 (1) 6 151
Current assets 10 000 8 241 21 7 654
Assets held for sale 38 2 686 (99) 2 394
Total assets 21 003 24 669 (15) 22 460
Total equity 5 875 10 738 (45) 8 210
Non-current liabilities 9 168 9 593 (4) 7 603
Current liabilities 5 960 3 746 59 5 620
Liabilities for assets
held for sale - 592 100 1 027
Total equity and liabilities 21 003 24 669 (15) 22 460

CASH BALANCES INCLUDING LIQUID BONDS
31 MARCH 2020
ANGOLA NIGERIA SUB-TOTAL ZIMBABWE TOTAL
Opening cash on hand – 30 Sep 2019 R1 041m R217m R1 258m R57m R1 315m
Cash on hand R477m R379m R856m R68m R924m
Hedged cash R266m – R266m – R266m
% cash hedged 56% – 31% – 29%
Cash transferred R842m R794m R1 636m – R1 636m
Cash transfer rate 81% 366% 130% – 124%
31 MARCH 2019
ANGOLA NIGERIA SUB-TOTAL ZIMBABWE TOTAL
Opening cash on hand – 30 Sep 2018 R2 307m R300m R2 607m R1 190m R3 797m
Cash on hand R1 474m R215m R1 689m R466m R2 155m
Hedged cash R717m – R717m – R717m
% cash hedged 49% – 42% – 33%
Cash transferred R1 105m R663m R1 768m R27m R1 795m
Cash transfer rate 48% 221% 68% 2% 47%
22Sustained cash transfers in key markets
R1.6 BILLION TRANSFERRED FROM NIGERIA AND ANGOLA

STATEMENT OF CASH FLOWS
R million H1 2020 H1 2019 % ∆
Cash generated from operations
before working capital changes 743 1 101 (33)
Net working capital changes (76) (924) 92
Cash generated from operations 667 177 >100
Net interest paid (212) (229) 7
Income tax paid (86) (69) (25)
Net cash generated from/(utilised in)
operating activities 369 (121) >100
Cash generated from investing activities 1 763 1 248 41
Capital expenditure (407) (360) (13)
Decrease in liquid bonds 518 1 461 (65)
Net proceeds on the disposal of businesses 1 599 - 100
Other investing activities 53 147 (64)
Net cash generated
before financing activities 2 132 1 127 89
Cash repaid in financing activities (449) (235) (91)
Net increase in cash and
cash equivalents 1 683 892 89
23
CASH GENERATED FROM OPERATIONS UP 277% TO R667M
Net proceeds of R1.6bn on disposals boost net cash position
› Cash generated from operations before working capital impacted by weak economic conditions in key markets
› Working capital improved as inventory levels reduced in line with lower demand, includes disposal cost accruals
› Cash generated from operations improved >100% due to better management of working capital
› Lower interest payments due to lower interest rates and working capital management
› Capital expenditure well managedand impacted by lumpy capex onAngola L1 conversion
› Maturing USD-linked Kwanza bonds augmented cash generated frominvesting activities
› R1.6bn net proceeds from disposals primarily relate to Cartons Nigeria and Glass net true-up of working capital and capex adjustments as well as costs to sell
› Increase in net cash of R1.7bn
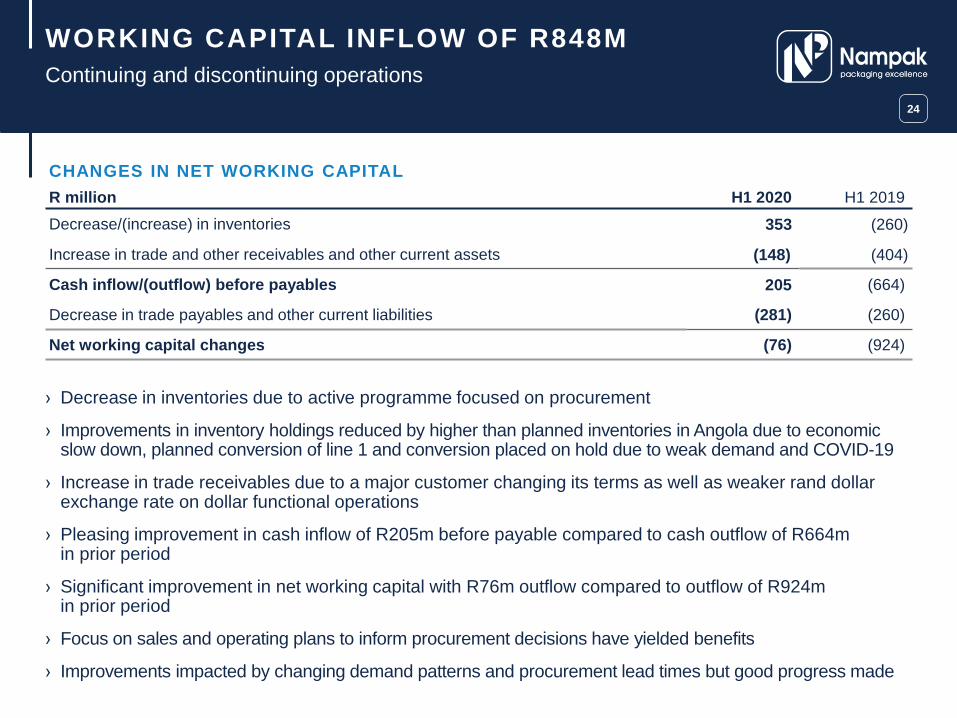
CHANGES IN NET WORKING CAPITAL
R million H1 2020 H1 2019
Decrease/(increase) in inventories 353 (260)
Increase in trade and other receivables and other current assets (148) (404)
Cash inflow/(outflow) before payables 205 (664)
Decrease in trade payables and other current liabilities (281) (260)
Net working capital changes (76) (924)
24
Continuing and discontinuing operations
WORKING CAPITAL INFLOW OF R848M
› Decrease in inventories due to active programme focused on procurement
› Improvements in inventory holdings reduced by higher than planned inventories in Angola due to economic slow down, planned conversion of line 1 and conversion placed on hold due to weak demand and COVID-19
› Increase in trade receivables due to a major customer changing its terms as well as weaker rand dollar exchange rate on dollar functional operations
› Pleasing improvement in cash inflow of R205m before payable compared to cash outflow of R664min prior period
› Significant improvement in net working capital with R76m outflow compared to outflow of R924min prior period
› Focus on sales and operating plans to inform procurement decisions have yielded benefits
› Improvements impacted by changing demand patterns and procurement lead times but good progress made

25
COVENANTS IMPACTEDBY FOREX FLUCTUATIONS
Repayment of USD-denominated debt will reduce covenant volatility
› Covenant relaxed to 3.5 times from 3.0 times for March 2020 measurement period
› Net debt: EBITDA covenant adversely impacted by:» 17% weaker ZAR/USD spot rate vs year end spot rate for
USD-denominated debt
» Dislocation in spot R/$ rate to R17.80 at 31 March 2020 compared to average R/$ rate of R15.04 impacted covenant
» Net debt:EBITDA = 2.8x using average rate, within covenant
» Lower rolling 12 month EBITDA to 31 March 2020 comparedto 2019
» Relaxed covenant alleviated impact of ZAR/USD weakness
» Proceeds from Cartons Nigeria and Glass disposals to beused to partially settle US denominated debt
› Covenant relaxed to 3.25 times from 4.0 times for March 2020 measurement period
› Ratio has declined due to lower EBITDA
› Net interest paid to benefit from proceeds on disposals and lower interest rates in second half
2.3
1.9
2.3 2.3
2.9
3.3
2015 2016 2017 2018 2019 H1 2020
NET DEBT:EBITDA (TIMES)
COVENANT LESS THAN 3.5 TIMES
3x9.7
5.4
7.2 8.0
4.5 4.1
2015 2016 2017 2018 2019 H1 2020
EBITDA:INTEREST COVER (TIMES)
COVENANT GREATER THAN 3.25 TIMES
4x
3.25x
3.5x
2.8x

› Total equity of R5.9 billion down 45% compared to comparative period and down 28% sinceSep 2019 primarily due to R3.0bn impairments
› Current and acid test ratios impacted by USD115m USPP debt due in May 2020classified as short-term
» Settled on 28 May 2020 through use of USD-denominated long term facility E (US$100m) with the balance of US$15m funded from portion of the proceeds on disposal of Cartons Nigeria
26
GEARING AND COVENANTS IMPACTEDBY IMPAIRMENTS, IFRS 16 LEASESAND CURRENCY DEVALUATIONS
H1 2020 H1 2019 FY 2019
Net gearing (%)
– total net borrowings 109 41 68
– excl. capitalised finance
leases82 41 68
Net debt: EBITDA (times) 3.3 2.7 2.9
EBITDA: Net interest (times) 4.1 7.0 4.5
Current ratio
– incl. current portion of liquid
bonds 1.7 2.5 1.5
– incl. total liquid bonds 1.7 2.7 1.6
Acid test ratio
– incl. current portion of liquid
bonds 1.1 1.8 1.0
– incl. total liquid bonds 1.1 1.9 1.1

› IFRS 16: Leases and impairments adversely impacted gearing
» Reduced net equity value
› For covenant purposes, capitalised lease liability is excluded from net interest-bearing debt
27
GEARING IMPACTED BY IMPAIRMENTS, IFRS 16 LEASES AND CURRENCY DEVALUATIONS
6 582
4 625 4 352
3 930
5 728
4 833
6 387
72%
49%45%
37%
68%
109%
0%
20%
40%
60%
80%
100%
120%
-
1 000
2 000
3 000
4 000
5 000
6 000
7 000
2015 2016 2017 2018 2019 H1 2020
NET BORROWINGS (R MILLION) AND GEARING RATIO (%)
Net borrowings Capitalised lease liability impact Gearing
82%
28
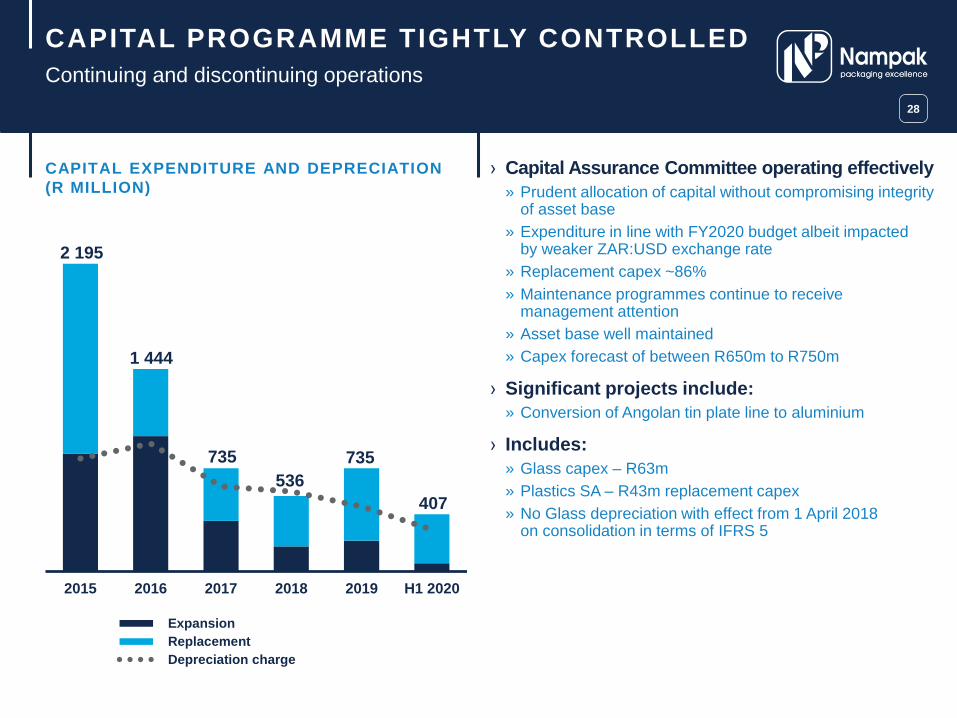
CAPITAL PROGRAMME TIGHTLY CONTROLLED
Continuing and discontinuing operations
2 195
1 444
735
536
735
407
2015 2016 2017 2018 2019 H1 2020
Expansion
Replacement
Depreciation charge
CAPITAL EXPENDITURE AND DEPRECIATION
(R MILLION)
› Capital Assurance Committee operating effectively
» Prudent allocation of capital without compromising integrity of asset base
» Expenditure in line with FY2020 budget albeit impactedby weaker ZAR:USD exchange rate
» Replacement capex ~86%
» Maintenance programmes continue to receive management attention
» Asset base well maintained
» Capex forecast of between R650m to R750m
› Significant projects include:
» Conversion of Angolan tin plate line to aluminium
› Includes:
» Glass capex – R63m
» Plastics SA – R43m replacement capex
» No Glass depreciation with effect from 1 April 2018on consolidation in terms of IFRS 5
› Impact of COVID-19 on Group interim results was not material as lockdown occurredon 27 March 2020 in South Africa
› Nigeria and Angola adversely impacted by:
» Global oil price decline
» Pricing and volume pressure from customers
» Further exchange rate and liquidity volatility
» Uncertainty of timing and recovery of markets
» Resulting in impairment of Nigerian goodwill and asset impairment in Angola
› Impact of COVID-19 on Group’s solvency and liquidity position assessed through scenario planning reviews
› Group has significant banking facilities with adequate headroom albeit use of headroom limited by declining EBITDA and weak Rand at 31 March 2020
› Short term liquidity position boosted by proceeds from disposals
› Active management of funding covenants with banking partners and USPP noteholders
› Assessment of capital structure, management of working capital, restrictions on further capital expenditure and cost management are key priorities
› Level 3 lock down allows sale of alcohol, which is expected to improve volumes
› Strengthening trend of Rand may offer relief on translation of US denominated debt
29
EVENTS AFTER REPORTING DATE
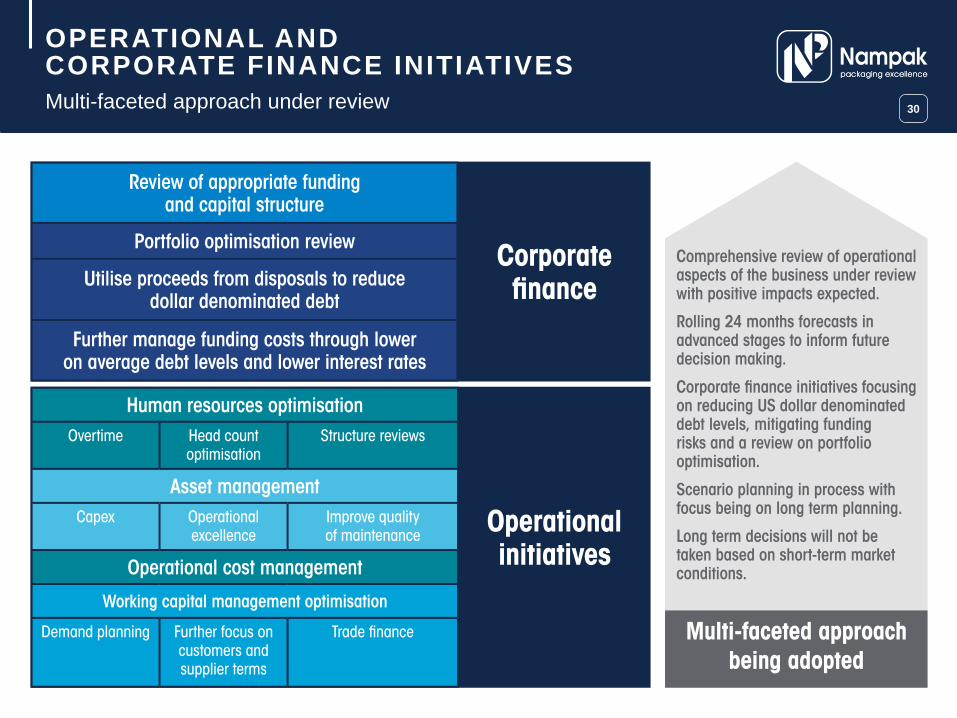
30Multi-faceted approach under review
OPERATIONAL AND CORPORATE FINANCE INITIATIVES

STRATEGIC
OUTLOOK

PREVIOUS STRATEGY
Alignment required to changing market conditions32
Unlock further value from base business:
» Defend market share
» Offer value to customers
– High quality products
– Innovation
– Competitive pricing
» Competitive cost structure
» Efficient operations
Accelerate Africa growth:
» Built strong market positions in major economies
» Good operational performance
» Self sustaining
» Demographical potential remains intact
» Ready to benefit from future growth
» No medium-term need for further investment

33
Lowering business risk and building trust
REVISED STRATEGIC OBJECTIVES

34
Lowering business risk and building trust
REVISED STRATEGIC OBJECTIVES

THANK YOU

APPENDICES
PAN-AFRICAN PACKAGING LEADER
Strong positions – biggest beverage can producer in Africa
› Well established footprint in Metals, Paper and Plastics
» 20 manufacturing locations in South Africa
» Operate in 11 African countries
» 16 manufacturing locations across Rest of Africa
› Market leader in beverage cans in South Africa (#1)
» Estimated market position at 70 to 80%
» Strong operational excellence drive
› Multi-line capability, experience, flexibility for customers and established relationships
› Strong history and proven resilience in challenging market conditions
» Proactive measures implemented to deal with COVID-19
› Extensive asset base offers upside for future growth
37

38
CRITICAL JUDGEMENTS, KEY SOURCES OF ESTIMATION UNCERTAINTY, PRIOR PERIOD RESTATEMENTS AND ZIMBABWE HYPERINFLATION
› Critical judgements and estimation uncertainty
» Impairment of assets
– Bevcan Nigeria goodwill impairment
– Bevcan Angola asset impairment
– Market capitalisation below shareholders equity (Valuations of CGU’s reviewed)
» Zimbabwe revocation agreement
» Deferred tax assets
› Restatement of comparatives
» Discontinued operation
– Nampak Plastics Europe – IFRS 5
– Disposal effective 13 December 2019
› Prior period error
» 2019 interim results prepared on the basis that the requirements of IAS 21: Effects of Changes in Foreign Exchange Rates paragraph 15 had been met
» Accounted for inter-company balances between NZL and NIL as part of the group’s net investment in the foreign operation
» During September 2019 audit was determined thatthe requirements had not been met as a plan for repayment existed through the RBZ agreement
» Full effects accounted for at 2019 year-end
» Accounting at 31 March 2019 now aligned to 2019 year-end accounting with restatement of prior periodto address this interpretation error
› Effects on the prior period are as follows:
» Reduction in EPS and HEPS of 3 cents
» Increase in NAV of 49 cents
› Zimbabwe accounting
» Under IAS 29 hyperinflation accounting results inthe translation of the full Zimbabwe Group income statement on a hyperinflationary basis as well asall non-monetary items in the balance sheet
» In addition, under hyperinflation, income statement translation is at spot rather than average
» Conservative expected credit loss provision of 85%has been maintained on RBZ financial instrument given the financial and economic conditions facing Zimbabwe at present.
» Net impact in period of devaluation in forex inZimbabwe amounts to R29 million

39
METALS REMAINS LARGEST CONTRIBUTOR
METALS
72
PLASTICS
20
PAPER
8
H1 2019
METALS
70
PLASTICS
22
PAPER
8
H1 2020
CONTINUING OPERATIONS – REVENUE
(%)
SEGMENTAL PERFORMANCE BY SUBSTRATE – REVENUE
R million H1 2020 H1 2019 % ∆
Metal 4 553 5 698 (20)
Plastics 1 438 1 570 (8)
Paper 528 614 (14)
Continuing operations 6 519 7 882 (17)
Glass 791 764 3
Plastics Europe 131 572 (78)
Discontinued operations 922 1 336 (31)
Total 7 441 9 218 (19)

40
METALS REMAINS LARGEST CONTRIBUTOR
METALS
71
PLASTICS
17
PAPER
9
CORPORATE
3
H1 2019METALS
68
PLASTICS
25
PAPER
21
CORPORATE
(14)
H1 2020
CONTINUING OPERATIONS – TRADING PROFIT
(%)
SEGMENTAL PERFORMANCE BY SUBSTRATE – TRADING PROFIT
R million H1 2020 H1 2019 % ∆
Metal 429 737 (42)
Plastics 157 174 (10)
Paper 133 94 41
Corporate services (86) 27 (100)
Continuing operations 633 1 032 (39)
Glass 88 89 (1)
Plastics Europe (18) (73) 75
Discontinued operations 70 16 >100
Total 703 1 048 (33)

41
REGIONAL PERFORMANCE
SEGMENTAL PERFORMANCE BY REGION – TRADING PROFIT
R million H1 2020 H1 2019 % ∆
South Africa 232 432 (46%)
Rest of Africa 487 573 (15%)
Corporate services (86) 27 >(100)
Continuing operations 633 1 032 (39%)
South Africa – Glass 88 89 (1)
Europe (18) (73) 75
Discontinued operations 70 16 >100
Total 703 1 048 (33%)
SEGMENTAL PERFORMANCE BY REGION – REVENUE
R million H1 2020 H1 2019 % ∆
South Africa 4 304 5 092 (15)
Rest of Africa 2 215 2 790 (21)
Continuing operations 6 519 7 882 (17)
South Africa - Glass 791 764 3
Europe 131 572 (78)
Discontinued operations 922 1 336 (31)
Total 7 441 9 218 (19)

42
OVERVIEW OF PROGRESS IN PERIOD

Nondyebo Mqulwana
+27 11 719 6300
www.nampak.com
INVESTOR RELATIONS
CONTACT DETAILS
Recommended