Abstract— Biogas production from anaerobic co-digestion of
cow dung (CD), chicken manure (CM), pig manure (PM) sewage
waste (SW) was evaluated in laboratory batch scale at ratios
1:1:1:1, 2:1:1:1 and 3:1:1:1. Highest methane yields were
achieved from CD to CM, PM and SW at ratio of 1:1:1:1 (58%
CH4/d). The effect of temperature on methane yield was also
investigated at 35, 40, 50 and 55 f˚C. The optimum temperature
for anaerobic co-digestion was found to be 40 ˚C with the highest
methane yield of 62% CH4/ d on Day 6 of the gas production.
Ratios of 3:1:1:1 had the highest impurities followed by ratios of
2:1:1:1 and 1:1:1:1, respectively. The study has shown that co-
digestion of animal waste or other organic wastes is more
advantageous than processing each feedstock separately.
Index Terms— Anaerobic digestion, Biogas, Co-digestion,
Renewable energy
I. INTRODUCTION
NAEROBIC co-digestion of various organic wastes has
been shown to improve biogas yield. Recent interest in
producing renewable electricity or transport fuel through AD
technology has rapidly increased the use of co-digestion of
crops in farm-scale manure digesters [1]. Co-digestion of cattle
manure with farm waste is also a common practice in the
United States [2]. Mata-Alvarez et al. [3] reported that co-
digestion of crops with manure results in a higher methane
Manuscript received March 05, 2015; revised April 16, 2015. This work
was supported by the National Research Fund (NRF) and South African
National Energy Development Institute (SANEDI).
M. R Sebola is with the Department of Chemical Engineering Technology
at the University of Johannesburg, Doornfontein, South Africa: corresponding
author: e-mail:[email protected]
H.B Tesfagiorgis is with Agricultural Research Council – Institute for
Industrial Crops, Private Bag X82075, Rustenburg 0300, South Africa.
Edison Muzenda is a Professor of Chemical Engineering
in the Department of Chemical and Petroleum Engineering, College of
Engineering and Technology, Botswana International University of Science
and Technology, Private Mail Bag16, Palapye, Botswana as well as Visiting
Professor in the department of Chemical Engineering Technology at the
University of Johannesburg, Doornfontein, South Africa; e-
mail: [email protected]
yield than mono-digestion of manure due to the synergistic
effects of the co-substrates. The co-digestion concept has been studied and applied to
treat substrates such as municipal solid waste, sewage sludge,
cow manure and energy crops [4]. This study aim to co-digest
different animal manures to evaluate if the combinations can
improve the methane production. Co-digestion of manures
with co-substrates will have a lot of benefits. Firstly, it can
minimise the high concentrations of ammonia associated with
mono manure digestion and provide a wide range of nutrient
contents (C/N ratios) required by the methanogens [5]. In
addition, the increase in the buffering capacity and the
possibility of accumulation of volatile fatty acids (VFAs)
during digestion [6] can stabilise the pH to suit the
methanogenesis stage [6,7]. Moreover, it can provide
organisational and economic benefits by bringing an energy
surplus, which will provide additional income to the biogas
plants [8].
II. MATERIALS AND METHOD
A. Feedstock preparation
Representative samples of chicken manure, pig manure, cow
dung and sewage waste obtained from white poultry farms at
Lenasia, Elandsfontein (Walkersville) and Moletjie,
respectively, were used for this experiment. Feeding high
particle size feedstock was avoided to reduce challenges with
the agitation in the laboratory-scale digesters and with non-
homogeneity of the digestate, hence all raw materials were
dried at 65 °C for 6 days and then passed through a grinding
impact mill and digital electromagnetic sieve for size
reduction. The dried raw materials were stored in plastic
container at room temperature.
B. Analytical methods
The gas samples were taken from digesters daily using 1-ml
syringes. Before recording the pH, the overall biogas produced
was measured. The volume of biogas produced was corrected
to the standard temperature and pressure (STP) conditions.
The volume of biogas was measured by displacement of water,
and was then converted to the biogas volume under standard
Methane Production from Anaerobic Co-
digestion of Cow Dung, Chicken Manure, Pig
Manure and Sewage Waste
M. R. Sebola*1, H. B. Tesfagiorgis
2, E. Muzenda
3
A
Proceedings of the World Congress on Engineering 2015 Vol I WCE 2015, July 1 - 3, 2015, London, U.K.
ISBN: 978-988-19253-4-3 ISSN: 2078-0958 (Print); ISSN: 2078-0966 (Online)
WCE 2015
temperature and pressure (STP) conditions of 0 °C and 1
atmosphere. The methane content in biogas was measured
using a gas chromatograph (GC, claurus 580) with a thermal
conductivity detector and a 45–60 mesh, matrix molecular
sieve 5A column (Sigma–Aldrich, USA). Flammable
ionisation detector (FID) was used to determine the CH4
composition and thermal conductivity detector (TCD) was
used to measure CO2 and other additional gases present.
Helium gas was the carrier gas at a flow rate of 30 ml/min
while the temperatures of the oven, injector port and detector
were maintained at 51, 80 and 300 ˚C, respectively. The
experiment was conducted twice with two replications for each
treatment. A two way ANOVA was performed using GenStat
12 [9] for the data collected.
C. Biological methane production potential (BMP) tests
Anaerobic co-digestion of CD, CM, PM and SW was
carried out in three identical plastic batch reactors, each
having a working volume of 1 litre. The top of each digester
had two outlets which were used for introducing the feedstock
and collecting biogas, respectively. The biological methane
production potentials (BMPs) of the CD, CM, PM and SW
mixtures were examined at the ratios of 1:1:1:1 (Treatment A),
2:1:1:1(Treatment B) and 3:1:1:1(Treatment C) in 1-litre
digesters made from plastic bottles. The mass of VS of CD,
CM, PM and SW added to the 1-litre digester for ratio of
1:1:1:1 was 25g each. Tap water was added to each digester to
give a working volume of 800 ml. The initial pH of the mixed
solution in each digester was adjusted to 7.26. The digesters
were placed in a shaker incubators set to 35 °C, 40 °C, 50 °C
and 55 °C. The biogas produced was measured daily as
described above. The methane content and the biogas volume
produced from each digester were measured once daily. The
percentage of methane in the biogas was calculated by
dividing overall methane measured daily by the total volume
of biogas produced daily. No supplemental nutrients were
added to the substrate. The digesters were agitated daily to
avoid clogging of the feed. There were two replicates for each
experiment.
III. RESULTS AND DISCUSSIONS
A. Effect of co-digestion on biogas and methane yields
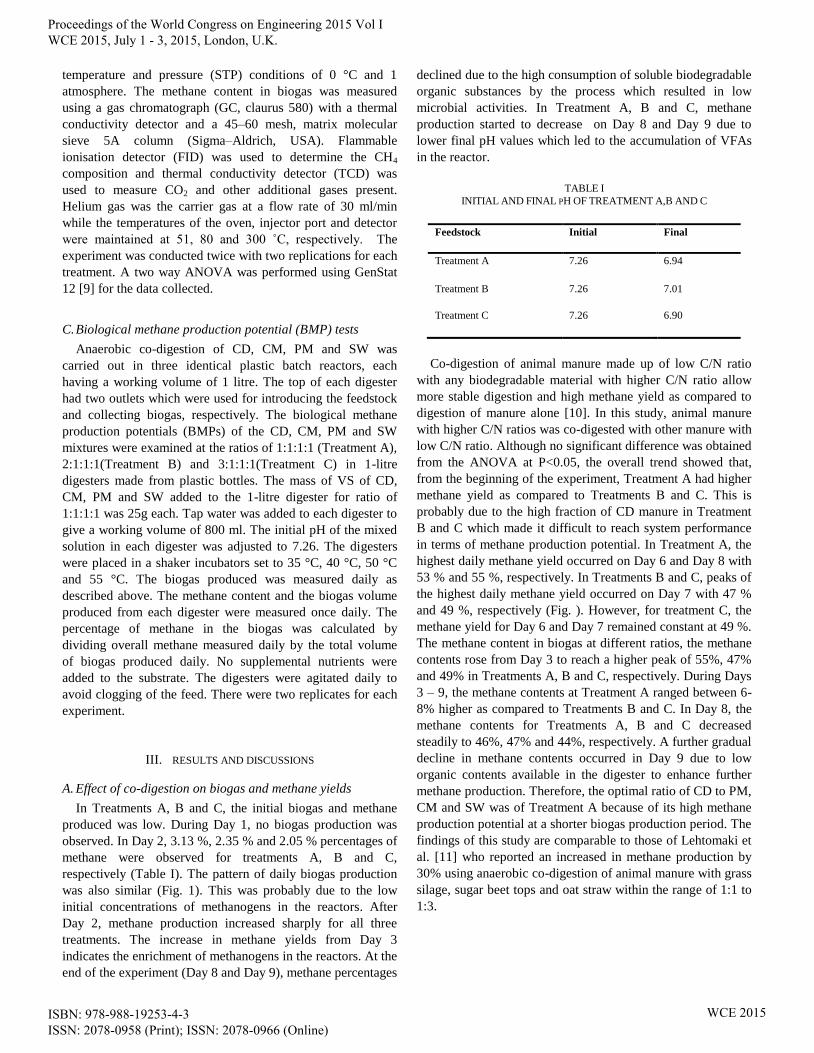
In Treatments A, B and C, the initial biogas and methane
produced was low. During Day 1, no biogas production was
observed. In Day 2, 3.13 %, 2.35 % and 2.05 % percentages of
methane were observed for treatments A, B and C,
respectively (Table I). The pattern of daily biogas production
was also similar (Fig. 1). This was probably due to the low
initial concentrations of methanogens in the reactors. After
Day 2, methane production increased sharply for all three
treatments. The increase in methane yields from Day 3
indicates the enrichment of methanogens in the reactors. At the
end of the experiment (Day 8 and Day 9), methane percentages
declined due to the high consumption of soluble biodegradable
organic substances by the process which resulted in low
microbial activities. In Treatment A, B and C, methane
production started to decrease on Day 8 and Day 9 due to
lower final pH values which led to the accumulation of VFAs
in the reactor.
TABLE I
INITIAL AND FINAL PH OF TREATMENT A,B AND C
Feedstock Initial Final
Treatment A 7.26 6.94
Treatment B 7.26 7.01
Treatment C 7.26 6.90
Co-digestion of animal manure made up of low C/N ratio
with any biodegradable material with higher C/N ratio allow
more stable digestion and high methane yield as compared to
digestion of manure alone [10]. In this study, animal manure
with higher C/N ratios was co-digested with other manure with
low C/N ratio. Although no significant difference was obtained
from the ANOVA at P<0.05, the overall trend showed that,
from the beginning of the experiment, Treatment A had higher
methane yield as compared to Treatments B and C. This is
probably due to the high fraction of CD manure in Treatment
B and C which made it difficult to reach system performance
in terms of methane production potential. In Treatment A, the
highest daily methane yield occurred on Day 6 and Day 8 with
53 % and 55 %, respectively. In Treatments B and C, peaks of
the highest daily methane yield occurred on Day 7 with 47 %
and 49 %, respectively (Fig. ). However, for treatment C, the
methane yield for Day 6 and Day 7 remained constant at 49 %.
The methane content in biogas at different ratios, the methane
contents rose from Day 3 to reach a higher peak of 55%, 47%
and 49% in Treatments A, B and C, respectively. During Days
3 – 9, the methane contents at Treatment A ranged between 6-
8% higher as compared to Treatments B and C. In Day 8, the
methane contents for Treatments A, B and C decreased
steadily to 46%, 47% and 44%, respectively. A further gradual
decline in methane contents occurred in Day 9 due to low
organic contents available in the digester to enhance further
methane production. Therefore, the optimal ratio of CD to PM,
CM and SW was of Treatment A because of its high methane
production potential at a shorter biogas production period. The
findings of this study are comparable to those of Lehtomaki et
al. [11] who reported an increased in methane production by
30% using anaerobic co-digestion of animal manure with grass
silage, sugar beet tops and oat straw within the range of 1:1 to
1:3.
Proceedings of the World Congress on Engineering 2015 Vol I WCE 2015, July 1 - 3, 2015, London, U.K.
ISBN: 978-988-19253-4-3 ISSN: 2078-0958 (Print); ISSN: 2078-0966 (Online)
WCE 2015
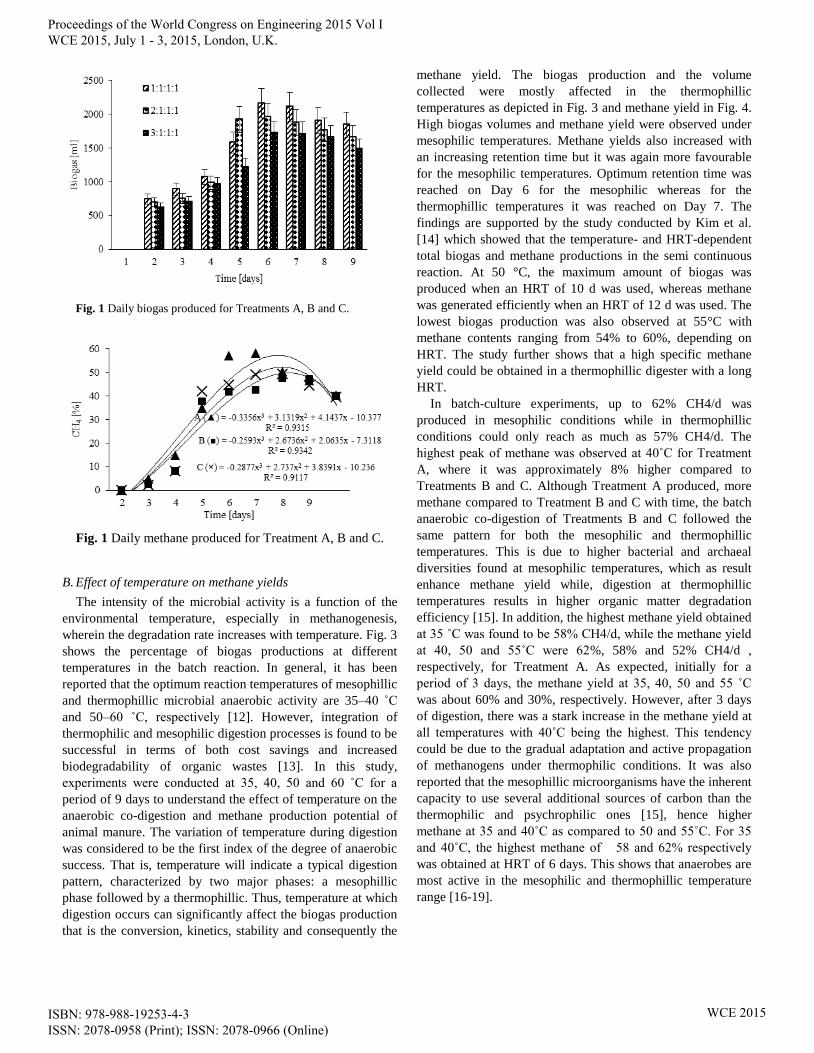
Fig. 1 Daily biogas produced for Treatments A, B and C.
Fig. 1 Daily methane produced for Treatment A, B and C.
B. Effect of temperature on methane yields
The intensity of the microbial activity is a function of the environmental temperature, especially in methanogenesis,
wherein the degradation rate increases with temperature. Fig. 3
shows the percentage of biogas productions at different
temperatures in the batch reaction. In general, it has been
reported that the optimum reaction temperatures of mesophillic
and thermophillic microbial anaerobic activity are 35–40 ˚C
and 50–60 ˚C, respectively [12]. However, integration of
thermophilic and mesophilic digestion processes is found to be
successful in terms of both cost savings and increased
biodegradability of organic wastes [13]. In this study,
experiments were conducted at 35, 40, 50 and 60 ˚C for a
period of 9 days to understand the effect of temperature on the
anaerobic co-digestion and methane production potential of
animal manure. The variation of temperature during digestion
was considered to be the first index of the degree of anaerobic
success. That is, temperature will indicate a typical digestion
pattern, characterized by two major phases: a mesophillic
phase followed by a thermophillic. Thus, temperature at which
digestion occurs can significantly affect the biogas production
that is the conversion, kinetics, stability and consequently the
methane yield. The biogas production and the volume
collected were mostly affected in the thermophillic
temperatures as depicted in Fig. 3 and methane yield in Fig. 4.
High biogas volumes and methane yield were observed under
mesophilic temperatures. Methane yields also increased with
an increasing retention time but it was again more favourable
for the mesophilic temperatures. Optimum retention time was
reached on Day 6 for the mesophilic whereas for the
thermophillic temperatures it was reached on Day 7. The
findings are supported by the study conducted by Kim et al.
[14] which showed that the temperature- and HRT-dependent
total biogas and methane productions in the semi continuous
reaction. At 50 °C, the maximum amount of biogas was
produced when an HRT of 10 d was used, whereas methane
was generated efficiently when an HRT of 12 d was used. The
lowest biogas production was also observed at 55°C with
methane contents ranging from 54% to 60%, depending on
HRT. The study further shows that a high specific methane
yield could be obtained in a thermophillic digester with a long
HRT.
In batch-culture experiments, up to 62% CH4/d was
produced in mesophilic conditions while in thermophillic
conditions could only reach as much as 57% CH4/d. The
highest peak of methane was observed at 40˚C for Treatment
A, where it was approximately 8% higher compared to
Treatments B and C. Although Treatment A produced, more
methane compared to Treatment B and C with time, the batch
anaerobic co-digestion of Treatments B and C followed the
same pattern for both the mesophilic and thermophillic
temperatures. This is due to higher bacterial and archaeal
diversities found at mesophilic temperatures, which as result
enhance methane yield while, digestion at thermophillic
temperatures results in higher organic matter degradation
efficiency [15]. In addition, the highest methane yield obtained
at 35 ˚C was found to be 58% CH4/d, while the methane yield
at 40, 50 and 55˚C were 62%, 58% and 52% CH4/d ,
respectively, for Treatment A. As expected, initially for a
period of 3 days, the methane yield at 35, 40, 50 and 55 ˚C
was about 60% and 30%, respectively. However, after 3 days
of digestion, there was a stark increase in the methane yield at
all temperatures with 40˚C being the highest. This tendency
could be due to the gradual adaptation and active propagation
of methanogens under thermophilic conditions. It was also
reported that the mesophillic microorganisms have the inherent
capacity to use several additional sources of carbon than the
thermophilic and psychrophilic ones [15], hence higher
methane at 35 and 40˚C as compared to 50 and 55˚C. For 35
and 40˚C, the highest methane of 58 and 62% respectively
was obtained at HRT of 6 days. This shows that anaerobes are
most active in the mesophilic and thermophillic temperature
range [16-19].
Proceedings of the World Congress on Engineering 2015 Vol I WCE 2015, July 1 - 3, 2015, London, U.K.
ISBN: 978-988-19253-4-3 ISSN: 2078-0958 (Print); ISSN: 2078-0966 (Online)
WCE 2015
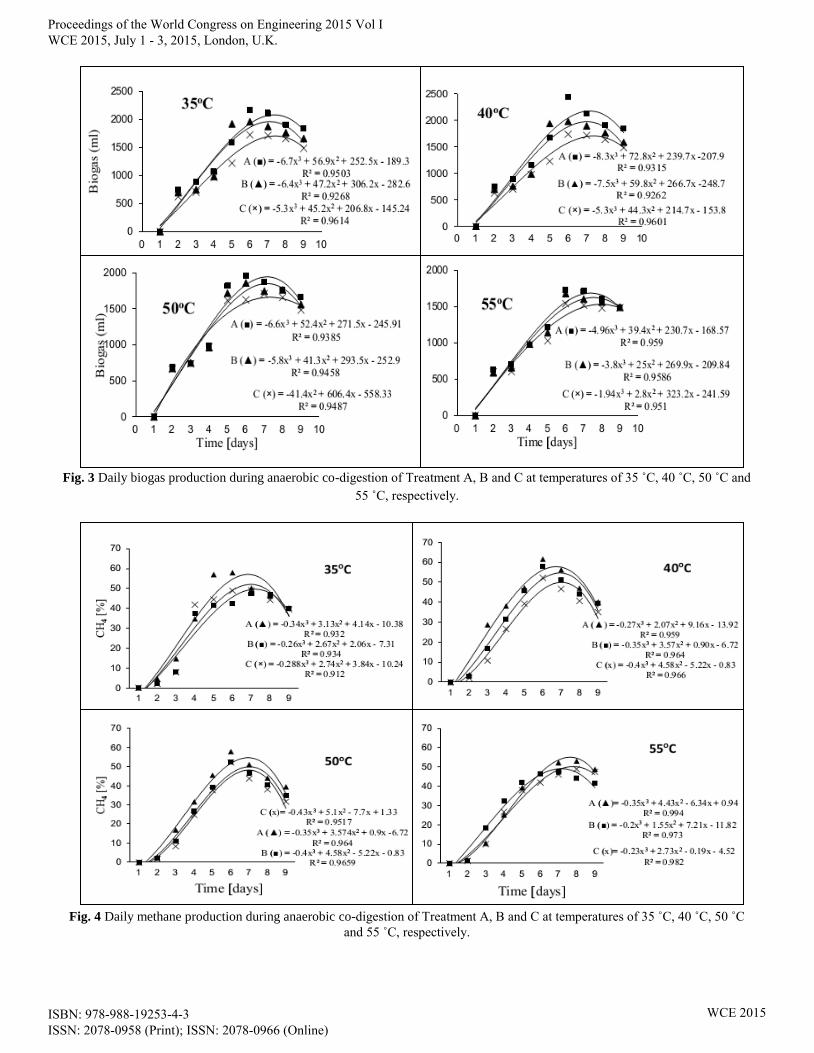
Fig. 3 Daily biogas production during anaerobic co-digestion of Treatment A, B and C at temperatures of 35 ˚C, 40 ˚C, 50 ˚C and
55 ˚C, respectively.
Fig. 4 Daily methane production during anaerobic co-digestion of Treatment A, B and C at temperatures of 35 ˚C, 40 ˚C, 50 ˚C
and 55 ˚C, respectively.
Proceedings of the World Congress on Engineering 2015 Vol I WCE 2015, July 1 - 3, 2015, London, U.K.
ISBN: 978-988-19253-4-3 ISSN: 2078-0958 (Print); ISSN: 2078-0966 (Online)
WCE 2015
In contrast, the highest biogas was obtained at HRT of 6
days for 50 and 55˚C, while the highest methane was
observed at Day 7. This observation shows that the length
of fermentation period is dependent on temperature that is
even though the biogas produced on Day 6 was high, the
quality of the methane was lower as compared to that of Day
7. This was as a result low soluble organic matter present in
Day 6 to enhance more methane production. Singh et al.,
[20] observed that methanogens were very sensitive to
sudden thermal changes; therefore, any drastic change in
temperature should be avoided for better microbial activity.
C. Variation of trace elements
The trace gases monitored in the present study included
carbon monoxide (CO), hydrogen sulphide (H2S) and
hydrogen (H2) as shown in Table II. Hydrogen was
extremely low; thus, it could not be identified by the gas
chromatography and due to this it was left out in the
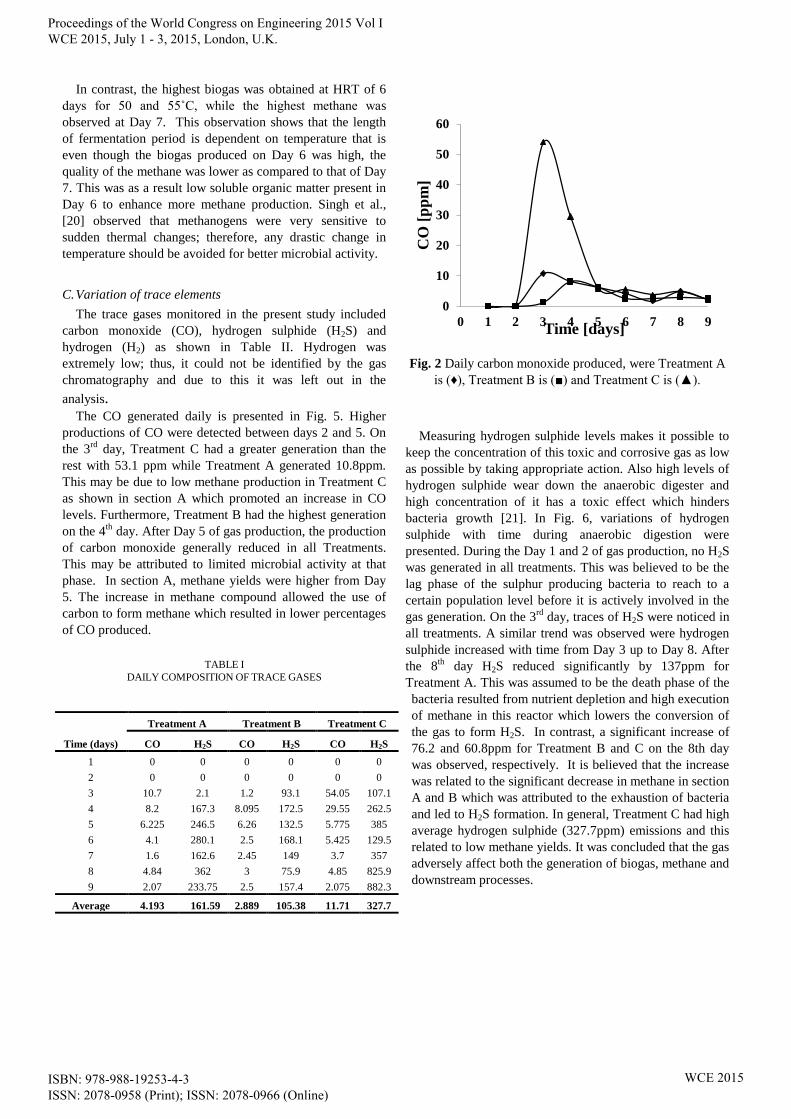
analysis. The CO generated daily is presented in Fig. 5. Higher
productions of CO were detected between days 2 and 5. On
the 3rd
day, Treatment C had a greater generation than the
rest with 53.1 ppm while Treatment A generated 10.8ppm.
This may be due to low methane production in Treatment C
as shown in section A which promoted an increase in CO
levels. Furthermore, Treatment B had the highest generation
on the 4th
day. After Day 5 of gas production, the production
of carbon monoxide generally reduced in all Treatments.
This may be attributed to limited microbial activity at that
phase. In section A, methane yields were higher from Day
5. The increase in methane compound allowed the use of
carbon to form methane which resulted in lower percentages
of CO produced.
TABLE I
DAILY COMPOSITION OF TRACE GASES
0
10
20
30
40
50
60
0 1 2 3 4 5 6 7 8 9
CO
[p
pm
]
Time [days]
Fig. 2 Daily carbon monoxide produced, were Treatment A
is (♦), Treatment B is (■) and Treatment C is (▲).
Measuring hydrogen sulphide levels makes it possible to
keep the concentration of this toxic and corrosive gas as low
as possible by taking appropriate action. Also high levels of
hydrogen sulphide wear down the anaerobic digester and
high concentration of it has a toxic effect which hinders
bacteria growth [21]. In Fig. 6, variations of hydrogen
sulphide with time during anaerobic digestion were
presented. During the Day 1 and 2 of gas production, no H2S
was generated in all treatments. This was believed to be the
lag phase of the sulphur producing bacteria to reach to a
certain population level before it is actively involved in the
gas generation. On the 3rd
day, traces of H2S were noticed in
all treatments. A similar trend was observed were hydrogen
sulphide increased with time from Day 3 up to Day 8. After
the 8th
day H2S reduced significantly by 137ppm for
Treatment A. This was assumed to be the death phase of the
bacteria resulted from nutrient depletion and high execution
of methane in this reactor which lowers the conversion of
the gas to form H2S. In contrast, a significant increase of
76.2 and 60.8ppm for Treatment B and C on the 8th day
was observed, respectively. It is believed that the increase
was related to the significant decrease in methane in section
A and B which was attributed to the exhaustion of bacteria
and led to H2S formation. In general, Treatment C had high
average hydrogen sulphide (327.7ppm) emissions and this
related to low methane yields. It was concluded that the gas
adversely affect both the generation of biogas, methane and
downstream processes.
Treatment A Treatment B Treatment C
Time (days) CO H2S CO H2S CO H2S
1 0 0 0 0 0 0
2 0 0 0 0 0 0
3 10.7 2.1 1.2 93.1 54.05 107.1
4 8.2 167.3 8.095 172.5 29.55 262.5
5 6.225 246.5 6.26 132.5 5.775 385
6 4.1 280.1 2.5 168.1 5.425 129.5
7 1.6 162.6 2.45 149 3.7 357
8 4.84 362 3 75.9 4.85 825.9
9 2.07 233.75 2.5 157.4 2.075 882.3
Average 4.193 161.59 2.889 105.38 11.71 327.7
Proceedings of the World Congress on Engineering 2015 Vol I WCE 2015, July 1 - 3, 2015, London, U.K.
ISBN: 978-988-19253-4-3 ISSN: 2078-0958 (Print); ISSN: 2078-0966 (Online)
WCE 2015
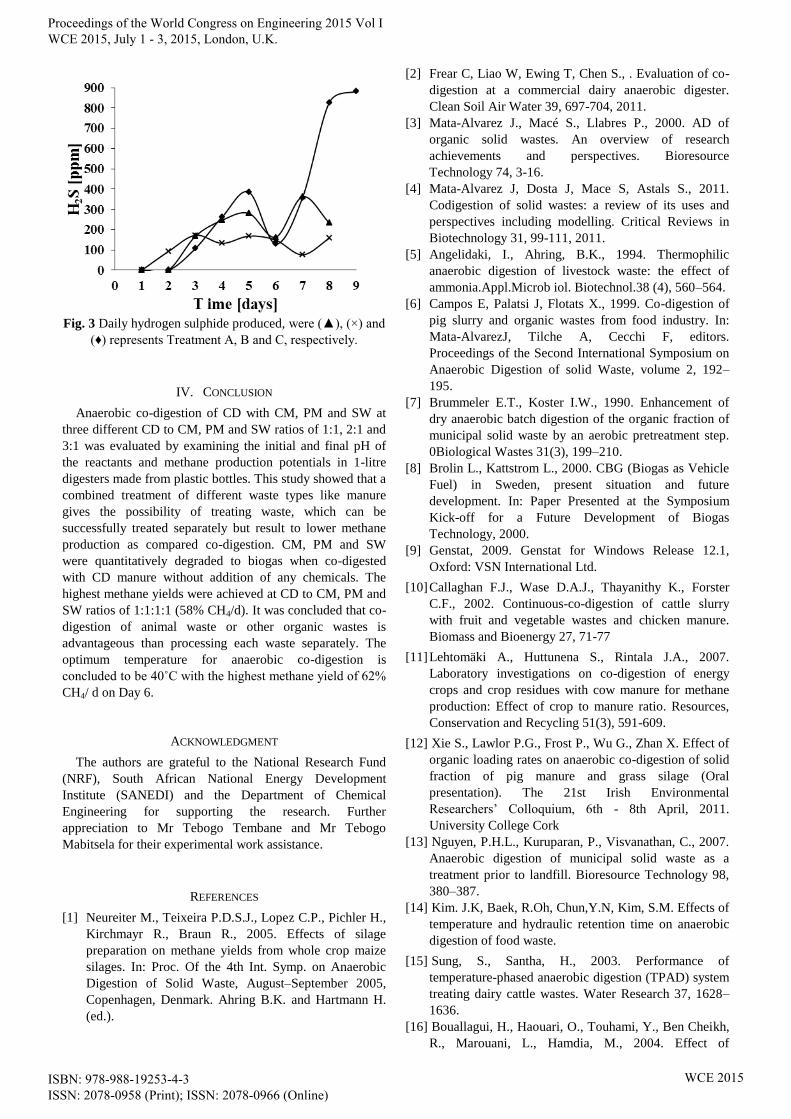
Fig. 3 Daily hydrogen sulphide produced, were (▲), (×) and
(♦) represents Treatment A, B and C, respectively.
IV. CONCLUSION
Anaerobic co-digestion of CD with CM, PM and SW at
three different CD to CM, PM and SW ratios of 1:1, 2:1 and
3:1 was evaluated by examining the initial and final pH of
the reactants and methane production potentials in 1-litre
digesters made from plastic bottles. This study showed that a
combined treatment of different waste types like manure
gives the possibility of treating waste, which can be
successfully treated separately but result to lower methane
production as compared co-digestion. CM, PM and SW
were quantitatively degraded to biogas when co-digested
with CD manure without addition of any chemicals. The
highest methane yields were achieved at CD to CM, PM and
SW ratios of 1:1:1:1 (58% CH4/d). It was concluded that co-
digestion of animal waste or other organic wastes is
advantageous than processing each waste separately. The
optimum temperature for anaerobic co-digestion is
concluded to be 40˚C with the highest methane yield of 62%
CH4/ d on Day 6.
ACKNOWLEDGMENT
The authors are grateful to the National Research Fund
(NRF), South African National Energy Development
Institute (SANEDI) and the Department of Chemical
Engineering for supporting the research. Further
appreciation to Mr Tebogo Tembane and Mr Tebogo
Mabitsela for their experimental work assistance.
REFERENCES
[1] Neureiter M., Teixeira P.D.S.J., Lopez C.P., Pichler H.,
Kirchmayr R., Braun R., 2005. Effects of silage
preparation on methane yields from whole crop maize
silages. In: Proc. Of the 4th Int. Symp. on Anaerobic
Digestion of Solid Waste, August–September 2005,
Copenhagen, Denmark. Ahring B.K. and Hartmann H.
(ed.).
[2] Frear C, Liao W, Ewing T, Chen S., . Evaluation of co-
digestion at a commercial dairy anaerobic digester.
Clean Soil Air Water 39, 697-704, 2011.
[3] Mata-Alvarez J., Macé S., Llabres P., 2000. AD of
organic solid wastes. An overview of research
achievements and perspectives. Bioresource
Technology 74, 3-16.
[4] Mata-Alvarez J, Dosta J, Mace S, Astals S., 2011.
Codigestion of solid wastes: a review of its uses and
perspectives including modelling. Critical Reviews in
Biotechnology 31, 99-111, 2011.
[5] Angelidaki, I., Ahring, B.K., 1994. Thermophilic
anaerobic digestion of livestock waste: the effect of
ammonia.Appl.Microb iol. Biotechnol.38 (4), 560–564.
[6] Campos E, Palatsi J, Flotats X., 1999. Co-digestion of
pig slurry and organic wastes from food industry. In:
Mata-AlvarezJ, Tilche A, Cecchi F, editors.
Proceedings of the Second International Symposium on
Anaerobic Digestion of solid Waste, volume 2, 192–
195.
[7] Brummeler E.T., Koster I.W., 1990. Enhancement of
dry anaerobic batch digestion of the organic fraction of
municipal solid waste by an aerobic pretreatment step.
0Biological Wastes 31(3), 199–210.
[8] Brolin L., Kattstrom L., 2000. CBG (Biogas as Vehicle
Fuel) in Sweden, present situation and future
development. In: Paper Presented at the Symposium
Kick-off for a Future Development of Biogas
Technology, 2000.
[9] Genstat, 2009. Genstat for Windows Release 12.1,
Oxford: VSN International Ltd.
[10] Callaghan F.J., Wase D.A.J., Thayanithy K., Forster
C.F., 2002. Continuous-co-digestion of cattle slurry
with fruit and vegetable wastes and chicken manure.
Biomass and Bioenergy 27, 71-77
[11] Lehtomäki A., Huttunena S., Rintala J.A., 2007.
Laboratory investigations on co-digestion of energy
crops and crop residues with cow manure for methane
production: Effect of crop to manure ratio. Resources,
Conservation and Recycling 51(3), 591-609.
[12] Xie S., Lawlor P.G., Frost P., Wu G., Zhan X. Effect of
organic loading rates on anaerobic co-digestion of solid
fraction of pig manure and grass silage (Oral
presentation). The 21st Irish Environmental
Researchers’ Colloquium, 6th - 8th April, 2011.
University College Cork
[13] Nguyen, P.H.L., Kuruparan, P., Visvanathan, C., 2007.
Anaerobic digestion of municipal solid waste as a
treatment prior to landfill. Bioresource Technology 98,
380–387.
[14] Kim. J.K, Baek, R.Oh, Chun,Y.N, Kim, S.M. Effects of
temperature and hydraulic retention time on anaerobic
digestion of food waste.
[15] Sung, S., Santha, H., 2003. Performance of
temperature-phased anaerobic digestion (TPAD) system
treating dairy cattle wastes. Water Research 37, 1628–
1636.
[16] Bouallagui, H., Haouari, O., Touhami, Y., Ben Cheikh,
R., Marouani, L., Hamdia, M., 2004. Effect of
Proceedings of the World Congress on Engineering 2015 Vol I WCE 2015, July 1 - 3, 2015, London, U.K.
ISBN: 978-988-19253-4-3 ISSN: 2078-0958 (Print); ISSN: 2078-0966 (Online)
WCE 2015
temperature on the performance of an anaerobic tubular
reactor treating fruit and vegetable waste. Process
Biochemistry 39, 2143–2148
[17] Umetsu, K., Takahata, H., Kawamoto, T., 1992. Effect
of temperature on mesophilic anaerobic digestion of
dairy cow slurry.Res.Bull. Obihiro Univ.Ser.I 17 (4),
401–408.
[18] Desai, M., Madamwar, D., 1994. Anaerobic digestion
of a mixture of cheese whey, poultry waste and cattle
dung: a study of the use of adsorbents to improve
digester performance.Environ .Pollut. 86 (3), 337–340.
[19] Mital, K., 1996. Biogas Systems-Principles and
Applications. New age International (P) Ltd.
[20] Singh, L., Maurya, M.S., Sairam, M., Alam, S.I., 1994.
Production of biogas from night soil: effect of
temperature and volatile solids. Indian J. Microbiol. 34
(3), 223–228.
[21] The Biogas Technology in China, 1989.
Proceedings of the World Congress on Engineering 2015 Vol I WCE 2015, July 1 - 3, 2015, London, U.K.
ISBN: 978-988-19253-4-3 ISSN: 2078-0958 (Print); ISSN: 2078-0966 (Online)
WCE 2015
Recommended