i
UNIVERSITY OF NAIROBI
DEPARTMENT OF ELECTRICAL AND INFORMATION ENGINEERING
MICROCONTROLLER BASED IMPEDANCE METER
PROJECT INDEX: 084
SUBMITTED BY:
NGOWI GIFT
REG NO: F17/38515/2011
SUPERVISOR: DR. G. N. KAMUCHA
EXAMINER: DR. W. MWEMA
PROJECT REPORT SUBMITTED IN PARTIAL FULFILLMENT
OF THE REQUIREMENT FOR THE AWARD OFTHE DEGREE OF
BACHELOR OF SCIENCE IN ELECTRICAL AND ELECTRONIC
ENGINEERING
OF THE UNIVERSITY OF NAIROBI 2016
SUBMITTED ON: 16TH MAY 2016
i
Declaration.
NAME OF STUDENT: NGOWI GIFT
REGISTRATION NUMBER: F17/38515/2011
COLLEGE: Architecture and Engineering
FACULTY/SCHOOL/INSTITUTE: Engineering
DEPARTMENT: Electrical and Information Engineering
COURSE NAME: Bachelor of Science in Electrical and Electronic Engineering
TITLE OF WORK: PROJECT 084: - MICROCONTROLLER BASED
IMPEDANCE METER FOR INDUCTOR, RESISTOR AND CAPACITOR.
1) I understand what plagiarism is and I am aware of the university policy in this regard.
2) I declare that this final year project report is my original work and has not been submitted
elsewhere for examination, award of a degree or publication. Where other people’s work or my
own work has been used, this has properly been acknowledged and referenced in accordance
with the University of Nairobi’s requirements.
3) I have not sought or used the services of any professional agencies to produce this work
4) I have not allowed, and shall not allow anyone to copy my work with the intention of passing
it off as his/her own work.
5) I understand that any false claim in respect of this work shall result in disciplinary action, in
accordance with University anti-plagiarism policy.
Signature: ……………………………………………………………………………………
Date: ………………………………………………………………………………………
ii
CERTIFICATION
This report has been submitted to the Department of Electrical and Information Eng. University
of Nairobi with my approval as supervisor:
DR. G. N. KAMUCHA
Date: ………………………………..

iii
Dedication.
To my mother, sister, Ms Rose I Ngowi, Mr. Elisifa G Ngowi and Mr. Hilary F Ngowi.

iv
Acknowledgement.
The idea of designing an impedance meter device brought a lot of excitement and expectations.
However, during the system implementation, fabrication and chip ordering many unexpected
challenges arose that needed research, studying and solving.
I thank my supervisor Dr. G Kamucha for his guidance during the project progress till its
successful design, implementation and fabrication.
During the project I obtained valuable help from my colleagues and especially Julius Kimani
who taught me how to code and program the microcontroller.
Lastly, I thank the Almighty Lord for the favor and grace through my degree and more so during
this project.
v
Abstract.
With growth in technology and design, electronics have widely been used with an aim to make
them as small as possible hence writing values on the body of the component becomes a
challenge. Every electrical engineer or lab technician would want a meter that would
conveniently measure resistance, capacitance and inductance.
Inductors and capacitors unlike resistors lack a universal code to determine their impedance by
sight hence a precise, low cost, small packaging, low power consumption, no-range selection for
a wide variety of components and zeroing at any instant (reset) meter has to be designed.
This project describes a microcontroller-based impedance meter for inductance, capacitance and
resistance. This design will improve the large, complex and expensive LCR meters by offering
small portable and precise meter with a microcontroller which has a flash programmable
memory, SRAM data memory with configurable analog and digital peripherals blocks in a range
of convenient pins-outs and memory sizes.
The meter measures the impedance and displays it on the LCD screen which is a large, low cost
display to provide a maximum of information at the same time. A selection switch is provided to
allow fast access to the three parameters.
vi
Table of Content.
Table of Contents
Declaration. ...................................................................................................................................... i
CERTIFICATION .......................................................................................................................... ii
Dedication. ..................................................................................................................................... iii
Acknowledgement. ........................................................................................................................ iv
Abstract. .......................................................................................................................................... v
Table of Content. ........................................................................................................................... vi
List of Figures. ............................................................................................................................. viii
Acronyms. ...................................................................................................................................... ix
1. INTRODUCTION. ................................................................................................................. 1
1.1. Background. ..................................................................................................................... 1
1.2. Justification. ..................................................................................................................... 2
1.3. Objectives. ........................................................................................................................ 2
1.4. Scope of work................................................................................................................... 2
1.5. Project report organization. .............................................................................................. 3
2. LITERATURE REVIEW. ...................................................................................................... 5
Resistors. ..................................................................................................................................... 5
Capacitance. ................................................................................................................................ 7
Inductance. .................................................................................................................................. 8
1. Digital LCR Meter. ....................................................................................................... 9
2. A real time FFT-based impedance meter with bias compensation. ............................ 11
3. A microcontroller Based Vector Impedance Meter with Reduction. ......................... 12
Implementation Technique. ...................................................................................................... 14
3. Design and implementation. ................................................................................................. 15
3.1 Principle of operation. .................................................................................................... 17
3.1.1. Inductance measurement. ........................................................................................ 21
3.1.2. Capacitance Measurement. ..................................................................................... 27
3.1.3. Resistance Measurement ......................................................................................... 29
Meter Range. ......................................................................................................................... 31
Component Layouts. ............................................................................................................. 32
vii
4. Results. .................................................................................................................................. 36
4.1. Meter Readings of unknown devices under test............................................................. 36
4.2. Data Analysis. ................................................................................................................ 37
5. Conclusion and Recommendation. ....................................................................................... 40
5.1. Limitation and future recommendations. ....................................................................... 40
References. .................................................................................................................................... 42
Appendix. ...................................................................................................................................... 44
Appendix A ............................................................................................................................... 44
Resistance: ............................................................................................................................ 44
Capacitance: .......................................................................................................................... 47
Inductance; ............................................................................................................................ 50
Reset:..................................................................................................................................... 52
Appendix B: Data sheets. .......................................................................................................... 53
Appendix C: Equation Derivations. .......................................................................................... 54
Resistance. ............................................................................................................................ 54
Capacitance: .......................................................................................................................... 54
Inductance: ............................................................................................................................ 54
Discharging Equation: .......................................................................................................... 54
Pull-Up resistor: .................................................................................................................... 55
De-bouncing capacitors: ....................................................................................................... 55
Range of the Meter: .............................................................................................................. 55
Appendix D: Bill Of Materials. ................................................................................................ 57
viii
List of Figures.
Figure 2-1 Resistance Determination by Ohm’s Law. [2] .............................................................. 6
Figure 2-2 Digital LCR Meter [7] ................................................................................................. 10
Figure 2-3 Adopted scheme to measure the unknown impedance. The voltage is generated via
software and applied via the output of the acquisition board; the voltages across the two resistors
are fed back to the acquisition board via the input channel and stored in memory [8] ................ 11
Figure 2-4 Microcontroller Based Vector Impedance Meter with Reduction Flowchart [11] ..... 13
Figure 3-1 ATMega328p-Arduino Pin Mapping [14] .................................................................. 16
Figure 3-2 Schematic simulation of the project using Proteus 8.1 ............................................... 18
Figure 3-3 DIPSW Switch to selsct the mode of measurement .................................................... 18
Figure 3-4 LCD Pin Layout .......................................................................................................... 19
Figure 3-5 Flow-Chart of the general operation of the Impedance Meter .................................... 21
Figure 3-6 LCR Circuit to measure the unknown Inductance [17] .............................................. 21
Figure 3-7 Simple Resonant Circuit [17] ...................................................................................... 22
Figure 3-8 Damped Oscillation to find the resonance frequency [17] .......................................... 22
Figure 3-9 Comparator LM393-N Output Signals [21] ................................................................ 26
Figure 3-10 Capacitance Measurement Flow-Chart ..................................................................... 29
Figure 3-11 Resistance Measurement Flow-Chart ....................................................................... 31
Figure 3-12 Power Supply Battery ............................................................................................... 33
Figure 3-13 Full fabrication of the Impedance Meter ................................................................... 33
Figure 3-14 Simulation components 1 .......................................................................................... 34
Figure 3-15 Simulation components 2 .......................................................................................... 34
Figure 3-16 PCB Layout ............................................................................................................... 35
Table 3Resitance Results .............................................................................................................. 36
Table 4 Capacitance Readings ...................................................................................................... 36
Table 5 Inductance Reading.......................................................................................................... 36
Figure 4-1 Resistance Readings .................................................................................................... 37
Figure 4-2 Capacitance Reading ................................................................................................... 38
Figure 4-3 Inductance Reading ..................................................................................................... 38
Table 1 Bill of Materials ............................................................................................................... 57

ix
Acronyms.
1
1. INTRODUCTION.
1.1. Background.
Most capacitors and inductors do not have a universal standard code to calculate their values or
they cannot be written on the body of the component since they are physically small. Most
laboratories have physically large meters like the LCR Meter and oscilloscopes to measure the
value of impedance of a device. Some of the techniques requires that the user has some technical
knowledge to be able to use them.
There are precise commercial portable LCR Meters which are complex to fabricate and
expensive to acquire.
For this project a microcontroller based impedance meter is designed and implemented to be
portable, accurate, simple to use and relatively cheap to fabricate. The user interface is simple
and the user can select the mode of the meter easily as either: resistance, capacitance or
inductance. The meter can auto-zero by pressing the reset button hence it can be used to compare
components. The resistance of an unknown component can be measured using the voltage
divider technique where the unknown component is connected in series with a known resistor
and a known voltage (Vcc) is suppled and the voltage drop across it is directly proportional to its
resistance.
For capacitance, the time taken to charge a previously fully discharged capacitor to 63.2% of the
supply voltage, VS; is found through the counter in the microcontroller and its divided by the
value of the series resistance to give the capacitance.
To obtain the inductance, the resonating frequency is found by discharging and charging the
capacitor and passed through a LC parallel circuit. The value of the resonating frequency is
limited by the value of the inductance. This frequency is converted to time and the
microcontroller can then calculate the value of the inductance.
The measured value is displayed to the LCD display which has a dot matrix format that shows
alphanumeric and special characters. The microcontroller used is the ATmega328p that has
enough flash memory of 30720 bits and a total of 28 pins with 22 free usable pins. [1]
2
The software used was coded using Arduino C which is a low level machine language and the
Arduino has many libraries that can be used to implement the design.
1.2. Justification.
The measurement of the impedance is important to determining the characteristics of a
component and how it can be used to implement a circuit design.
Since with growth of technology; devices are now manufactured to be physically small hence
their impedance value cannot be encrypted on the component body hence there is need of a
device that can be able to measure the value of the component accurately.
This project aims at designing a digital microcontroller-based impedance meter the is efficient,
fast, portable and cheaply fabricated. It has to be accurate and simple to operate with user
interface functionality like selection knob and LCD display. This meter is small and portable
enough that can be carried in the pocket and uses a battery so it can be used any time.
1.3. Objectives.
The main aim of this proposed project is to use a microcontroller, other peripheral components
and user interfaces to design and implement through fabrication a microcontroller-based
impedance meter. The meter is to measure the impedance of a resistor, capacitor and inductor
and display the values on the LCD quickly without any delays. The meter is simple and the
following guidelines are followed to achieve this objective;
1.3.1. Design a general flowchart of the operation of the meter.
1.3.2. Design a circuit and simulate it using Proteus 8.1 and obtain results of virtual
components.
1.3.3. Design the implementation circuits and component specification and fabricate the
project on a double-sided FR4 substrate PCB. Here the microcontroller
ATmega328p and the comparator LM339-N are used.
1.3.4. The fabricated project was used to collect data on real components and the results
compared with results from commercial precise meters.
1.4. Scope of work.
This project is limited to the design of a digital microcontroller-based impedance meter to
measure the impedance value of inductors, capacitors and resistors. The device under test (DUT)
3
is connected to the device after selecting the mode and the meter will determine the impedance
value by manipulating the characteristics of the device in an LCR circuit. The design and
fabrication is aimed at providing the following features:
1.4.1. Measure the impedance of inductors, capacitors and resistors.
1.4.2. Provide a user interface to allow the user to select the mode of operation.
1.4.3. Auto-range every time a component is connected.
1.4.4. Can zero the meter each time a component is connected which is an important
feature when comparing components.
1.4.5. Simple intuitive user interface.
1.5. Project report organization.
This project report is systematically organized to explain the theory of the proposed project,
design and implementation, fabrication, test and results and analysis to determine whether the
objectives are met. The whole project is organized in chapters as shown below:
1) Declaration;
2) Dedication;
3) Acknowledgements;
4) Abstract;
5) Table of Contents;
6) List of Figures;
7) Acronyms;
8) Chapter 1: this gives the introduction of the project with a brief background,
objectives and scope of work.
9) Chapter 2: this covers the literature review with the theoretical background of the
main units of the project.
10) Chapter 3: Design and implementation. The design includes simulation of the
project and fabrication on a PCB and testing it so as to function as expected.
11) Chapter 4: Results. A comparison is done by using the impedance meter to sample
some devices under test and a precise laboratory meter is used to read the values
of the components. Analysis is done to determine accuracy of the meter.
4
12) Conclusions and Recommendations. The analysis introduces some imperfections
in the project which are discussed here in addition to other challenges that limited
this scope of the project and improvement recommendations done.
13) References: the citations made are acknowledged in preference as they are used
using the IEEE format.
14) Appendix
5
2. LITERATURE REVIEW.
All practical components are either partially reactive and resistive and can be modelled in such a
way so that they are either in series or parallel to a reactive or resistive load. There is need to
know the impedance of the component coupled to the load.
The impedance of a component is the voltage drop that arises from the current that passes across
it. Mostly the impedance is presented as a complex number with a magnitude and phase.
We introduce three vector quantities with different angles;
𝑉 = 𝑣˂𝛹 … … … … … … … … … … (1)
𝐼 = 𝑖 < 𝛷 … … … … … … … … … … (2)
𝑍 = 𝑧 < 𝜃 … … … … … … … … … … (3)
For a resistive component the impedance has an angle of zero hence the current is in phase with
the voltage. The impedance has an angle value and expressed as: 𝑍 = 𝑅 + 𝑗𝑋.
Theoretically, the resistance parameter does not change with change in frequency and the
reactive parameter will change with change in frequency. In practice the impedance is a
combination of the resistive and reactive element forming a complex impedance.
Resistors.
A resistor is a device that limits the flow of current in an electrical circuit. The measuring unit of
a resistor is Ohm and is given by the symbol Ω. There are different types of resistors namely:
Carbon, Film and wirewound.
Most resistors are identified by the color coding on them that gives their resistance. Very large
resistors are identified by the BS1852 Standard of coding. This coding system is not accurate and
provides a tolerance percentage which is either: 20%, 10%, 5% or 1%.
The accurate value of the resistor is important to be found so that when connected in a circuit,
the desired characteristics are achieved. Several resistors can be combined as series or parallel to
meet a desired resistance.
When resistors are in operation they dissipate power. A power rating is provided so that the
power dissipated is not exceeded which may damage the resistor. Low ohmic value power
resistors are generally used for current sensing or power supply application. The power rating of
resistors can be calculated as:
6
𝑃𝑜𝑤𝑒𝑟 (𝑃) = 𝑉 × 𝐼 = 𝐼2𝑅 =𝑉2
𝑅… … … … … … … … . (4)
In AC circuits the voltage and current flowing in a pure resistor are in phase i.e. have a 0º phase
shift.
To know the accurate value of a resistor is very instrumental in the design of electronics and
different techniques have been used such as:
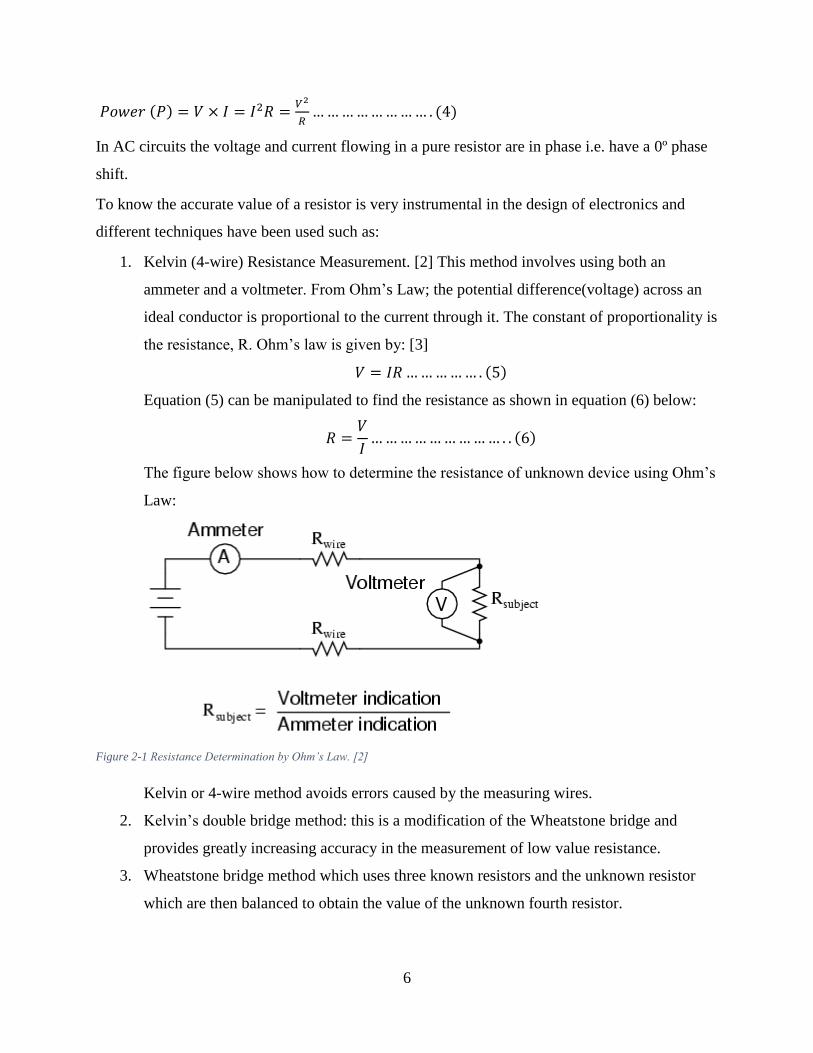
1. Kelvin (4-wire) Resistance Measurement. [2] This method involves using both an
ammeter and a voltmeter. From Ohm’s Law; the potential difference(voltage) across an
ideal conductor is proportional to the current through it. The constant of proportionality is
the resistance, R. Ohm’s law is given by: [3]
𝑉 = 𝐼𝑅 … … … … … . (5)
Equation (5) can be manipulated to find the resistance as shown in equation (6) below:
𝑅 =𝑉
𝐼… … … … … … … … … . . (6)
The figure below shows how to determine the resistance of unknown device using Ohm’s
Law:
Figure 2-1 Resistance Determination by Ohm’s Law. [2]
Kelvin or 4-wire method avoids errors caused by the measuring wires.
2. Kelvin’s double bridge method: this is a modification of the Wheatstone bridge and
provides greatly increasing accuracy in the measurement of low value resistance.
3. Wheatstone bridge method which uses three known resistors and the unknown resistor
which are then balanced to obtain the value of the unknown fourth resistor.
7
Capacitance.
The capacitor is a component that stores electric charge on its plates which are separated by a
dielectric which is equivalent to the input voltage:
𝑞 = 𝐶𝑉 … … … … … … . . (7)
Where C is the capacitance of the device which is the property of a capacitor to store charge on
the form of electrostatic field;
V is the input voltage that charges the plates;
q is the charge stored.
The capacitance stored on the plates is directly proportional to the area, A and inversely
proportional to the distance of separation, d. The generalized equation for the capacitance is
given as:
𝐶 = 𝜀 (𝐴
𝑑) … … … … … … (8)
Where ε represent the absolute permittivity of the dielectric material used.
Capacitance is the electrical property of a capacitor and a measure of a capacitor’s ability to store
an electrical charge in units called Farad, F. Hence capacitance of one Farad can now be defined
as the charge of one coulomb stored on the plates by a voltage of one volt as expressed in
equation (7). [4] A Farad is a very large unit of measurement to use in the fabrication of
electrical components hence capacitors are available in smaller multiples:
Microfarad (μF) 1μF = 1/1,000,000 = 0.000001 = 10-6 F
Nanofarad (nF) 1nF = 1/1,000,000,000 = 0.000000001 = 10-9 F
Picofarad (pF) 1pF = 1/1,000,000,000,000 = 0.000000000001 = 10-12 F
All capacitors have a maximum voltage that should not be exceeded otherwise it will be
damaged by breaking down the dielectric and arcing occurs between the plates.
The capacitor does not instantly get charged or discharged. It takes some time to fully charge or
discharge a capacitor. The time required for a capacitor to reach its charge is proportional to the
capacitance value and the resistance value. This time is the time constant, τ in seconds. The time
constant of an RC-circuit is:
𝜏 = 𝑅 × 𝐶 … … … … … … … (9)
8
The time here is the time taken for the capacitor to acquire 63.2% of the source voltage. [4] It
takes five time constants to fully charge a capacitor. This property is taken advantage of in the
design of a capacitance meter in this project.
With this knowledge of capacitance, it is hence important know the actual capacitance of a
capacitor. Over the years, many techniques have been uses to determine capacitance by
manipulating its properties; they include:
1. Measuring with a squarewave: the capacitor to be known is supplied with a
squarewave from a signal generator and the output is analyzed by checking the
voltage shape and internal series resistance; the capacitance is found. [5]
2. Measuring with a sinewave: The capacitor is inserted in a half bridge configuration
which is supplied with a sinewave from a signal generator. The capacitance is found
by measuring the voltage output and the phase difference. [5]
3. Resonance measurement. This arrangement has a reference inductor connected to a
sinewave generator where the unknown capacitor is connected. The frequency range
where the resonance frequency is expected is slowly varied to get the exact frequency
which is characterized by a sharp voltage drop. With the resonance frequency, fₒ, the
unknown capacitance, CX can be calculated as:
𝐶𝑥 =1
(2𝜋𝑓ₒ)2𝐿𝑟𝑒𝑓… … … … … … . . (10)
Where Lref is the reference inductor. [5]
Of the used techniques, their accuracies are affected as they are using measuring equipment
which have their own errors. In this project design, the time constant property of the capacitor is
used to measure the capacitance using a microcontroller.
Inductance.
When current flows through a wire wound coil, it produces magnetic flux around it that is
proportional to the flow of the electric current.
An inductor is a passive component that is a coil of wires around a core that takes advantage of
the magnetic flux and emf generated when the current passes through it. They are normally
categorized according to the inner core they are wound around.
Inductors oppose changes in currents through it but will easily pass a steady current through it.
[6] Hence inductance is the ability of an inductor to resist changes in current i, and cause
9
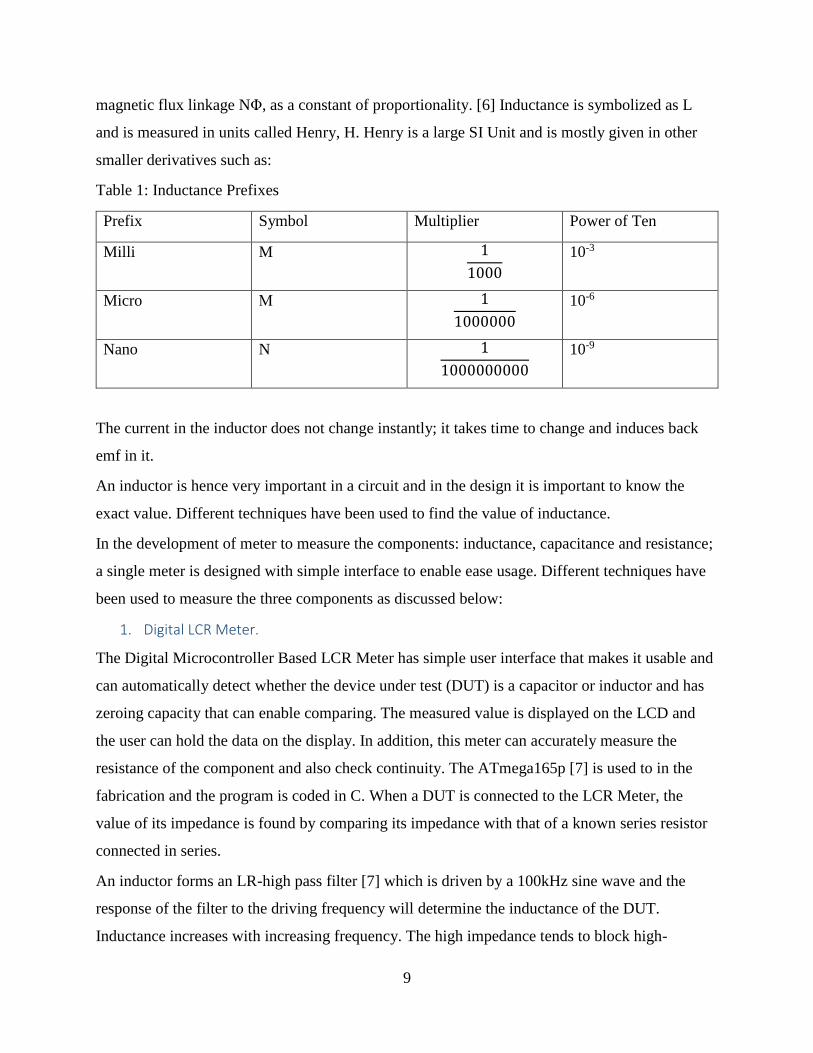
magnetic flux linkage NΦ, as a constant of proportionality. [6] Inductance is symbolized as L
and is measured in units called Henry, H. Henry is a large SI Unit and is mostly given in other
smaller derivatives such as:
Table 1: Inductance Prefixes
Prefix Symbol Multiplier Power of Ten
Milli M 1
1000
10-3
Micro Μ 1
1000000
10-6
Nano N 1
1000000000
10-9
The current in the inductor does not change instantly; it takes time to change and induces back
emf in it.
An inductor is hence very important in a circuit and in the design it is important to know the
exact value. Different techniques have been used to find the value of inductance.
In the development of meter to measure the components: inductance, capacitance and resistance;
a single meter is designed with simple interface to enable ease usage. Different techniques have
been used to measure the three components as discussed below:
1. Digital LCR Meter.
The Digital Microcontroller Based LCR Meter has simple user interface that makes it usable and
can automatically detect whether the device under test (DUT) is a capacitor or inductor and has
zeroing capacity that can enable comparing. The measured value is displayed on the LCD and
the user can hold the data on the display. In addition, this meter can accurately measure the
resistance of the component and also check continuity. The ATmega165p [7] is used to in the
fabrication and the program is coded in C. When a DUT is connected to the LCR Meter, the
value of its impedance is found by comparing its impedance with that of a known series resistor
connected in series.
An inductor forms an LR-high pass filter [7] which is driven by a 100kHz sine wave and the
response of the filter to the driving frequency will determine the inductance of the DUT.
Inductance increases with increasing frequency. The high impedance tends to block high-
10
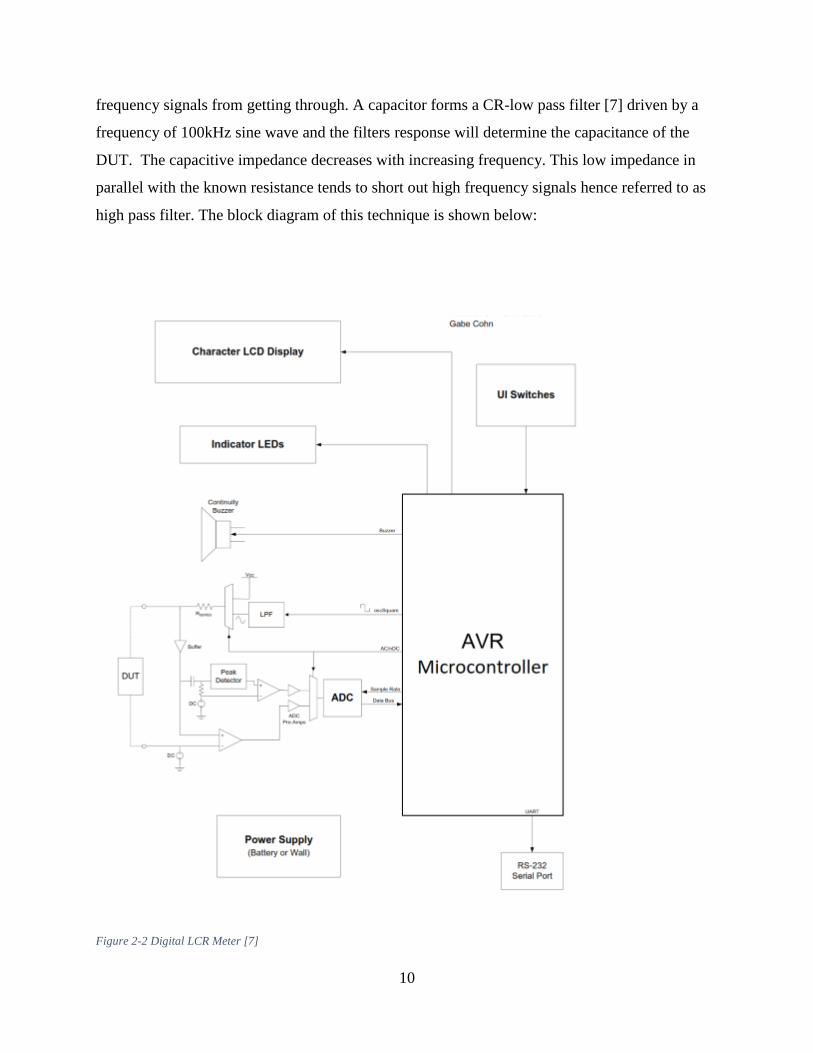
frequency signals from getting through. A capacitor forms a CR-low pass filter [7] driven by a
frequency of 100kHz sine wave and the filters response will determine the capacitance of the
DUT. The capacitive impedance decreases with increasing frequency. This low impedance in
parallel with the known resistance tends to short out high frequency signals hence referred to as
high pass filter. The block diagram of this technique is shown below:
Figure 2-2 Digital LCR Meter [7]
11
2. A real time FFT-based impedance meter with bias compensation.
This mode of impedance measurement uses a personal computer (PC) that is connected to some
biasing channel that measure the impedance value and present it to the computer that analyses
the result using a software. Channel biasing problems are reduced by use of effective algorithm
that is of ad hoc cost effective and through synchronous sampling of the channels, leakage error
is eliminated.
This method eliminates the limitation of aliasing and spectral interference by using anti -aliasing
filter and sinusoidal signals that have low distortion. [8] With the use of customized software on
the PC then more features can be added and displayed on the screen.
This method utilizes the efficiency, accuracy and low cost measurement of the impedance at
different frequencies based on the Fast Fourier Transform (FFT). [8]
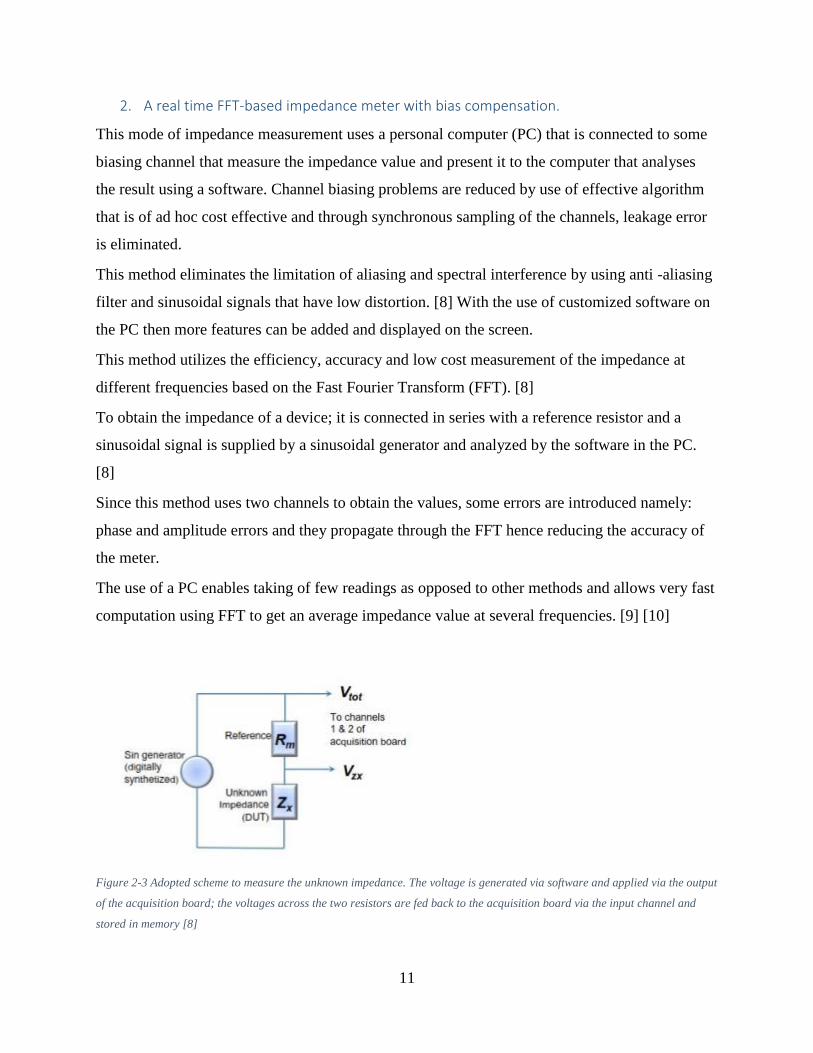
To obtain the impedance of a device; it is connected in series with a reference resistor and a
sinusoidal signal is supplied by a sinusoidal generator and analyzed by the software in the PC.
[8]
Since this method uses two channels to obtain the values, some errors are introduced namely:
phase and amplitude errors and they propagate through the FFT hence reducing the accuracy of
the meter.
The use of a PC enables taking of few readings as opposed to other methods and allows very fast
computation using FFT to get an average impedance value at several frequencies. [9] [10]
Figure 2-3 Adopted scheme to measure the unknown impedance. The voltage is generated via software and applied via the output
of the acquisition board; the voltages across the two resistors are fed back to the acquisition board via the input channel and
stored in memory [8]
12
The voltage through the DUT is generated via the software in the PC from the acquisition board.
The voltage across the reference resistor is taken to the acquisition board through the two
channels and analyzed by the software and stored in memory. [8]
During the implementation of this method, parameters are selectively chosen to eliminate errors
by the FFT. The converters are driven by the same clock pulse to minimize leakage errors.
This system still suffers from limitation like aliasing, spectral leakages and harmonic
interference (HI) which reduce the accuracy of the final impedance value. [8]
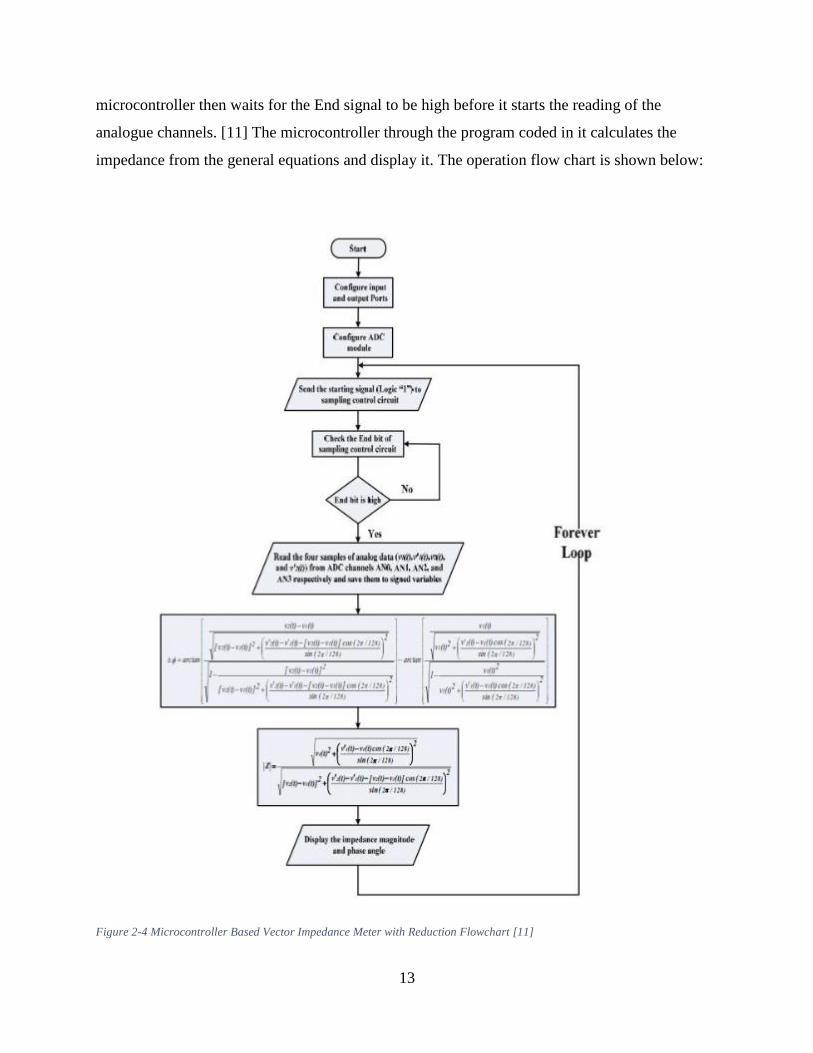
3. A microcontroller Based Vector Impedance Meter with Reduction.
This technique takes four sample reading from the device under test which are essentially voltage
signals. One of the signals is proportional to the voltage across the DUT and the second is the
voltage proportional to the current across the DUT. This values then give the digital profile of
the impedance magnitude and angle through a microcontroller. This is done by taking the sample
at different frequencies. The four values are taken quickly and the topology of the component s is
maintained at the varying frequencies.
The flow chart below shows how the microcontroller program operates. A control sampling
circuit is essential for this method to ensure that V1(t) and V(t) are taken at the same time and
separated by a time Δt from the second set of samples V’1(t) and V’2(t).
The Schmitt trigger squares the voltage signal which is then input to the PLL based frequency
multiplier which then obtains samples at N samples/ input cycles. [11]
One of the outputs of the Schmitt trigger is fed to the output of a divide by N counter.
The frequency difference from the output of the trigger is very small which is output by the
phase detector as a voltage proportional to the difference. This difference is then applied to the
loop filter which gives the characteristics of the PLL. The PLL then clocks some D-Flip-flops to
start the sampling process after the microcontroller sends the start signal with logic high. The
13
microcontroller then waits for the End signal to be high before it starts the reading of the
analogue channels. [11] The microcontroller through the program coded in it calculates the
impedance from the general equations and display it. The operation flow chart is shown below:
Figure 2-4 Microcontroller Based Vector Impedance Meter with Reduction Flowchart [11]
14
In the above discussed techniques, voltage and current signals are passed through the DUT and
its response proportional to the signal is taken through transducers which are mainly
differentiator operation amplifier and ADC that takes the digital resulting signal to the AVR
microcontroller that will give a numerical value that is displayed on the LCD.
In earlier versions of an LCR meter, the impedance was determined using Bridge circuits.
In the latest designs, emphasis is put on making the meter to be varying portable, fast and
accurate and to digitally display the value of the impedance for ease reading. This leads to the
use of microprocessors/microcontrollers in the design.
The use of microcontroller has the following advantages:
1. The microcontroller introduces many functionalities that the meter can perform in
addition to measurement of impedance. These functions may include: interface to the
computer through a RS-232 serial port, saving the impedance measured in a memory
location, auto-range and indicators.
2. Using microcontroller reduces the meters to be small, portable and easily operated
compared to the earlier versions. [12]
3. The meter can quickly run a self-test each time its put on and can display any error that
may lead to inaccurate reading and a troubleshooting can be done.
4. The level of accuracy and speed at which several components are measured is high.
With the use of microcontroller, the following disadvantages are shown:
1. There is complexity in writing a program to run in the microcontroller.
2. Complex circuity design and very accurate fabrication as most components are on-
surface-mount.
3. Susceptible to transient since they are delicate and cannot stand rough handling like high
level drop.
Implementation Technique.
In this project proposal, the design is to have a single microcontroller-based meter that measures
impedance: inductance, capacitance and resistance. This meter has simple use interface to select
the mode which is the type of impedance that is to be determined. The meter is powered by a
12V battery hence makes the meter portable and easily carried when under use.
The microcontroller used is the ATmega328p.
15
To determine the of DUT, the voltage divider technique is used where the amount of voltage
drop from the reference resistor connected in series with DUT is determined and digitized using
the ADC in the microcontroller and the value of impedance is determined.
For capacitors, the time constant characteristics for charging and discharging are used to
determine the value of the capacitance. The time used to charge an initially fully discharged to
63.2% of the supply voltage is determined and then the time used to calculate the capacitance
using a reference resistance connected in series with the capacitor under test.
To determine the value of an unknown inductor, it is connected in parallel with a reference
capacitor form in a LC-circuit. The property of the resonance frequency is used to determine the
inductance. The value of resonance frequency and capacitance are known. The unknown
inductance is then found by the formula below: 𝐿 =1
4𝜋2𝑓2𝐶… … … … … … … … (11)
3. Design and implementation.
In this project, the design of components was done to achieve minimum error as the
determination of the impedance values is dependent on the choice of design component.
The microcontroller ATmega328p is used in this project brings great advantage in the overall
implementation of this meter. The ATmega328p is an 8-bit AVR RISC-based microcontroller
from Atmel which provides 32KB flash, 1KB EEPROM and 2KB SRAM. It provides 23 general
purpose I/O lines. This chip can communicate using 12C, SPI 3 or 4 wire, UART, digital I/O and
has a built in 6 channel 10-bit Analog to Digital converter (ADC). This chip can work with
Arduino platform with an installed bootloader. This microcontroller can run on lower voltages
and uses less power especially in a standby or sleep state. The maximum frequency produced by
ATmega328p is 20MHz, for this project 16MHz is used to determine the impedance of the
capacitance since 𝜏 =1
𝑓 and gives the resonance frequency. The flash memory is enough to
support the code and storage of the value and calculation of the impedance. Gives an operation
voltage is -1.8V to 5.5V; for the Impedance Meter 5.0V are used. The microcontroller operation
speed is adequate to achieve accurate results since the measurement of capacitance and
inductance depends on the frequency hence speed response. The microcontroller has a system
clock that synchronizes the whole system. The in-built analog/digital converter is essential to this
16
project as the response of the device under test gives an analog signal that is converted to a
digital signal so that the microcontroller can manipulate the signal to give a reading. [13]
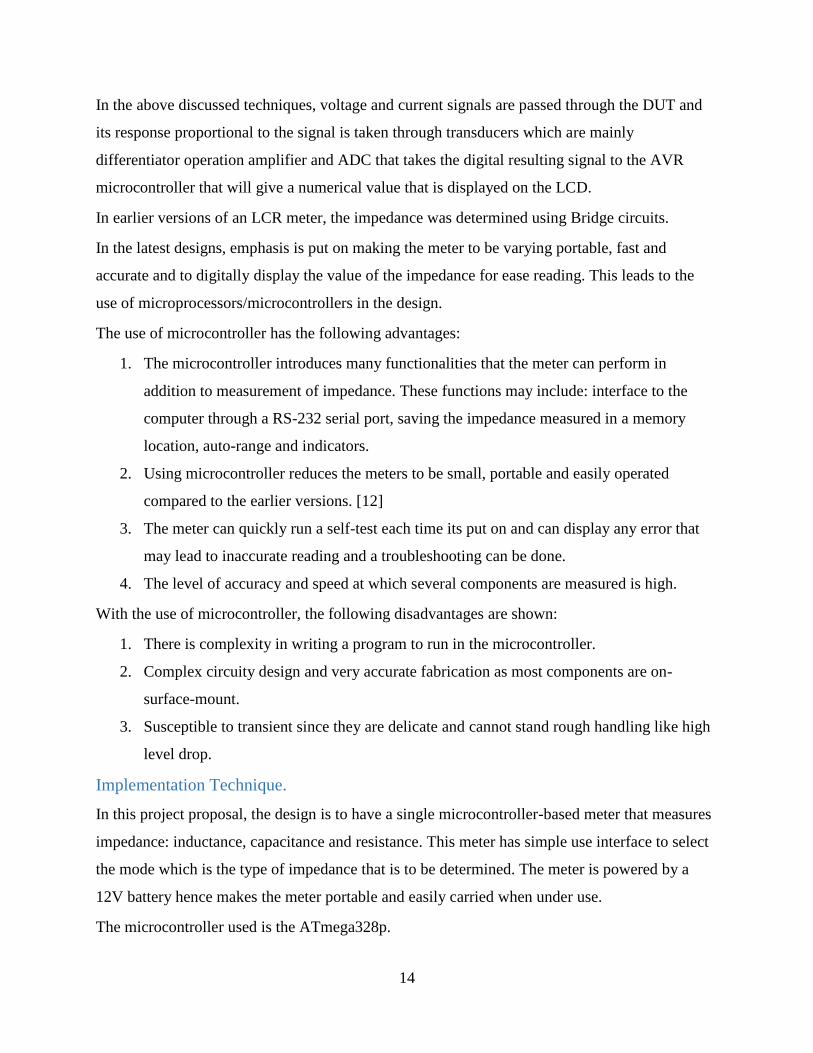
The pinout mapping for the microcontroller is shown in the figure below:
Figure 3-1 ATMega328p-Arduino Pin Mapping [14]
The C code is written in Arduino which offers ready to use libraries that are used directly in the
coding of the program. The Arduino is an open- source prototyping platform based on easy-to-
use hardware and software. Arduino can be integrated to perform many functions which can be
coded through the Arduino programming language and Arduino Software based on processing.
For this project the Arduino was preferred because:
Simplifies the process of working with microcontrollers.
Simple and clear programming environment through the Arduino Software (IDE).
Open source and extensive software. The Arduino software is published as open source
tools, available for extension through C++ libraries and AVR C programming
language on which it’s based and the AVR C-code can be directly added to the
Arduino program. This feature is used in the programming of this project as the AVR
C-code is used and then integrated in the Arduino program.

17
Open source and extensible hardware. [13]
The voltage regulator used here is to provide a steady smooth DC 5V to power the
microcontroller. Smoothening capacitors are used to eliminate the fluctuating voltage and to
have a small time delay in powering the system as the capacitors charge.
The voltage being DC needs to be in one direction. To facilitate this a diode is used. The 1N4007
is used in the design since it provides almost ideal characteristics with minimum loses.
The switches to select the operation of the meter are connected through a damp switch de-
bouncing capacitor. The value of the capacitor is determined by the time constant desired. A
pull-up resistor is used to pull the pins to 5V and form the RC circuit. A minimum current should
be drawn in the form the circuit through the pull-up resistors. In the design pull-up resistor of
10KΩ is used which draws a current of 0.5mA and causes a switching delay of 0.1s. This delay
is sufficient to cause a smooth switch and eliminate noise due to bouncing that will introduce
errors.
The input pins are set to high impedance mode to measure even low signals. They are defined to
be floating in the code and can take any state so as to read the signal input.
The discharging resistance of the unknown capacitor is made to be very small so as to quickly
dissipate energy and discharge the capacitor very first. In the design, a resistance of 220Ω is used
to give a discharging timemax of 0.11sec.
The RESET button is but manually reset the meter. The meter refreshes every 0.5s to eliminate
ghosting. This is shown in the code. A user can manually reset to refresh the meter.
3.1 Principle of operation.
For the project, the impedance is design as shown in the circuit diagram below:
18
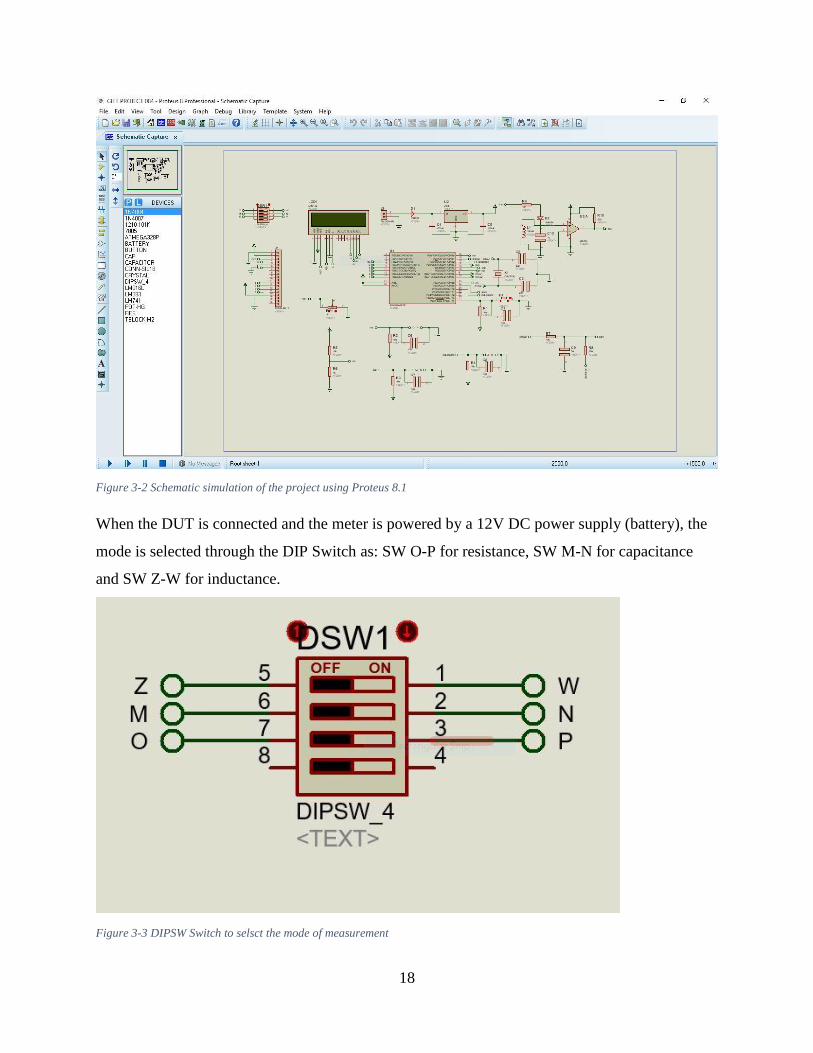
Figure 3-2 Schematic simulation of the project using Proteus 8.1
When the DUT is connected and the meter is powered by a 12V DC power supply (battery), the
mode is selected through the DIP Switch as: SW O-P for resistance, SW M-N for capacitance
and SW Z-W for inductance.
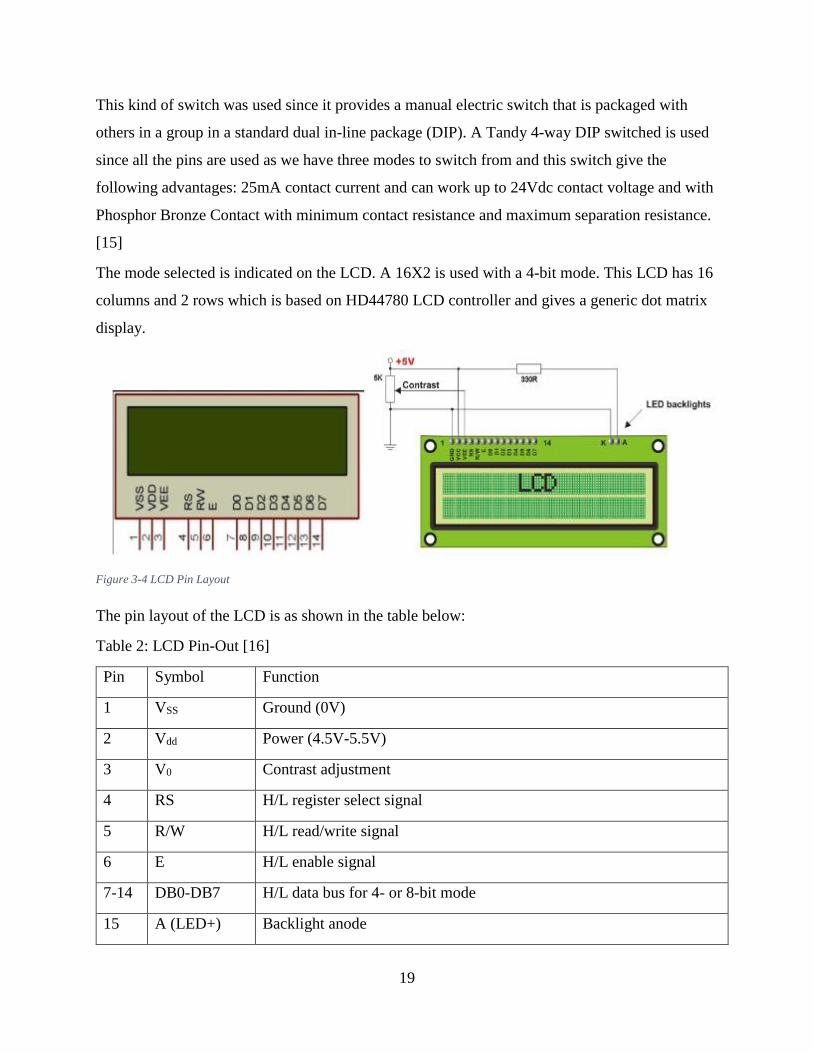
Figure 3-3 DIPSW Switch to selsct the mode of measurement
19
This kind of switch was used since it provides a manual electric switch that is packaged with
others in a group in a standard dual in-line package (DIP). A Tandy 4-way DIP switched is used
since all the pins are used as we have three modes to switch from and this switch give the
following advantages: 25mA contact current and can work up to 24Vdc contact voltage and with
Phosphor Bronze Contact with minimum contact resistance and maximum separation resistance.
[15]
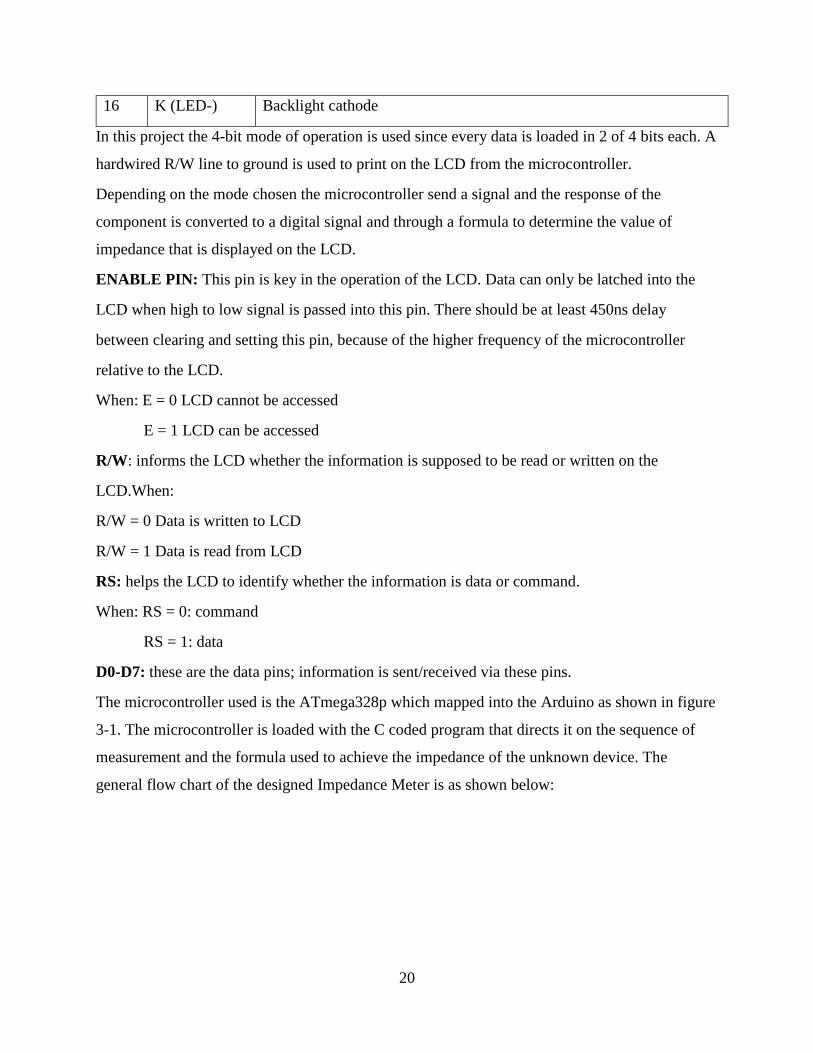
The mode selected is indicated on the LCD. A 16X2 is used with a 4-bit mode. This LCD has 16
columns and 2 rows which is based on HD44780 LCD controller and gives a generic dot matrix
display.
Figure 3-4 LCD Pin Layout
The pin layout of the LCD is as shown in the table below:
Table 2: LCD Pin-Out [16]
Pin Symbol Function
1 VSS Ground (0V)
2 Vdd Power (4.5V-5.5V)
3 V0 Contrast adjustment
4 RS H/L register select signal
5 R/W H/L read/write signal
6 E H/L enable signal
7-14 DB0-DB7 H/L data bus for 4- or 8-bit mode
15 A (LED+) Backlight anode
20
16 K (LED-) Backlight cathode
In this project the 4-bit mode of operation is used since every data is loaded in 2 of 4 bits each. A
hardwired R/W line to ground is used to print on the LCD from the microcontroller.
Depending on the mode chosen the microcontroller send a signal and the response of the
component is converted to a digital signal and through a formula to determine the value of
impedance that is displayed on the LCD.
ENABLE PIN: This pin is key in the operation of the LCD. Data can only be latched into the
LCD when high to low signal is passed into this pin. There should be at least 450ns delay
between clearing and setting this pin, because of the higher frequency of the microcontroller
relative to the LCD.
When: E = 0 LCD cannot be accessed
E = 1 LCD can be accessed
R/W: informs the LCD whether the information is supposed to be read or written on the
LCD.When:
R/W = 0 Data is written to LCD
R/W = 1 Data is read from LCD
RS: helps the LCD to identify whether the information is data or command.
When: RS = 0: command
RS = 1: data
D0-D7: these are the data pins; information is sent/received via these pins.
The microcontroller used is the ATmega328p which mapped into the Arduino as shown in figure
3-1. The microcontroller is loaded with the C coded program that directs it on the sequence of
measurement and the formula used to achieve the impedance of the unknown device. The
general flow chart of the designed Impedance Meter is as shown below:
21
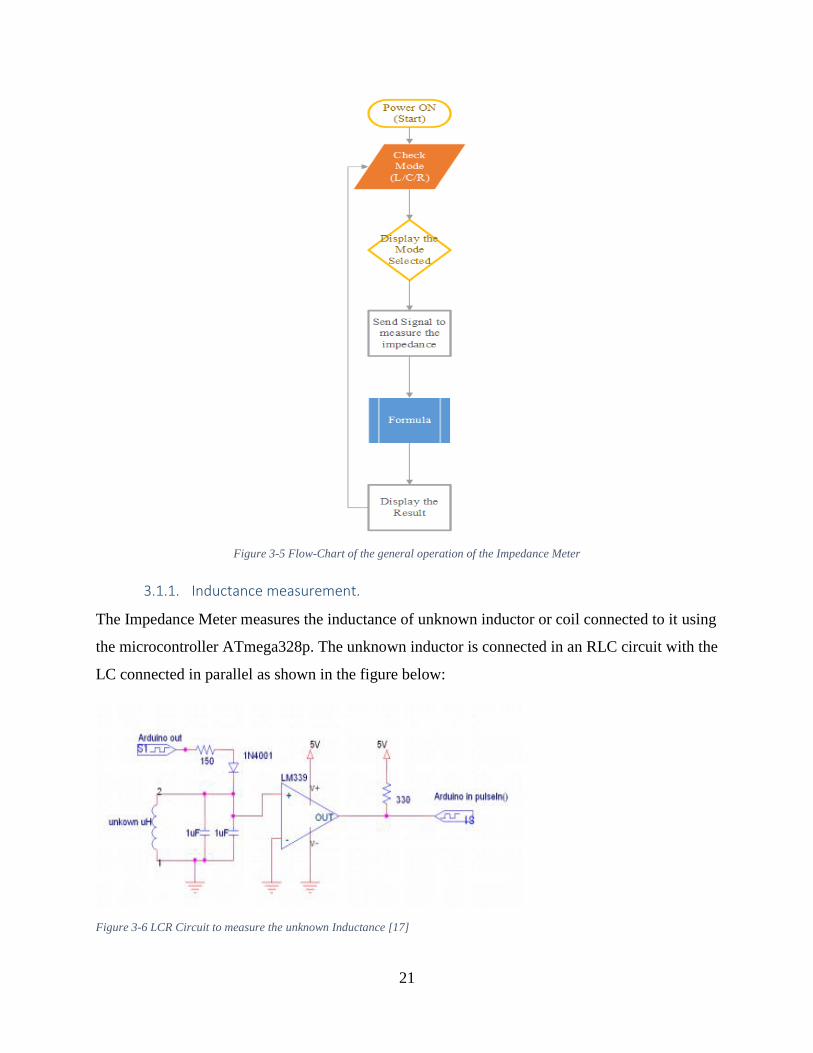
Figure 3-5 Flow-Chart of the general operation of the Impedance Meter
3.1.1. Inductance measurement.
The Impedance Meter measures the inductance of unknown inductor or coil connected to it using
the microcontroller ATmega328p. The unknown inductor is connected in an RLC circuit with the
LC connected in parallel as shown in the figure below:
Figure 3-6 LCR Circuit to measure the unknown Inductance [17]
22
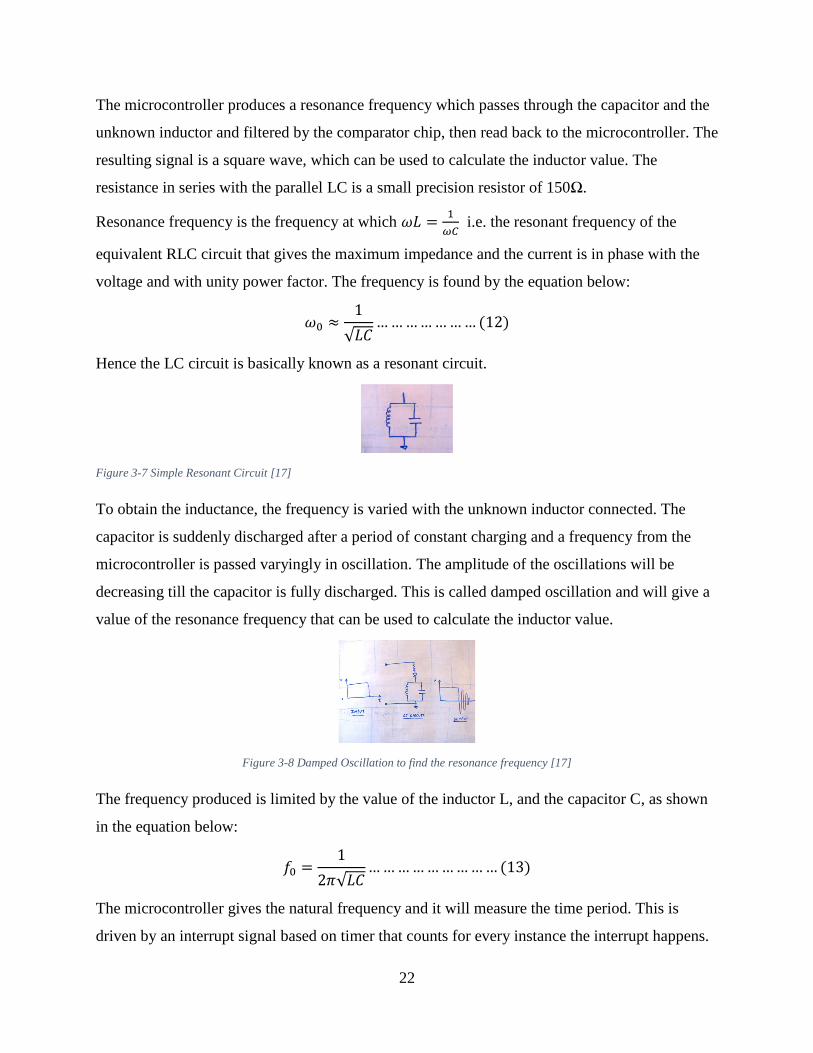
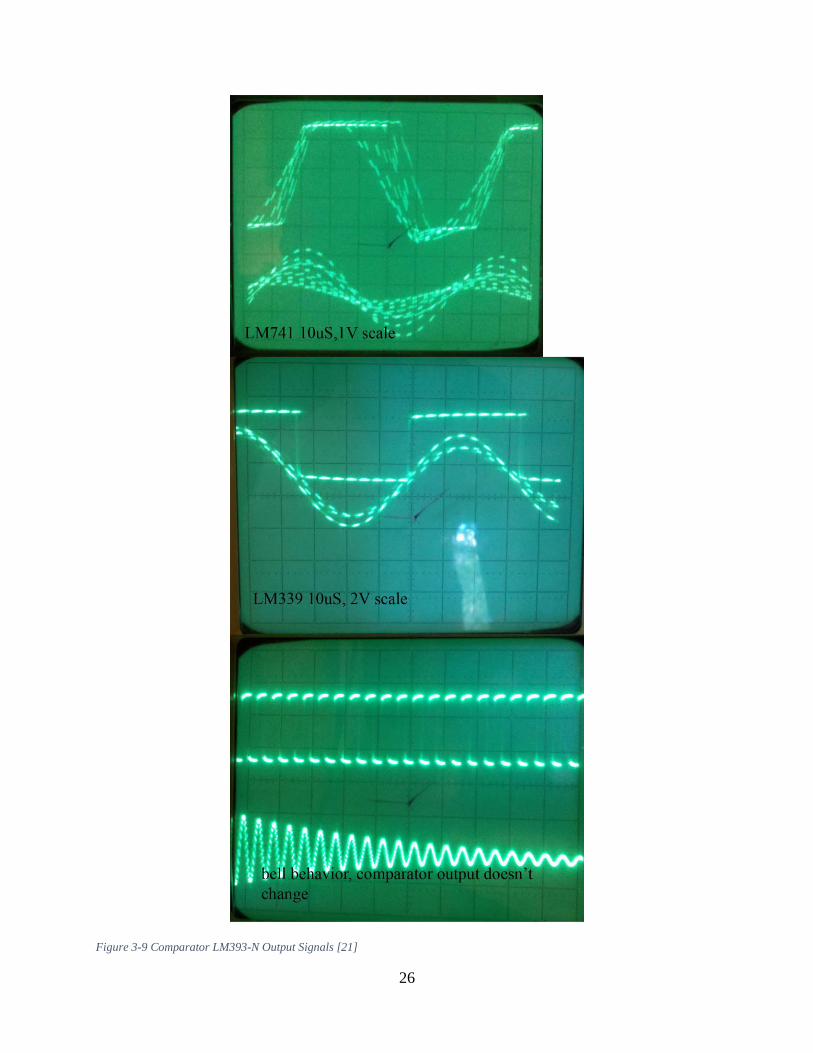
The microcontroller produces a resonance frequency which passes through the capacitor and the
unknown inductor and filtered by the comparator chip, then read back to the microcontroller. The
resulting signal is a square wave, which can be used to calculate the inductor value. The
resistance in series with the parallel LC is a small precision resistor of 150Ω.
Resonance frequency is the frequency at which 𝜔𝐿 =1
𝜔𝐶 i.e. the resonant frequency of the
equivalent RLC circuit that gives the maximum impedance and the current is in phase with the
voltage and with unity power factor. The frequency is found by the equation below:
𝜔0 ≈1
√𝐿𝐶… … … … … … … (12)
Hence the LC circuit is basically known as a resonant circuit.
Figure 3-7 Simple Resonant Circuit [17]
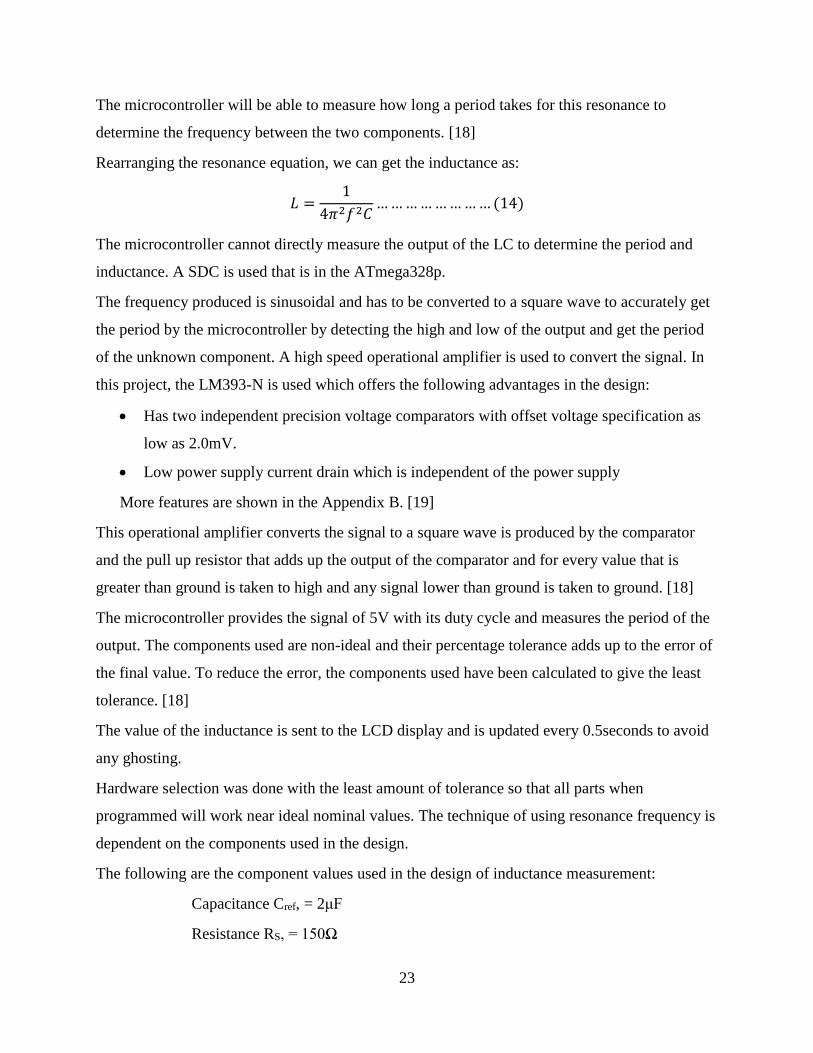
To obtain the inductance, the frequency is varied with the unknown inductor connected. The
capacitor is suddenly discharged after a period of constant charging and a frequency from the
microcontroller is passed varyingly in oscillation. The amplitude of the oscillations will be
decreasing till the capacitor is fully discharged. This is called damped oscillation and will give a
value of the resonance frequency that can be used to calculate the inductor value.
Figure 3-8 Damped Oscillation to find the resonance frequency [17]
The frequency produced is limited by the value of the inductor L, and the capacitor C, as shown
in the equation below:
𝑓0 =1
2𝜋√𝐿𝐶… … … … … … … … … (13)
The microcontroller gives the natural frequency and it will measure the time period. This is
driven by an interrupt signal based on timer that counts for every instance the interrupt happens.
23
The microcontroller will be able to measure how long a period takes for this resonance to
determine the frequency between the two components. [18]
Rearranging the resonance equation, we can get the inductance as:
𝐿 =1
4𝜋2𝑓2𝐶… … … … … … … … (14)
The microcontroller cannot directly measure the output of the LC to determine the period and
inductance. A SDC is used that is in the ATmega328p.
The frequency produced is sinusoidal and has to be converted to a square wave to accurately get
the period by the microcontroller by detecting the high and low of the output and get the period
of the unknown component. A high speed operational amplifier is used to convert the signal. In
this project, the LM393-N is used which offers the following advantages in the design:
Has two independent precision voltage comparators with offset voltage specification as
low as 2.0mV.
Low power supply current drain which is independent of the power supply
More features are shown in the Appendix B. [19]
This operational amplifier converts the signal to a square wave is produced by the comparator
and the pull up resistor that adds up the output of the comparator and for every value that is
greater than ground is taken to high and any signal lower than ground is taken to ground. [18]
The microcontroller provides the signal of 5V with its duty cycle and measures the period of the
output. The components used are non-ideal and their percentage tolerance adds up to the error of
the final value. To reduce the error, the components used have been calculated to give the least
tolerance. [18]
The value of the inductance is sent to the LCD display and is updated every 0.5seconds to avoid
any ghosting.
Hardware selection was done with the least amount of tolerance so that all parts when
programmed will work near ideal nominal values. The technique of using resonance frequency is
dependent on the components used in the design.
The following are the component values used in the design of inductance measurement:
Capacitance Cref, = 2μF
Resistance RS, = 150Ω
24
For the code to measure the inductance the following code instruction was used:
if(pulse > 0.1) //if a timeout did not occur and it took a
reading:
capacitance = 95.E-8; //insert capacitance here. Currently
using 2uF
frequency = 1.E6/(2*pulse);
inductance =
1./(capacitance*frequency*frequency*4.*3.14159*3.14159);//t
his is the rearrangement of the resonance frequency
equation as shown in equation (14)
inductance *= 1E6; //note that this is the same as saying
inductance = inductance*1E6
The Rs used is also a dissipating resistor of the oscillating energy.
The ATmega328p is able to sample analog signals of up to 9600Hz or 1ms. The resulting
frequency from the oscillations made by the RLC circuit in the measurement of inductance is
much higher than 9600Hz. To translate this high frequency signal to the inductor for
measurement we use the LM393 comparator which gets the highest positive voltage signal than
the inverting input. The high gain of the op-amp causes the output to saturate at the highest
positive voltage can output.
The comparator is limited by the supply signal.
After the microcontroller gives a pulse signal to the LCR circuit, an oscillation starts which
makes the LM393-N a floating gate and to stop this a pull-up resistor is used. The comparator
has a very high capacitance and impedance hence a small pull-up resistance of 330Ω is enough.
When the signal to the non-inverting pin is lower than the inverting pin the comparator will pull-
up the output to ground (0).
The LC produces a sinusoidal wave which is converted to a square wave by the comparator and
the highest frequency which is the resonating frequency is picked. From the code:
pulseIn(pin,HIGH,500);
the output is measured in microseconds from the rising edge to the falling edge. This time is
doubled to give the full period since it is from a sinusoidal wave as shown in figure 3-8 below.
25
The resonance frequency is now;
𝑓 =1
2 × 𝑝𝑢𝑙𝑠𝑒𝐼𝑛… … … … … … … . . (15)
The presence of internal resistance makes the resonance amplitude die out. To get to this
resonance frequency quickly enough as first as the highest peak is achieved a low value
resistance is used with least tolerance (almost ideal) is used. In this design the 150Ω with 5%
tolerance is used.
26
Figure 3-9 Comparator LM393-N Output Signals [21]
27
3.1.2. Capacitance Measurement.
Capacitance of a device can be found by the manipulation of its properties. The aim is to have a
standardized measurement that is also ease to read the value on a LCD. In this project, the basic
principle is to charge and discharge of the capacitor is adopted through the use of a
microcontroller.
The capacitor, C, charges as the voltage rises exponentially through a resistor, R. the capacitor is
driven to high at its output once the voltage in the capacitor reaches the maximum value hence
the capacitor is fully charged. The amount of time taken to charge the capacitor is taken to the
microcontroller. The time taken to charge the capacitor is directly proportional to the capacitance
of the device under test.
This is given by:
𝜏 = 𝐶𝑅 … … … … … … . (15)
Where τ is the time constant in second the is equivalent to 63.2% of the supply voltage. The time
taken to fully charge a capacitor is 5τ. Rearranging equation (15) will give the capacitance of
DUT;
𝐶 =𝜏
𝑅… … … … … … … . . (16)
𝐶 =1.442 × 𝜕𝑡
𝑅… … … … … … . . (17)
Where C is the unknown capacitance to be determined.
R is the reference resistance that is known and determines the accuracy and the
range of the meter since it affects the charging time.
δt is the difference in the time between charging and discharging of the capacitor.
During the measurement procedure, the capacitor is fully discharged prior to charging where a
counter from the microcontroller is initiated. The reference resistor is known and fixed for a
particular range. The counter starts charging and the comparators compares the capacitor voltage
VC to the 63.2% of the supply voltage which is equivalent to 3.16V. Total time that is counted
which should be less than 1023 is recorded and the counter will give the time is second. Equation
(16) is used to calculate the capacitance. If the time is longer than 1023 bits, then the capacitor is
out of range and the meter will send an error message. To improve the range, the reference
inductor is changed. For sensitivity and accuracy for this project, Rref is 220Ω.
28
The process of charging and discharging is done repeatedly and an average is found to get a
precise reading.
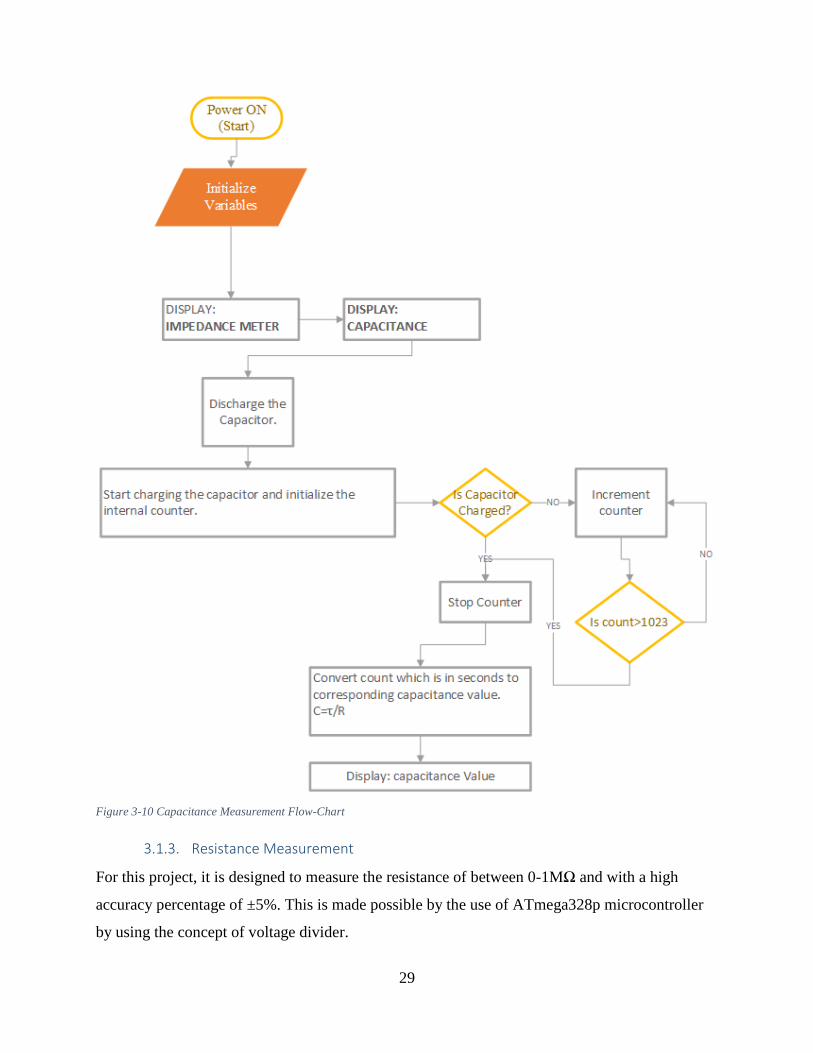
The algorithm for capacitance meter is as given below:
Set discharge pin to INPUT so that the discharged capacitor is not discharged further.
Record the start time t0 which is initially 0.
Set charge pin to OUTPUT and make it HIGH.
Check the voltage repeatedly in a loop until it gets to 63.2% of the total voltage.
After the capacitor is charged the counter time t1, is recorded and subtracted from the
starting time to get the charging time τ.
Divide the time in seconds by the charging resistance in ohms to find the capacitance.
Report the value with serial print.
Discharge the capacitor by setting the charge pin to input and the discharge pin to output
and make it low and read the voltage to make sure that the capacitor is fully discharged.
[20]
29
Figure 3-10 Capacitance Measurement Flow-Chart
3.1.3. Resistance Measurement
For this project, it is designed to measure the resistance of between 0-1MΩ and with a high
accuracy percentage of ±5%. This is made possible by the use of ATmega328p microcontroller
by using the concept of voltage divider.
30
The microcontrollers are good at directly working with voltages in the range 0V to 5V. This
technique of voltage divider works with lower values of the reference resistance. The maximum
supply voltage is 5V from the microcontroller. The voltage divider equation is given by:
𝑉𝑜𝑢𝑡 = (𝑅𝑢𝑛𝑘𝑛𝑜𝑤𝑛
𝑅𝑟𝑒𝑓 + 𝑅𝑢𝑛𝑘𝑛𝑜𝑤𝑛) 𝑉𝑖𝑛 … … … … … … (18)
In the design, the Rref is connected to pull up to the 5V of the supply source and resistance we
want to measure is connected with the ground and the other terminal of Rref. The voltage drop
across the unknown resistance is determined with the help of the microcontroller. The value of
VCC or Vin is 5V and Rref is 10KΩ. Runknown can be calculated by the formula:
𝑅𝑢𝑛𝑘𝑛𝑜𝑤𝑛 =𝑅𝑟𝑒𝑓 × 𝑉𝑜𝑢𝑡
5 − 𝑉𝑜𝑢𝑡… … … … … … … . (19)
𝑅𝑢𝑛𝑘𝑛𝑜𝑤𝑛 =10000 × 𝑉𝑜𝑢𝑡
5 − 𝑉𝑜𝑢𝑡… … … … … . . (20)
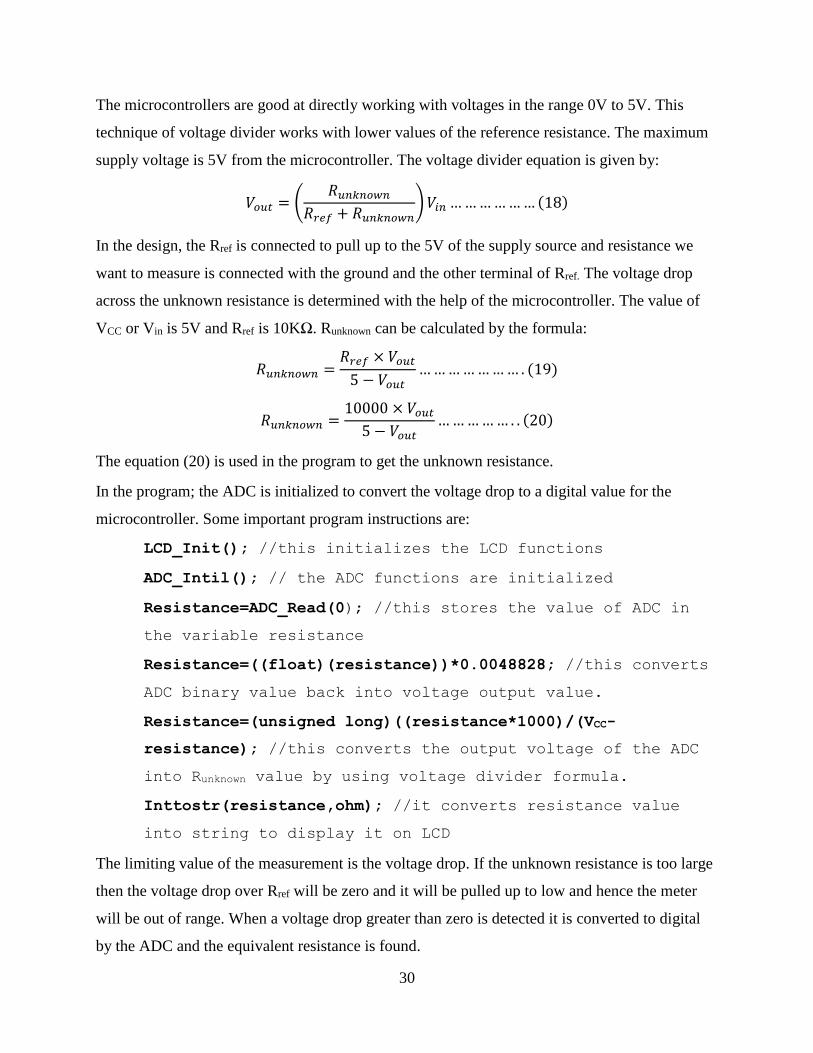
The equation (20) is used in the program to get the unknown resistance.
In the program; the ADC is initialized to convert the voltage drop to a digital value for the
microcontroller. Some important program instructions are:
LCD_Init(); //this initializes the LCD functions
ADC_Intil(); // the ADC functions are initialized
Resistance=ADC_Read(0); //this stores the value of ADC in
the variable resistance
Resistance=((float)(resistance))*0.0048828; //this converts
ADC binary value back into voltage output value.
Resistance=(unsigned long)((resistance*1000)/(VCC-
resistance); //this converts the output voltage of the ADC
into Runknown value by using voltage divider formula.
Inttostr(resistance,ohm); //it converts resistance value
into string to display it on LCD
The limiting value of the measurement is the voltage drop. If the unknown resistance is too large
then the voltage drop over Rref will be zero and it will be pulled up to low and hence the meter
will be out of range. When a voltage drop greater than zero is detected it is converted to digital
by the ADC and the equivalent resistance is found.
31
Figure 3-11 Resistance Measurement Flow-Chart
Meter Range.
The designed is limited to a specific range that will be with minion error. Above these ranges the
meter will exhibit large error and/or not measure the impedance of the unknown component.
32
Capacitance Range:
For capacitance the time constant and the reference resistance limit the range.
Rref is 10KΩ
The ATmega328p is a 10-bit microcontroller hence there are 1024 counts all together. The
minimum count is 1 and a maximum of 1024.
This gives the range of:
0.1μF to 100μF
Inductance Range:
The inductance to be measured is affected by the impulse generated by the microcontroller and
the reference capacitor; Cref. (2.2μF)
The range is:
1μH to 100μH
Resistance Range:
The resistance measured is limited by the voltage from the voltage divider. Very low voltage
(~0V) will be the maximum resistance and this is theoretically all resistances. This is limited by
the Rref which will give a constant voltage no matter change of resistance value. The point where
the voltage barely changes hence introducing large errors is the maximum for the meter.
The range is hence:
1Ω to 49kΩ
Component Layouts.
33
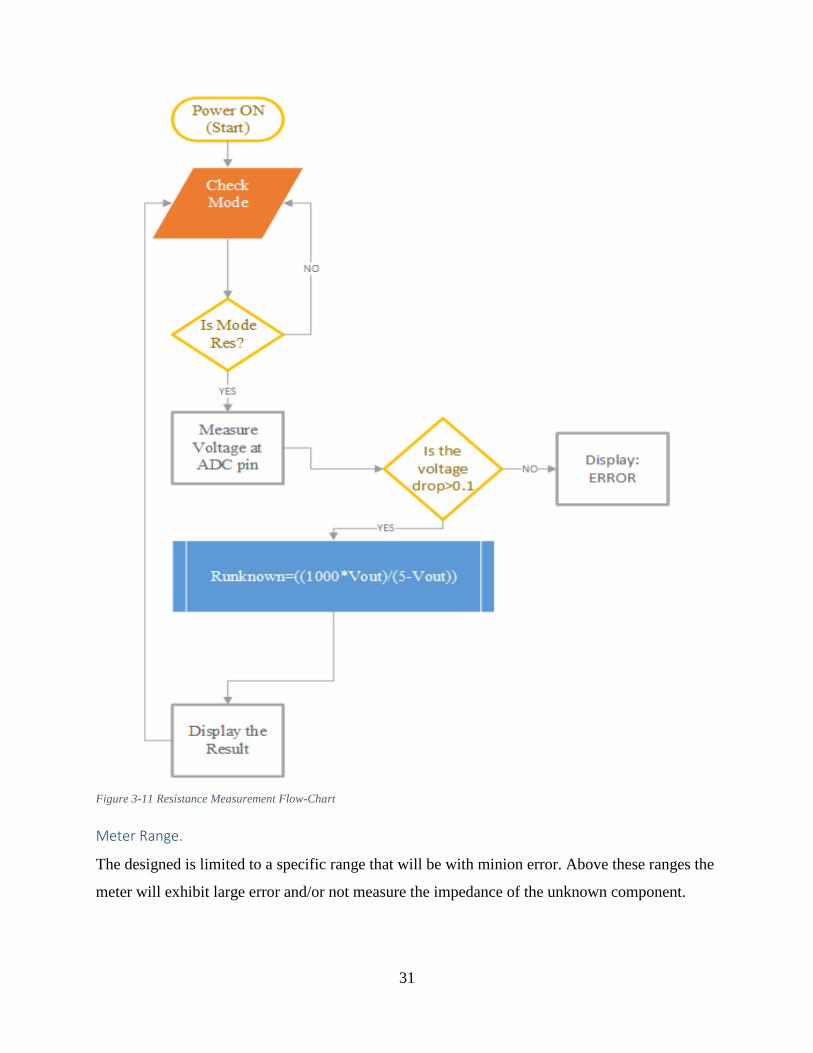
Figure 3-12 Power Supply Battery
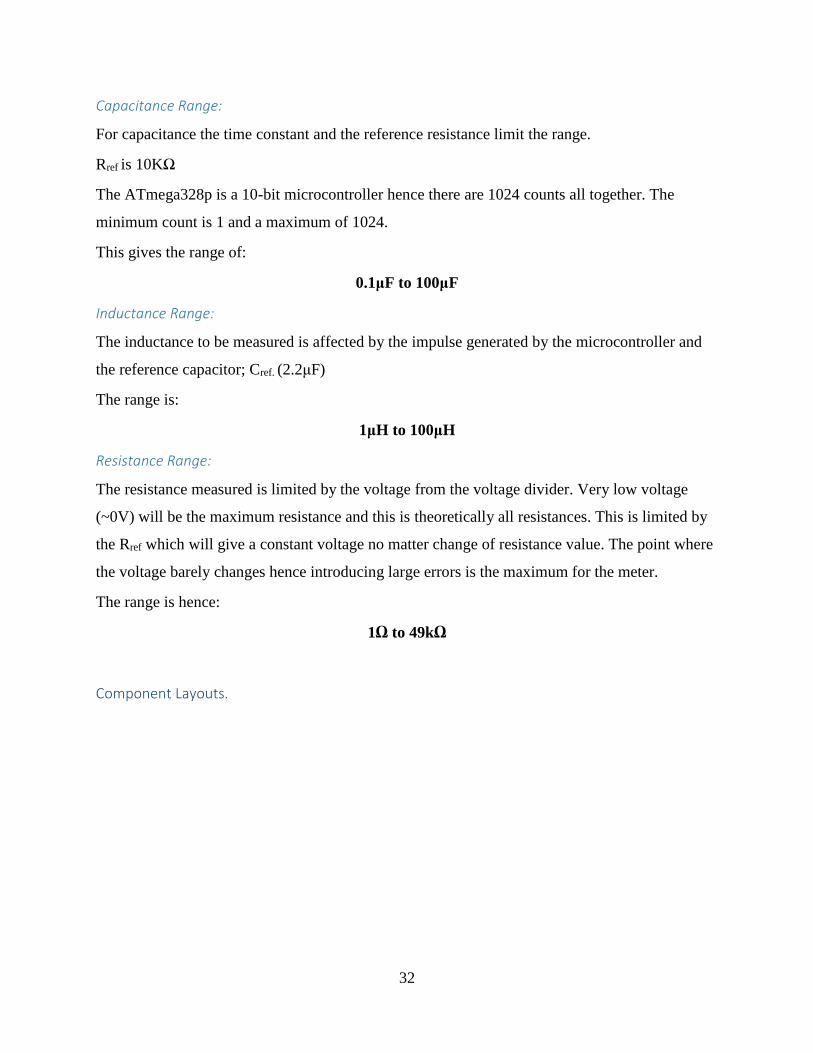
Figure 3-13 Full fabrication of the Impedance Meter
34
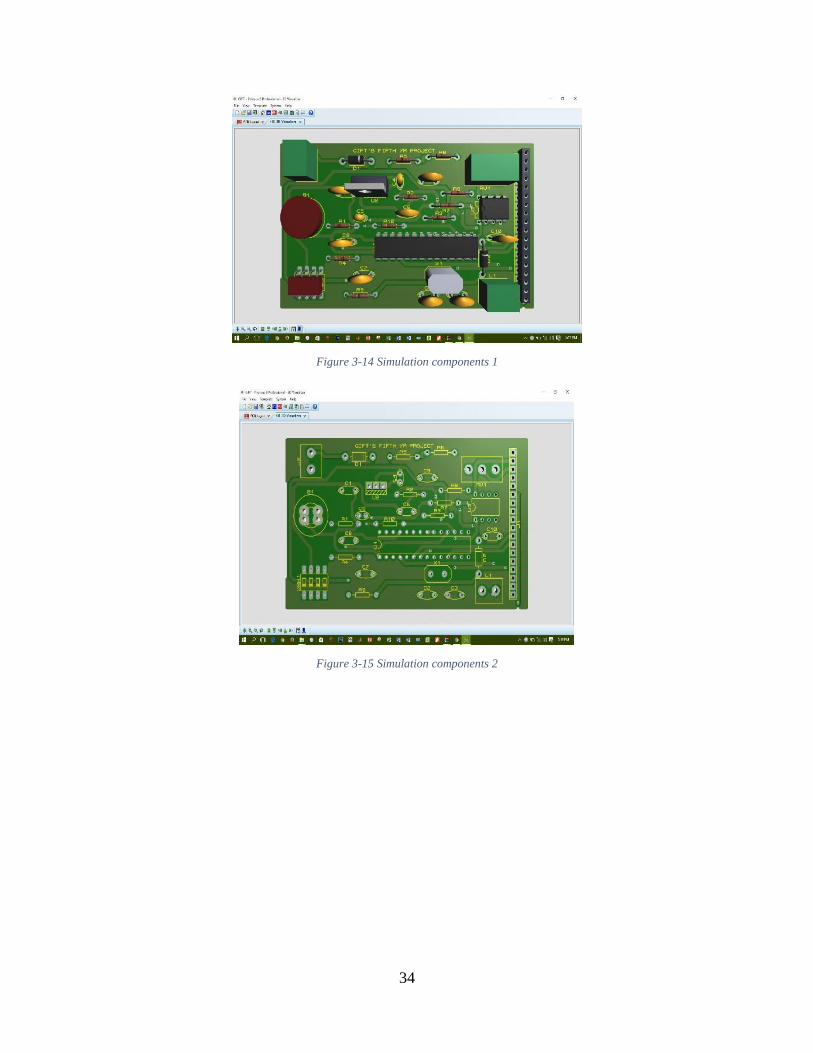
Figure 3-14 Simulation components 1
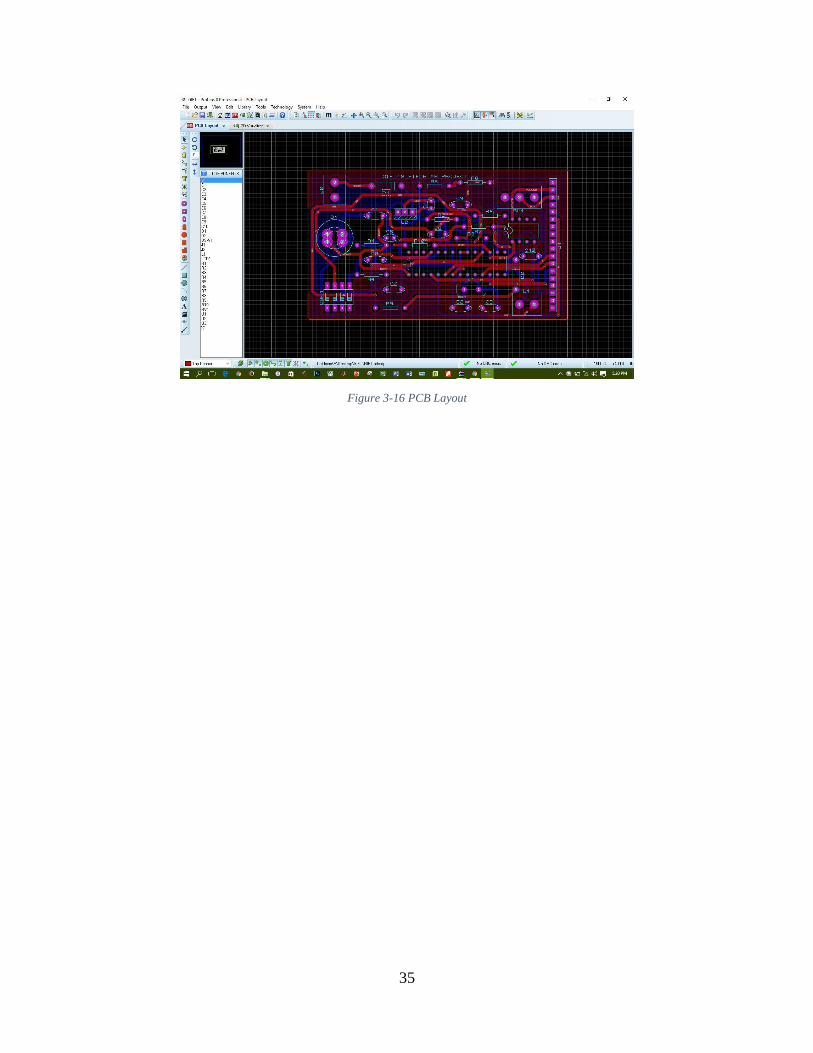
Figure 3-15 Simulation components 2
35
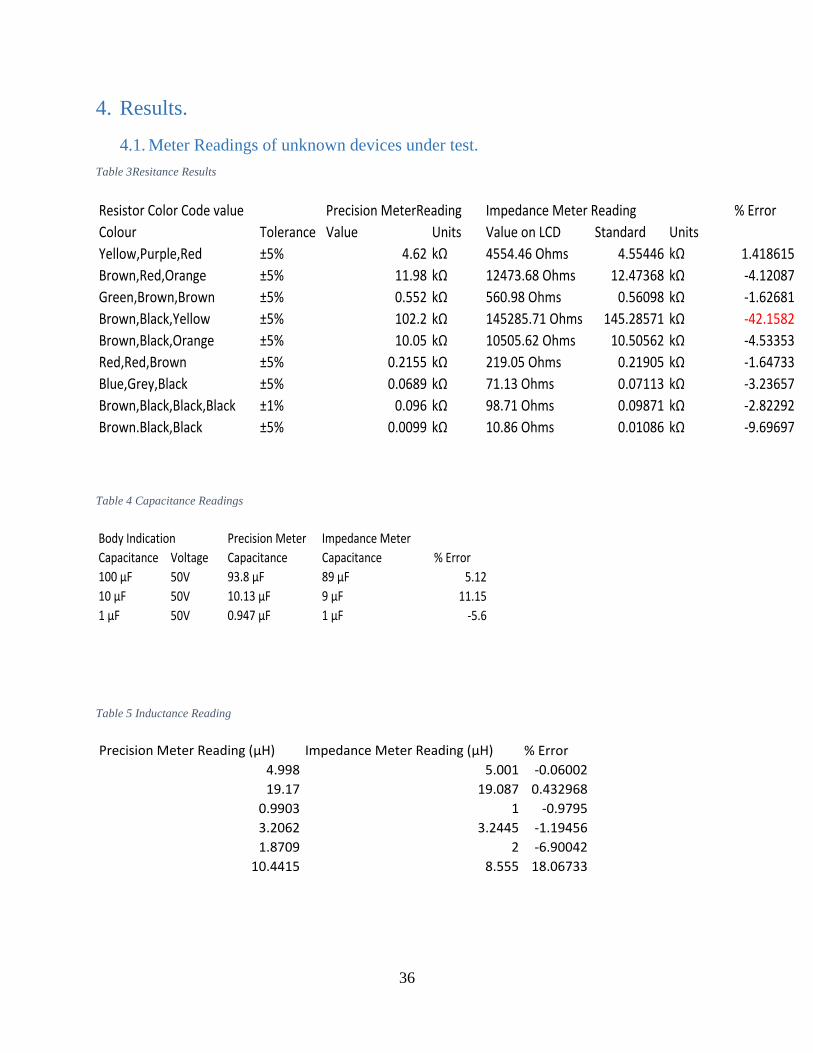
Figure 3-16 PCB Layout
36
4. Results.
4.1. Meter Readings of unknown devices under test.
Table 3Resitance Results
% Error
Colour Tolerance Value Units Value on LCD Standard Units
Yellow,Purple,Red ±5% 4.62 kΩ 4554.46 Ohms 4.55446 kΩ 1.418615
Brown,Red,Orange ±5% 11.98 kΩ 12473.68 Ohms 12.47368 kΩ -4.12087
Green,Brown,Brown ±5% 0.552 kΩ 560.98 Ohms 0.56098 kΩ -1.62681
Brown,Black,Yellow ±5% 102.2 kΩ 145285.71 Ohms 145.28571 kΩ -42.1582
Brown,Black,Orange ±5% 10.05 kΩ 10505.62 Ohms 10.50562 kΩ -4.53353
Red,Red,Brown ±5% 0.2155 kΩ 219.05 Ohms 0.21905 kΩ -1.64733
Blue,Grey,Black ±5% 0.0689 kΩ 71.13 Ohms 0.07113 kΩ -3.23657
Brown,Black,Black,Black ±1% 0.096 kΩ 98.71 Ohms 0.09871 kΩ -2.82292
Brown.Black,Black ±5% 0.0099 kΩ 10.86 Ohms 0.01086 kΩ -9.69697
Resistor Color Code value Precision MeterReading Impedance Meter Reading
Table 4 Capacitance Readings
Precision Meter Impedance Meter
Capacitance Voltage Capacitance Capacitance % Error
100 μF 50V 93.8 μF 89 μF 5.12
10 μF 50V 10.13 μF 9 μF 11.15
1 μF 50V 0.947 μF 1 μF -5.6
Body Indication
Table 5 Inductance Reading
Precision Meter Reading (μH) Impedance Meter Reading (μH) % Error
4.998 5.001 -0.06002
19.17 19.087 0.432968
0.9903 1 -0.9795
3.2062 3.2445 -1.19456
1.8709 2 -6.90042
10.4415 8.555 18.06733
37
The reading for the resistance where taken using:
ISO-TECH IDM 103N
S/N: 35100417
Lab No.: AW 112
The inductance readings were taken using:
LCR – 8101G – Precision LCRM
GWINSTEK
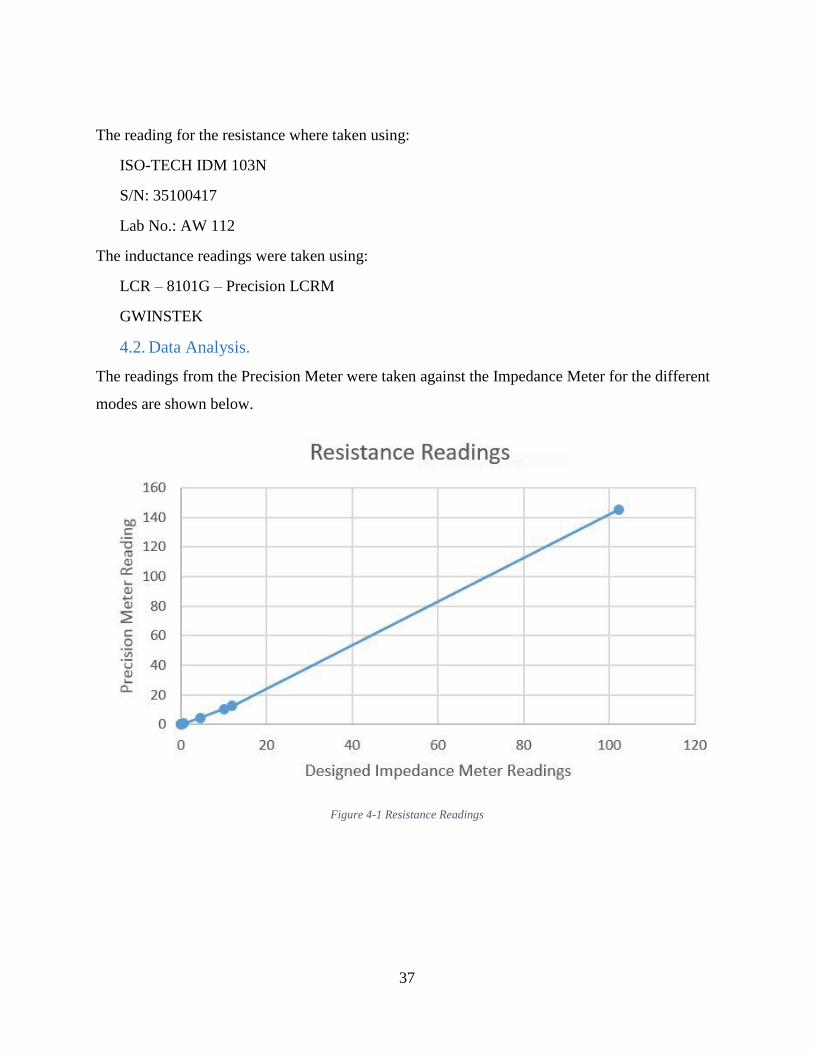
4.2. Data Analysis.
The readings from the Precision Meter were taken against the Impedance Meter for the different
modes are shown below.
Figure 4-1 Resistance Readings
38
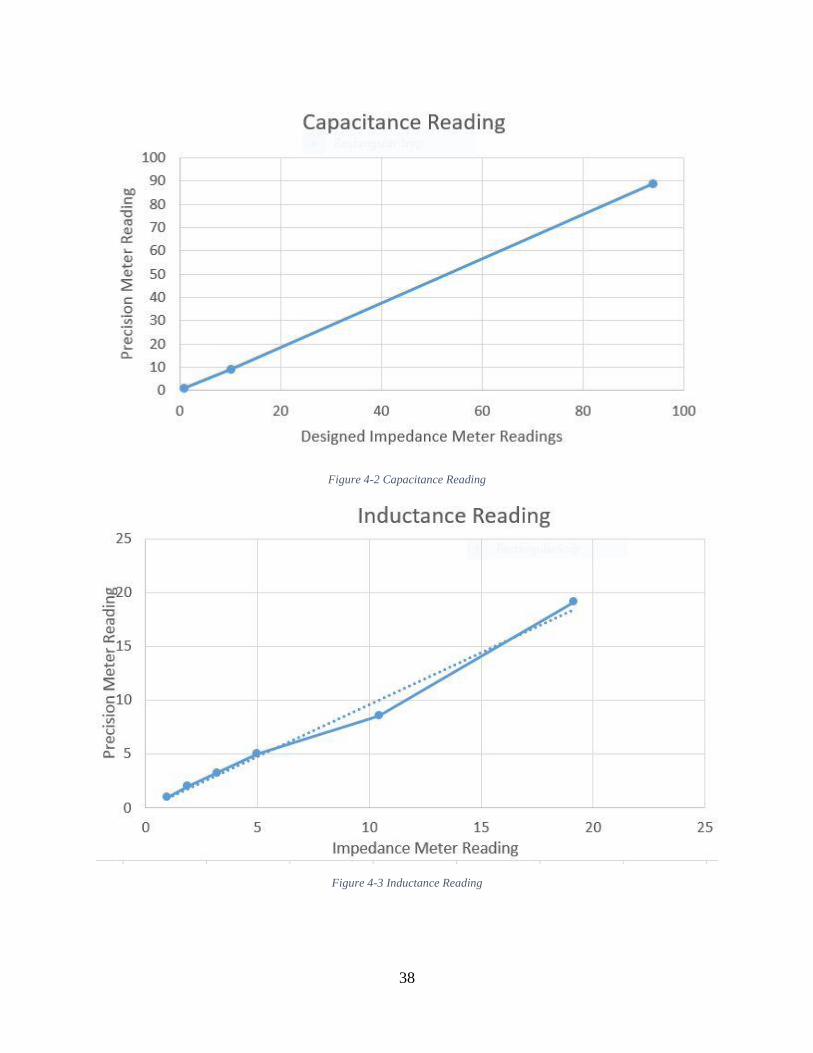
Figure 4-2 Capacitance Reading
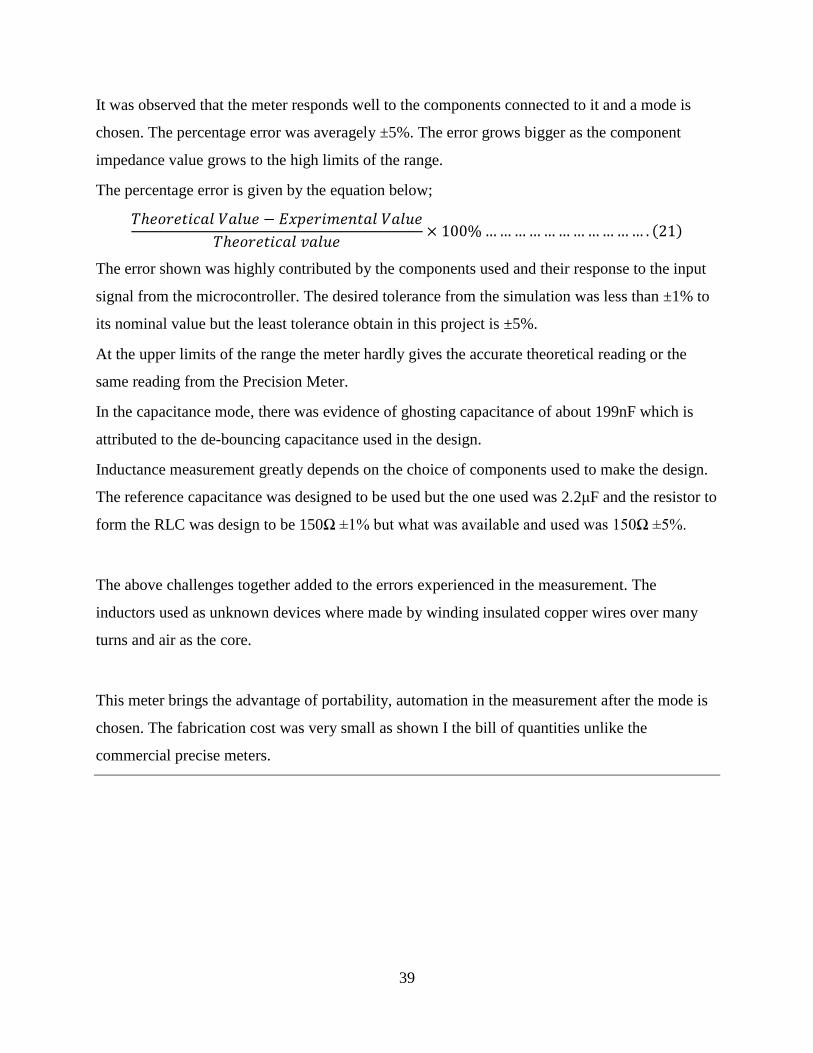
Figure 4-3 Inductance Reading
39
It was observed that the meter responds well to the components connected to it and a mode is
chosen. The percentage error was averagely ±5%. The error grows bigger as the component
impedance value grows to the high limits of the range.
The percentage error is given by the equation below;
𝑇ℎ𝑒𝑜𝑟𝑒𝑡𝑖𝑐𝑎𝑙 𝑉𝑎𝑙𝑢𝑒 − 𝐸𝑥𝑝𝑒𝑟𝑖𝑚𝑒𝑛𝑡𝑎𝑙 𝑉𝑎𝑙𝑢𝑒
𝑇ℎ𝑒𝑜𝑟𝑒𝑡𝑖𝑐𝑎𝑙 𝑣𝑎𝑙𝑢𝑒× 100% … … … … … … … … … … … . (21)
The error shown was highly contributed by the components used and their response to the input
signal from the microcontroller. The desired tolerance from the simulation was less than ±1% to
its nominal value but the least tolerance obtain in this project is ±5%.
At the upper limits of the range the meter hardly gives the accurate theoretical reading or the
same reading from the Precision Meter.
In the capacitance mode, there was evidence of ghosting capacitance of about 199nF which is
attributed to the de-bouncing capacitance used in the design.
Inductance measurement greatly depends on the choice of components used to make the design.
The reference capacitance was designed to be used but the one used was 2.2μF and the resistor to
form the RLC was design to be 150Ω ±1% but what was available and used was 150Ω ±5%.
The above challenges together added to the errors experienced in the measurement. The
inductors used as unknown devices where made by winding insulated copper wires over many
turns and air as the core.
This meter brings the advantage of portability, automation in the measurement after the mode is
chosen. The fabrication cost was very small as shown I the bill of quantities unlike the
commercial precise meters.
40
5. Conclusion and Recommendation.
The main objective of this project has been to design a microcontroller based impedance meter to
measure Inductance, Capacitance and Resistance.
The objective was achieved as the meter works and can read the three components within the
limits when the mode is selected and the unknown component is connected. The microcontroller
will send a signal and measure the response of the components which is converted to a digital
form and analyzed using programmed formulae in the microcontroller to give the impedance
value. The result is sent to the LCD to be displayed.
The Impedance Meter, if put in use can serve the purpose of measuring impedance with greater
advantage with the conversional large, expensive meters. This portable, cheap and small meter
can be used to measure laboratory components and can be nicely carried around when properly
packaged and the user interface is very basic for use.
The cost of implementing the system is relatively cheap as the components are few and can be
cheaply found in the local market.
In circuit design the accurate value of the component is very important and it is then essential to
have an accurate meter to measure the components used. This meter offers this solution to the
user.
5.1. Limitation and future recommendations.
The demand for accurate, portable and cheaply available impedance meters is increasing with the
increase in technology as more designs are being made and the need for precise component
values is very important in the implementation.
Based on the work done in this project, the future Impedance Meter may demand some
improvements among them are:
1. The process of measuring impedance is very sensitive to the selection of components and
their tolerance because the microcontroller gives very small digital signals and
determines the impedance from the response of these components to this signal.
Therefore, the component used should strictly be of very low tolerance that will give the
expected readings.
41
2. The range in the project was very small and limited as the meter gives large errors at the
upper limits. This can be improved by having an auto-range selection or a manual knob
selection. The inductor time out can be increased to 10,000 ms and the delay-
microseconds to be have a value less than 500μS and a selector to change the reference
capacitance value.
3. Instead of manually selecting the mode, the meter should automatically select a mode and
give its impedance value.
4. More features can be increased in the meter to improve its functionality, namely:
a. Data hold to hold the measured value on the screen.
b. Continuity setting with a buzzer to quickly test continuity.
c. Live raw data sent over RS-232 serial port to a computer for analysis.
d. Low batter inductor.
42
References.
[1] All About Circuits, “Kelvin (4-Wire) Resistance Measurement” Chapter 8 – DC Metering
Circuits, www.allaboutcircuits.com , 29th April, 2016.
[2] “Ohm’s Law”, www.physics.uoguelph.ca , 29th April, 2016.
[3] “Introduction to Capacitors”, www.electronics-tutorial.ws , 29th April, 2016.
[4] “Measuring Capacitance and ESR”, www.meetchniek.info , 29th April, 2016.
[5] “Inductors”, www.electronics-tutorial.ws, 29th April, 2016.
[6] Gabe A. Cohn, “Digital LCR Meter” EE 91 = Experimental Projects in Electronic
Circuits, California Institute of Technology, 10th December, 2008.
[7] Alfredo Accaftatis, Giovanni Saggio and Franco Giannini, “A real time FFT-based
impedance meter with compensation”, Department of Electronics Engineering,
University of Rome Tor Vergata, 14th January, 2011.
[8] M. Dutta, A. Rakshi and S. N Bhattacharyga, “Study of automatic AC Bridges for
Impedance Measurement”. IEEE Transaction on Instrumentation and Measurement 50(5)
(2001)
[9] G. Stebor, “An LMS Impedance Bridge”, QEX September/October, 2005.
[10] Amer Alta Yaseen “A Microcontroller=Based Vector Impedance Meter with
Reduction”, College of Electrical and Electronics Techniques, Foundation of Technical
Education, Iraq.
[11] “LCR Measurement Primer”. IET Labs Inc. 1st Edition, April 2012.
[12] “ATmega328p”, Datasheet, Atmel Corporation, 2011.
[13] “Arduino-Introduction”, www.arduino.cc, 4th May, 2016.
[14] Tandy, “4 Way DIP Switch”, www.tandyonline.co.uk, 4th May,2016.
[15] “16X2 LCD Interfacing”. www.micro-digital.net, 4th May, 2016.
[16] “Inductance”, www.engineeringgarage.com, 4th May, 2016.
[17] David Nguyen, “Microcontroller Based Inductance Meter”, Electrical
Engineering Department, California Polytechnic, State University, Spring 2011 – Fall
2011.
[18] Texas Instruments, “LM393-N (ACTIVE) Low Power Low Offset Voltage Dual
Comparator”, www.ti.com, 26th April, 2016.
43
[19] “Microcontroller Based Capacitance Meter”. International Journal of Computer
application and Engineering Technology, Volume 1, Issue 2, PP 41-48, April 2012.
[20] “Capacitance Meter”, www.arduino.cc, 4th May, 2016.
[21] “Inductance”, www.reibot.org, 11th May, 2016.
44
Appendix.
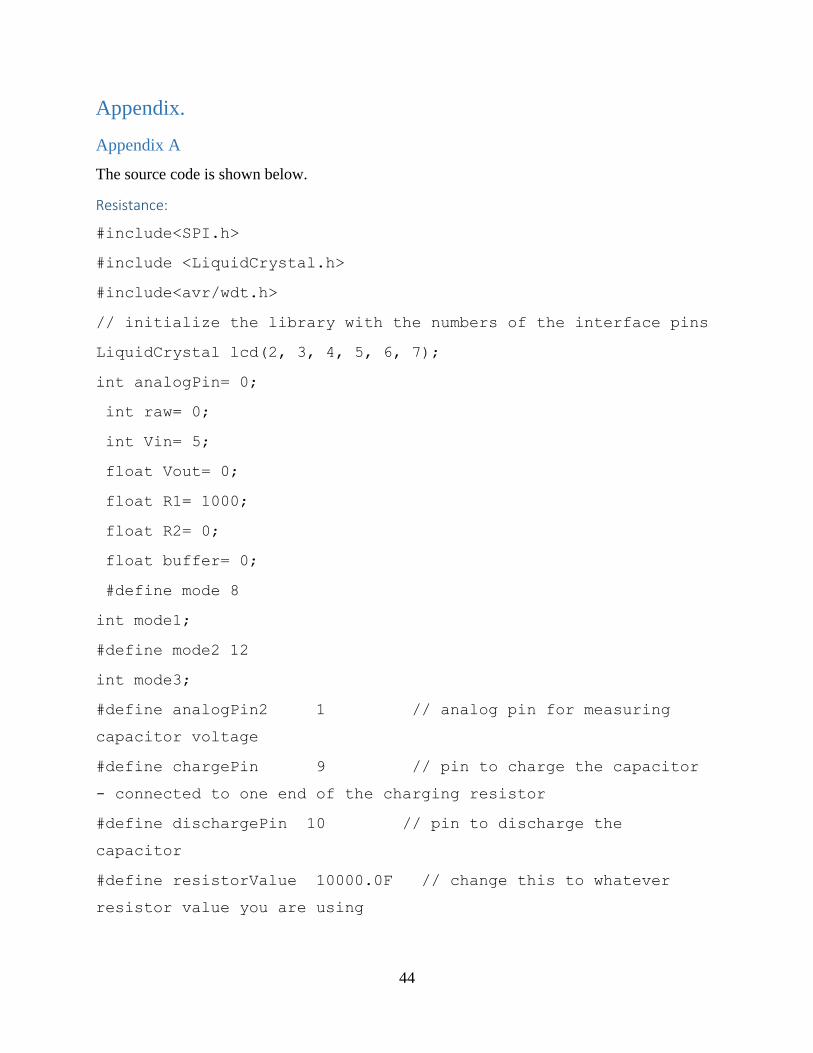
Appendix A
The source code is shown below.
Resistance:
#include<SPI.h>
#include <LiquidCrystal.h>
#include<avr/wdt.h>
// initialize the library with the numbers of the interface pins
LiquidCrystal lcd(2, 3, 4, 5, 6, 7);
int analogPin= 0;
int raw= 0;
int Vin= 5;
float Vout= 0;
float R1= 1000;
float R2= 0;
float buffer= 0;
#define mode 8
int mode1;
#define mode2 12
int mode3;
#define analogPin2 1 // analog pin for measuring
capacitor voltage
#define chargePin 9 // pin to charge the capacitor
- connected to one end of the charging resistor
#define dischargePin 10 // pin to discharge the
capacitor
#define resistorValue 10000.0F // change this to whatever
resistor value you are using
45
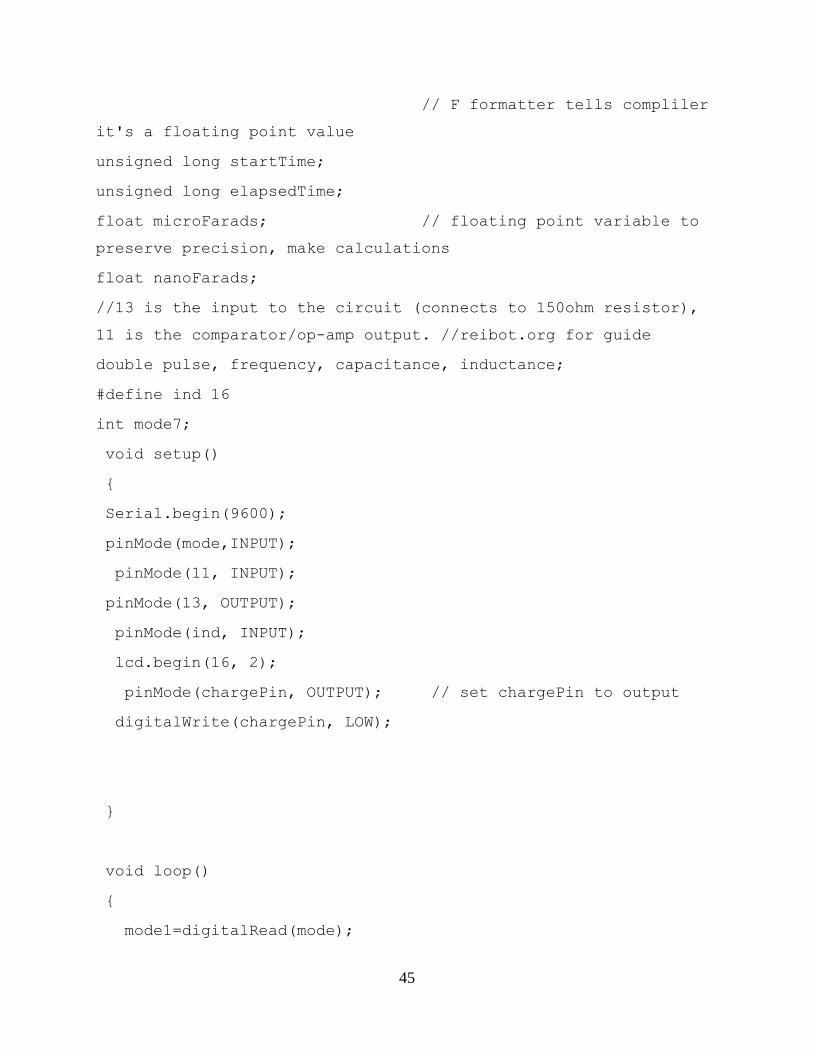
// F formatter tells compliler
it's a floating point value
unsigned long startTime;
unsigned long elapsedTime;
float microFarads; // floating point variable to
preserve precision, make calculations
float nanoFarads;
//13 is the input to the circuit (connects to 150ohm resistor),
11 is the comparator/op-amp output. //reibot.org for guide
double pulse, frequency, capacitance, inductance;
#define ind 16
int mode7;
void setup()
Serial.begin(9600);
pinMode(mode,INPUT);
pinMode(11, INPUT);
pinMode(13, OUTPUT);
pinMode(ind, INPUT);
lcd.begin(16, 2);
pinMode(chargePin, OUTPUT); // set chargePin to output
digitalWrite(chargePin, LOW);
void loop()
mode1=digitalRead(mode);
46
if(mode1==LOW)
lcd.clear();
lcd.print("RESISTANCE");
raw= analogRead(analogPin);
if(raw)
buffer= raw * Vin;
Vout= (buffer)/1024.0;
buffer= (Vin/Vout) -1;
R2= R1 * buffer;
Serial.print("Vout: ");
Serial.println(Vout);
Serial.print("R2: ");
Serial.println(R2);
lcd.setCursor(0, 1);
lcd.print(R2);
lcd.setCursor(9, 1);
lcd.print("OHMS");
delay(500);
softwareReset(WDTO_15MS);
else
mode3=digitalRead(mode2);
if(mode3==LOW)
lcd.clear();
cap();
softwareReset(WDTO_15MS);
47
else
mode7=digitalRead(ind);
if(mode7==LOW)
lcd.clear();
induct();
softwareReset(WDTO_15MS);
else
lcd.print("IMPEDANCE METER");
delay(200);
lcd.clear();
Capacitance:
/* Capacitance Meter using RC_Time Constants
*
* Demonstrates use of RC time constants to measure the value
of a capacitor
*
* Theory: A capcitor will charge, through a resistor, in one
time constant, defined as T seconds where
* TC = R * C
*
* TC = time constant period in seconds
* R = resistance in ohms
* C = capacitance in farads (1 microfarad (ufd) = .0000001
farad = 10^-6 farads )
48
*
* The capacitor's voltage at one time constant is defined as
63.2% of the charging voltage.
*
* Hardware setup:
* Test Capacitor between common point and ground (positive
side of an electrolytic capacitor to common)
* Test Resistor between chargePin and common point
* 220 ohm resistor between dischargePin and common point
* Wire between common point and analogPin (A/D input)
*/
void cap()
digitalWrite(chargePin, HIGH); // set chargePin HIGH and
capacitor charging
startTime = millis();
while(analogRead(analogPin2) < 648) // 647 is 63.2% of
1023, which corresponds to full-scale voltage
elapsedTime= millis() - startTime;
// convert milliseconds to seconds ( 10^-3 ) and Farads to
microFarads ( 10^6 ), net 10^3 (1000)
microFarads = ((float)elapsedTime / resistorValue) * 1000;
Serial.print(elapsedTime); // print the value to serial
port
Serial.print(" mS "); // print units and carriage
return
49
if (microFarads > 1)
Serial.print((long)microFarads); // print the value to
serial port
Serial.println(" microFarads"); // print units and
carriage return
lcd.setCursor(1,0);
lcd.print((long)microFarads); // print the value to
serial port
lcd.setCursor(0,1);
lcd.print(" microFarads"); // print units and carriage
return
else
// if value is smaller than one microFarad, convert to
nanoFarads (10^-9 Farad).
// This is a workaround because Serial.print will not print
floats
nanoFarads = microFarads * 1000.0; // multiply by 1000
to convert to nanoFarads (10^-9 Farads)
Serial.print((long)nanoFarads); // print the value
to serial port
Serial.println(" nanoFarads"); // print units and
carriage return
lcd.setCursor(1,0);
lcd.print((long)nanoFarads);
lcd.setCursor(0,1);
50
lcd.print("nanoFarads");
/* dicharge the capacitor */
digitalWrite(chargePin, LOW); // set charge pin to
LOW
pinMode(dischargePin, OUTPUT); // set discharge pin
to output
digitalWrite(dischargePin, LOW); // set discharge pin
LOW
while(analogRead(analogPin) > 0) // wait until
capacitor is completely discharged
pinMode(dischargePin, INPUT); // set discharge pin
back to input
Inductance;
void induct()
digitalWrite(13, HIGH);
delay(5);//give some time to charge inductor.
digitalWrite(13,LOW);
delayMicroseconds(100); //make sure resination is measured
pulse = pulseIn(11,HIGH,5000);//returns 0 if timeout
51
if(pulse > 0.1) //if a timeout did not occur and it took a
reading:
capacitance = 95.E-8; //insert capacitance here. Currently using
2uF
frequency = 1.E6/(2*pulse);
inductance =
1./(capacitance*frequency*frequency*4.*3.14159*3.14159);//this
is the rearrangement of the resonance frequency equation
inductance *= 1E6; //note that this is the same as saying
inductance = inductance*1E6
if(inductance>=1000)
Serial.print("High for uS:");
Serial.print( pulse );
Serial.print("\tfrequency Hz:");
Serial.print( frequency );
Serial.print("\tinductance mH:"); Serial.println(
inductance/1000 );
lcd.print("Inductance");
lcd.setCursor(2,1);
lcd.print ((inductance/1000)-0.5); lcd.print ("mH" );
delay(300);
lcd.clear();
else
Serial.print("High for uS:");
52
Serial.print( pulse );
Serial.print("\tfrequency Hz:");
Serial.print( frequency );
Serial.print("\tinductance uH:"); Serial.println(inductance);
lcd.print("Inductance");
lcd.setCursor(2,1);
lcd.print (inductance + 10); lcd.print ("uH" );
delay(300);
lcd.clear();
else if(pulse < 0.1)
lcd.print("Insert Inductor");
delay(500);
lcd.clear();
Reset:
void softwareReset(uint8_t prescaller)
wdt_enable(prescaller);
while(1)

53
Appendix B: Data sheets.
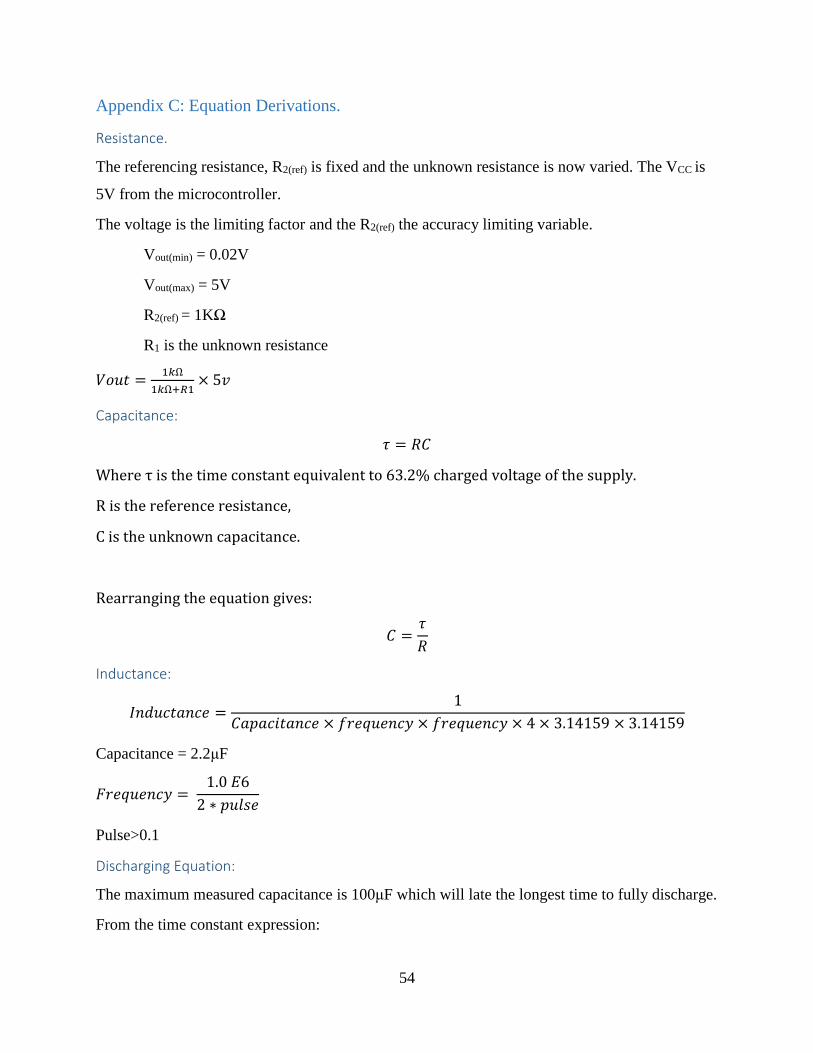
54
Appendix C: Equation Derivations.
Resistance.
The referencing resistance, R2(ref) is fixed and the unknown resistance is now varied. The VCC is
5V from the microcontroller.
The voltage is the limiting factor and the R2(ref) the accuracy limiting variable.
Vout(min) = 0.02V
Vout(max) = 5V
R2(ref) = 1KΩ
R1 is the unknown resistance
𝑉𝑜𝑢𝑡 =1𝑘Ω
1𝑘Ω+𝑅1× 5𝑣
Capacitance:
𝜏 = 𝑅𝐶
Where τ is the time constant equivalent to 63.2% charged voltage of the supply.
R is the reference resistance,
C is the unknown capacitance.
Rearranging the equation gives:
𝐶 =𝜏
𝑅
Inductance:
𝐼𝑛𝑑𝑢𝑐𝑡𝑎𝑛𝑐𝑒 =1
𝐶𝑎𝑝𝑎𝑐𝑖𝑡𝑎𝑛𝑐𝑒 × 𝑓𝑟𝑒𝑞𝑢𝑒𝑛𝑐𝑦 × 𝑓𝑟𝑒𝑞𝑢𝑒𝑛𝑐𝑦 × 4 × 3.14159 × 3.14159
Capacitance = 2.2μF
𝐹𝑟𝑒𝑞𝑢𝑒𝑛𝑐𝑦 = 1.0 𝐸6
2 ∗ 𝑝𝑢𝑙𝑠𝑒
Pulse>0.1
Discharging Equation:
The maximum measured capacitance is 100μF which will late the longest time to fully discharge.
From the time constant expression:
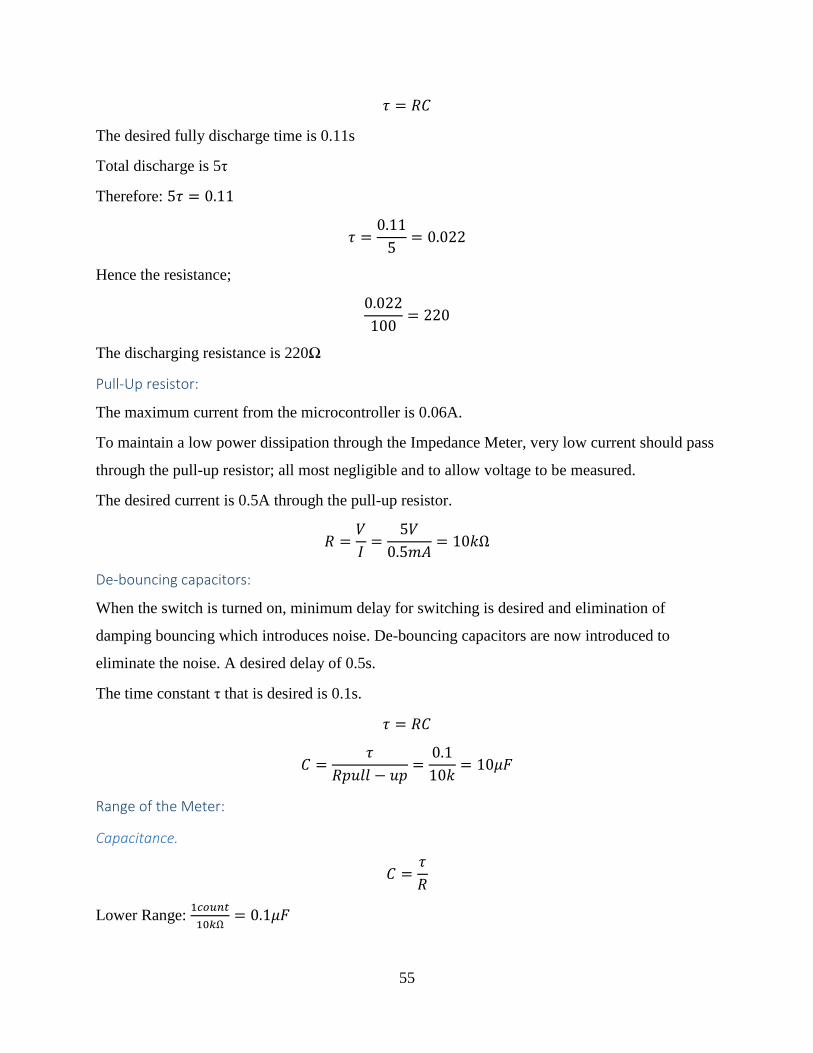
55
𝜏 = 𝑅𝐶
The desired fully discharge time is 0.11s
Total discharge is 5τ
Therefore: 5𝜏 = 0.11
𝜏 =0.11
5= 0.022
Hence the resistance;
0.022
100= 220
The discharging resistance is 220Ω
Pull-Up resistor:
The maximum current from the microcontroller is 0.06A.
To maintain a low power dissipation through the Impedance Meter, very low current should pass
through the pull-up resistor; all most negligible and to allow voltage to be measured.
The desired current is 0.5A through the pull-up resistor.
𝑅 =𝑉
𝐼=
5𝑉
0.5𝑚𝐴= 10𝑘Ω
De-bouncing capacitors:
When the switch is turned on, minimum delay for switching is desired and elimination of
damping bouncing which introduces noise. De-bouncing capacitors are now introduced to
eliminate the noise. A desired delay of 0.5s.
The time constant τ that is desired is 0.1s.
𝜏 = 𝑅𝐶
𝐶 =𝜏
𝑅𝑝𝑢𝑙𝑙 − 𝑢𝑝=
0.1
10𝑘= 10𝜇𝐹
Range of the Meter:
Capacitance.
𝐶 =𝜏
𝑅
Lower Range: 1𝑐𝑜𝑢𝑛𝑡
10𝑘Ω= 0.1𝜇𝐹
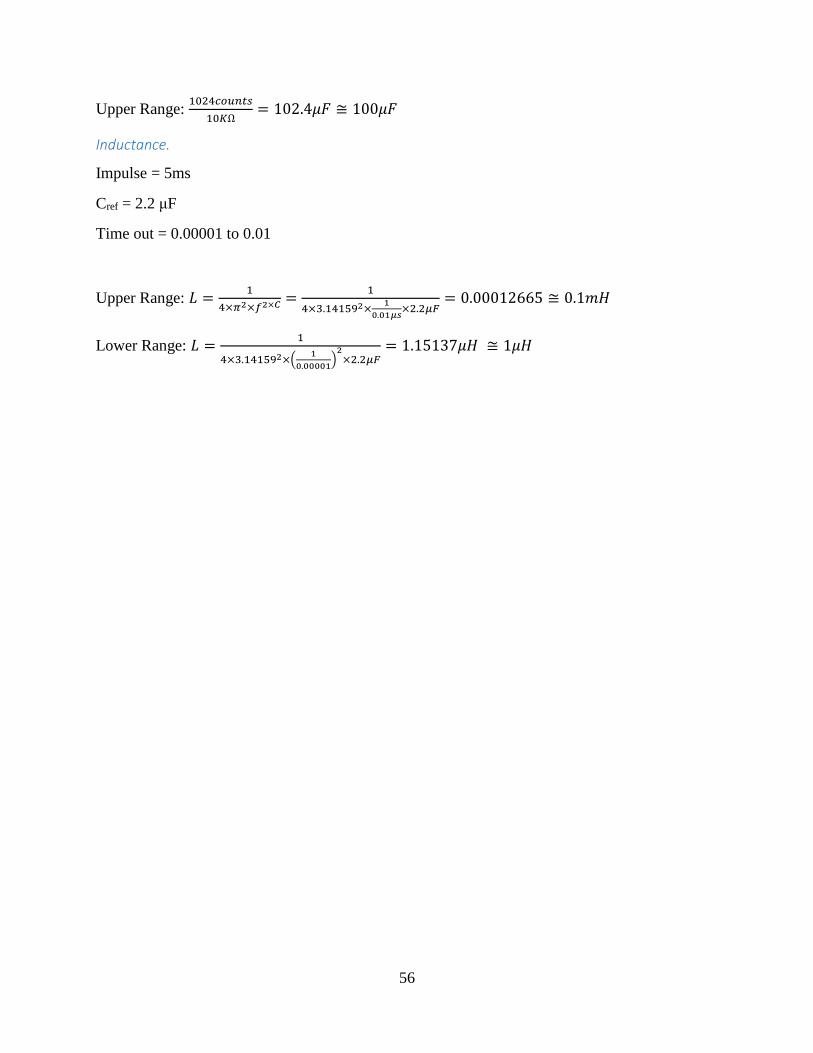
56
Upper Range: 1024𝑐𝑜𝑢𝑛𝑡𝑠
10𝐾Ω= 102.4𝜇𝐹 ≅ 100𝜇𝐹
Inductance.
Impulse = 5ms
Cref = 2.2 μF
Time out = 0.00001 to 0.01
Upper Range: 𝐿 =1
4×𝜋2×𝑓2×𝐶 =1
4×3.141592×1
0.01𝜇𝑠×2.2𝜇𝐹
= 0.00012665 ≅ 0.1𝑚𝐻
Lower Range: 𝐿 =1
4×3.141592×(1
0.00001)
2×2.2𝜇𝐹
= 1.15137𝜇𝐻 ≅ 1𝜇𝐻
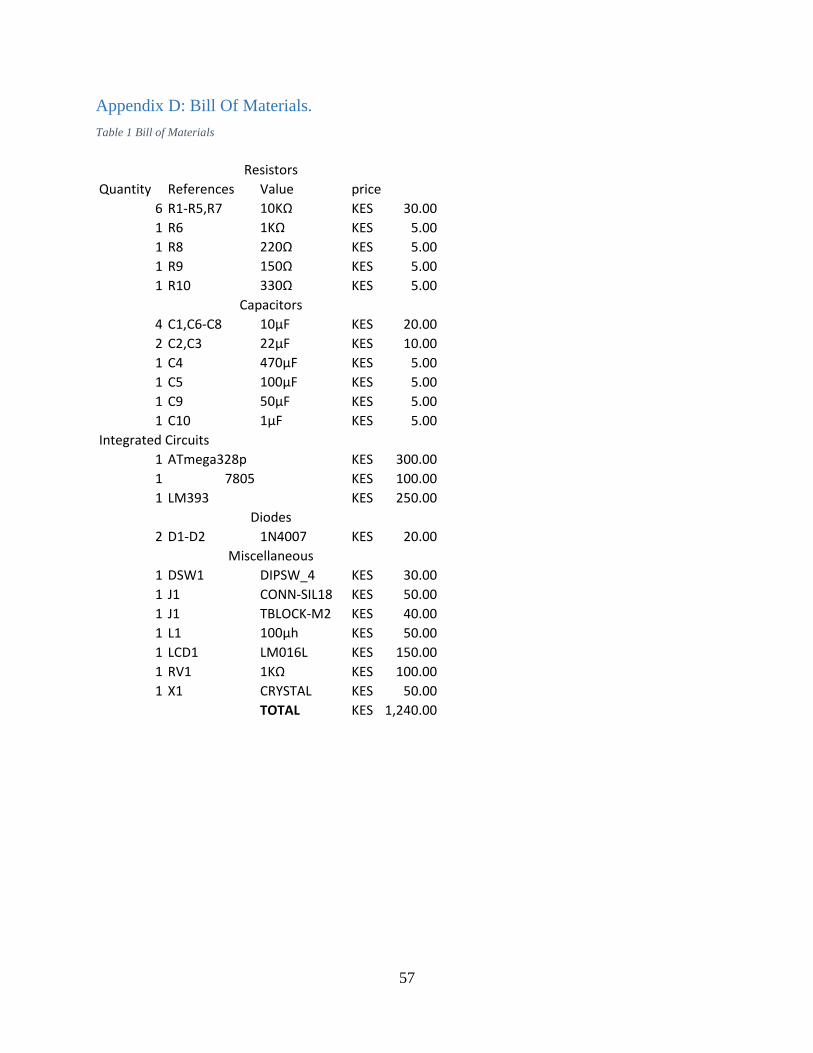
57
Appendix D: Bill Of Materials.
Table 1 Bill of Materials
Quantity References Value price
6 R1-R5,R7 10KΩ 30.00KES
1 R6 1KΩ 5.00KES
1 R8 220Ω 5.00KES
1 R9 150Ω 5.00KES
1 R10 330Ω 5.00KES
4 C1,C6-C8 10μF 20.00KES
2 C2,C3 22μF 10.00KES
1 C4 470μF 5.00KES
1 C5 100μF 5.00KES
1 C9 50μF 5.00KES
1 C10 1μF 5.00KES
1 ATmega328p 300.00KES
1 7805 100.00KES
1 LM393 250.00KES
2 D1-D2 1N4007 20.00KES
1 DSW1 DIPSW_4 30.00KES
1 J1 CONN-SIL18 50.00KES
1 J1 TBLOCK-M2 40.00KES
1 L1 100μh 50.00KES
1 LCD1 LM016L 150.00KES
1 RV1 1KΩ 100.00KES
1 X1 CRYSTAL 50.00KES
TOTAL 1,240.00KES
Resistors
Capacitors
Integrated Circuits
Diodes
Miscellaneous
Recommended