Peer eXchange & Learning
Monitoring Smart Specialisation Strategies
Emilia-Romagna
Bologna, 10 November 2015 Silvano Bertini – Regione Emilia-Romagna Leda Bologni - ASTER
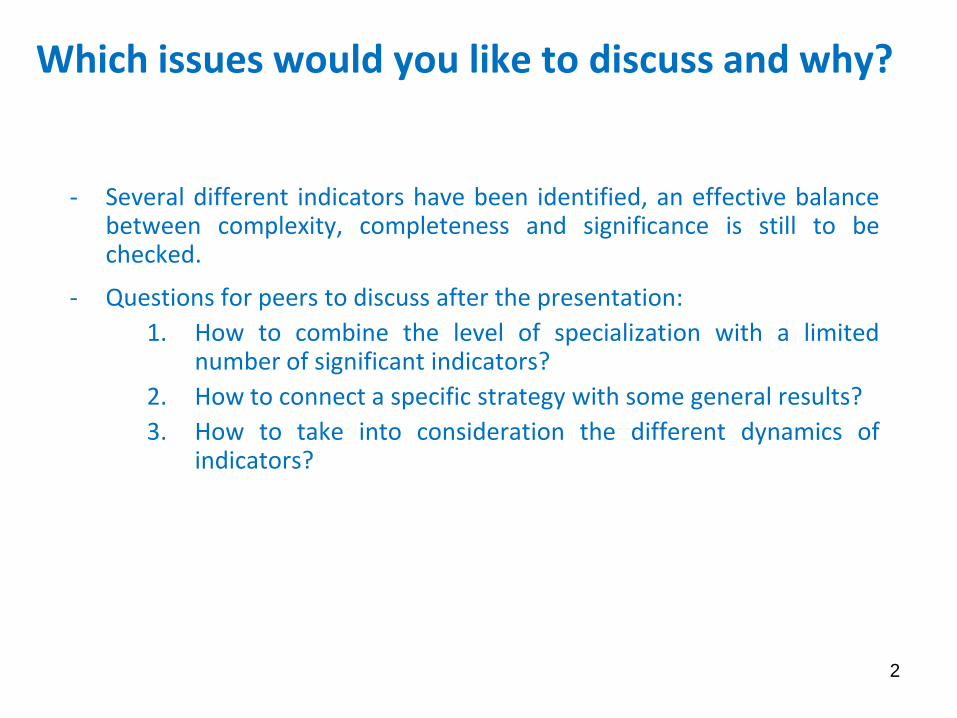
Which issues would you like to discuss and why?
- Several different indicators have been identified, an effective balance between complexity, completeness and significance is still to be checked.
- Questions for peers to discuss after the presentation:
1. How to combine the level of specialization with a limited number of significant indicators?
2. How to connect a specific strategy with some general results?
3. How to take into consideration the different dynamics of indicators?
2
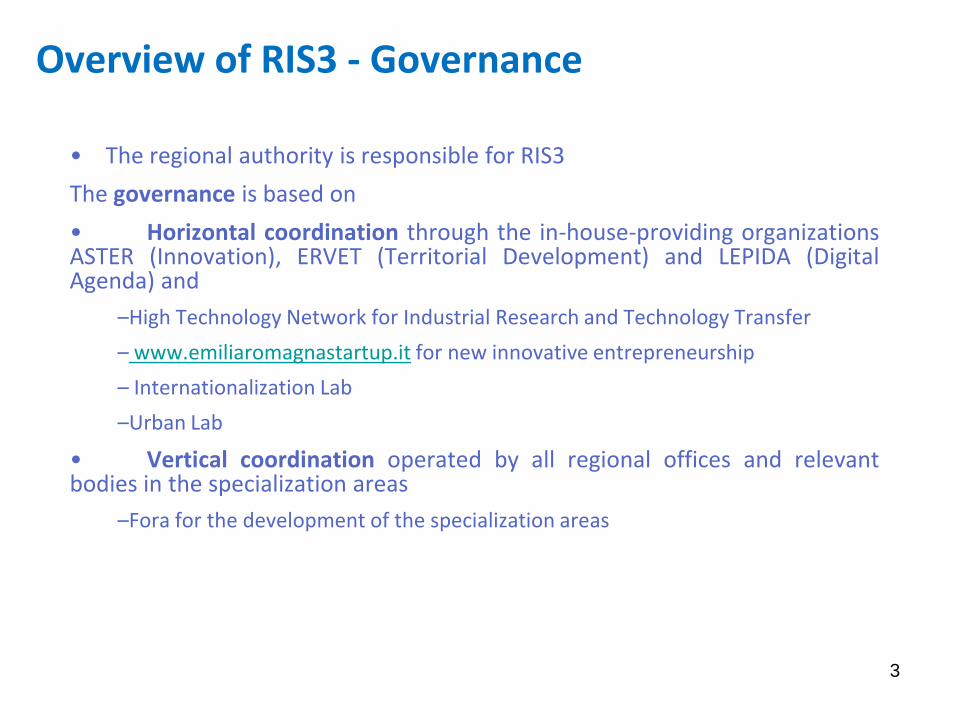
Overview of RIS3 - Governance
• The regional authority is responsible for RIS3
The governance is based on
• Horizontal coordination through the in-house-providing organizations ASTER (Innovation), ERVET (Territorial Development) and LEPIDA (Digital Agenda) and
–High Technology Network for Industrial Research and Technology Transfer
– www.emiliaromagnastartup.it for new innovative entrepreneurship
– Internationalization Lab
–Urban Lab
• Vertical coordination operated by all regional offices and relevant bodies in the specialization areas
–Fora for the development of the specialization areas
3
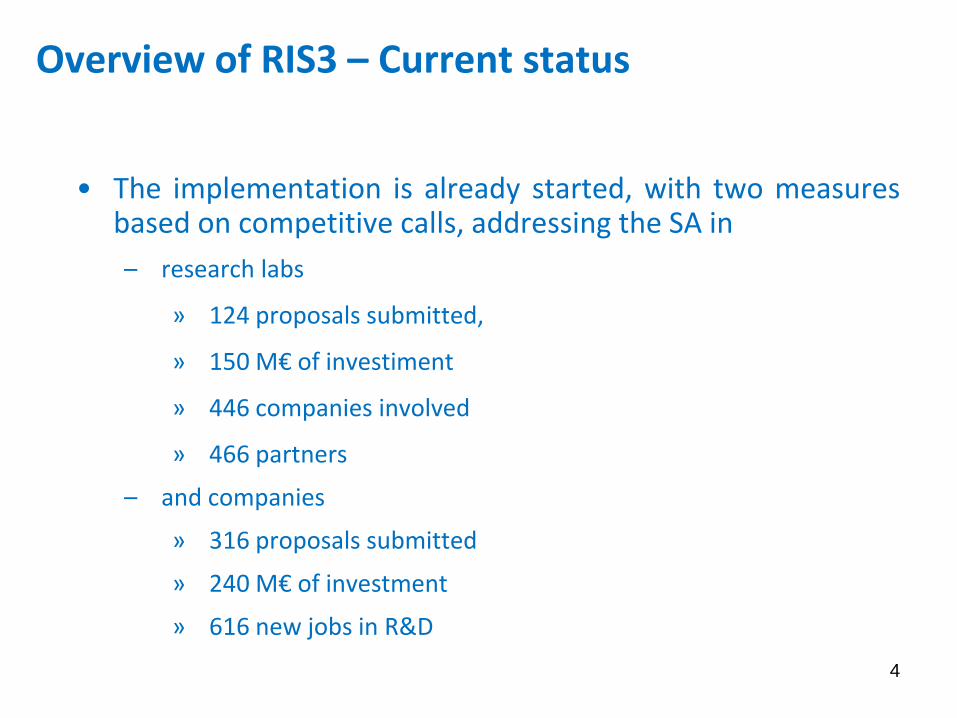
• The implementation is already started, with two measures based on competitive calls, addressing the SA in
– research labs
» 124 proposals submitted,
» 150 M€ of investiment
» 446 companies involved
» 466 partners
– and companies
» 316 proposals submitted
» 240 M€ of investment
» 616 new jobs in R&D
4
Overview of RIS3 – Current status
5
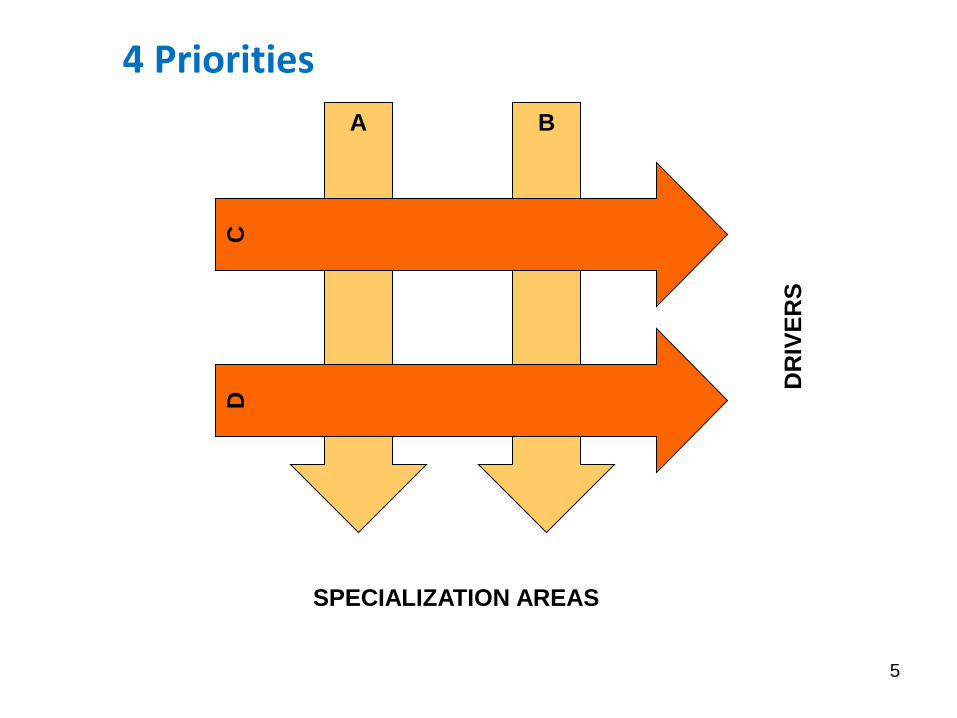
4 Priorities
A B
SPECIALIZATION AREAS
D
C
DR
IVE
RS
6
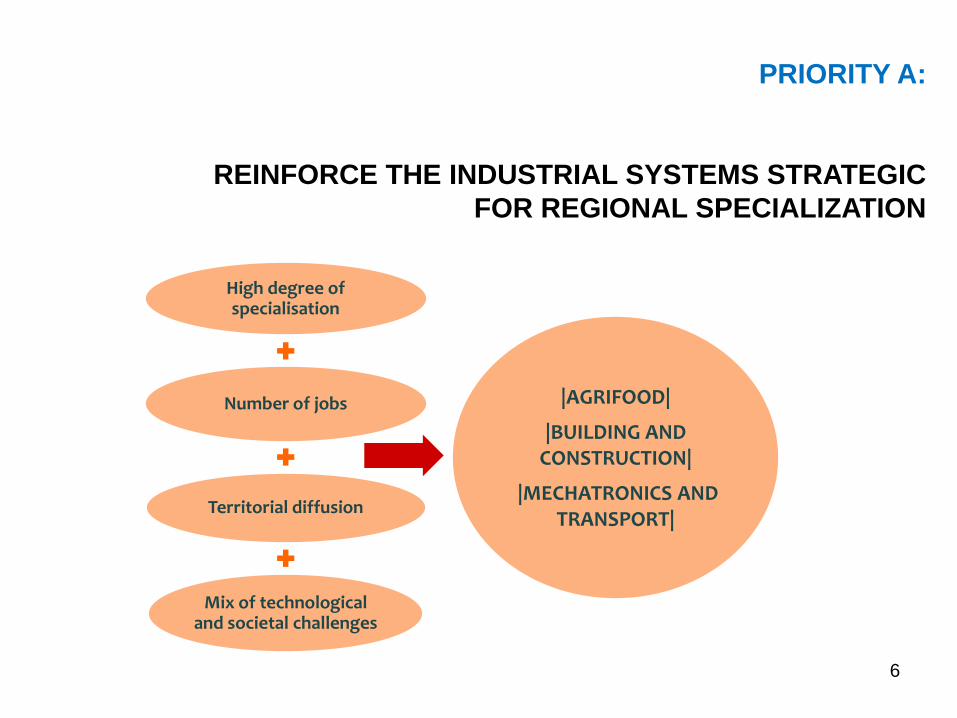
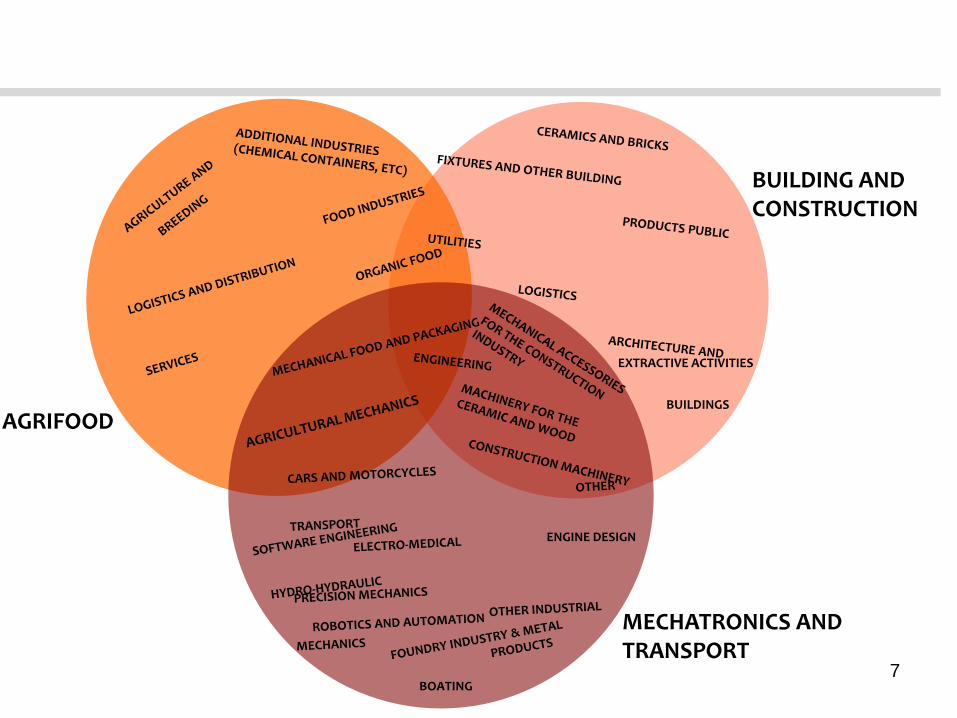
PRIORITY A:
REINFORCE THE INDUSTRIAL SYSTEMS STRATEGIC
FOR REGIONAL SPECIALIZATION
High degree of specialisation
Number of jobs
Territorial diffusion
Mix of technological and societal challenges
|AGRIFOOD|
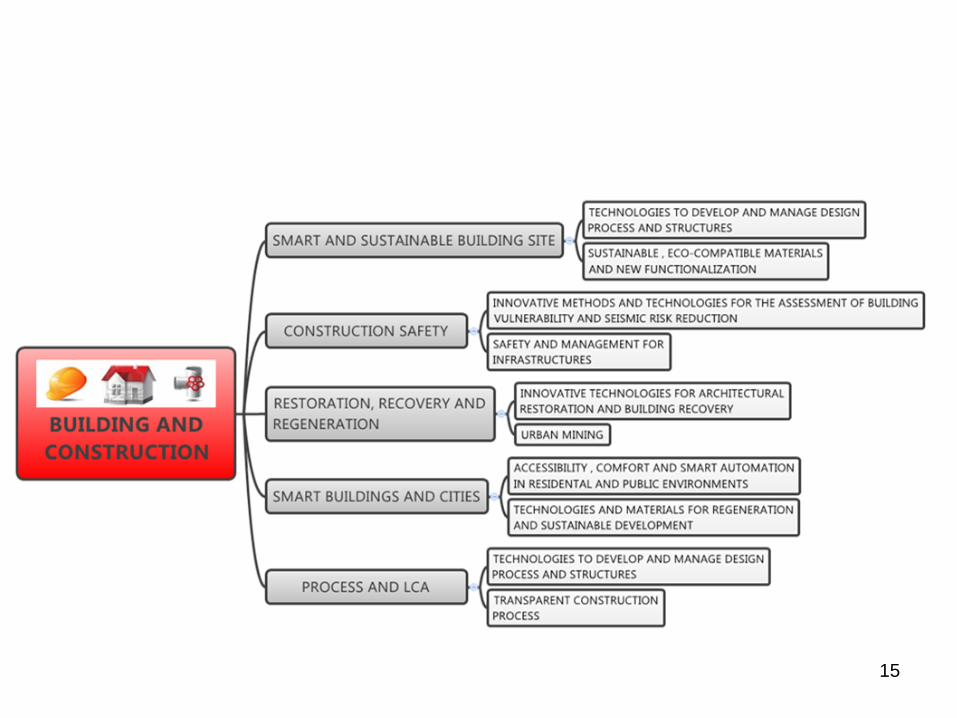
|BUILDING AND CONSTRUCTION|
|MECHATRONICS AND TRANSPORT|
7
ENGINE DESIGN
BOATING
EXTRACTIVE ACTIVITIES
BUILDINGS
AGRIFOOD
BUILDING AND CONSTRUCTION
MECHATRONICS AND TRANSPORT
8
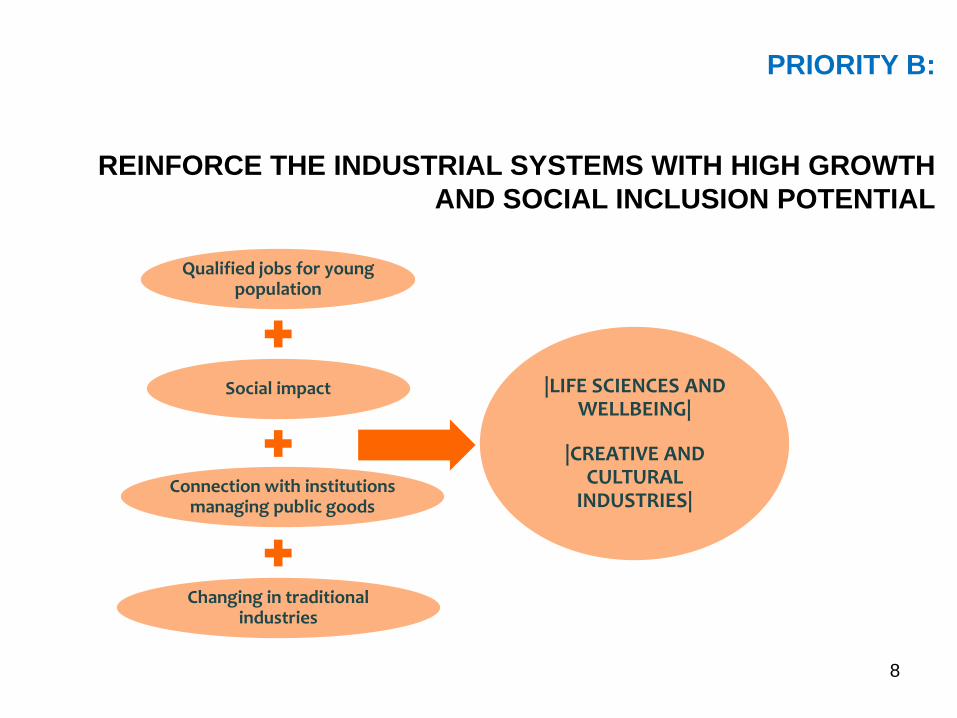
Qualified jobs for young population
Social impact
Connection with institutions managing public goods
Changing in traditional industries
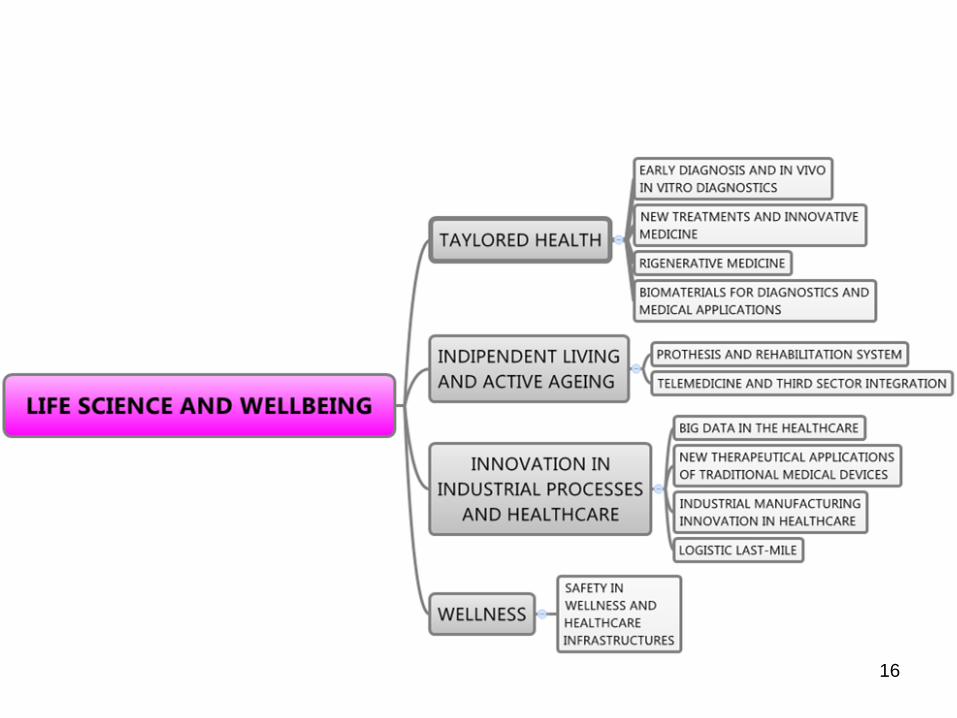
|LIFE SCIENCES AND WELLBEING|
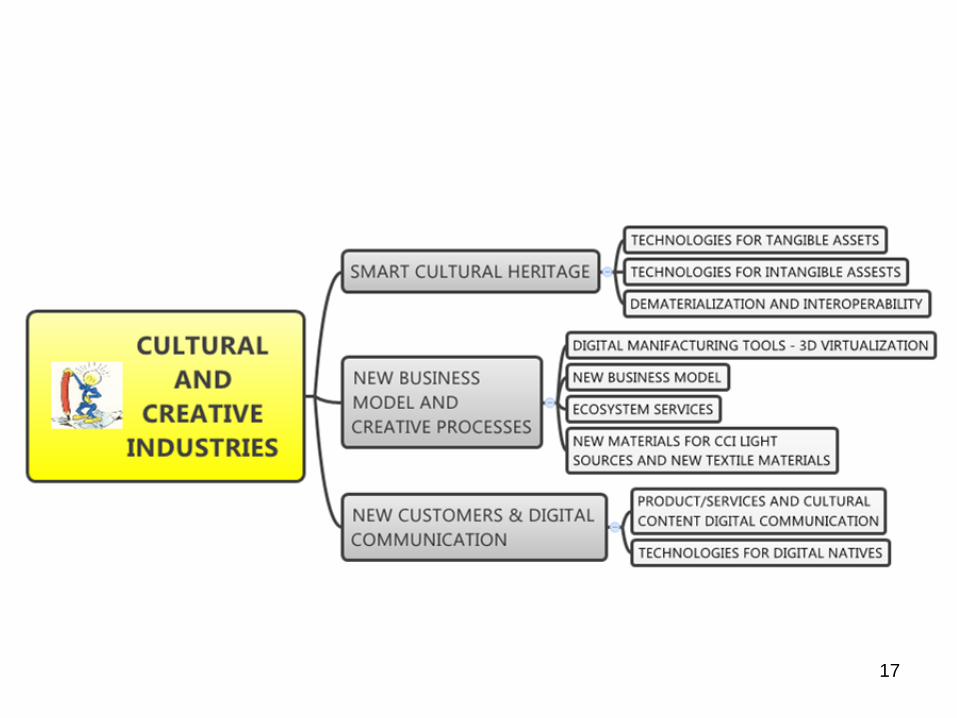
|CREATIVE AND CULTURAL
INDUSTRIES|
PRIORITY B:
REINFORCE THE INDUSTRIAL SYSTEMS WITH HIGH GROWTH
AND SOCIAL INCLUSION POTENTIAL
9
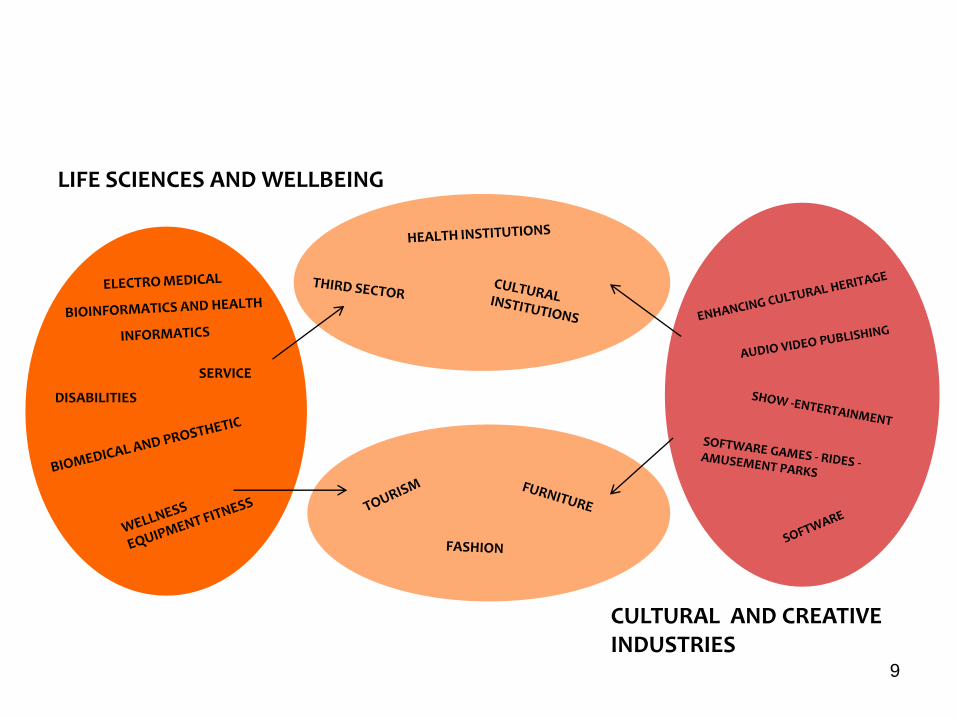
LIFE SCIENCES AND WELLBEING
CULTURAL AND CREATIVE INDUSTRIES
SERVICE
DISABILITIES
10
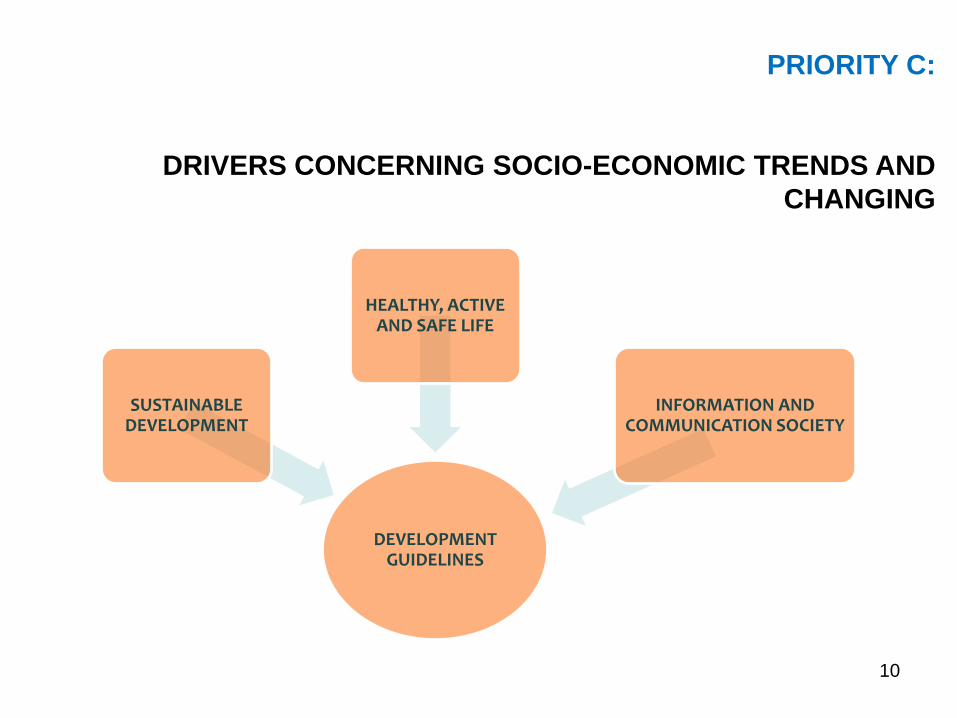
DEVELOPMENT GUIDELINES
SUSTAINABLE DEVELOPMENT
HEALTHY, ACTIVE AND SAFE LIFE
INFORMATION AND COMMUNICATION SOCIETY
PRIORITY C:
DRIVERS CONCERNING SOCIO-ECONOMIC TRENDS AND
CHANGING
11
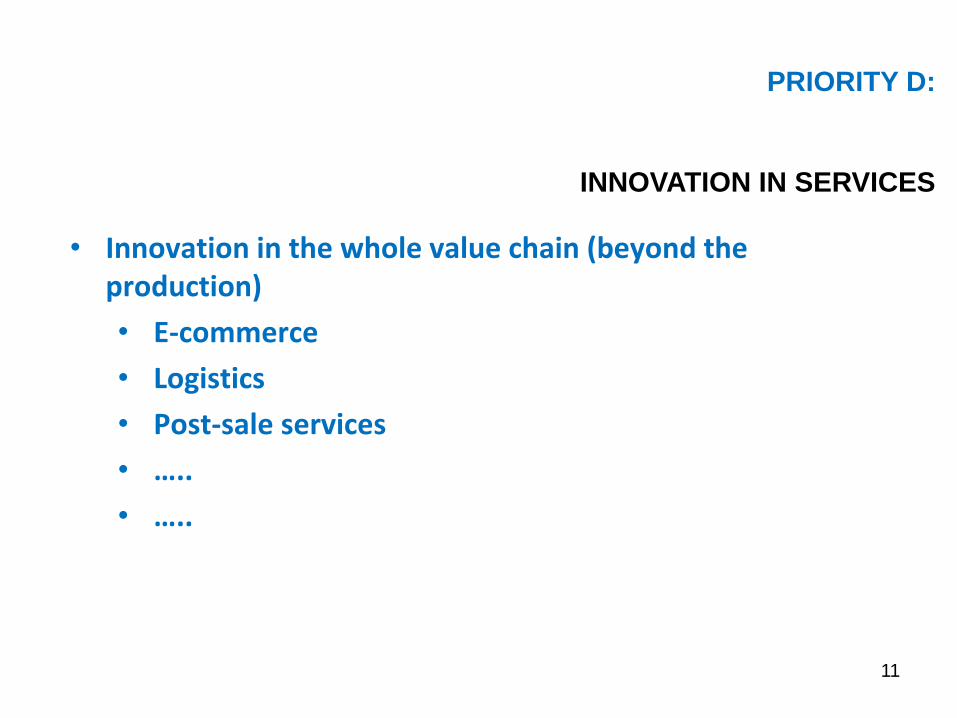
PRIORITY D:
INNOVATION IN SERVICES
• Innovation in the whole value chain (beyond the production)
• E-commerce
• Logistics
• Post-sale services
• …..
• …..
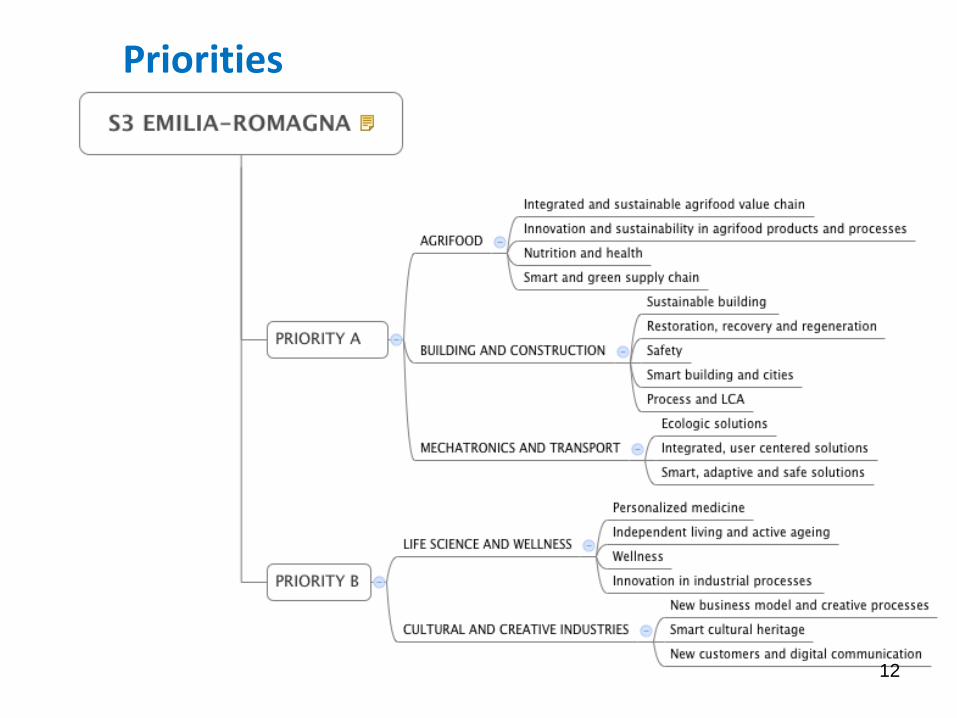
Priorities
12
13
14
15
16
17
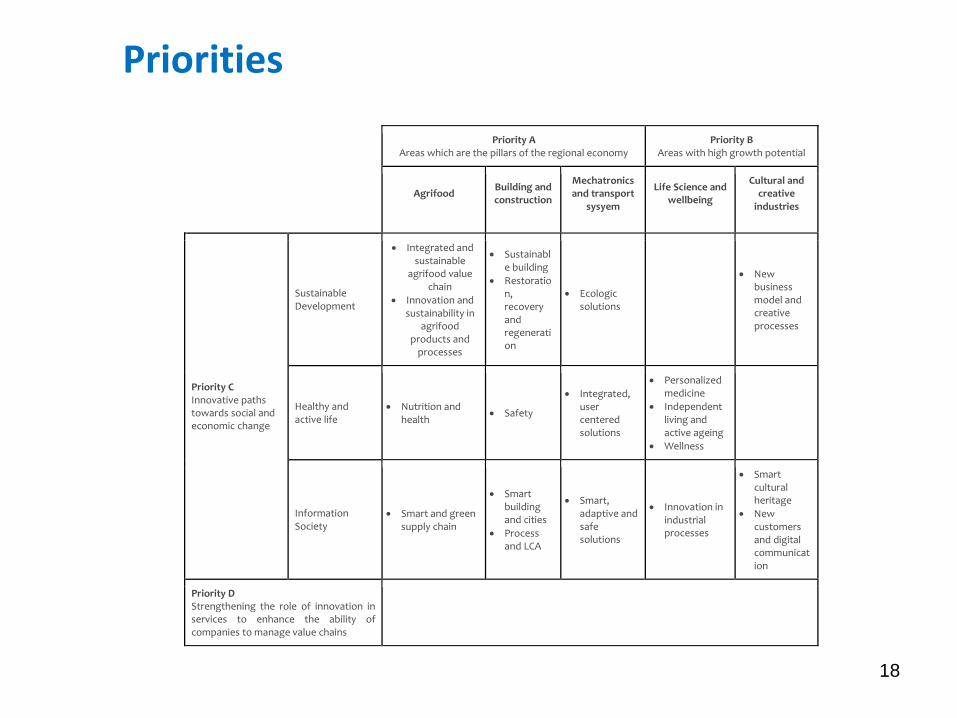
Priority A Areas which are the pillars of the regional economy
Priority B Areas with high growth potential
Agrifood Building and construction
Mechatronics and transport
sysyem
Life Science and wellbeing
Cultural and creative
industries
Priority C Innovative paths towards social and economic change
Sustainable Development
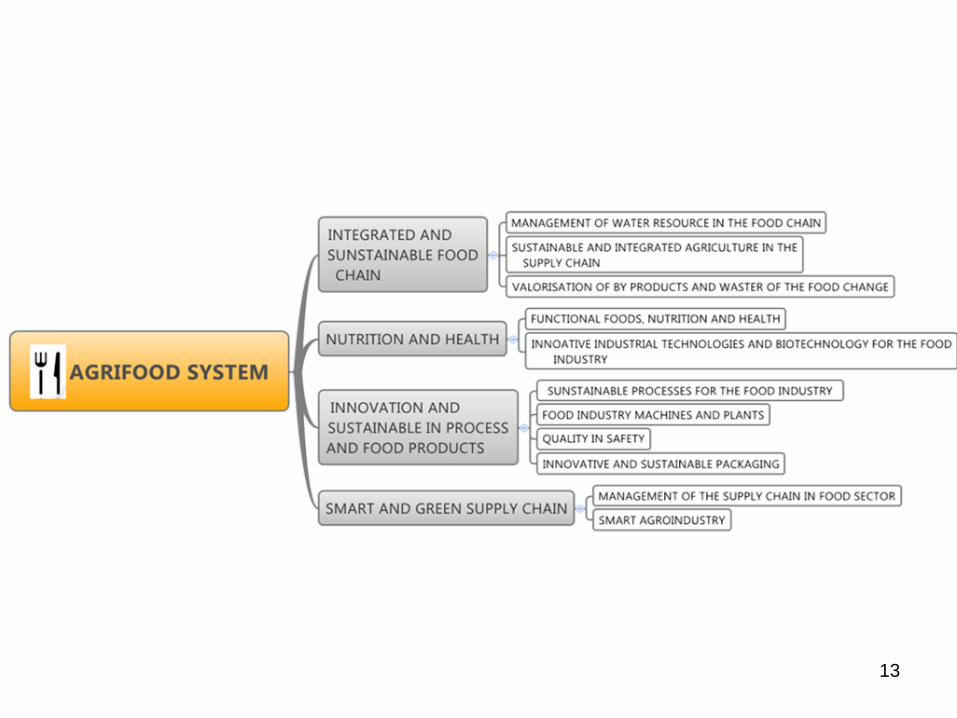
Integrated and sustainable
agrifood value chain
Innovation and sustainability in
agrifood products and
processes
Sustainable building
Restoration, recovery and regeneration
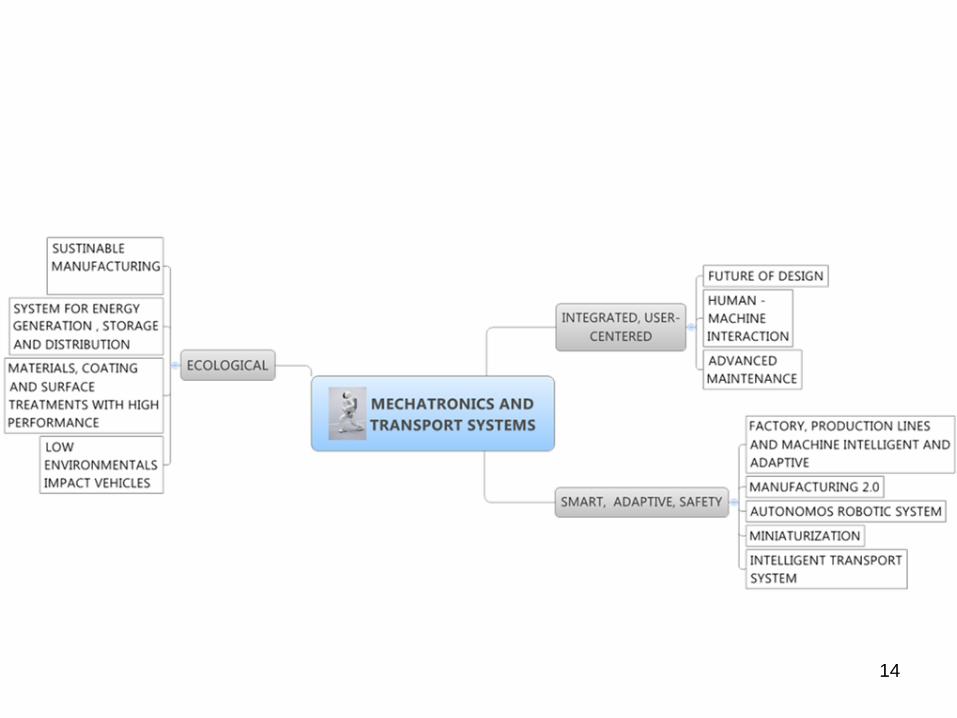
Ecologic solutions
New business model and creative processes
Healthy and active life
Nutrition and health
Safety
Integrated, user centered solutions
Personalized medicine
Independent living and active ageing
Wellness
Information Society
Smart and green supply chain
Smart building and cities
Process and LCA
Smart, adaptive and safe solutions
Innovation in industrial processes
Smart cultural heritage
New customers and digital communication
Priority D Strengthening the role of innovation in services to enhance the ability of companies to manage value chains
Priorities
18
Monitoring system (1)
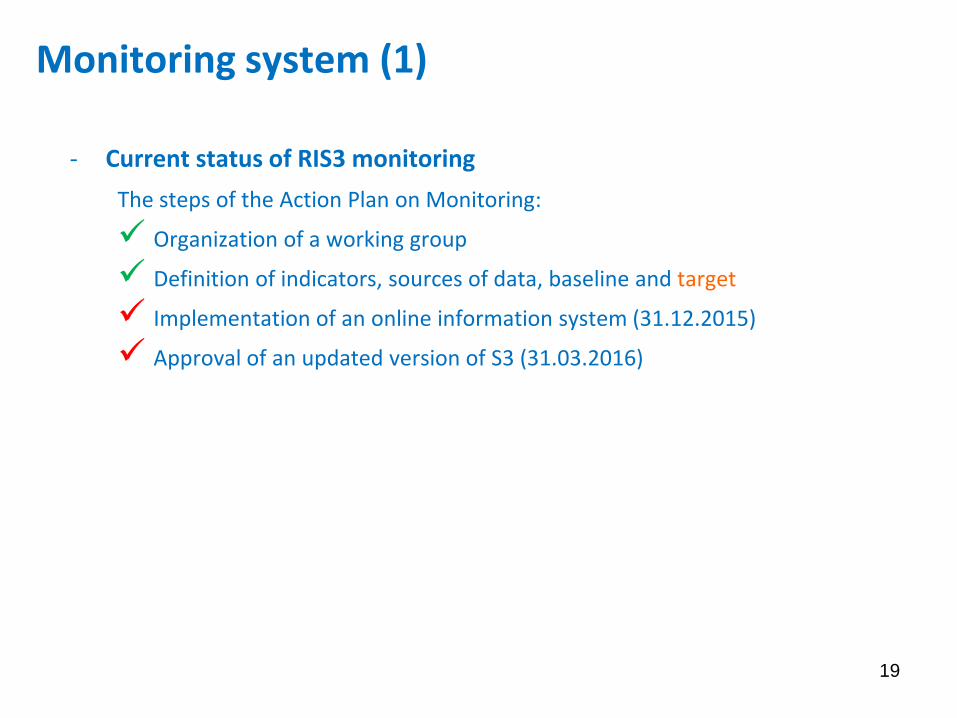
- Current status of RIS3 monitoring
The steps of the Action Plan on Monitoring:
Organization of a working group
Definition of indicators, sources of data, baseline and target
Implementation of an online information system (31.12.2015)
Approval of an updated version of S3 (31.03.2016)
19
Monitoring system (2)
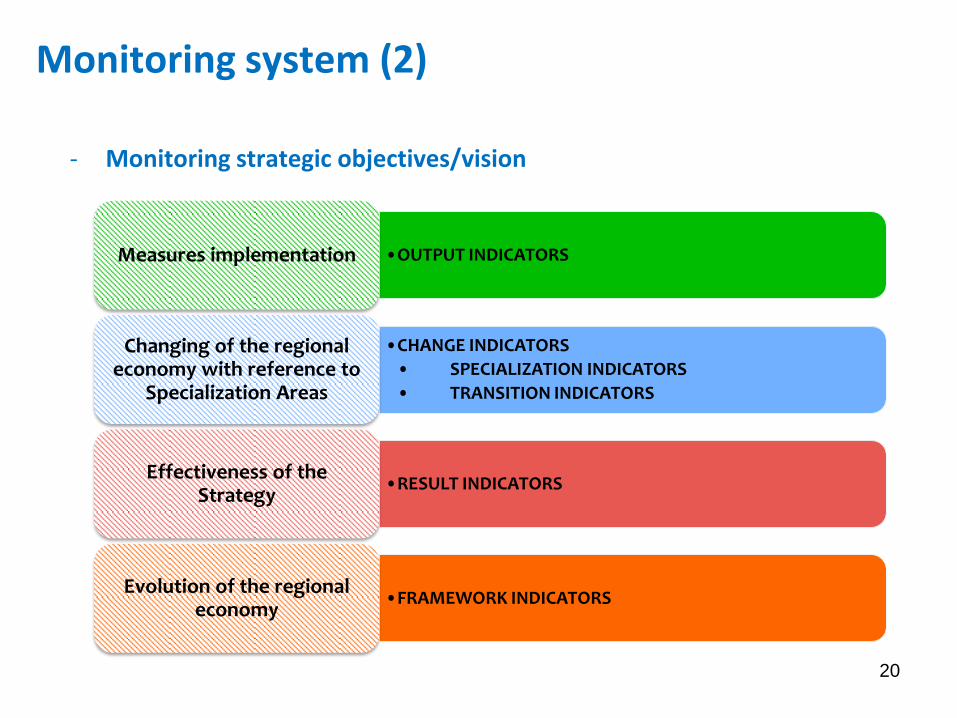
- Monitoring strategic objectives/vision
20
•OUTPUT INDICATORS Measures implementation
•CHANGE INDICATORS
• SPECIALIZATION INDICATORS
• TRANSITION INDICATORS
Changing of the regional economy with reference to
Specialization Areas
•RESULT INDICATORS Effectiveness of the
Strategy
•FRAMEWORK INDICATORS Evolution of the regional
economy
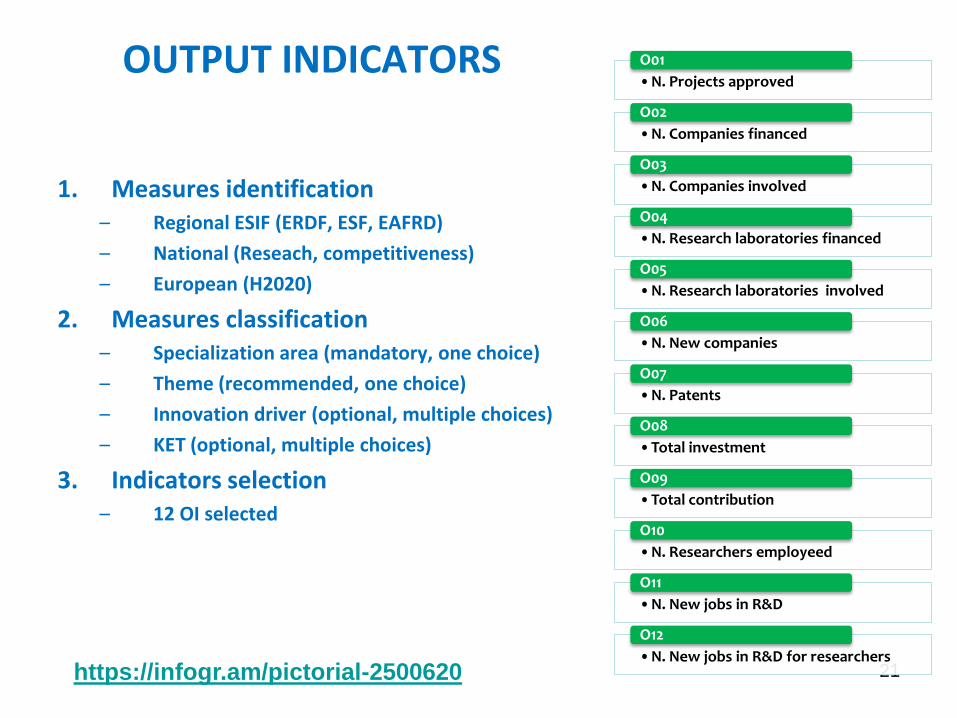
1. Measures identification – Regional ESIF (ERDF, ESF, EAFRD)
– National (Reseach, competitiveness)
– European (H2020)
2. Measures classification – Specialization area (mandatory, one choice)
– Theme (recommended, one choice)
– Innovation driver (optional, multiple choices)
– KET (optional, multiple choices)
3. Indicators selection – 12 OI selected
21
OUTPUT INDICATORS •N. Projects approved
O01
•N. Companies financed
O02
•N. Companies involved
O03
•N. Research laboratories financed
O04
•N. Research laboratories involved
O05
•N. New companies
O06
•N. Patents
O07
•Total investment
O08
•Total contribution
O09
•N. Researchers employeed
O10
•N. New jobs in R&D
O11
•N. New jobs in R&D for researchers
O12
https://infogr.am/pictorial-2500620
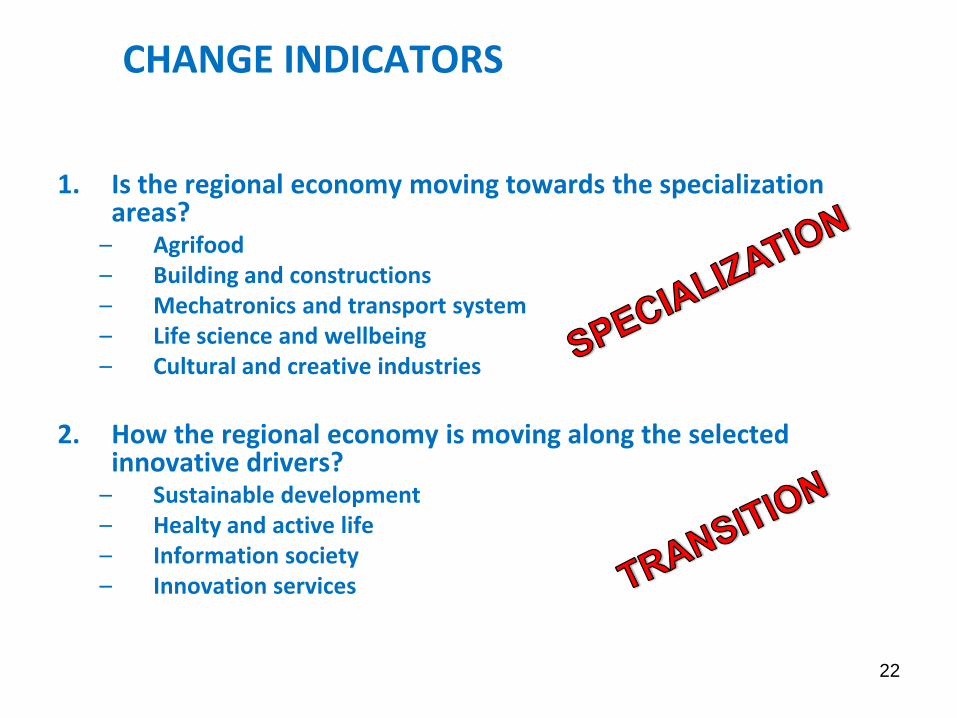
1. Is the regional economy moving towards the specialization areas?
– Agrifood – Building and constructions – Mechatronics and transport system – Life science and wellbeing – Cultural and creative industries
2. How the regional economy is moving along the selected
innovative drivers? – Sustainable development – Healty and active life – Information society – Innovation services
22
CHANGE INDICATORS
23
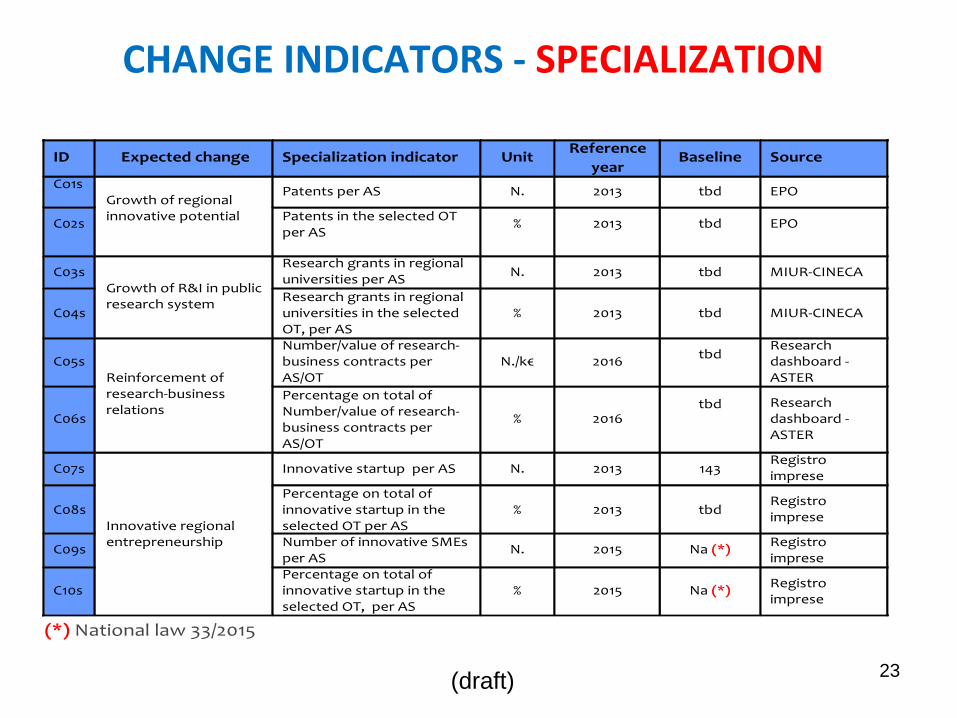
CHANGE INDICATORS - SPECIALIZATION
ID Expectedchange Specializationindicator UnitReference
yearBaseline Source
Co1sGrowthofregionalinnovativepotential
PatentsperAS N. 2013 tbd EPO
C02sPatentsintheselectedOTperAS
% 2013 tbd EPO
C03sGrowthofR&Iinpublicresearchsystem
ResearchgrantsinregionaluniversitiesperAS
N. 2013 tbd MIUR-CINECA
C04sResearchgrantsinregionaluniversitiesintheselectedOT,perAS
% 2013 tbd MIUR-CINECA
C05sReinforcementofresearch-businessrelations
Number/valueofresearch-businesscontractsperAS/OT
N./k€ 2016tbd
Researchdashboard-ASTER
C06s
PercentageontotalofNumber/valueofresearch-businesscontractsperAS/OT
% 2016tbd Research
dashboard-ASTER
C07s
Innovativeregionalentrepreneurship
InnovativestartupperAS N. 2013 143Registroimprese
C08sPercentageontotalofinnovativestartupintheselectedOTperAS
% 2013 tbdRegistroimprese
C09sNumberofinnovativeSMEsperAS
N. 2015 Na(*)Registroimprese
C10sPercentageontotalofinnovativestartupintheselectedOT,perAS
% 2015 Na(*)Registroimprese
(*)Nationallaw33/2015
(draft)
24
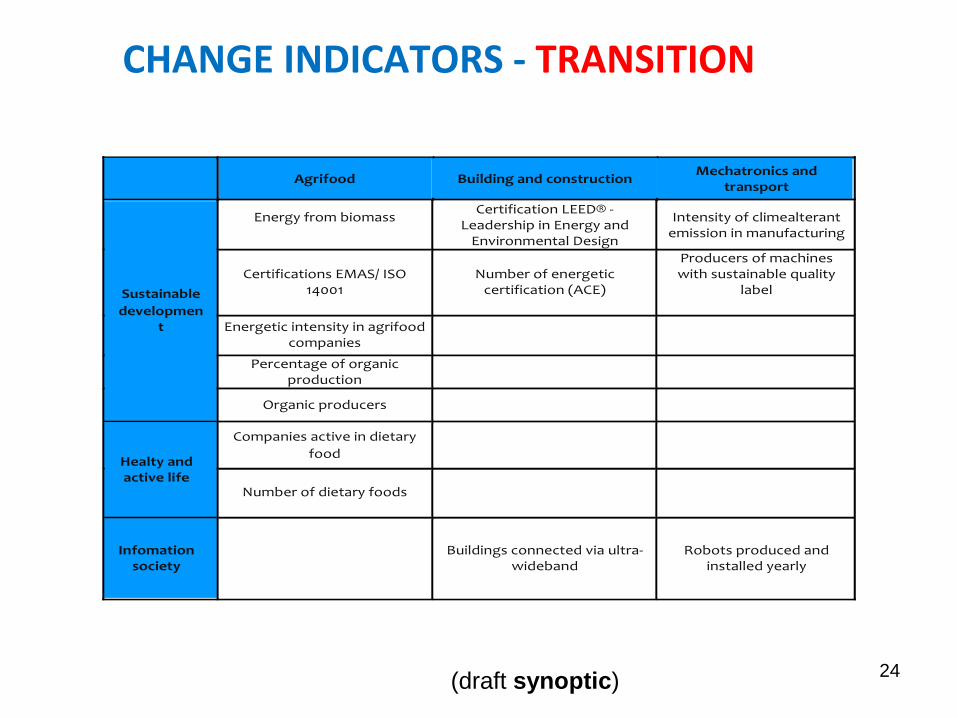
CHANGE INDICATORS - TRANSITION
Agrifood BuildingandconstructionMechatronicsand
transport
Sustainable
development
Energyfrombiomass
CertificationLEED®-LeadershipinEnergyandEnvironmentalDesign
Intensityofclimealterantemissioninmanufacturing
CertificationsEMAS/ISO14001
Numberofenergeticcertification(ACE)
Producersofmachineswithsustainablequality
label
Energeticintensityinagrifoodcompanies
Percentageoforganicproduction
Organicproducers
Healtyandactivelife
Companiesactiveindietary
food
Numberofdietaryfoods
Infomationsociety
Buildingsconnectedviaultra-
widebandRobotsproducedand
installedyearly
(draft synoptic)
25
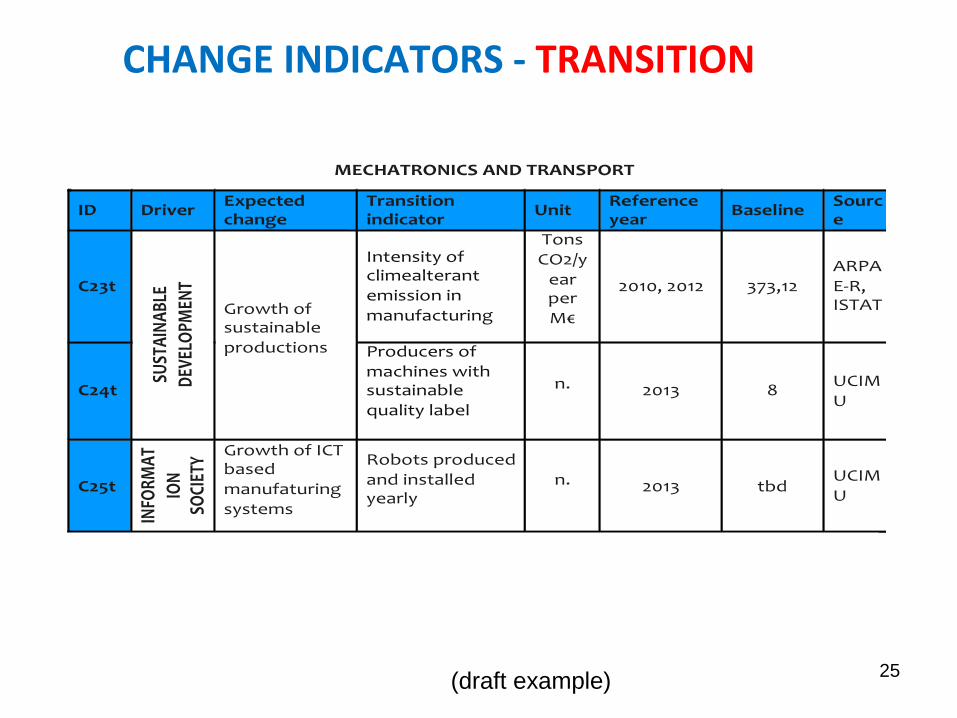
CHANGE INDICATORS - TRANSITION
(draft example)
MECHATRONICSANDTRANSPORT
ID DriverExpectedchange
Transitionindicator
UnitReferenceyear
BaselineSource
C23t
SUST
AINAB
LE
DEV
ELOPM
ENT
Growthofsustainableproductions
Intensityofclimealterantemissioninmanufacturing
TonsCO2/yearperM€
2010,2012 373,12ARPAE-R,ISTAT
C24t
Producersofmachineswithsustainablequalitylabel
n. 2013 8UCIMU
C25t
INFO
RMAT
ION
SOCIET
Y GrowthofICTbasedmanufaturingsystems
Robotsproducedandinstalledyearly
n. 2013 tbdUCIMU
26
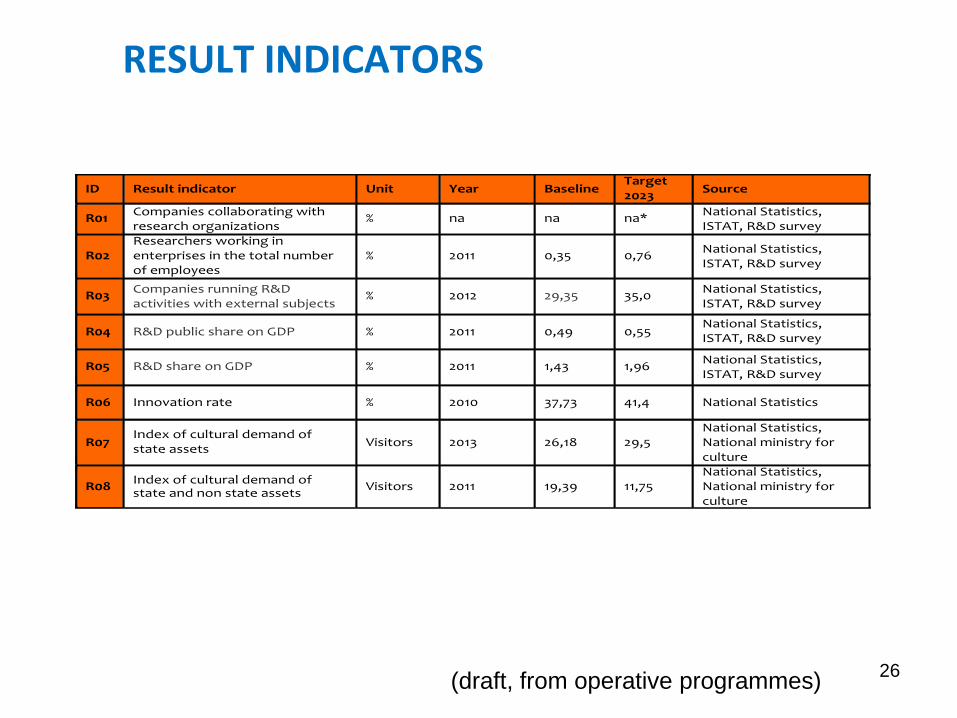
RESULT INDICATORS
(draft, from operative programmes)
ID Resultindicator Unit Year BaselineTarget2023
Source
R01Companiescollaboratingwithresearchorganizations
% na na na*NationalStatistics,ISTAT,R&Dsurvey
R02Researchersworkinginenterprisesinthetotalnumberofemployees
% 2011 0,35 0,76NationalStatistics,ISTAT,R&Dsurvey
R03CompaniesrunningR&Dactivitieswithexternalsubjects
% 2012 29,35 35,0NationalStatistics,ISTAT,R&Dsurvey
R04 R&DpublicshareonGDP % 2011 0,49 0,55NationalStatistics,ISTAT,R&Dsurvey
R05 R&DshareonGDP % 2011 1,43 1,96NationalStatistics,ISTAT,R&Dsurvey
R06 Innovationrate % 2010 37,73 41,4 NationalStatistics
R07Indexofculturaldemandofstateassets
Visitors 2013 26,18 29,5NationalStatistics,Nationalministryforculture
R08Indexofculturaldemandofstateandnonstateassets
Visitors 2011 19,39 11,75NationalStatistics,Nationalministryforculture
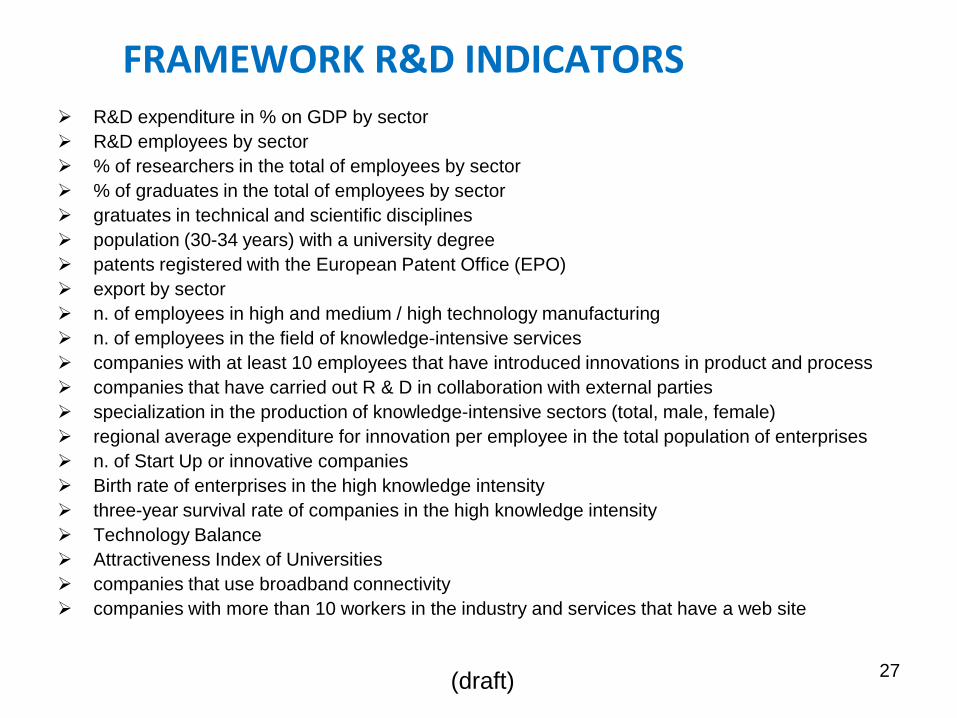
R&D expenditure in % on GDP by sector
R&D employees by sector
% of researchers in the total of employees by sector
% of graduates in the total of employees by sector
gratuates in technical and scientific disciplines
population (30-34 years) with a university degree
patents registered with the European Patent Office (EPO)
export by sector
n. of employees in high and medium / high technology manufacturing
n. of employees in the field of knowledge-intensive services
companies with at least 10 employees that have introduced innovations in product and process
companies that have carried out R & D in collaboration with external parties
specialization in the production of knowledge-intensive sectors (total, male, female)
regional average expenditure for innovation per employee in the total population of enterprises
n. of Start Up or innovative companies
Birth rate of enterprises in the high knowledge intensity
three-year survival rate of companies in the high knowledge intensity
Technology Balance
Attractiveness Index of Universities
companies that use broadband connectivity
companies with more than 10 workers in the industry and services that have a web site
27
FRAMEWORK R&D INDICATORS
(draft)
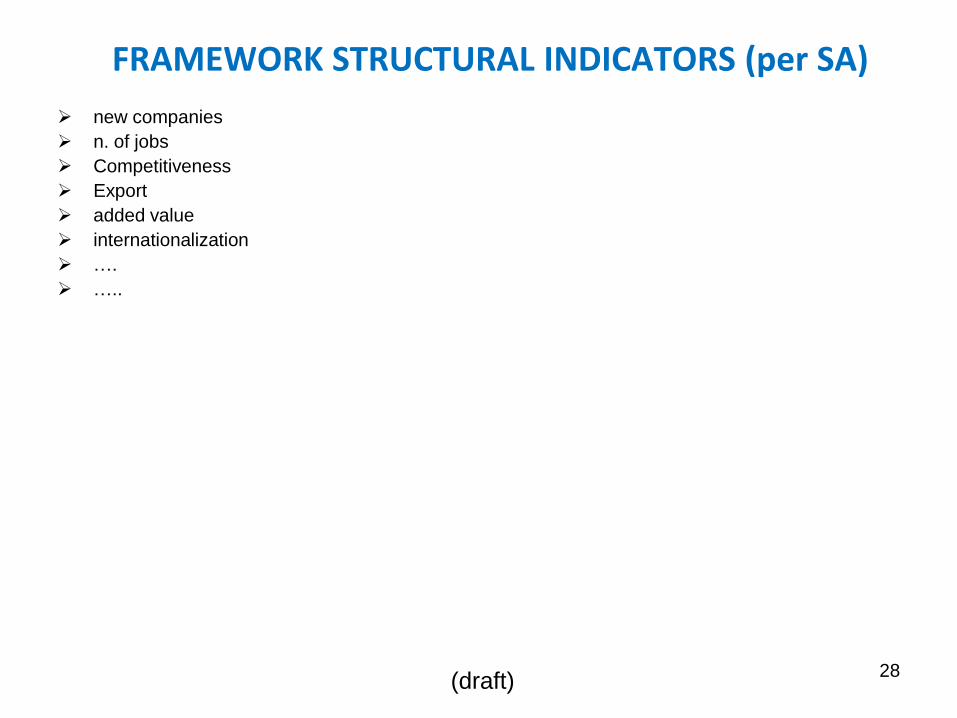
new companies
n. of jobs
Competitiveness
Export
added value
internationalization
….
…..
28
FRAMEWORK STRUCTURAL INDICATORS (per SA)
(draft)
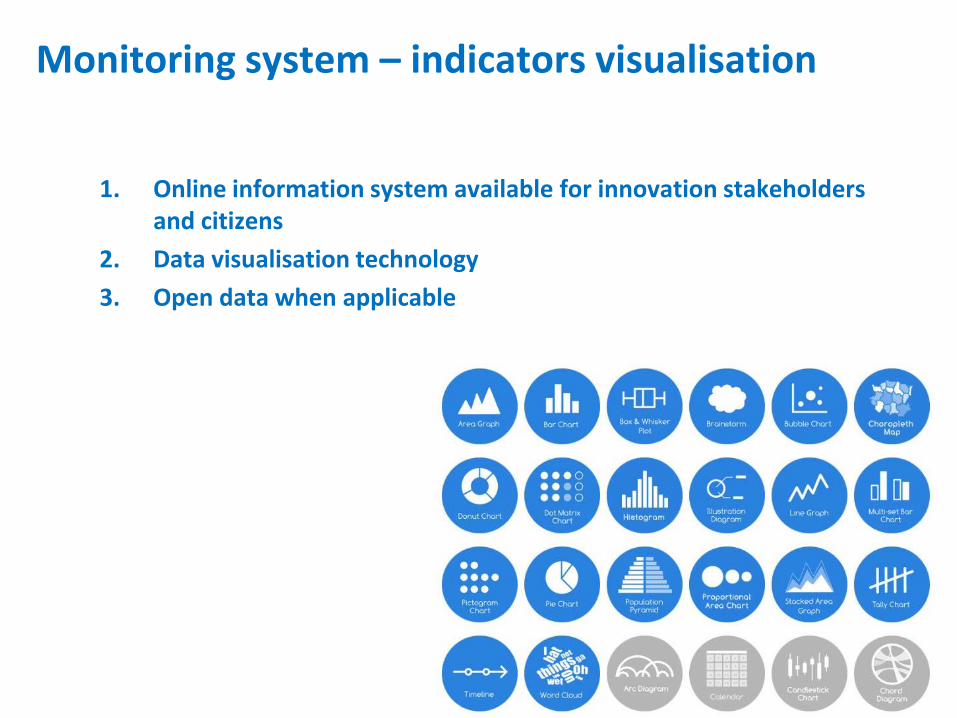
Monitoring system – indicators visualisation
29
1. Online information system available for innovation stakeholders and citizens
2. Data visualisation technology
3. Open data when applicable
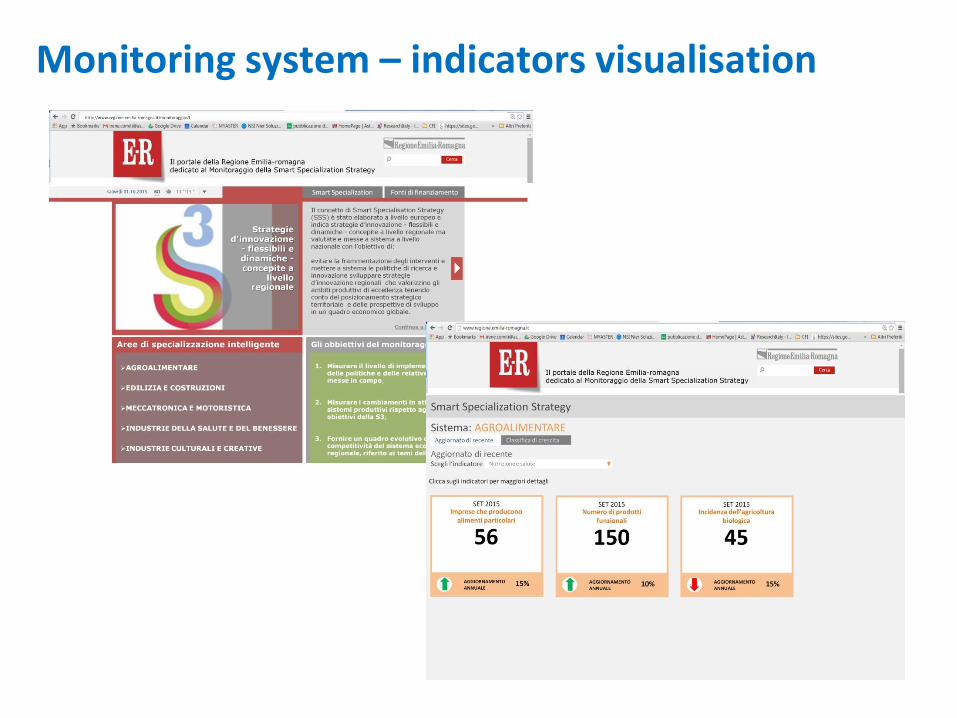
Monitoring system – indicators visualisation
30
Monitoring system
- Role of the monitoring system
To be a decision support method for strategy evaluation, results analysis and policy adaptation and refinement
- Responsibilities
ASTER is responsible for RIS3 monitoring
- Stakeholders
In the RIS3 implementation some permanent Forums will be organized. They will be involved in the monitoring process and evolution, and will be required to analyse the indicators, discuss them and/or suggest adjustments
31
Monitoring system
- Using the monitoring evidence
Verify the steps of implementation of the policy tools
Verify the in-process degree of achievement of indicators
Supply information to impact evaluation
- RIS3 revision
A RIS3 revision is planned for 2017-2018
32
Summary & next steps
33
for more info ....
34
Question 1: How to combine the level of
specialization with a limited number of significant indicators?
35
Question 2: How to connect a specific strategy with some general results?
36
Question 3: How to take into consideration the different dynamics of indicators?
37
Recommended