Marvin StoneRegents professor emeritus Biosystems and Agricultural EngineeringOklahoma State UniversityStillwater, [email protected]
Nitrogen use efficiency
Crop reflectance sensing technology for nutrient management
CSU Plant sensor trainingWednesday, April 10, 2013
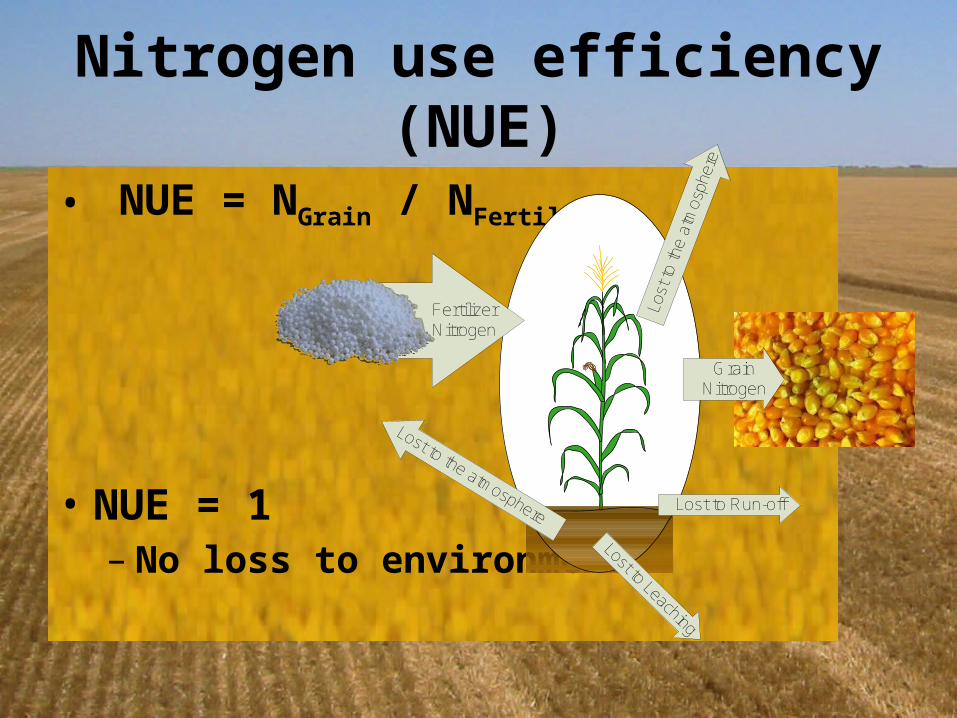
Nitrogen use efficiency (NUE)
• NUE = NGrain / NFertilizer
• NUE = 1– No loss to environment
Grain Nitrogen
Lost
to th
e at
mos
pher
e
Lost to Leaching
Fertilizer Nitrogen
Lost to the atmosphere Lost to Run-off
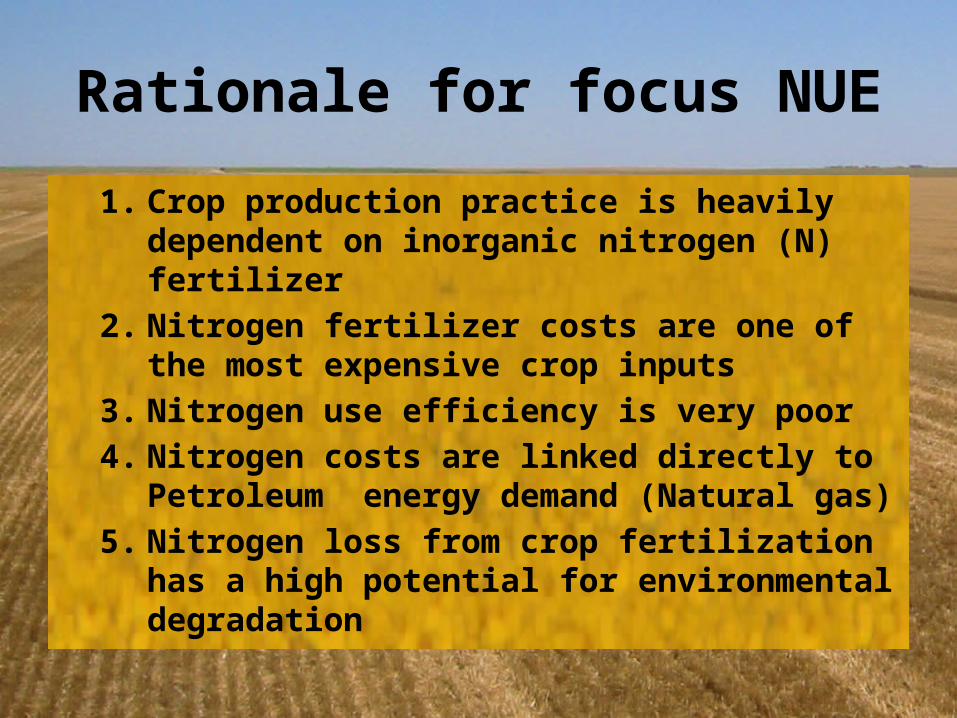
Rationale for focus NUE
1. Crop production practice is heavily dependent on inorganic nitrogen (N) fertilizer
2. Nitrogen fertilizer costs are one of the most expensive crop inputs
3. Nitrogen use efficiency is very poor4. Nitrogen costs are linked directly to Petroleum
energy demand (Natural gas)5. Nitrogen loss from crop fertilization has a high
potential for environmental degradation

We are dependent on fertilizer for food production
• Over 40% of the people on Earth owe their existence to the food production made possible by N fertilizers
C.S. Snyder, International plant nutrition institute, World Fertilizer N Consumption and Challenges, Nitrogen Use Efficiency Conference, Stillwater, Oklahoma August 3, 2010
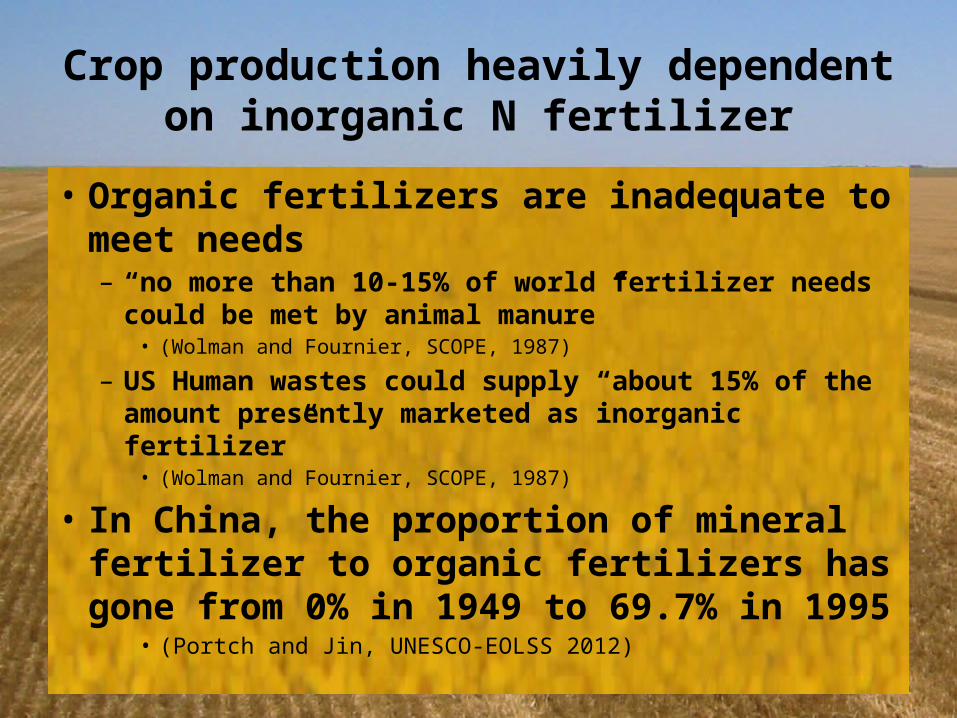
Crop production heavily dependent on inorganic N fertilizer
• Organic fertilizers are inadequate to meet needs– “no more than 10-15% of world fertilizer needs could be
met by animal manure”• (Wolman and Fournier, SCOPE, 1987)
– US Human wastes could supply “about 15% of the amount presently marketed as inorganic fertilizer”
• (Wolman and Fournier, SCOPE, 1987)
• In China, the proportion of mineral fertilizer to organic fertilizers has gone from 0% in 1949 to 69.7% in 1995
• (Portch and Jin, UNESCO-EOLSS 2012)
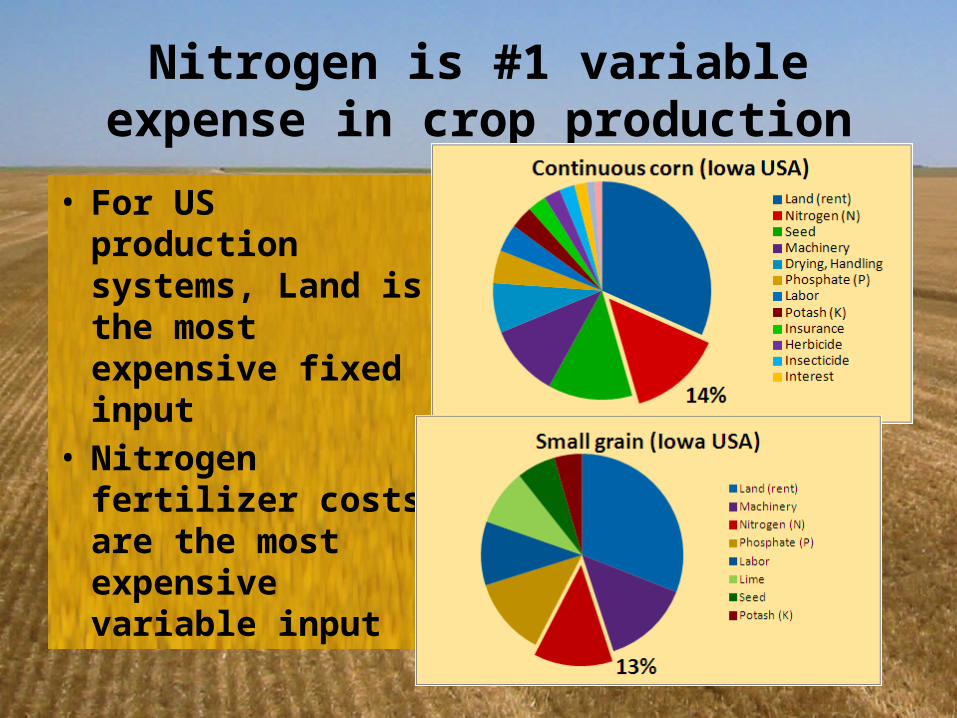
Nitrogen is #1 variable expense in crop production
• For US production systems, Land is the most expensive fixed input
• Nitrogen fertilizer costs are the most expensive variable input
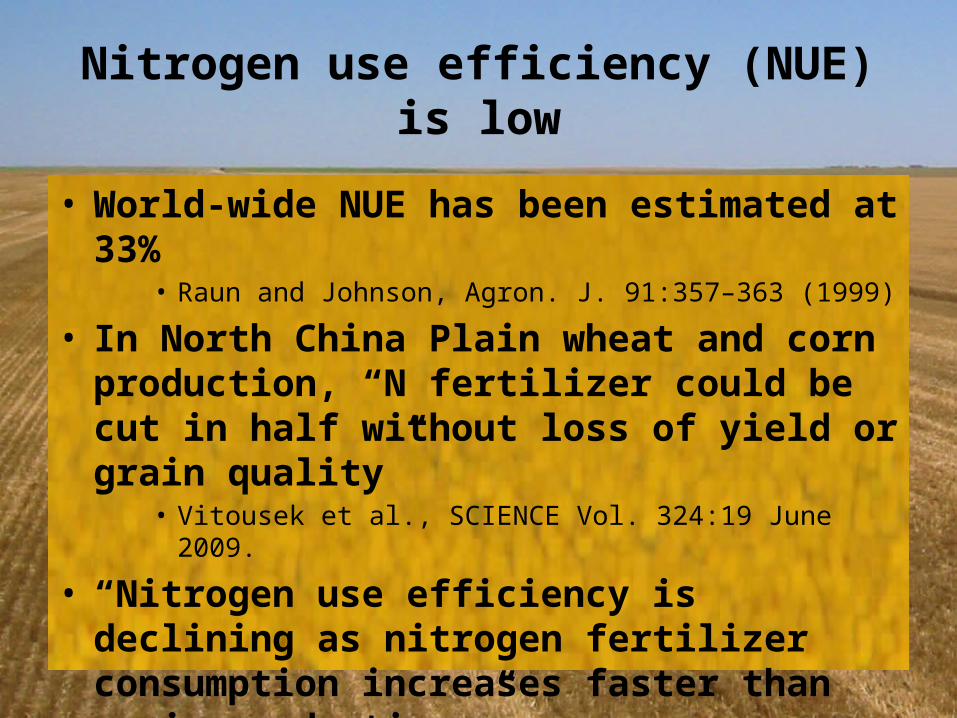
Nitrogen use efficiency (NUE) is low
• World-wide NUE has been estimated at 33%• Raun and Johnson, Agron. J. 91:357–363 (1999)
• In North China Plain wheat and corn production, “N fertilizer could be cut in half without loss of yield or grain quality”
• Vitousek et al., SCIENCE Vol. 324:19 June 2009.
• “Nitrogen use efficiency is declining as nitrogen fertilizer consumption increases faster than grain production.”
• Current world fertilizer trends and outlook to 2011/12. FAO, Rome, 2008.
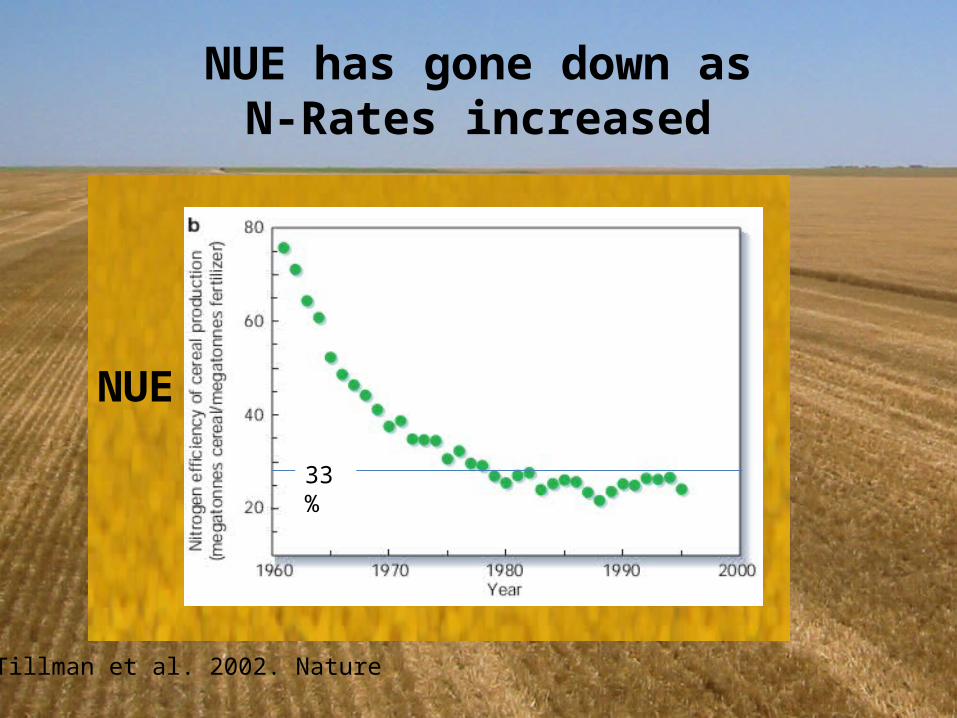
NUE has gone down asN-Rates increased
NUE
Tillman et al. 2002. Nature
33%
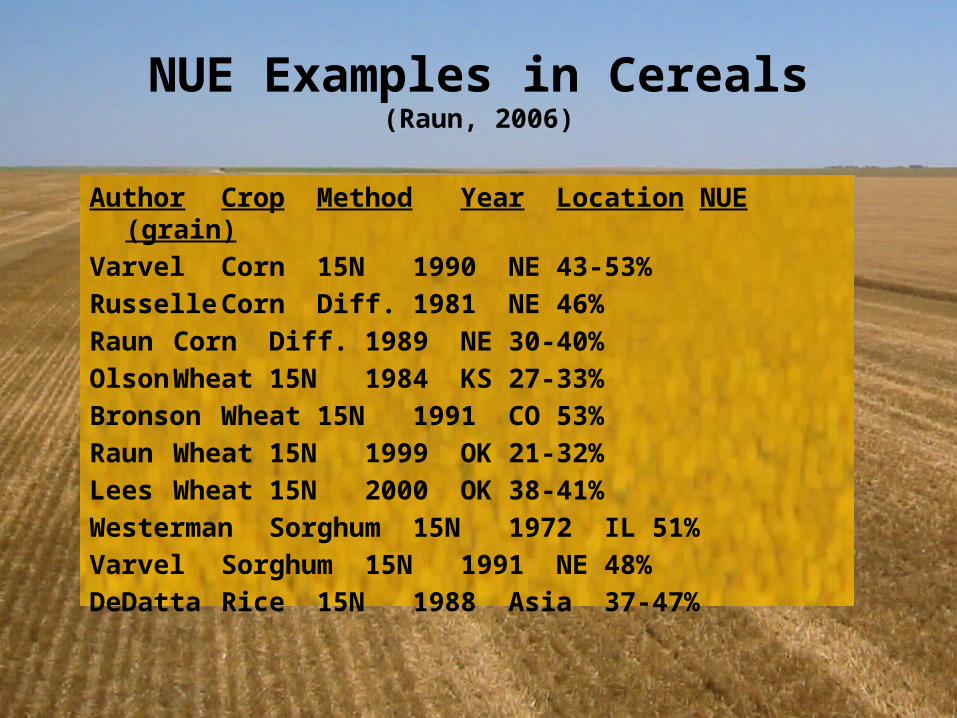
NUE Examples in Cereals(Raun, 2006)
Author Crop Method Year LocationNUE (grain)Varvel Corn 15N 1990 NE 43-53%Russelle Corn Diff. 1981 NE 46%Raun Corn Diff. 1989 NE 30-40%Olson Wheat 15N 1984 KS 27-33%Bronson Wheat 15N 1991 CO 53%Raun Wheat 15N 1999 OK 21-32%Lees Wheat 15N 2000 OK 38-41%Westerman Sorghum 15N 1972 IL 51%Varvel Sorghum 15N 1991 NE 48%DeDatta Rice 15N 1988 Asia 37-47%
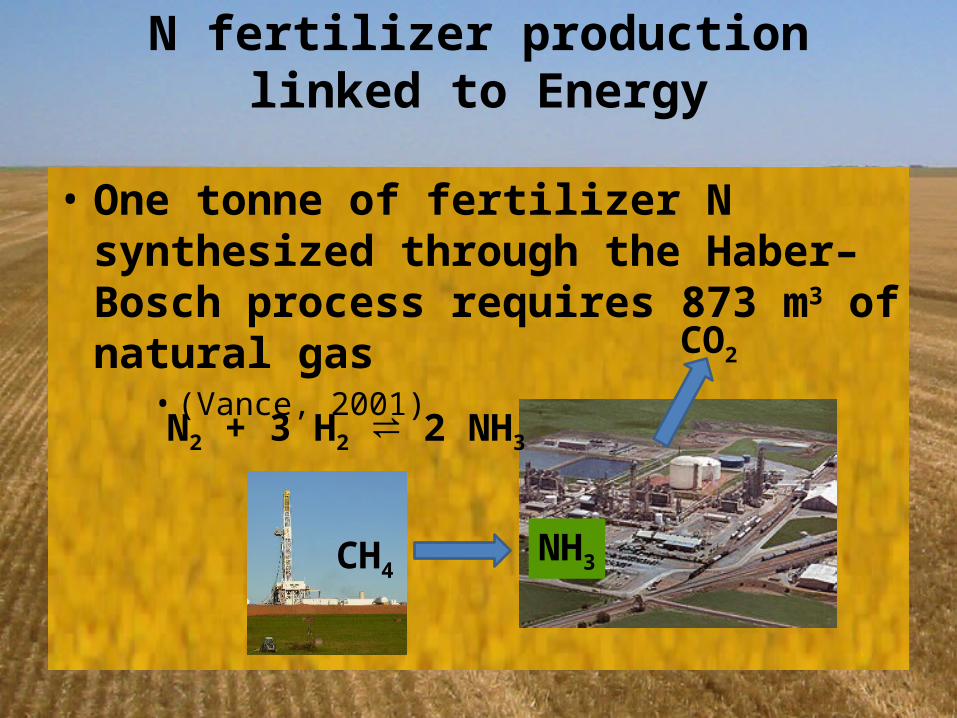
N fertilizer production linked to Energy
• One tonne of fertilizer N synthesized through the Haber–Bosch process requires 873 m3 of natural gas
• (Vance, 2001)
N2 + 3 H2 2 NH⇌ 3
CH4NH3
CO2
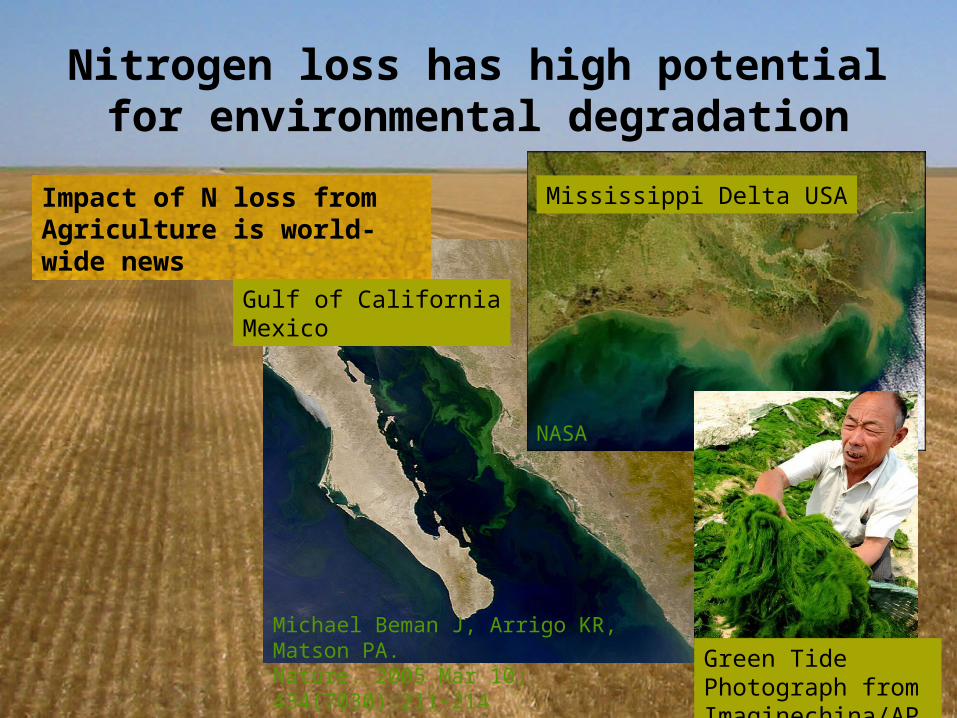
Nitrogen loss has high potential for environmental degradation
Michael Beman J, Arrigo KR, Matson PA. Nature. 2005 Mar 10; 434(7030):211-214
NASA
Green Tide Photograph from Imaginechina/AP
Impact of N loss from Agriculture is world-wide news
Gulf of CaliforniaMexico
Mississippi Delta USA
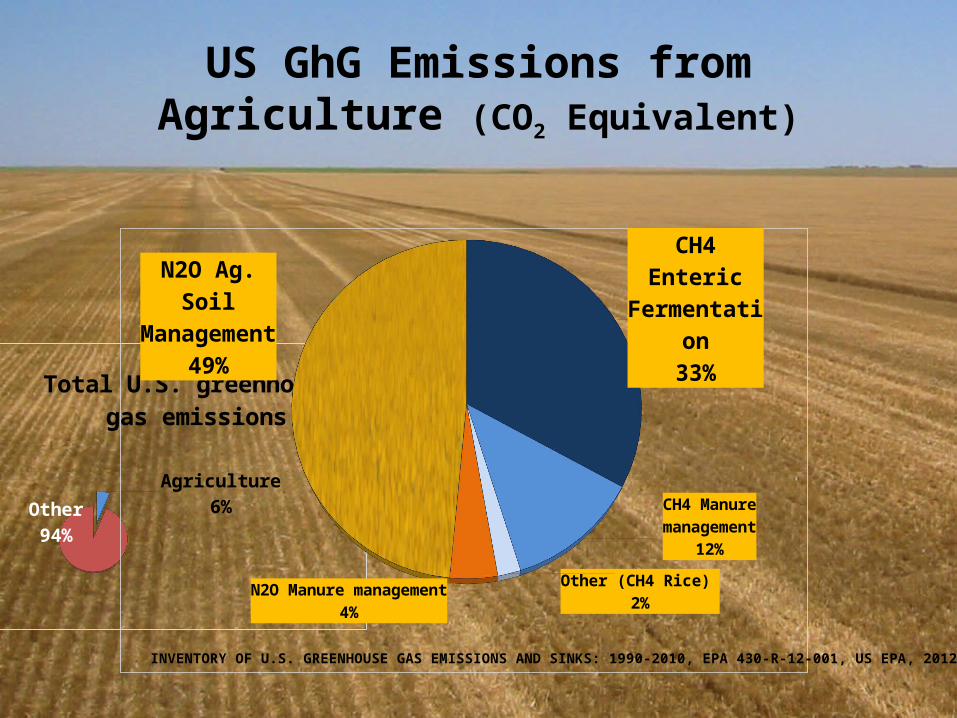
US GhG Emissions from Agriculture (CO2 Equivalent)
Agriculture6%
Other94%
Total U.S. greenhouse gas emissions
CH4 Enteric Fermentation
33%
CH4 Manure management
12%
Other (CH4 Rice) 2%N2O Manure management
4%
N2O Ag. Soil Management
49%
INVENTORY OF U.S. GREENHOUSE GAS EMISSIONS AND SINKS: 1990-2010, EPA 430-R-12-001, US EPA, 2012
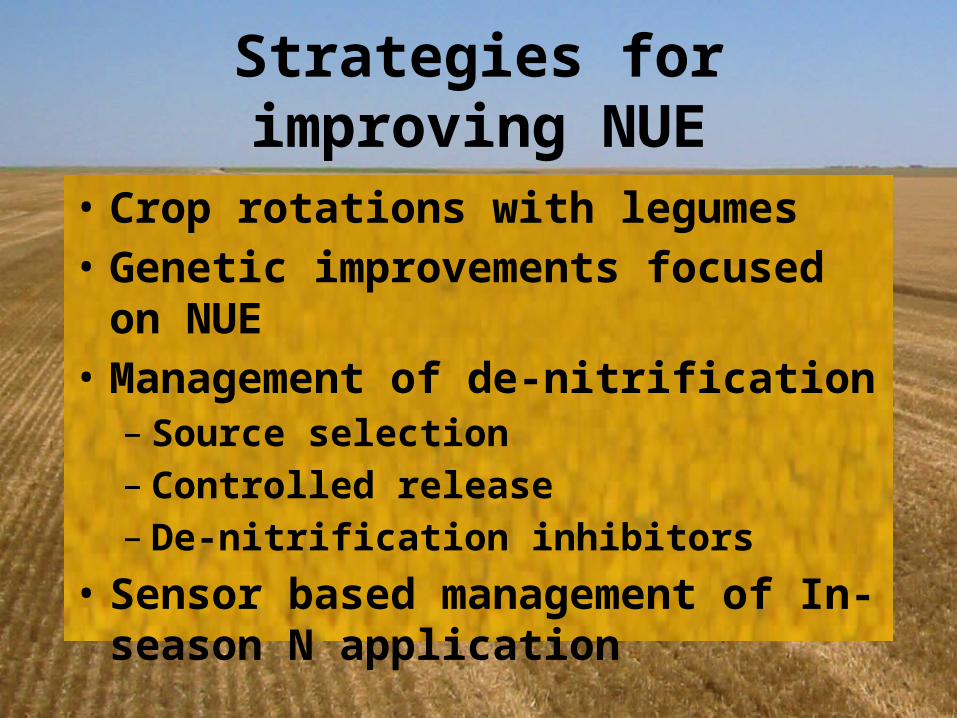
Strategies for improving NUE
• Crop rotations with legumes• Genetic improvements focused on NUE• Management of de-nitrification
– Source selection– Controlled release– De-nitrification inhibitors
• Sensor based management of In-season N application
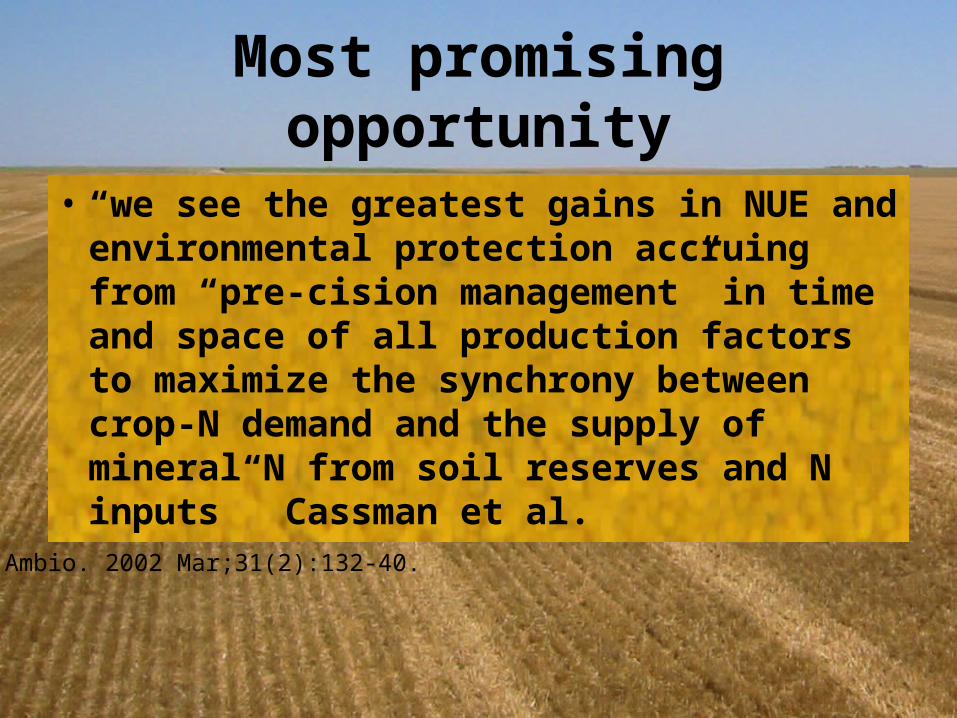
Most promising opportunity
• “we see the greatest gains in NUE and environmental protection accruing from “pre-cision management” in time and space of all production factors to maximize the synchrony between crop-N demand and the supply of mineral N from soil reserves and N inputs” Cassman et al.
Ambio. 2002 Mar;31(2):132-40.
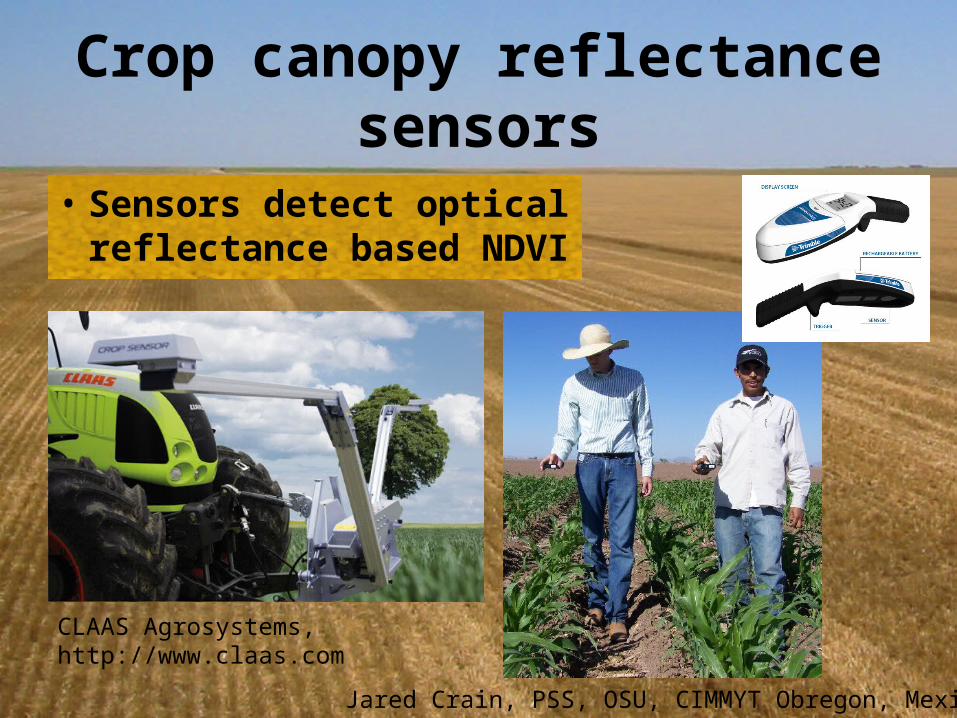
Crop canopy reflectance sensors
• Sensors detect optical reflectance based NDVI
CLAAS Agrosystems, http://www.claas.com
Jared Crain, PSS, OSU, CIMMYT Obregon, Mexico
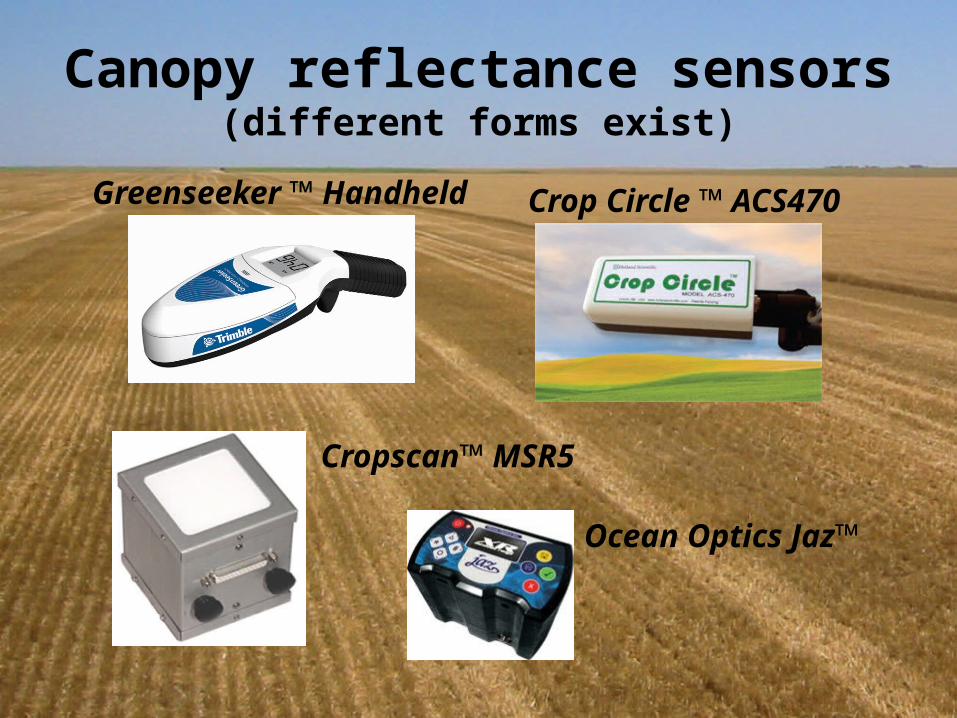
Canopy reflectance sensors(different forms exist)
Crop Circle ™ ACS470Greenseeker ™ Handheld
Cropscan™ MSR5
Ocean Optics Jaz™
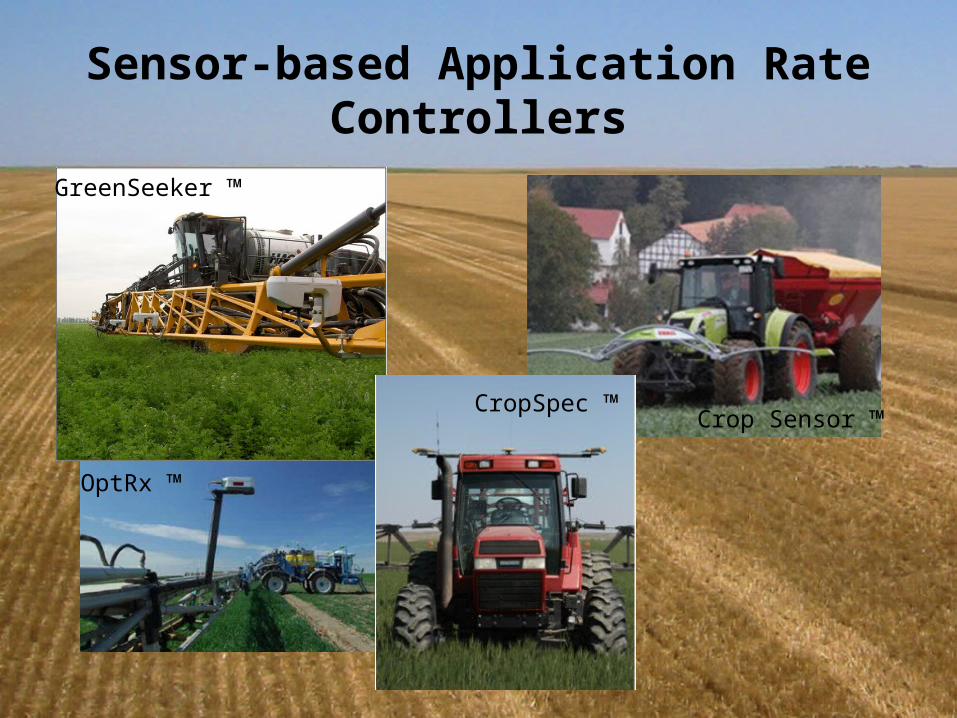
Sensor-based Application Rate Controllers
GreenSeeker ™
OptRx ™
Crop Sensor ™CropSpec ™

550 6504500
0.1
0.2
0.3
0.4
0.5
0.6
0.7
0.8
0.9
1
400 500 600 700 800
Wavelength, nm
Refle
ctan
ce
0 Nitrogen
100 lb Nitrogen/ac
Winter Wheat at Feekes 5 in potted soil
Spectral Response to Nitrogen
Measure of living plant cell’s ability to reflect infrared lightPhotosynthetic
Potential
REDNIR
REDNIRNDVI
0
1
2
3
4
5
6
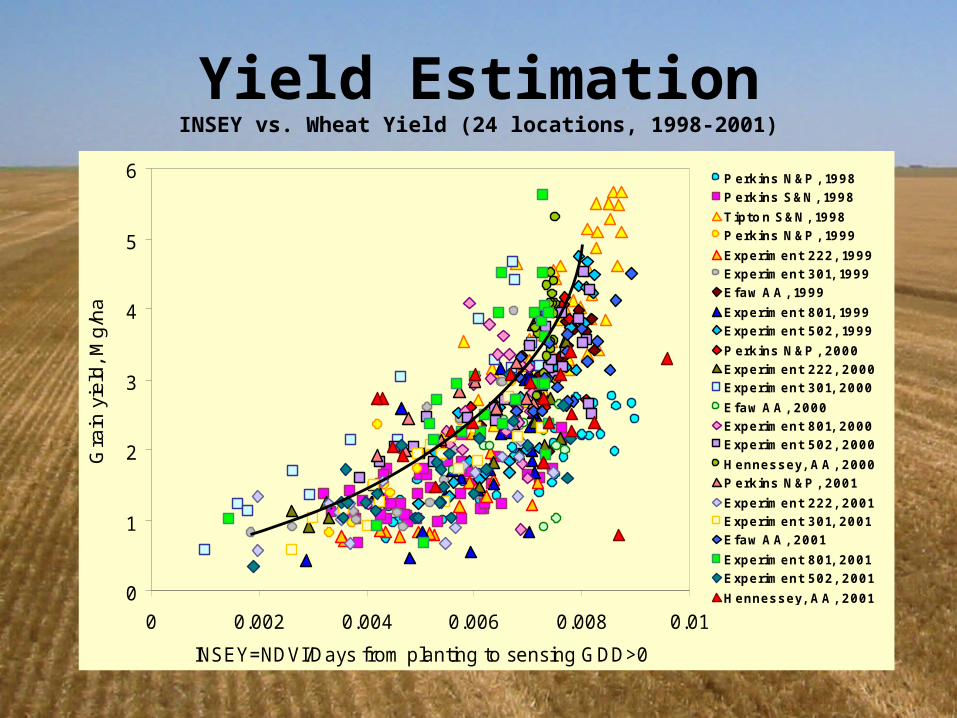
0 0.002 0.004 0.006 0.008 0.01
INSEY=NDVI/Days from planting to sensing GDD>0
Gra
in y
ield
, Mg/
ha
P erkins N&P , 1998P erkins S&N, 1998Tipton S&N, 1998P erkins N&P , 1999Experiment 222, 1999Experiment 301, 1999Efaw A A, 1999Experiment 801, 1999Experiment 502, 1999P erkins N&P , 2000Experiment 222, 2000Experiment 301, 2000Efaw A A, 2000Experiment 801, 2000Experiment 502, 2000Hennessey, AA , 2000P erkins N&P , 2001Experiment 222, 2001Experiment 301, 2001Efaw A A, 2001Experiment 801, 2001Experiment 502, 2001Hennessey, AA , 2001
y=0.4593e246.3x
R2=0.55
Yield EstimationINSEY vs. Wheat Yield (24 locations, 1998-2001)
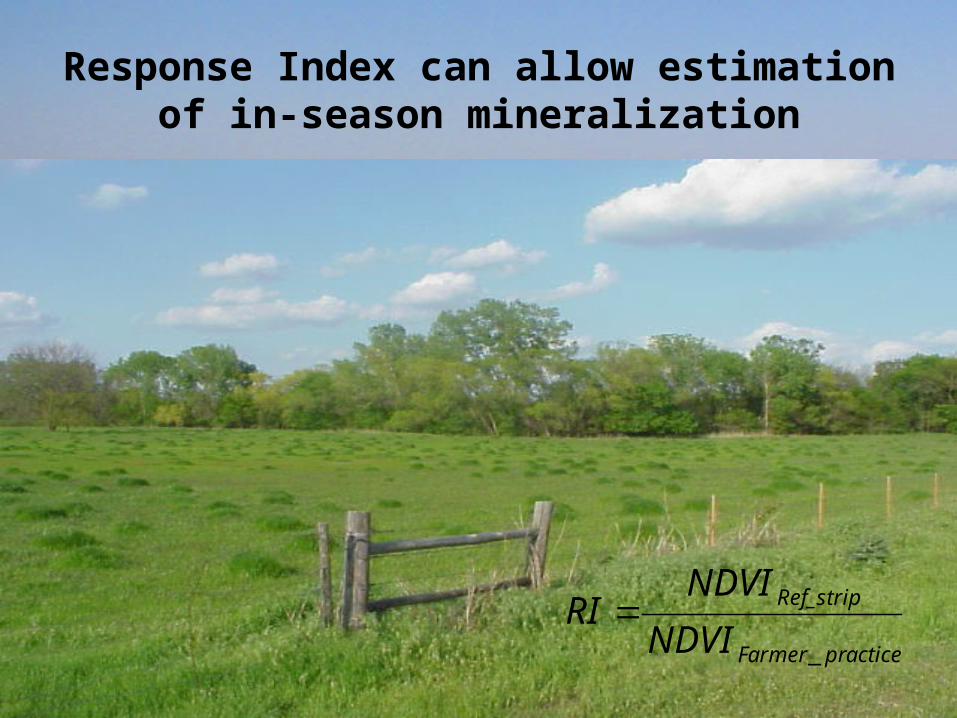
Response Index can allow estimation of in-season mineralization
practiceFarmer
Ref_strip
NDVINDVI
RI_
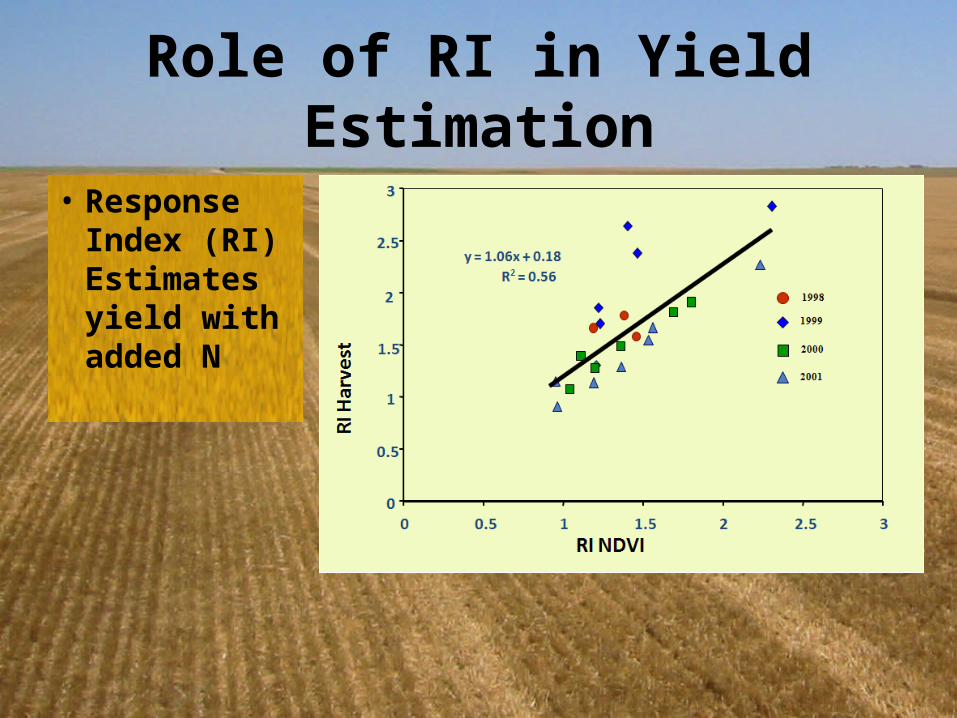
Role of RI in Yield Estimation
• Response Index (RI) Estimates yield with added N
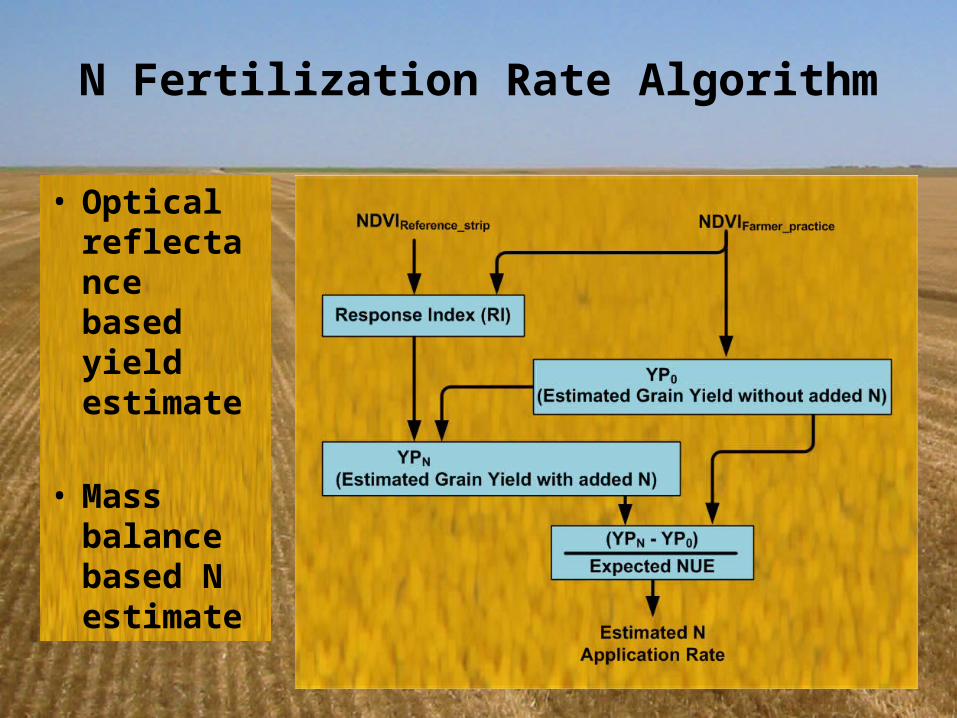
N Fertilization Rate Algorithm
• Optical reflectance based yield estimate
• Mass balance based N estimate
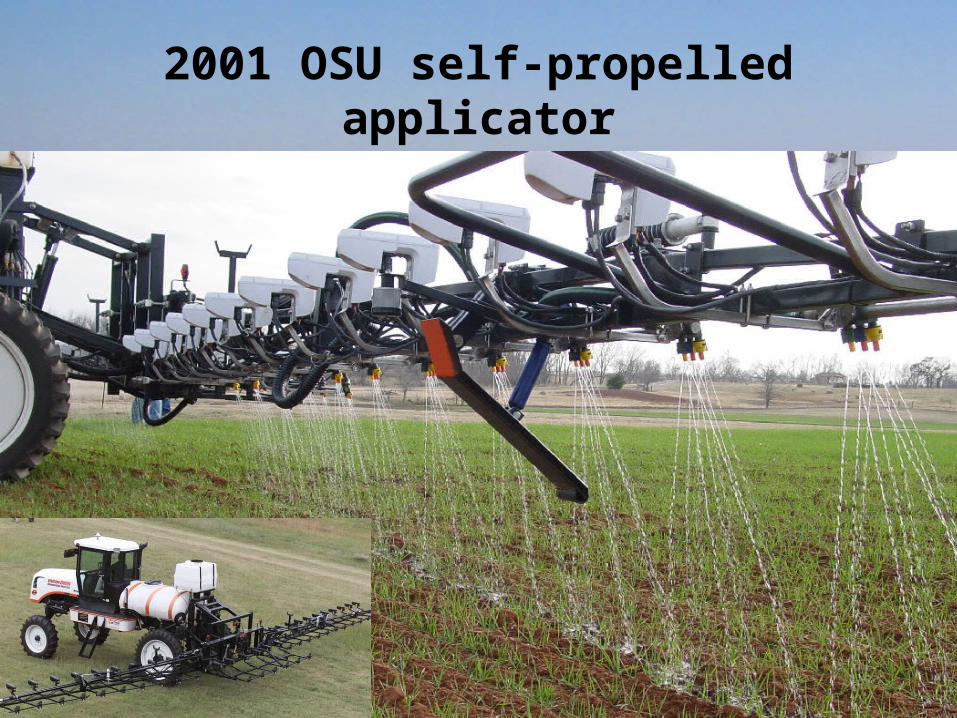
2001 OSU self-propelled applicator

Light generation
Light signal
Light detection
Valve settings· Calculate NDVI· Lookup valve setting· Apply valve setting· Send data to UI
“Sensor”Valves
and Nozzles
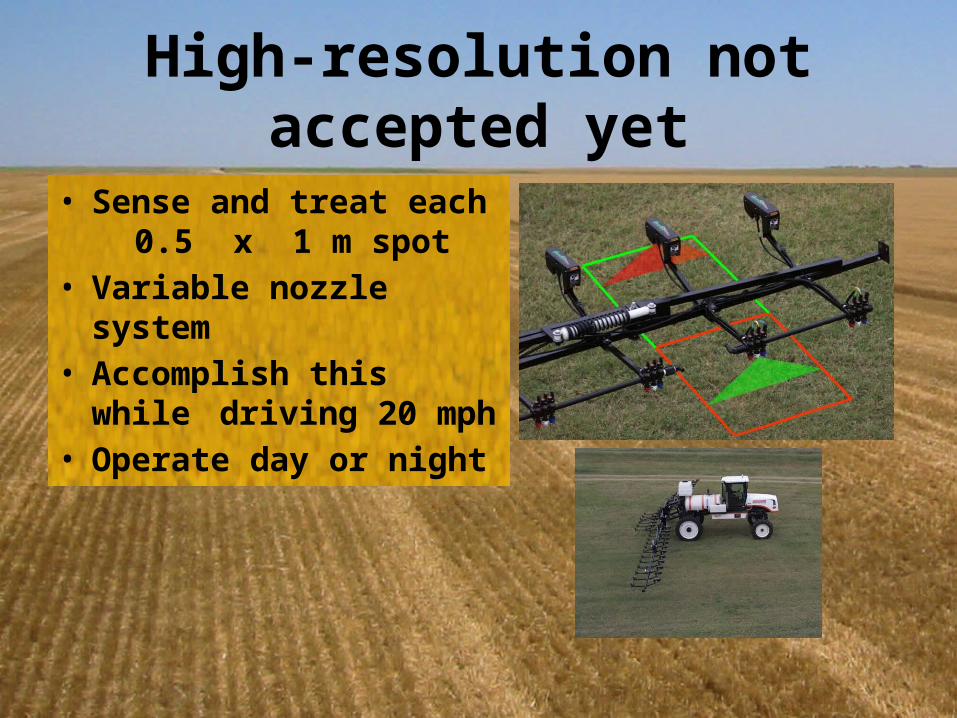
High-resolution not accepted yet
• Sense and treat each0.5 x 1 m spot
• Variable nozzle system• Accomplish this while
driving 20 mph• Operate day or night
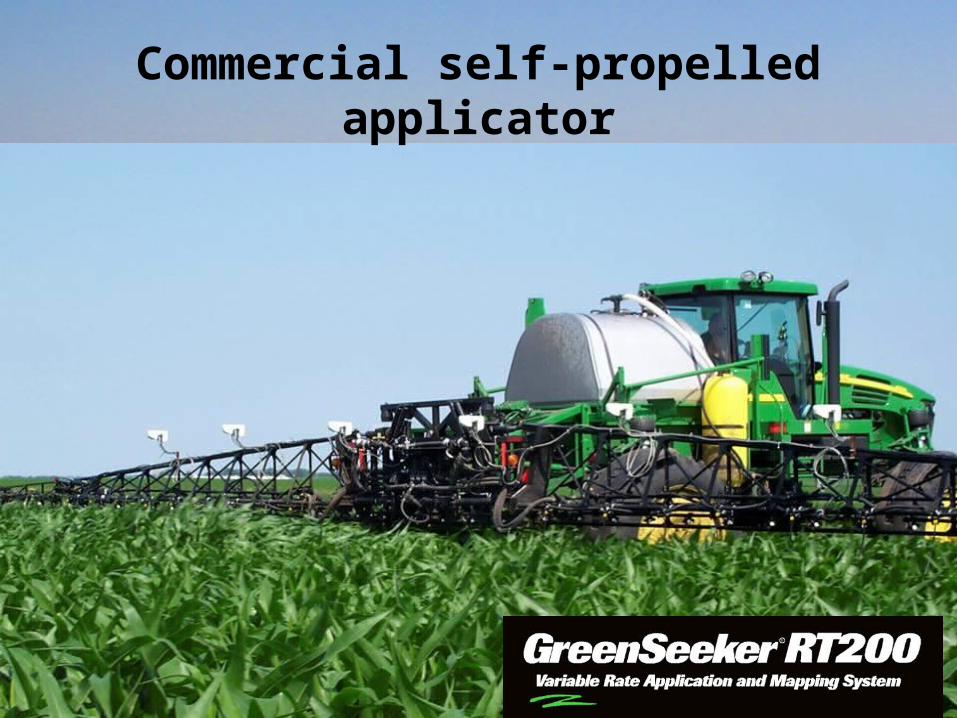
Commercial self-propelled applicator
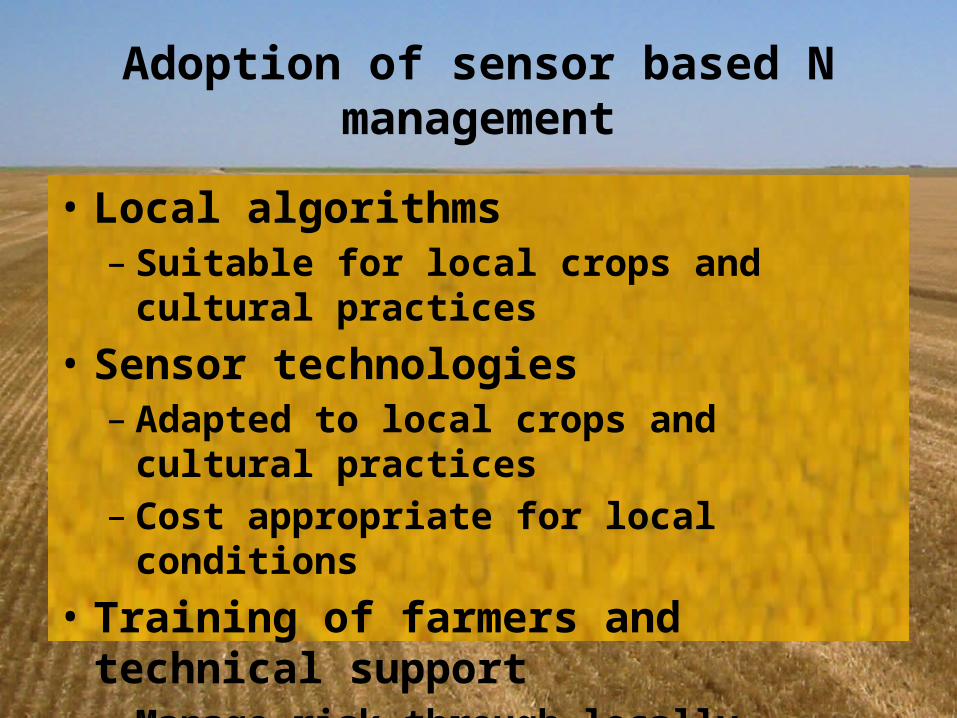
Adoption of sensor based N management
• Local algorithms– Suitable for local crops and cultural practices
• Sensor technologies– Adapted to local crops and cultural practices– Cost appropriate for local conditions
• Training of farmers and technical support– Manage risk through locally demonstrated results
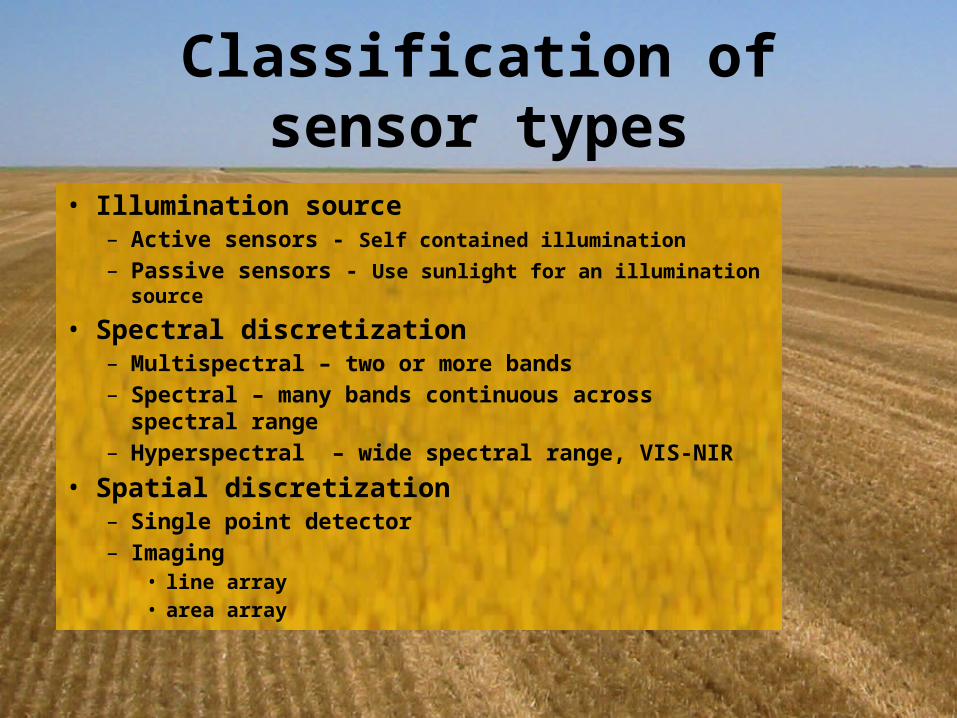
Classification of sensor types
• Illumination source– Active sensors - Self contained illumination– Passive sensors - Use sunlight for an illumination source
• Spectral discretization– Multispectral – two or more bands– Spectral – many bands continuous across spectral range– Hyperspectral – wide spectral range, VIS-NIR
• Spatial discretization– Single point detector– Imaging
• line array• area array
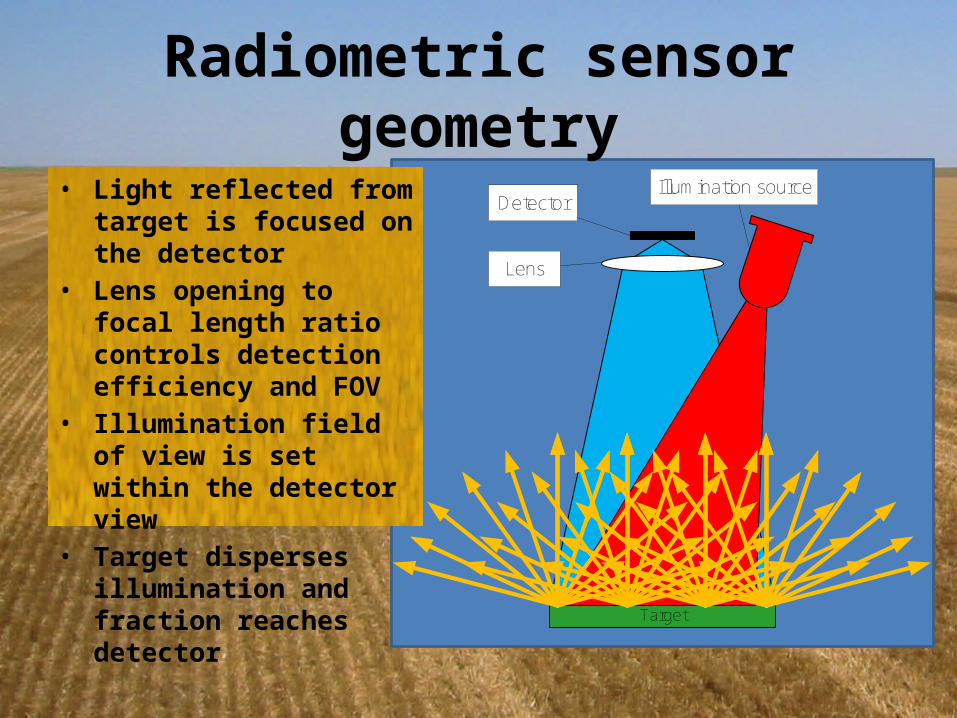
• Light reflected from target is focused on the detector
• Lens opening to focal length ratio controls detection efficiency and FOV
• Illumination field of view is set within the detector view
• Target disperses illumination and fraction reaches detector
Target
Lens
DetectorIllumination source
Radiometric sensor geometry
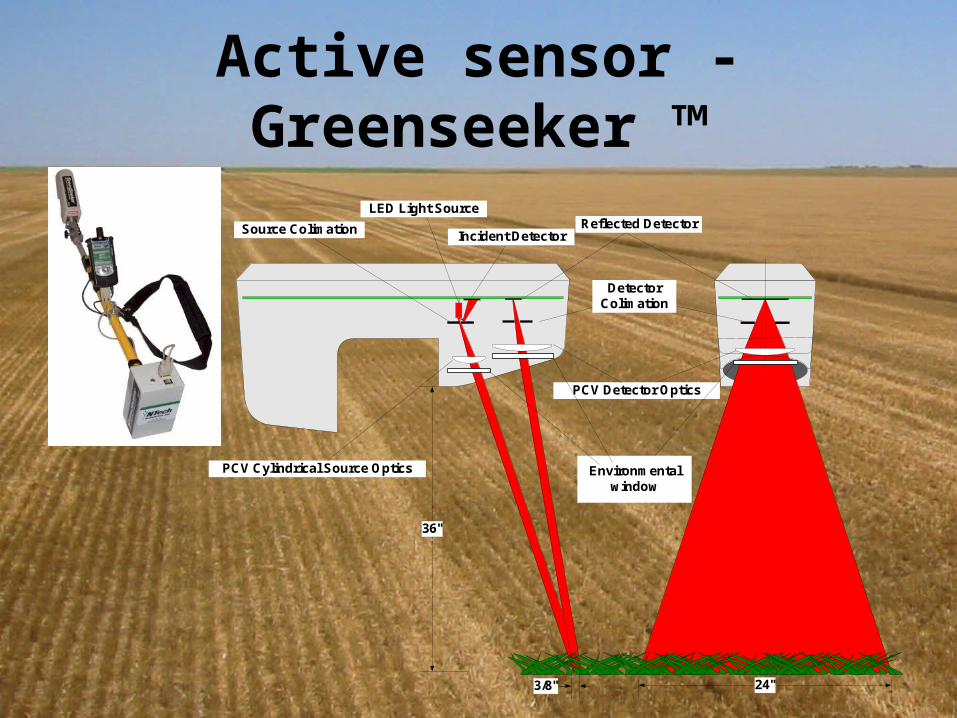
Active sensor - Greenseeker ™
LED Light SourceSource Colimation
PCV Cylindrical Source Optics
PCV Detector Optics
24"
36"
Detector Colimation
Environmental window
3/8"
Reflected DetectorIncident Detector

Pocket sensor optical geometry
LED Array Light Source
Source Optics
Fresnel Detector Optics
12"
39"
12"
Reflected DetectorLED Array Light Sources
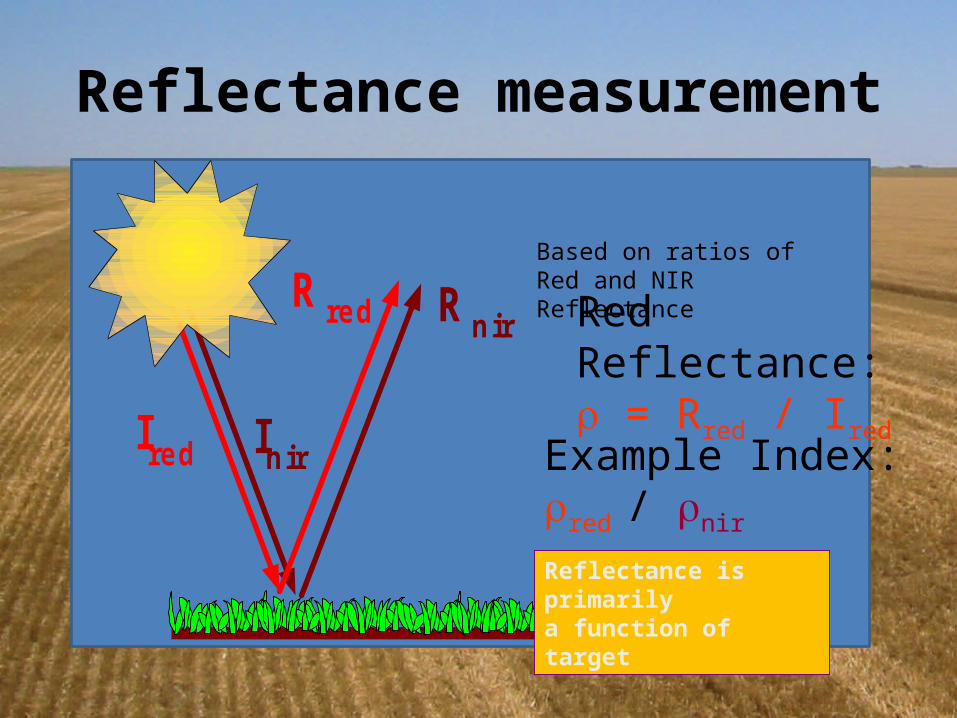
Inir
Rnir
Ired
R red
Reflectance measurement
Based on ratios ofRed and NIR Reflectance
Red Reflectance: = Rred / Ired
Example Index:red / nir
Reflectance is primarilya function of target
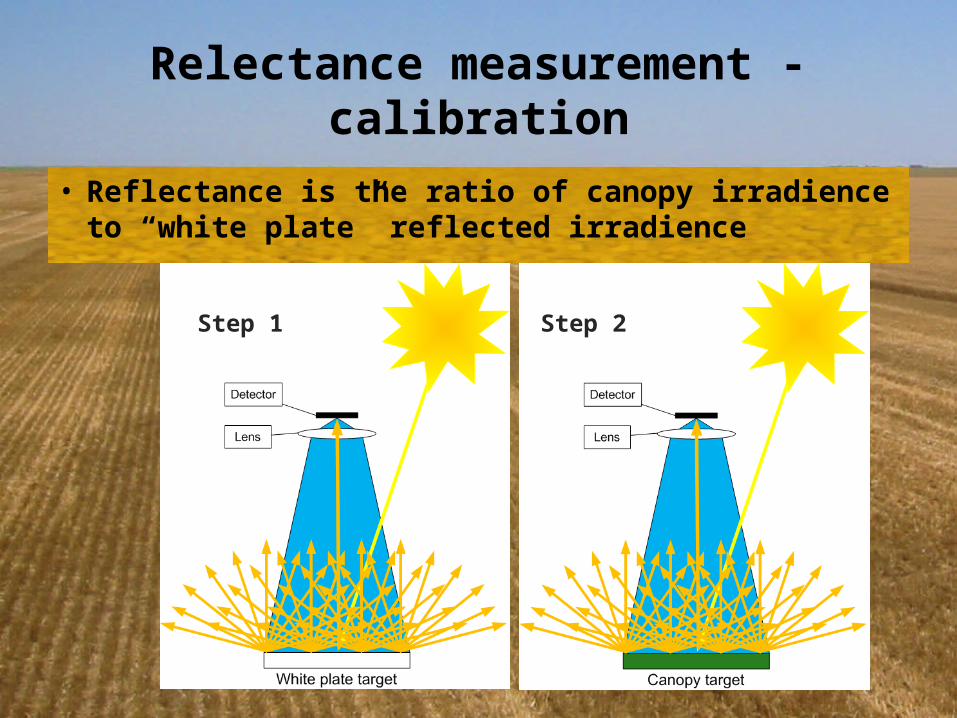
Relectance measurement - calibration
• Reflectance is the ratio of canopy irradience to “white plate” reflected irradience
Step 1 Step 2

Stored “white reference” sensor• Calibrated to a “white plate” to produce reflectance• “White” values are stored until next calibration
Technique applies to:• multi spectral sensors• fiber optic spectrometers• imaging arrays
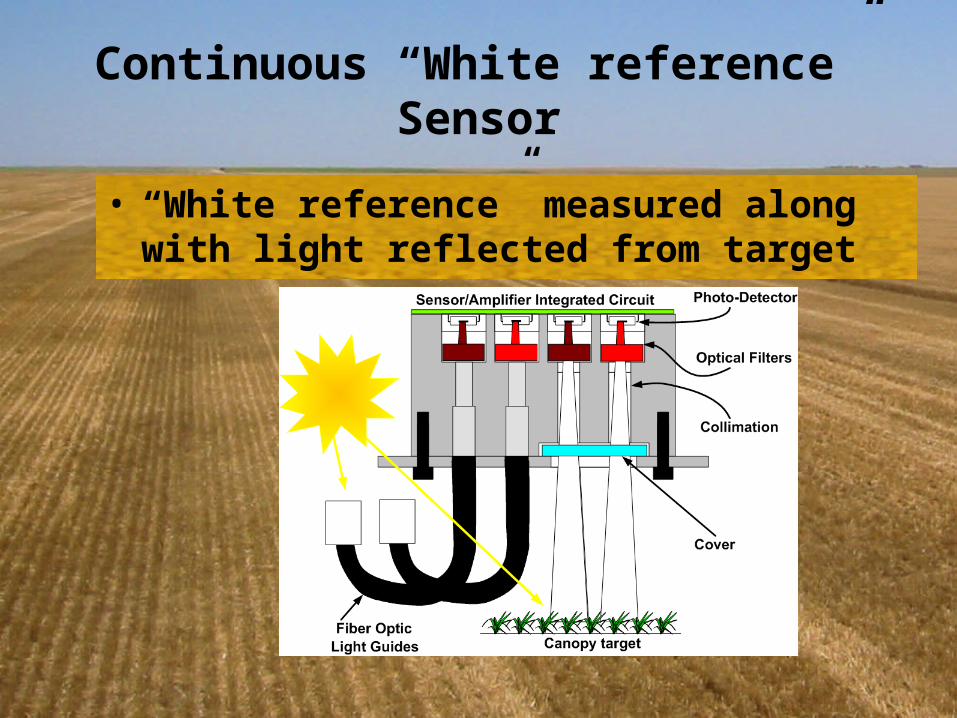
Continuous “White reference” Sensor
• “White reference” measured along with light reflected from target

Photometric detection• Photodiode sensor
– Dominant or exclusive detector for plant canopy sensors
– Incident photons in the depletion region result in conduction and current flow across the region
n- region
p + Active AreaInsulation
Depletion region
Back Metalizationn + Back Diffusion
Front Contact
Rear Contact
Incident light
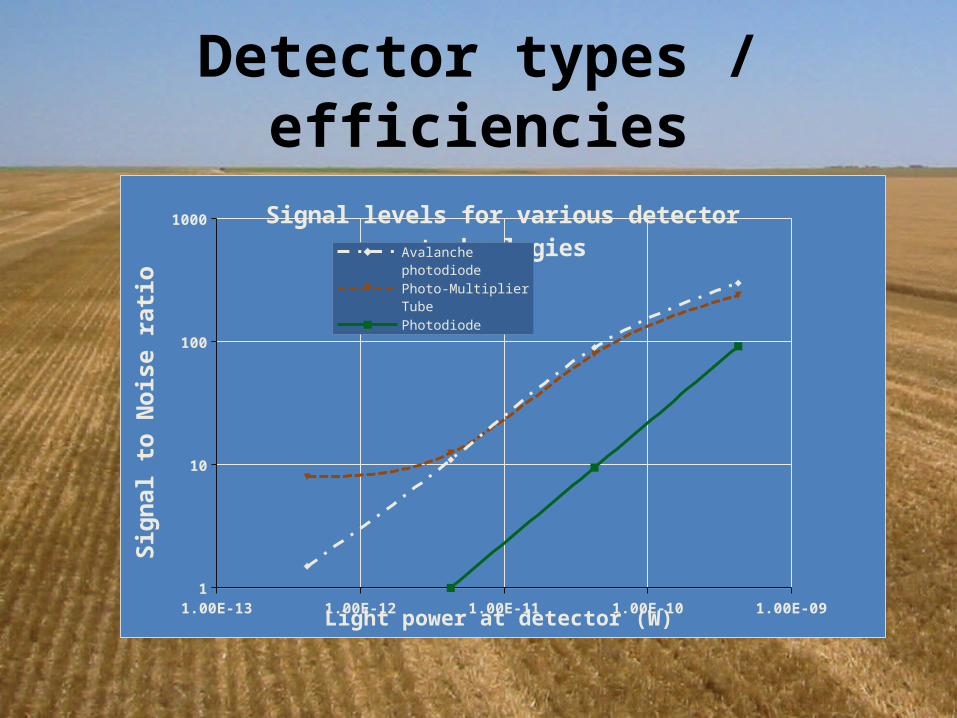
Detector types / efficiencies
1.00E-13 1.00E-12 1.00E-11 1.00E-10 1.00E-091
10
100
1000 Signal levels for various detector technologies
Avalanche photodiode
Photo-Multiplier Tube
Photodiode
Light power at detector (W)
Sign
al to
Noi
se ra
tio
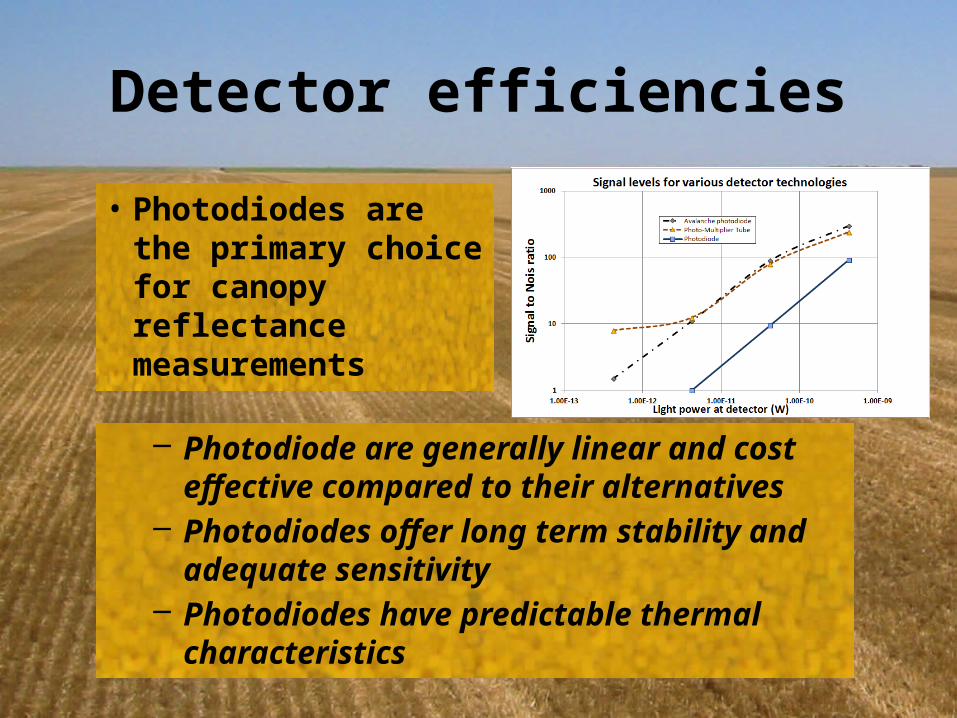
Detector efficiencies
• Photodiodes are the primary choice for canopy reflectance measurements
– Photodiode are generally linear and cost effective compared to their alternatives
– Photodiodes offer long term stability and adequate sensitivity
– Photodiodes have predictable thermal characteristics

Photodiode fundamentals
• Based on PN or PIN junction diode– photon absorption in the
depletion region induces current flow
• Spectral sensitivity
I
P
N
+
-
h
RLIL
electron
hole
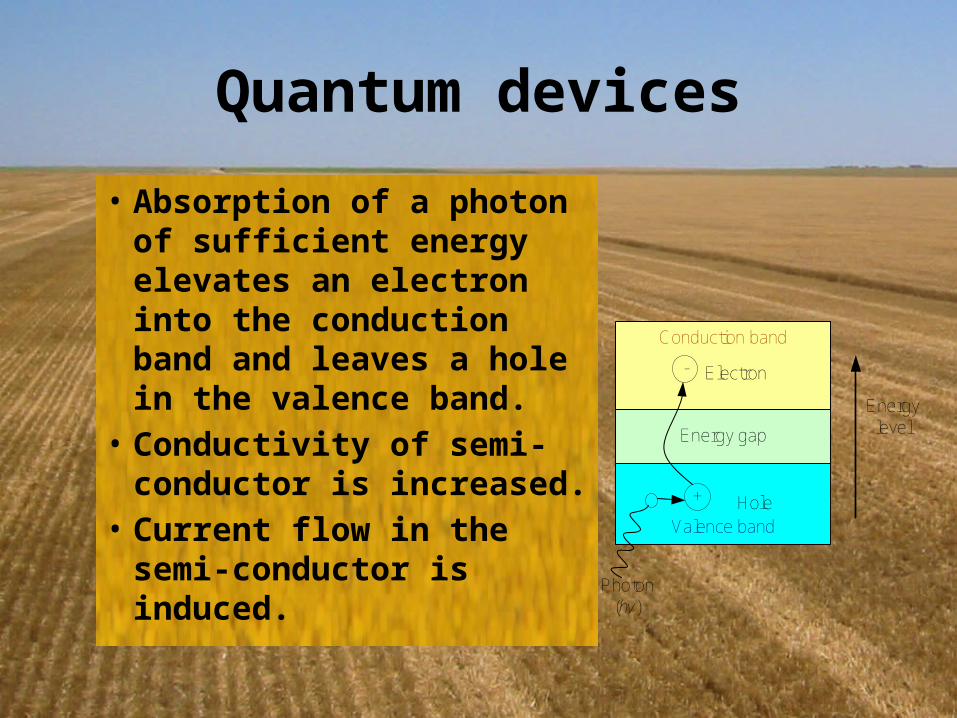
Quantum devices
• Absorption of a photon of sufficient energy elevates an electron into the conduction band and leaves a hole in the valence band.
• Conductivity of semi-conductor is increased.
• Current flow in the semi-conductor is induced.
Conduction band
Energy gap
Valence band
Energylevel
+
-
Photon(hv)
Hole
Electron
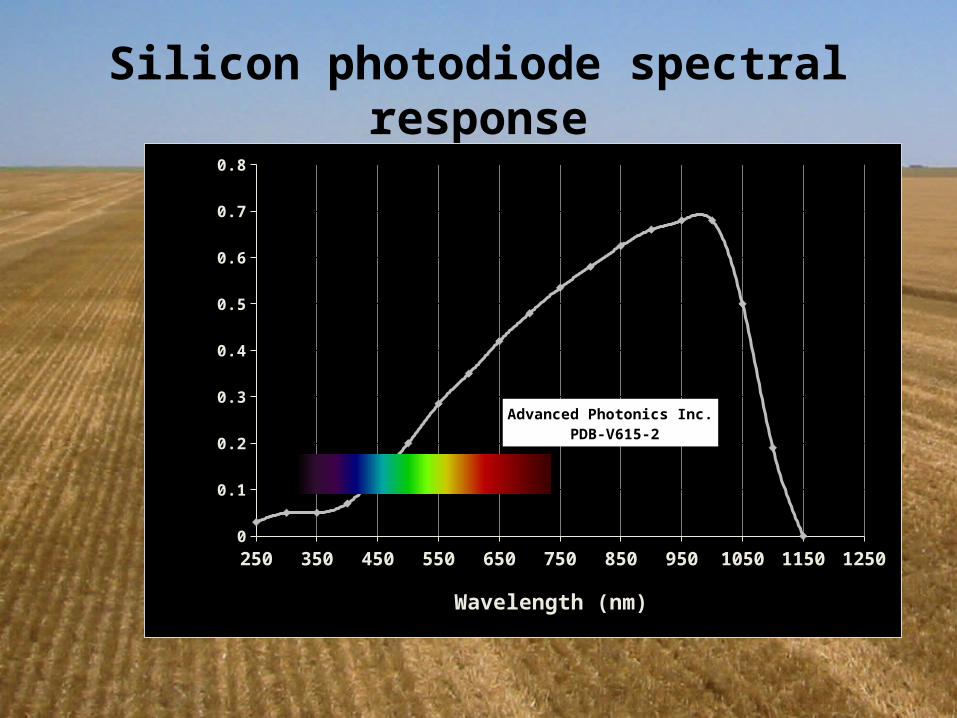
Silicon photodiode spectral response
250 350 450 550 650 750 850 950 1050 1150 12500
0.1
0.2
0.3
0.4
0.5
0.6
0.7
0.8
Wavelength (nm)
Resp
onsiv
ity (A
/W)
Advanced Photonics Inc. PDB-V615-2
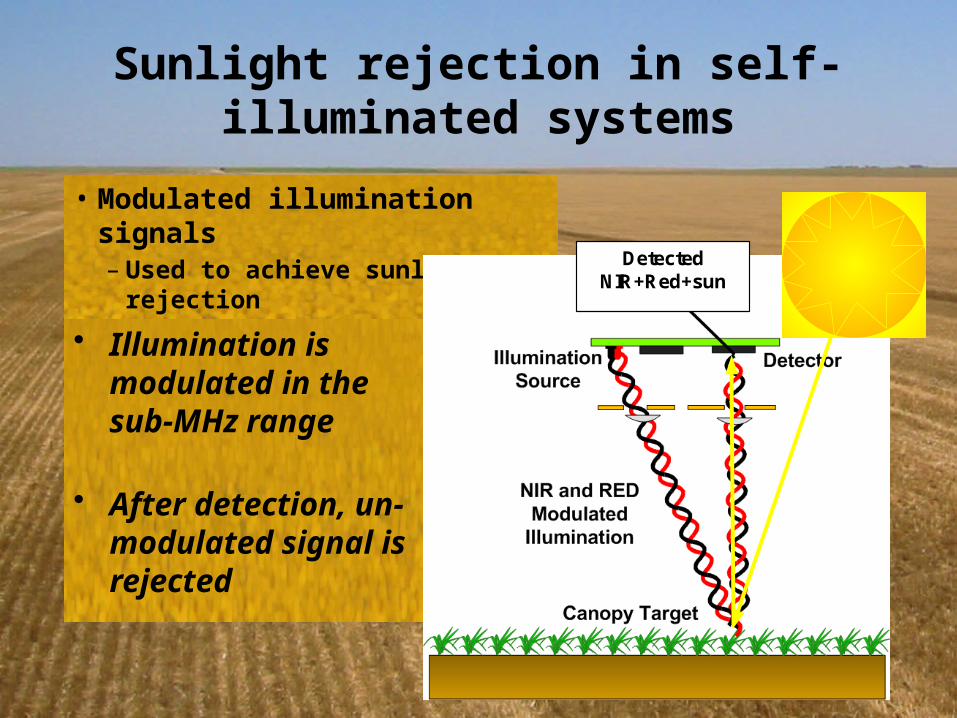
Sunlight rejection in self-illuminated systems
• Modulated illumination signals– Used to achieve sunlight rejection
Detected NIR+Red+sun
• Illumination is modulated in the sub-MHz range
• After detection, un-modulated signal is rejected
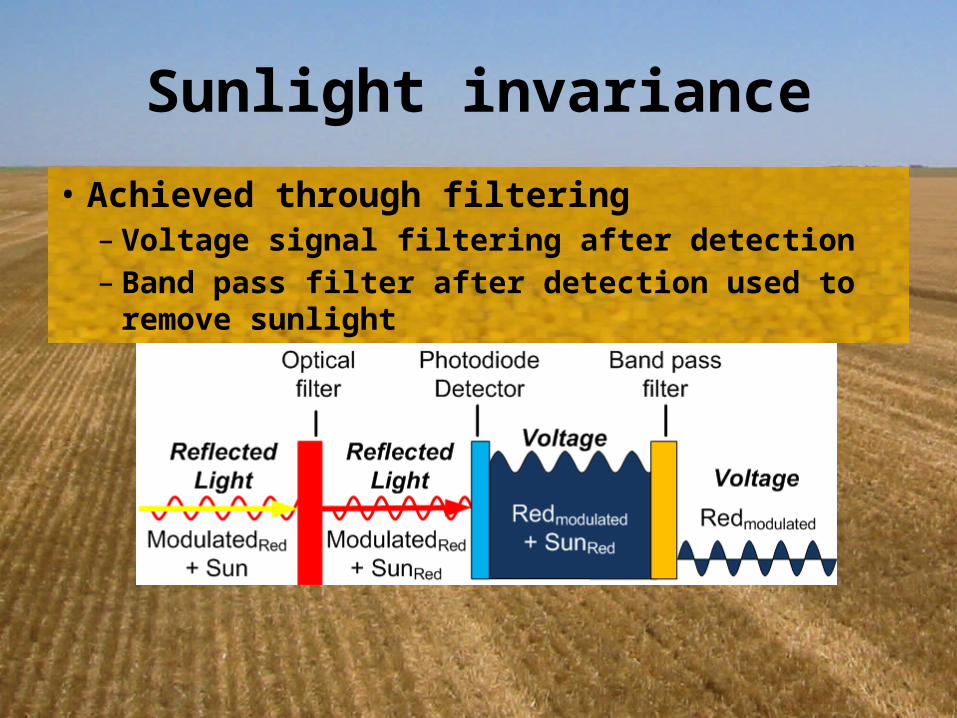
Sunlight invariance
• Achieved through filtering– Voltage signal filtering after detection– Band pass filter after detection used to remove sunlight
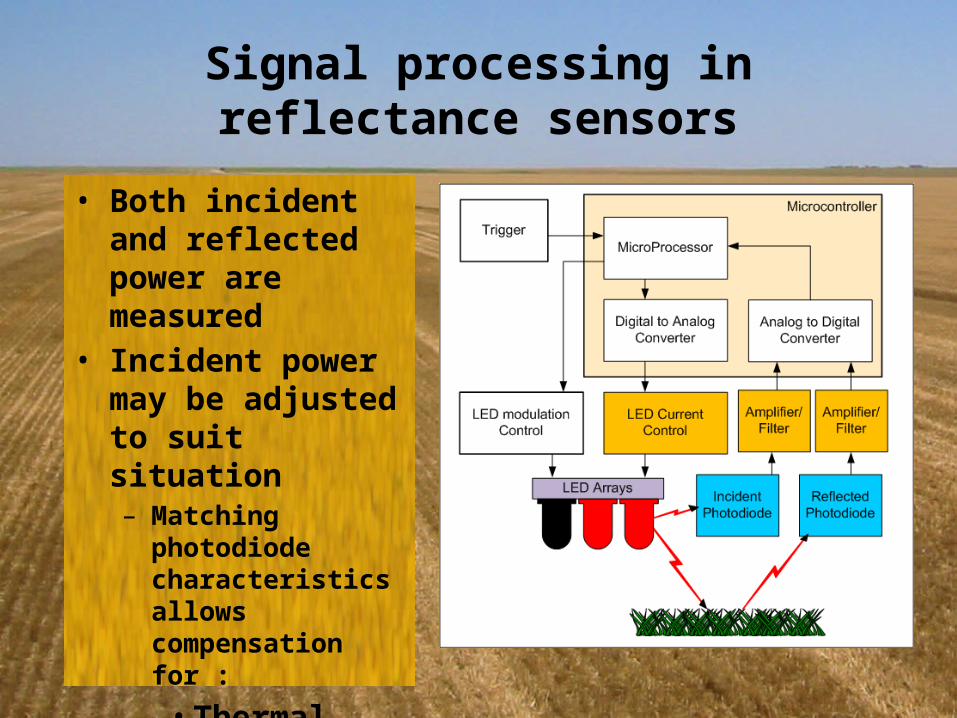
Signal processing in reflectance sensors
• Both incident and reflected power are measured
• Incident power may be adjusted to suit situation– Matching photodiode
characteristics allows compensation for :
• Thermal effects• LED aging
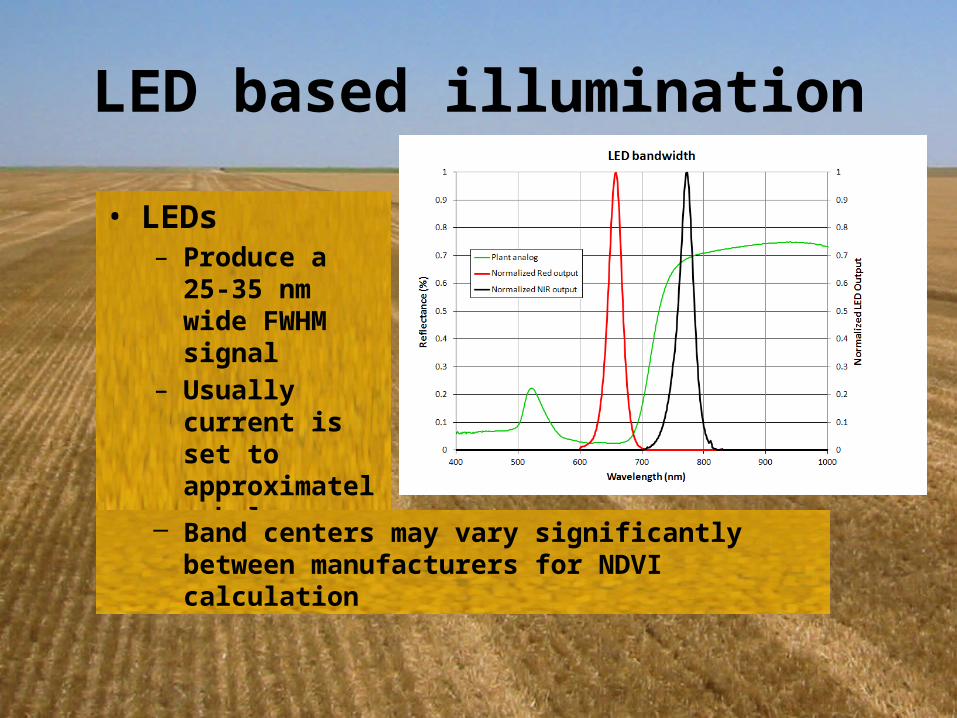
LED based illumination
• LEDs– Produce a 25-35
nm wide FWHM signal
– Usually current is set to approximately balance detector levels
– Band centers may vary significantly between manufacturers for NDVI calculation
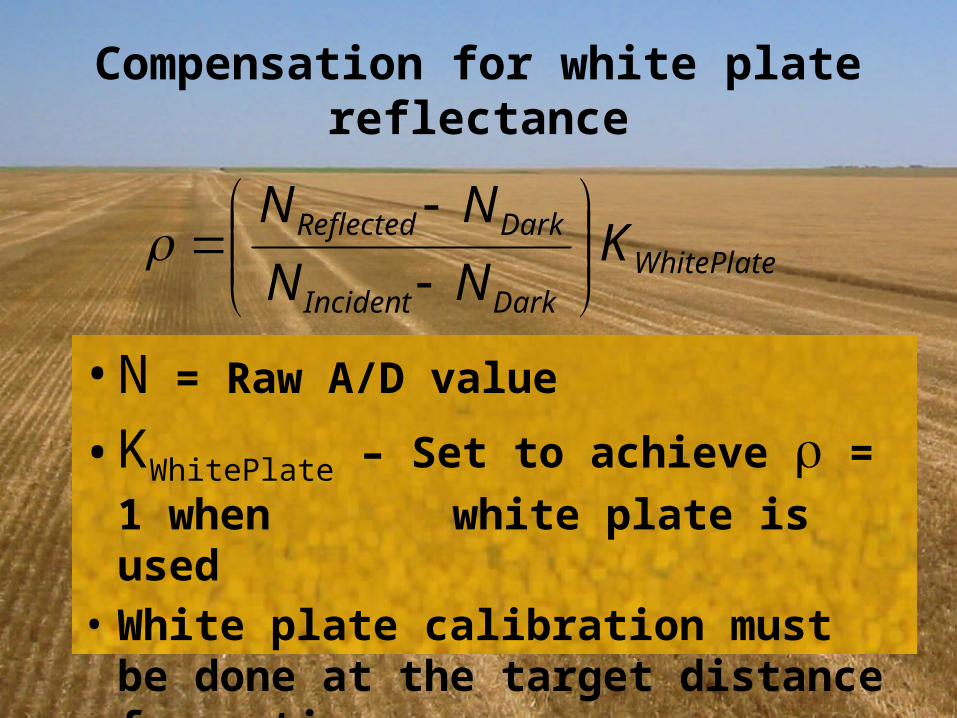
Compensation for white plate reflectance
• N = Raw A/D value
• KWhitePlate – Set to achieve = 1 when white plate is used
• White plate calibration must be done at the target distance for active sensors
WhitePlateDarkIncident
DarkReflected KNNNN
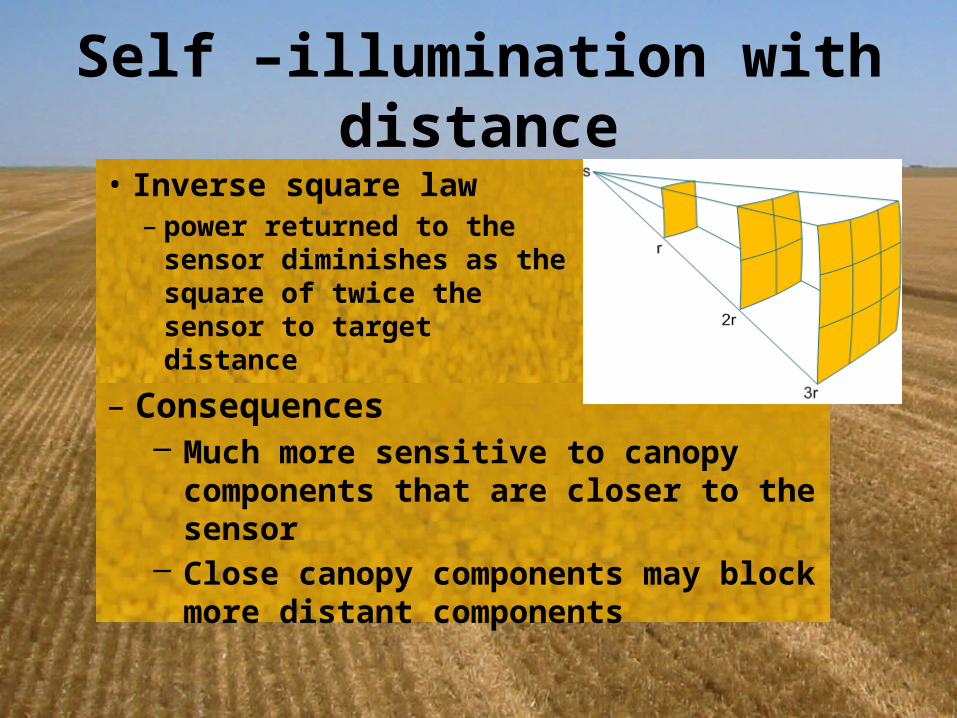
Self –illumination with distance• Inverse square law
– power returned to the sensor diminishes as the square of twice the sensor to target distance
– Consequences– Much more sensitive to canopy components
that are closer to the sensor– Close canopy components may block more
distant components
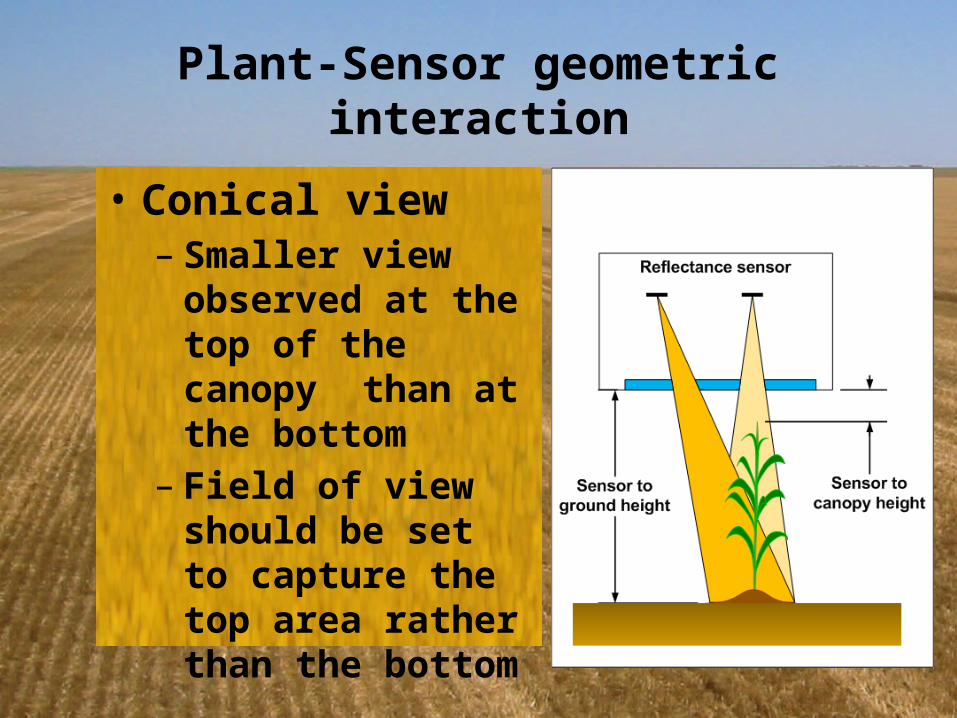
Plant-Sensor geometric interaction
• Conical view– Smaller view observed
at the top of the canopy than at the bottom
– Field of view should be set to capture the top area rather than the bottom
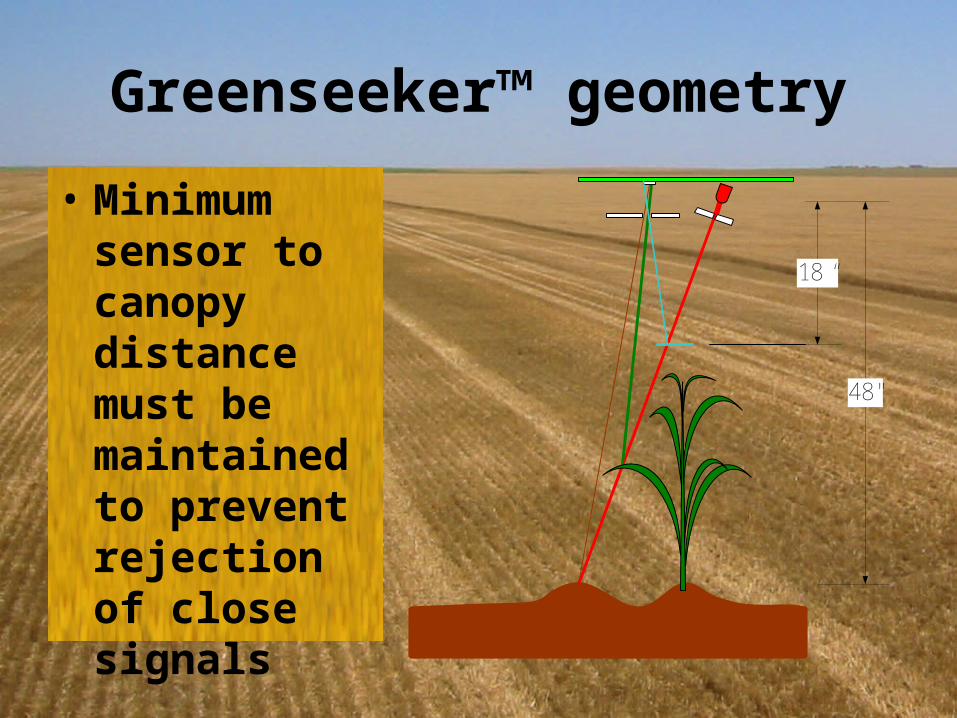
Greenseeker™ geometry
• Minimum sensor to canopy distance must be maintained to prevent rejection of close signals
18 “
48"
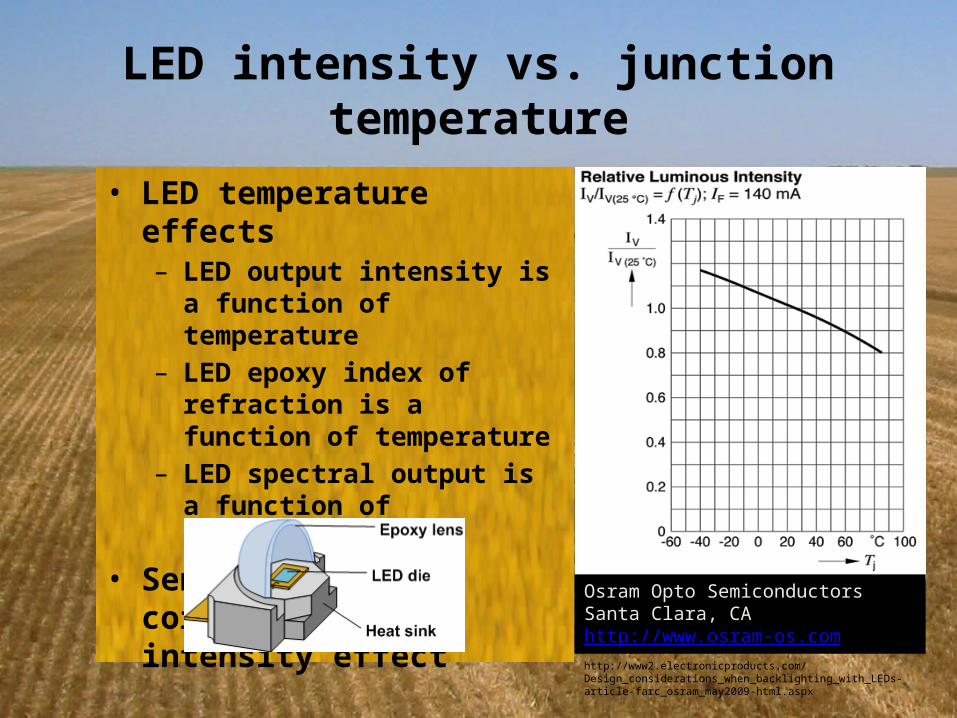
LED intensity vs. junction temperature
• LED temperature effects– LED output intensity is a function
of temperature– LED epoxy index of refraction is a
function of temperature– LED spectral output is a function
of temperature• Sensors normally correct for
the intensity effect
Osram Opto SemiconductorsSanta Clara, CAhttp://www.osram-os.comhttp://www2.electronicproducts.com/Design_considerations_when_backlighting_with_LEDs-article-farc_osram_may2009-html.aspx
Recommended


![Nitrogen Response, nitrogen use efficiency and water use …oar.icrisat.org/6853/7/Sawargaonkar_etal._2013-Post... · 2013-06-24 · ABSTRACT Sweet sorghum [Sorghum bicolor (L.) Moench]](https://img.pdfslide.net/doc/110x75/5ed1d13f4c3387347b4733cb/nitrogen-response-nitrogen-use-efficiency-and-water-use-oar-2013-06-24-abstract.jpg)