Nursing Education in Canada Statistics
2008-2009
Registered Nurse Workforce, Canadian Production: Potential New Supply
cna-aiic.ca casn.ca
ST
AT
IST
ICS

This report has been prepared by CNA and CASN
to provide information on a particular topic or topics.
The views and opinions expressed in this report do not necessarily reflect the views of the
CNA board of directors or the CASN board of directors.
All rights reserved. No part of this document may be reproduced, stored in a retrieval system,
or transcribed, in any form or by any means, electronic, mechanical, photocopying, recording, or
posted on any web, ftp or similar site, or otherwise, without written permission of the publisher.
© Canadian Nurses Association and Canadian Association of Schools of Nursing
Canadian Nurses Association
50 Driveway
Ottawa, ON K2P 1E2
Tel.: 613-237-2133
or 1-800-361-8404
Fax: 613-237-3520
Website: www.cna-aiic.ca
Canadian Association of
Schools of Nursing
99 Fifth Avenue, Suite 15
Ottawa, ON K1S 5K4
Tel.: 613-235-3150
Fax: 613-235-4476
Website: www.casn.ca
December 2010
ISBN 978-1-55119-339-7

1
Nursing Education Statistics 2008-2009
Message from Chief Executive Officer and Executive Director
The Canadian Nurses Association (CNA) and the Canadian Association of Schools of Nursing (CASN)
are pleased to present Nursing Education in Canada Statistics, 2008-2009 – Registered Nurse
Workforce, Canadian Production: Potential New Supply.
This annual report is an important instrument for national human resources planning in both the
nursing service and nursing education sectors. It represents the fruit of a strong partnership among
national and provincial bodies and effective collaborative relationships with multiple stakeholders.
The data presented support effective health human resources planning by providing statistical analysis
about:
the number of pre-licensure graduates eligible to apply for initial licensure/registration and
enter the registered nurse (RN) workforce;
the number of RNs obtaining graduate qualifications;
the number of nurse practitioner (NP) graduates;
innovations in nursing education program access and delivery;
the composition of faculty delivering nursing education; and
faculty retention, recruitment and leaves of absence.
In reviewing this year‟s results, we were struck by the variety of education models reported by schools
throughout Canada. Although graduates must demonstrate achievement of a common set of
competencies to obtain licensure, there are many education models and paths by which to reach that
objective. From the new entry-to-practice baccalaureate standard of British Columbia (three-year
programs instead of the traditional four years) to the emergence of degree-granting autonomy for
colleges in some provinces, the route to initial registration is a varied one. With findings reported on
111 schools, the landscape of nursing education is almost as diverse as our geographic landscape.
We extend our sincere thanks to the contributing faculty and staff of the schools of nursing for their
effort, commitment and collaboration. Without their annual support, this collection could not exist. We
would also like to thank the following:
CNA jurisdictional members;
members of CASN‟s Standing Committee on Information Management;
College of Nurses of Ontario; and
Ordre des infirmières et infirmiers du Québec.
We look forward to hearing your comments about the report.
Yours sincerely,
Rachel Bard, RN, M.A.Ed Cynthia Baker, RN, PhD
Chief Executive Officer Executive Director
Canadian Nurses Association Canadian Association of Schools of Nursing
2
Nursing Education Statistics 2008-2009
Contents
INTRODUCTION ................................................................................................................................................. 3
2008-2009 KEY PROGRAM FINDINGS ............................................................................................................ 5
2009 KEY RN FACULTY FINDINGS ............................................................................................................... 13
SUMMARY ......................................................................................................................................................... 18
2008-2009 RESULTS .......................................................................................................................................... 19
Methodological Notes – Survey Tables ............................................................................................................... 53
APPENDIX A: NATIONAL STUDENT AND FACULTY SURVEY OF CANADIAN SCHOOLS OF NURSING
2008-2009: SURVEY METHODOLOGY .......................................................................................................... 56
ENDNOTES ....................................................................................................................................................... 64
3
Nursing Education Statistics 2008-2009
Introduction
The National Student and Faculty Survey of Canadian Schools of Nursing (NSFS) is the only
longitudinal national collection of nursing education data in Canada. The survey includes entry-to-
practice education programs, as well as graduate and post-graduate programs for the four regulated
nurse occupations: registered nurse, nurse practitioner, psychiatric nurse and practical nurse.
The survey is led by the Canadian Nurses Association (CNA) in collaboration with a stakeholder group
comprising education leads from each national nurse educator association. In 2001, the survey
methodology and program questions were developed for CNA by well-known statistician Eva Ryten.
The Canadian Association of Schools of Nursing (CASN) led the development of the faculty questions
that same year.
CASN member schools tested the new survey prior to its initial distribution in 2002. In recent years
CNA, CASN and CASN‟s Standing Committee on Information Management have contributed changes
to the survey, with a particular focus on more comprehensive faculty questions. All changes are tested
at selected schools of nursing prior to adoption. CNA consults with stakeholders annually regarding
survey changes and improvements.
Stakeholders Role
Canadian Nurses Association (CNA) Survey program lead
Canadian Association of Schools of Nursing (CASN) Registered nursing education lead (includes nurse
practitioner education)
Canadian Association of Registered Psychiatric Nurse Educators
(CARPNE)
Psychiatric nursing education lead
Canadian Association of Practical Nurse Educators (CAPNE) Practical nursing education lead
The NSFS focuses on two main elements: programs and faculty. Program elements
provide data about the number of students admitted, enrolled and graduating from
nursing programs; the variety of programs available, including those that support
lifelong learning; and innovative approaches to program delivery. Faculty elements
include numbers of faculty, their roles and employment status, education levels
attained and in progress, age cohorts, and recruitment and retirement. In the 2007-
2008 survey, five new questions were added to the faculty section to gain a more
comprehensive understanding of the nursing faculty workforce. These questions
were repeated in the 2008-2009 survey. CNA and CASN agreed to withhold
comparative results until five years‟ worth of data are available. Consequently,
yearly results for some questions are reported with no comparative data.
In 2009, an online version of the survey was available to CASN members.
Participating schools – more than 80% of CASN member schools – entered their
survey responses directly into the database housed at CNA in Ottawa.
This publication is an analytical report about the 2008-2009 data collected from the registered nurse
(RN) portion1 of the NSFS. It includes quantitative data from the survey as well as data obtained from
Ordre des infirmières et infirmiers du Québec (OIIQ), which is included to offset survey under-
1 For information about psychiatric nurse and practical nurse education programs, visit the CNA website at http://www.cna-
aiic.ca/CNA/nursing/statistics/survey/default_e.aspx
Appropriate planning and management of health human resources is key to ensuring that Canadians have access to the health providers they need, now and in the future. 2003 First Ministers’ Accord on Health Care Renewal
4
Nursing Education Statistics 2008-2009
reporting of admission and graduate data for Quebec‟s entry-to-practice diploma and baccalaureate
programs. The inclusion of the OIIQ data in combination with the results of the NSFS permits pan-
Canadian analysis.
Note: Use of OIIQ data is limited to the section “2008-2009 Key Program Findings.”
Survey Distribution and Response
The joint CNA and CASN portion of the 2008-2009 survey was issued to all 135 schools of nursing
offering entry-to-practice (ETP) pre-licensure education entitling successful graduates to apply for
initial licensure/registration as an RN, or for post-RN and graduate RN education.
Of the 135 schools, 111 schools completed the survey, including 86 of a possible 91 CASN members.
The overall survey response rate was 82%; the CASN member response rate was 95%. See the tables
starting on page 20 for more detailed information about omitted or unusable data. On average, 66.1%
of schools responded to the faculty questions.
Data Comparison Timeframes
Program inventory, admission and enrolment data were collected for the 2008-2009 academic year.
Unless otherwise stated, comparisons in this report concerning program inventory, admission and
enrolment are 2008-2009 data as compared with 2007-2008 data.
Graduate data were collected for calendar year 2009. Unless otherwise stated, comparisons in this
report concerning graduates are 2009 data as compared with 2008 data.
Faculty data were also collected for calendar year 2009. Unless otherwise stated, comparisons in this
report concerning faculty are 2009 data as compared with 2008 data.
Survey Methodology
See Appendix A for methodological information.
5
Nursing Education Statistics 2008-2009
2008-2009 Key Program Findings
Entry-to-Practice Programs
Entry-to-practice (ETP) programs entitle the successful graduate to apply for initial licensure/
registration as an RN.
111 schools reported results for one or more ETP programs.
89 of the 111 schools (80.2%) offered ETP baccalaureate programs.
ETP baccalaureate programs of various durations (4-year, 3.5-year, 3-year, 2-year, etc.) were
available in every province and territory, except for the Yukon where no nurse education
programs exist.
41 colleges partnered with a university to deliver ETP baccalaureate
programs; two colleges in British Columbia and one college in Alberta
granted ETP baccalaureate degrees autonomously.
ETP Admissions
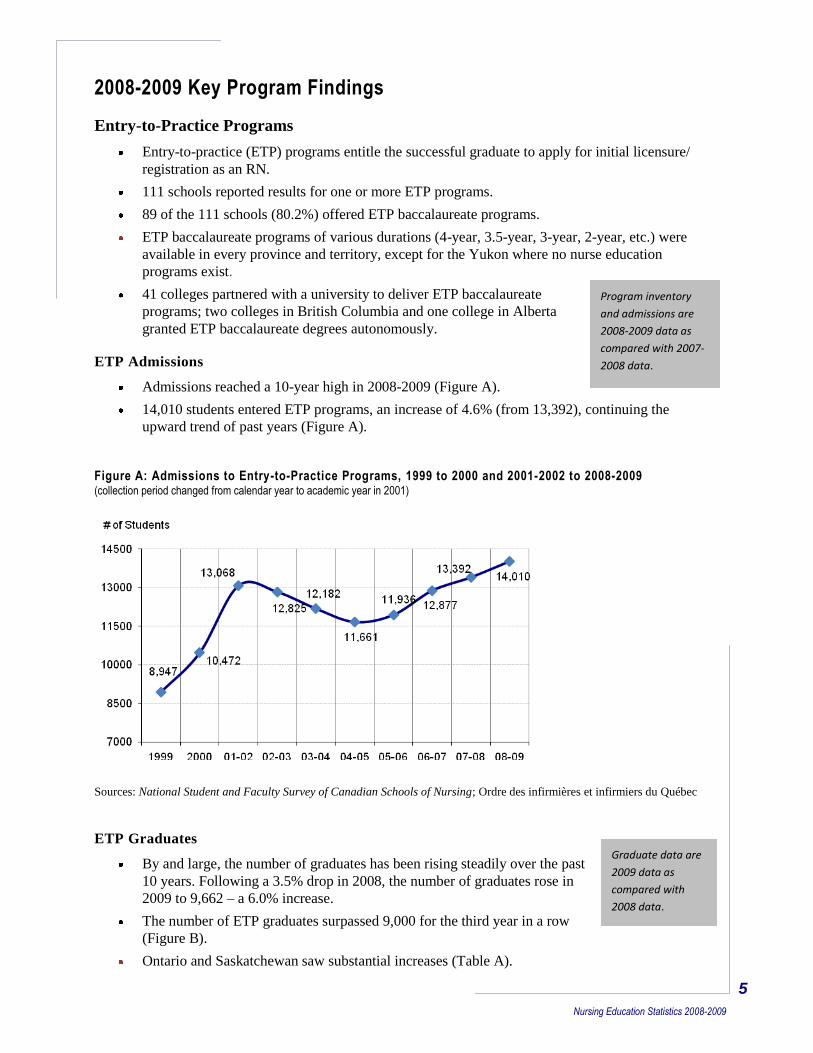
Admissions reached a 10-year high in 2008-2009 (Figure A).
14,010 students entered ETP programs, an increase of 4.6% (from 13,392), continuing the
upward trend of past years (Figure A).
Figure A: Admissions to Entry-to-Practice Programs, 1999 to 2000 and 2001-2002 to 2008-2009 (collection period changed from calendar year to academic year in 2001)
Sources: National Student and Faculty Survey of Canadian Schools of Nursing; Ordre des infirmières et infirmiers du Québec
ETP Graduates
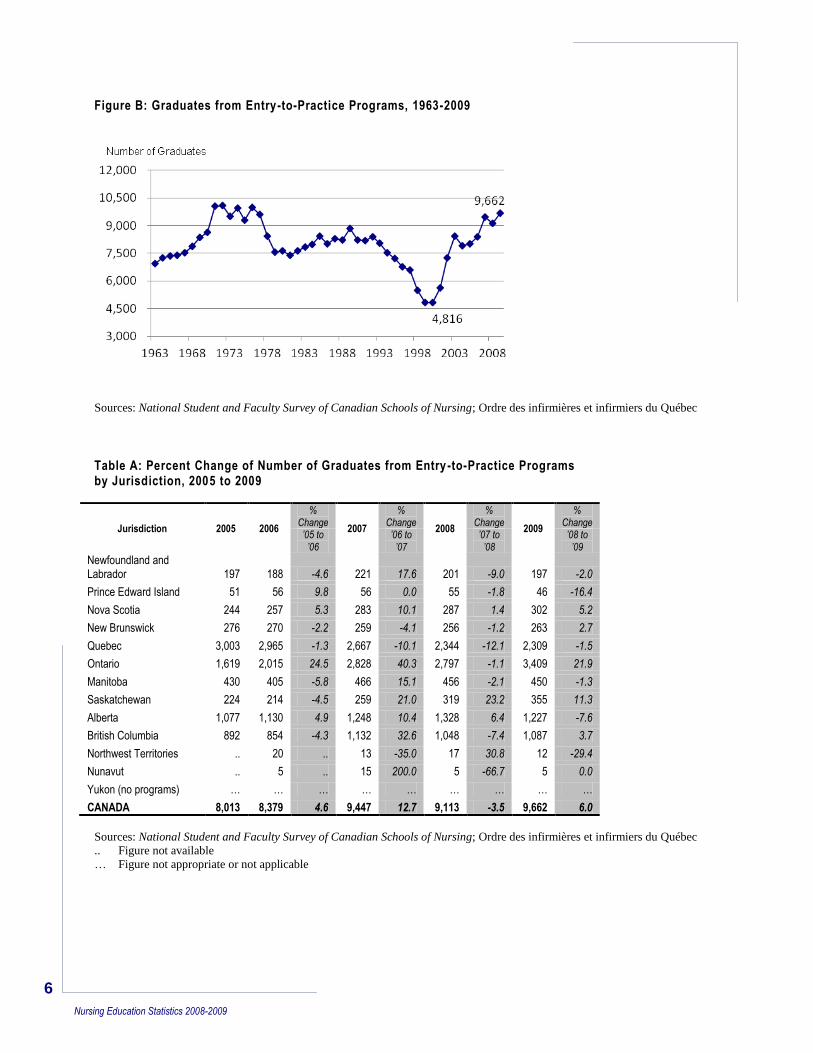
By and large, the number of graduates has been rising steadily over the past
10 years. Following a 3.5% drop in 2008, the number of graduates rose in
2009 to 9,662 – a 6.0% increase.
The number of ETP graduates surpassed 9,000 for the third year in a row
(Figure B).
Ontario and Saskatchewan saw substantial increases (Table A).
Program inventory
and admissions are
2008-2009 data as
compared with 2007-
2008 data.
Graduate data are
2009 data as
compared with
2008 data.
6
Nursing Education Statistics 2008-2009
Figure B: Graduates from Entry-to-Practice Programs, 1963-2009
Sources: National Student and Faculty Survey of Canadian Schools of Nursing; Ordre des infirmières et infirmiers du Québec
Table A: Percent Change of Number of Graduates from Entry-to-Practice Programs by Jurisdiction, 2005 to 2009
Jurisdiction 2005 2006
% Change
2007
% Change
2008
% Change
2009
% Change
’05 to ’06
’06 to ’07
’07 to ’08
’08 to ’09
Newfoundland and Labrador 197 188 -4.6 221 17.6 201 -9.0 197 -2.0
Prince Edward Island 51 56 9.8 56 0.0 55 -1.8 46 -16.4
Nova Scotia 244 257 5.3 283 10.1 287 1.4 302 5.2
New Brunswick 276 270 -2.2 259 -4.1 256 -1.2 263 2.7
Quebec 3,003 2,965 -1.3 2,667 -10.1 2,344 -12.1 2,309 -1.5
Ontario 1,619 2,015 24.5 2,828 40.3 2,797 -1.1 3,409 21.9
Manitoba 430 405 -5.8 466 15.1 456 -2.1 450 -1.3
Saskatchewan 224 214 -4.5 259 21.0 319 23.2 355 11.3
Alberta 1,077 1,130 4.9 1,248 10.4 1,328 6.4 1,227 -7.6
British Columbia 892 854 -4.3 1,132 32.6 1,048 -7.4 1,087 3.7
Northwest Territories .. 20 .. 13 -35.0 17 30.8 12 -29.4
Nunavut .. 5 .. 15 200.0 5 -66.7 5 0.0
Yukon (no programs) … … … … … … … … …
CANADA 8,013 8,379 4.6 9,447 12.7 9,113 -3.5 9,662 6.0
Sources: National Student and Faculty Survey of Canadian Schools of Nursing; Ordre des infirmières et infirmiers du Québec
.. Figure not available
… Figure not appropriate or not applicable
7
Nursing Education Statistics 2008-2009
Lifelong Learning (Continuing Education)
In its 2009 report about the state of post-secondary education in Canada, the Canadian Council on
Learning highlights the importance of lifelong learning: “Individuals as well as communities benefit
from higher levels of education: health, life satisfaction, volunteering, donating, employment stability
and income all increase as levels of educational attainment increase.” 1
Like many other professions, nurses seek lifelong learning, as well as credential upgrading. In the
nursing profession new knowledge is a constant to meet the demands of an ever-changing, increasingly
complex work environment.2
Post-RN Programs
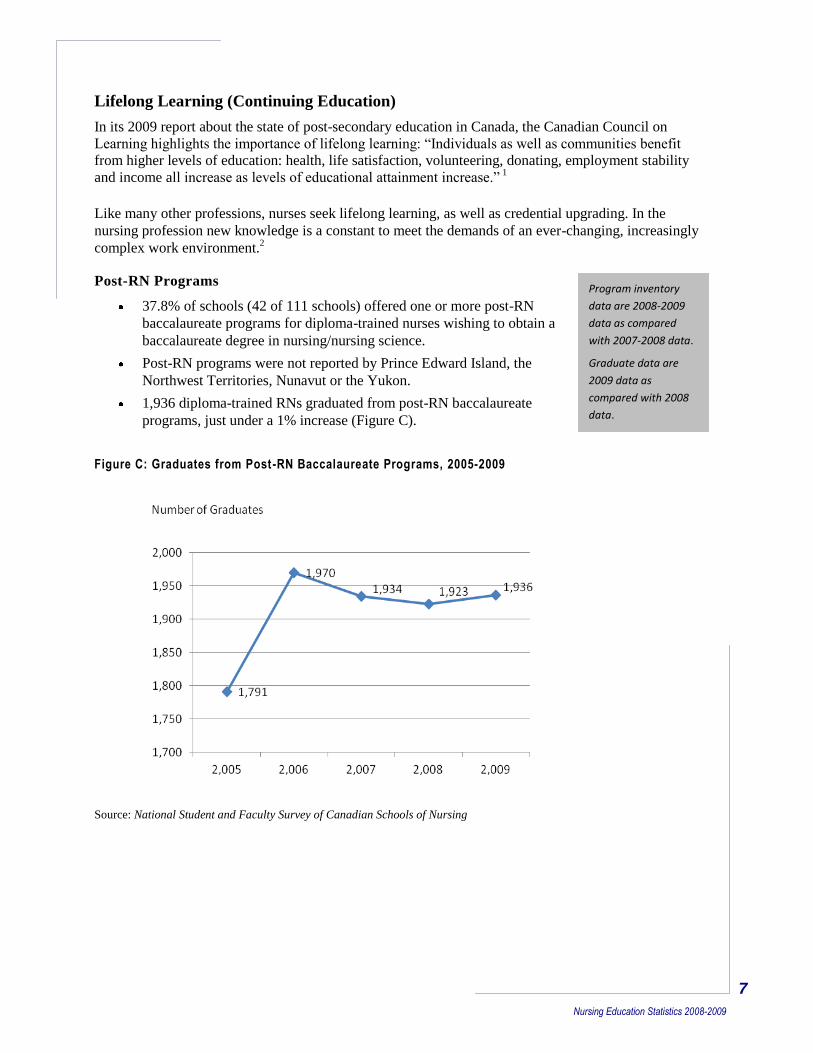
37.8% of schools (42 of 111 schools) offered one or more post-RN
baccalaureate programs for diploma-trained nurses wishing to obtain a
baccalaureate degree in nursing/nursing science.
Post-RN programs were not reported by Prince Edward Island, the
Northwest Territories, Nunavut or the Yukon.
1,936 diploma-trained RNs graduated from post-RN baccalaureate
programs, just under a 1% increase (Figure C).
Figure C: Graduates from Post-RN Baccalaureate Programs, 2005-2009
Source: National Student and Faculty Survey of Canadian Schools of Nursing
Program inventory
data are 2008-2009
data as compared
with 2007-2008 data.
Graduate data are
2009 data as
compared with 2008
data.
8
Nursing Education Statistics 2008-2009
“Historically, recessions produce jumps in the enrolment of short‐course programs. Enrolment jumps are therefore likeliest in two‐year college programs and university graduate programs.” Usher, A., & Dunn, R. (2009).
Master’s and Doctoral Programs
29.7% of schools (33 of 111 schools) offered one or more master‟s programs; programs were
not available in Prince Edward Island, the Northwest Territories, Nunavut or the Yukon.
13.5% of schools (15 of 111 schools) offered doctoral programs.
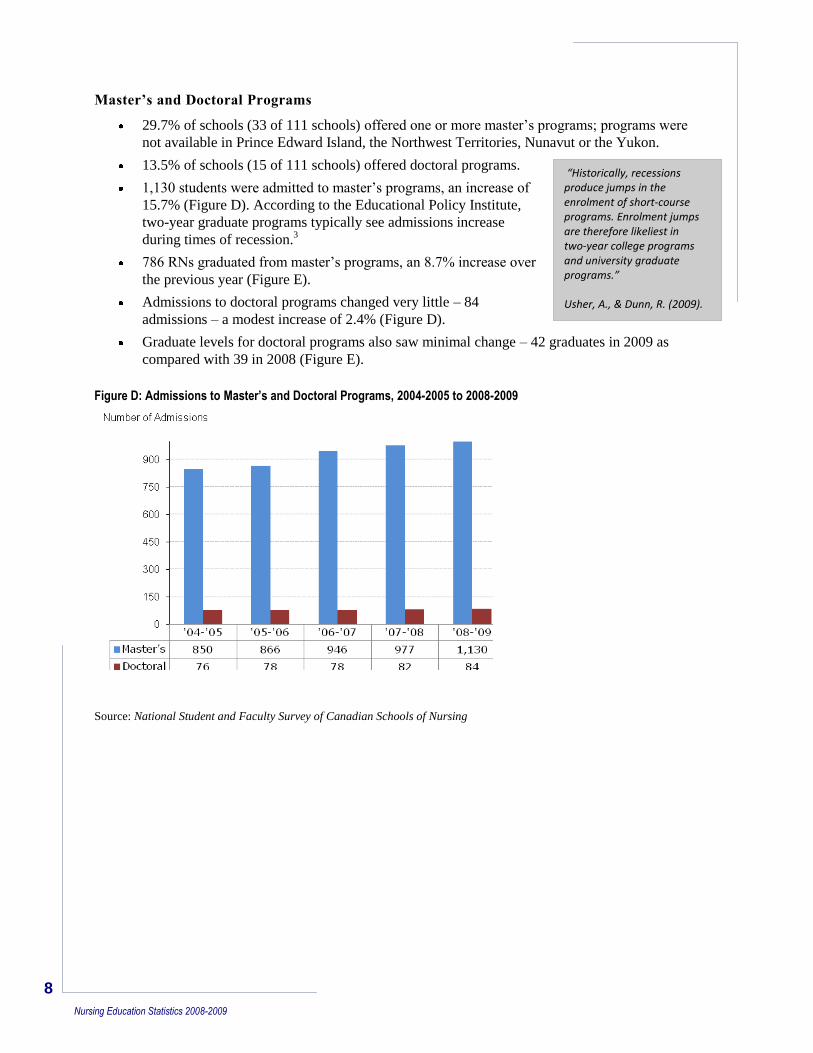
1,130 students were admitted to master‟s programs, an increase of
15.7% (Figure D). According to the Educational Policy Institute,
two-year graduate programs typically see admissions increase
during times of recession.3
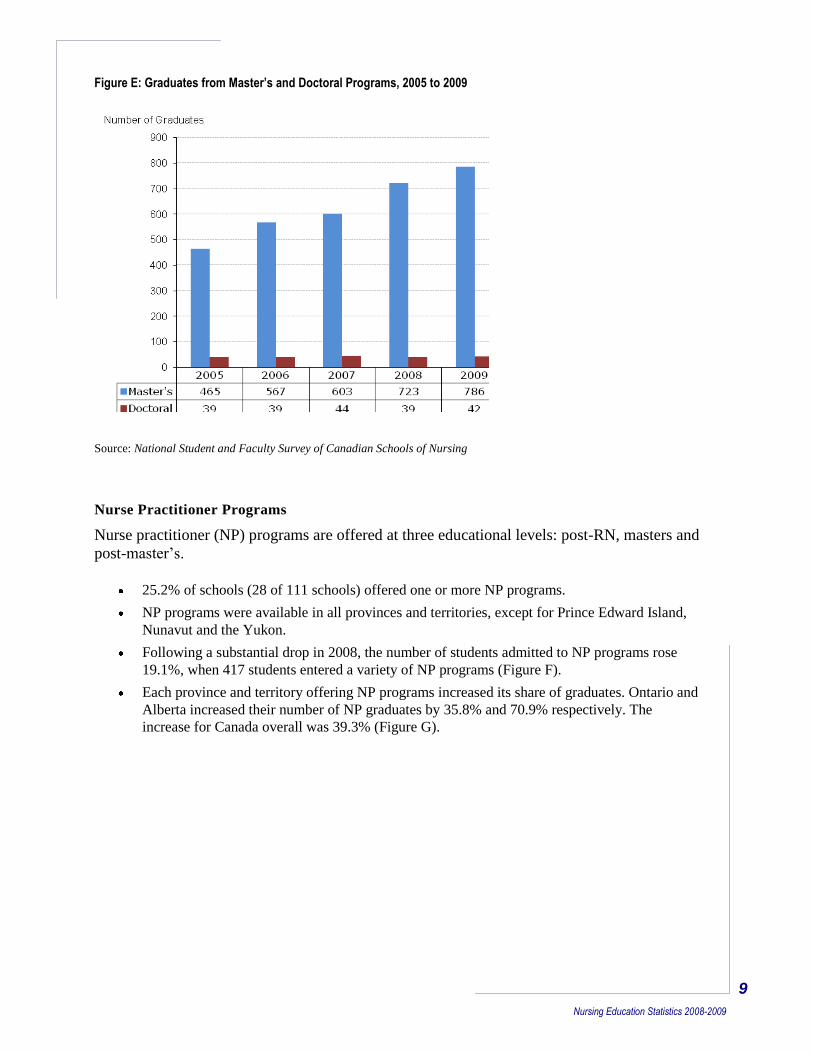
786 RNs graduated from master‟s programs, an 8.7% increase over
the previous year (Figure E).
Admissions to doctoral programs changed very little – 84
admissions – a modest increase of 2.4% (Figure D).
Graduate levels for doctoral programs also saw minimal change – 42 graduates in 2009 as
compared with 39 in 2008 (Figure E).
Figure D: Admissions to Master’s and Doctoral Programs, 2004-2005 to 2008-2009
Source: National Student and Faculty Survey of Canadian Schools of Nursing
9
Nursing Education Statistics 2008-2009
Figure E: Graduates from Master’s and Doctoral Programs, 2005 to 2009
Source: National Student and Faculty Survey of Canadian Schools of Nursing
Nurse Practitioner Programs
Nurse practitioner (NP) programs are offered at three educational levels: post-RN, masters and
post-master‟s.
25.2% of schools (28 of 111 schools) offered one or more NP programs.
NP programs were available in all provinces and territories, except for Prince Edward Island,
Nunavut and the Yukon.
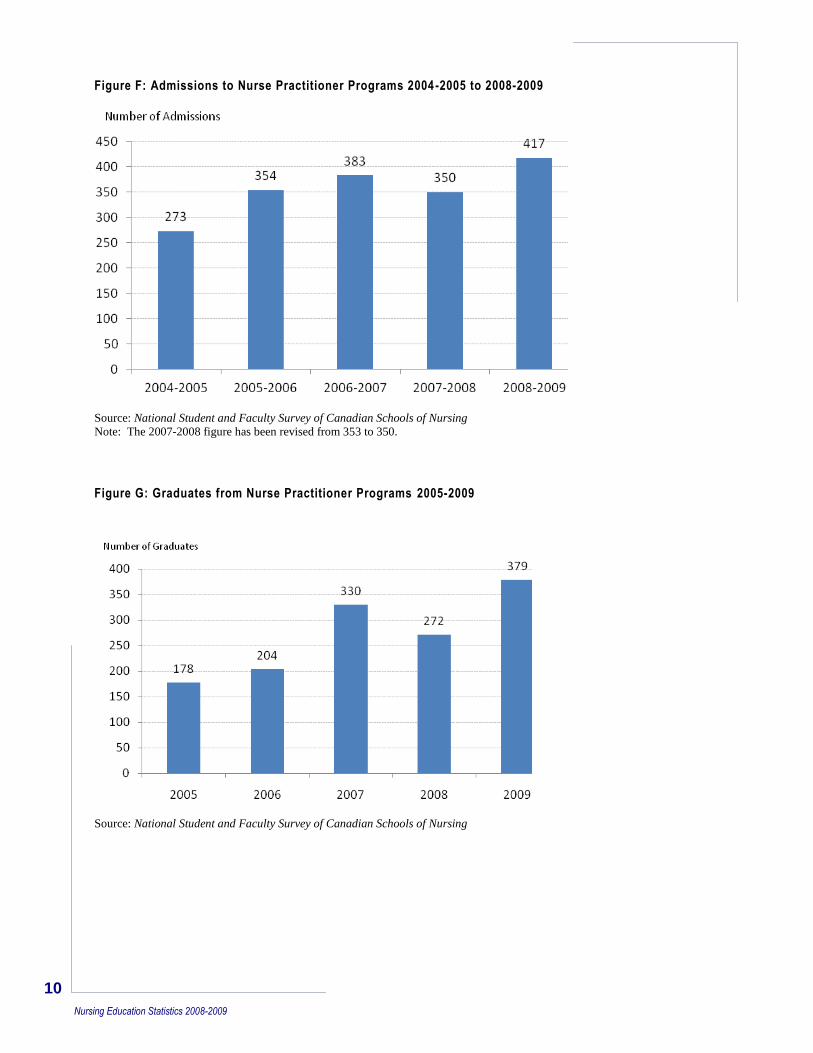
Following a substantial drop in 2008, the number of students admitted to NP programs rose
19.1%, when 417 students entered a variety of NP programs (Figure F).
Each province and territory offering NP programs increased its share of graduates. Ontario and
Alberta increased their number of NP graduates by 35.8% and 70.9% respectively. The
increase for Canada overall was 39.3% (Figure G).
10
Nursing Education Statistics 2008-2009
Figure F: Admissions to Nurse Practitioner Programs 2004-2005 to 2008-2009
Source: National Student and Faculty Survey of Canadian Schools of Nursing
Note: The 2007-2008 figure has been revised from 353 to 350.
Figure G: Graduates from Nurse Practitioner Programs 2005-2009
Source: National Student and Faculty Survey of Canadian Schools of Nursing
11
Nursing Education Statistics 2008-2009
Program Delivery Innovations
Fast-Track ETP Programs
Fast-track ETP programs allow students to complete their education in less time than traditional programs
(i.e., traditional diploma programs are three years‟ duration; baccalaureate programs are four years). Schools
of nursing offer a variety of fast-track ETP programs, including those identified as “accelerated,” “fast-
track,” “compressed,” “second-degree entry,” “advanced entry” and “bridging” programs. The number of
fast-track ETP program options available throughout the country continues to grow.
Note: The usual ETP baccalaureate program duration of four years may not be the standard program
length for all ETP baccalaureate programs in Quebec. As a result, Quebec ETP programs are not
counted as fast-tracked unless the school identifies the program as such.
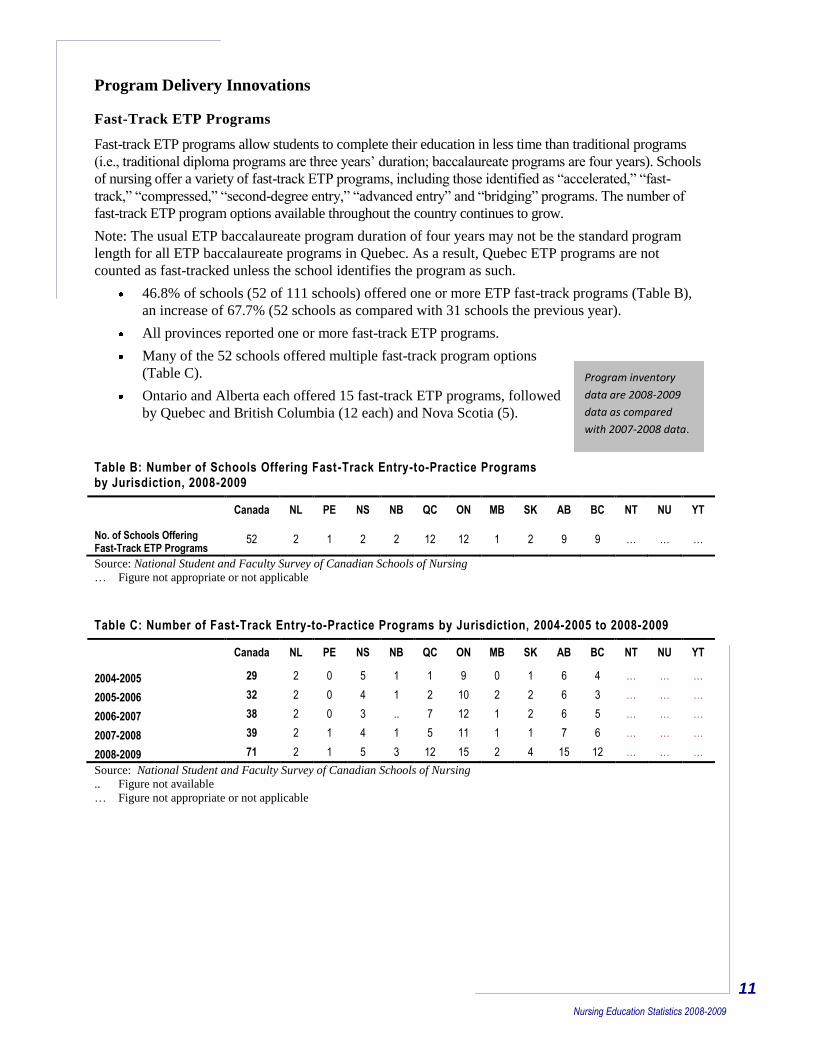
46.8% of schools (52 of 111 schools) offered one or more ETP fast-track programs (Table B),
an increase of 67.7% (52 schools as compared with 31 schools the previous year).
All provinces reported one or more fast-track ETP programs.
Many of the 52 schools offered multiple fast-track program options
(Table C).
Ontario and Alberta each offered 15 fast-track ETP programs, followed
by Quebec and British Columbia (12 each) and Nova Scotia (5).
Table B: Number of Schools Offering Fast-Track Entry-to-Practice Programs by Jurisdiction, 2008-2009
Canada NL PE NS NB QC ON MB SK AB BC NT NU YT
No. of Schools Offering Fast-Track ETP Programs
52 2 1 2 2 12 12 1 2 9 9 … … …
Source: National Student and Faculty Survey of Canadian Schools of Nursing
… Figure not appropriate or not applicable
Table C: Number of Fast-Track Entry-to-Practice Programs by Jurisdiction, 2004-2005 to 2008-2009
Canada NL PE NS NB QC ON MB SK AB BC NT NU YT
2004-2005 29 2 0 5 1 1 9 0 1 6 4 … … …
2005-2006 32 2 0 4 1 2 10 2 2 6 3 … … …
2006-2007 38 2 0 3 .. 7 12 1 2 6 5 … … …
2007-2008 39 2 1 4 1 5 11 1 1 7 6 … … …
2008-2009 71 2 1 5 3 12 15 2 4 15 12 … … …
Source: National Student and Faculty Survey of Canadian Schools of Nursing
.. Figure not available
… Figure not appropriate or not applicable
Program inventory
data are 2008-2009
data as compared
with 2007-2008 data.
12
Nursing Education Statistics 2008-2009
“Changes in communication and information technology will present an increasing set of opportunities and challenges. The brick-and-mortar classroom will yield increasingly to the virtual classroom…” Plant, G. (2007).
Distributed Learning (Distance Education)
For the purposes of this report, the term distributed learning (DL) is used to describe programs offered
wholly electronically or in a blended model that incorporates online and face-to-face delivery.
The number of nursing degree programs and advanced practice programs offered in modes other than
the traditional face-to-face classroom mode provides opportunities, challenges4 and increased student
access. DL courses facilitate access for students living outside urban centres and for working nurses
seeking to upgrade academic credentials.
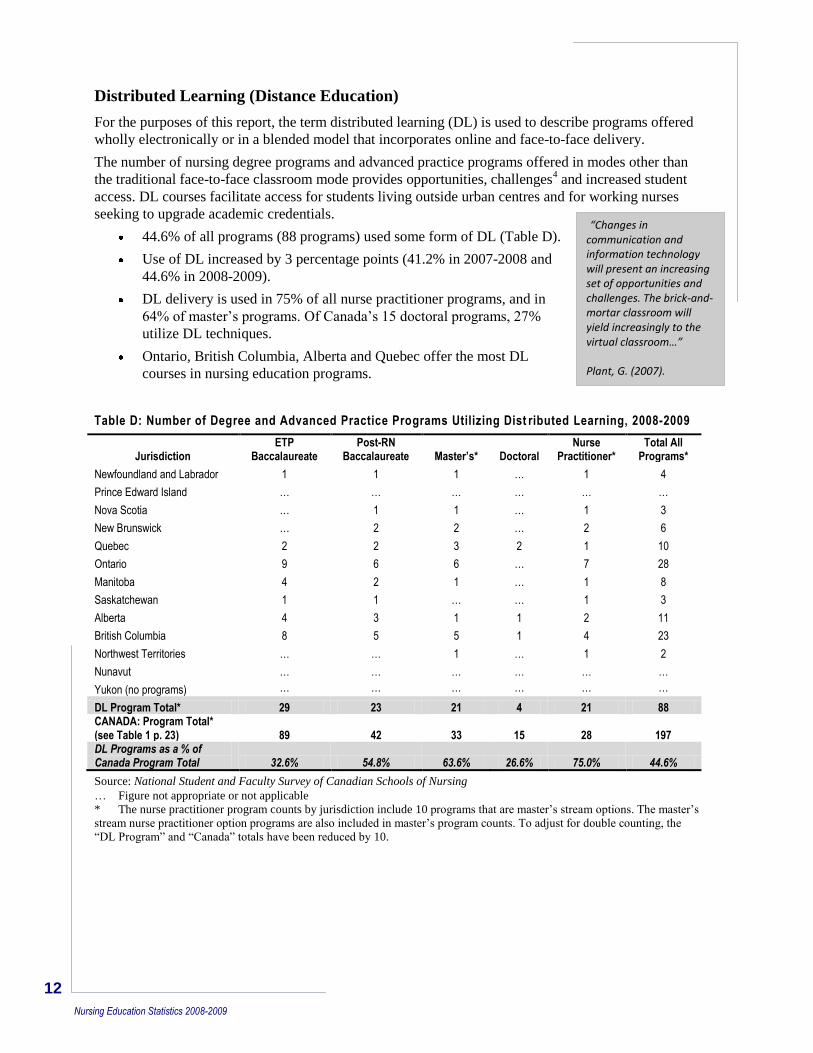
44.6% of all programs (88 programs) used some form of DL (Table D).
Use of DL increased by 3 percentage points (41.2% in 2007-2008 and
44.6% in 2008-2009).
DL delivery is used in 75% of all nurse practitioner programs, and in
64% of master‟s programs. Of Canada‟s 15 doctoral programs, 27%
utilize DL techniques.
Ontario, British Columbia, Alberta and Quebec offer the most DL
courses in nursing education programs.
Table D: Number of Degree and Advanced Practice Programs Utilizing Dist ributed Learning, 2008-2009
Jurisdiction ETP
Baccalaureate Post-RN
Baccalaureate Master’s* Doctoral Nurse
Practitioner* Total All
Programs*
Newfoundland and Labrador 1 1 1 … 1 4
Prince Edward Island … … … … … …
Nova Scotia … 1 1 … 1 3
New Brunswick … 2 2 … 2 6
Quebec 2 2 3 2 1 10
Ontario 9 6 6 … 7 28
Manitoba 4 2 1 … 1 8
Saskatchewan 1 1 … … 1 3
Alberta 4 3 1 1 2 11
British Columbia 8 5 5 1 4 23
Northwest Territories … … 1 … 1 2
Nunavut … … … … … …
Yukon (no programs) … … … … … …
DL Program Total* 29 23 21 4 21 88 CANADA: Program Total* (see Table 1 p. 23) 89 42 33 15 28 197 DL Programs as a % of Canada Program Total 32.6% 54.8% 63.6% 26.6% 75.0% 44.6%
Source: National Student and Faculty Survey of Canadian Schools of Nursing
… Figure not appropriate or not applicable
* The nurse practitioner program counts by jurisdiction include 10 programs that are master‟s stream options. The master‟s
stream nurse practitioner option programs are also included in master‟s program counts. To adjust for double counting, the
“DL Program” and “Canada” totals have been reduced by 10.
13
Nursing Education Statistics 2008-2009
2009 Key RN Faculty Findings
Note: In the 2007-2008 survey, five new questions were added to the faculty section to gain a
more comprehensive understanding of the nursing faculty workforce. These questions were
repeated in the 2008-2009 survey. However, CNA and CASN have agreed to withhold
comparative results until five years of data are available. Consequently, yearly results for
some questions are reported with no comparative data.
The supply of RN faculty is one factor affecting the country‟s ability to increase its capacity to
educate nurses.5 That supply is influenced by retirement of existing faculty, the inflow of newly
prepared faculty, and other factors such as human resources budgets and the challenges of
retaining current faculty and recruiting new faculty.6
For the purposes of this report:
“Permanent faculty” refers to tenured/tenurable faculty who teach nursing courses in a
university and permanent full-time or permanent part-time faculty who teach nursing courses
in a college.
“Full-time faculty” refers to full-time permanent faculty who teach nursing courses plus full-
time contract faculty (these are faculty who hold contracts of one academic year or longer)
who teach nursing courses.
“Contract faculty” refers to full-time contract faculty (these are faculty who hold contracts of
one academic year or longer) who teach nursing courses plus part-time contract faculty (these
are faculty who hold contracts of less than one academic year) who teach nursing courses.
Clinical faculty are not included in faculty counts.
“RN Faculty” and “Faculty” refer to all of the above.
RN Faculty Demographics
7,683 RN faculty members were employed by schools of nursing. (Note: The
number of faculty reported in 2009 is far less than that reported in 2008.
Some schools may have included clinical faculty in their 2008 counts and
corrected that error in 2009.)
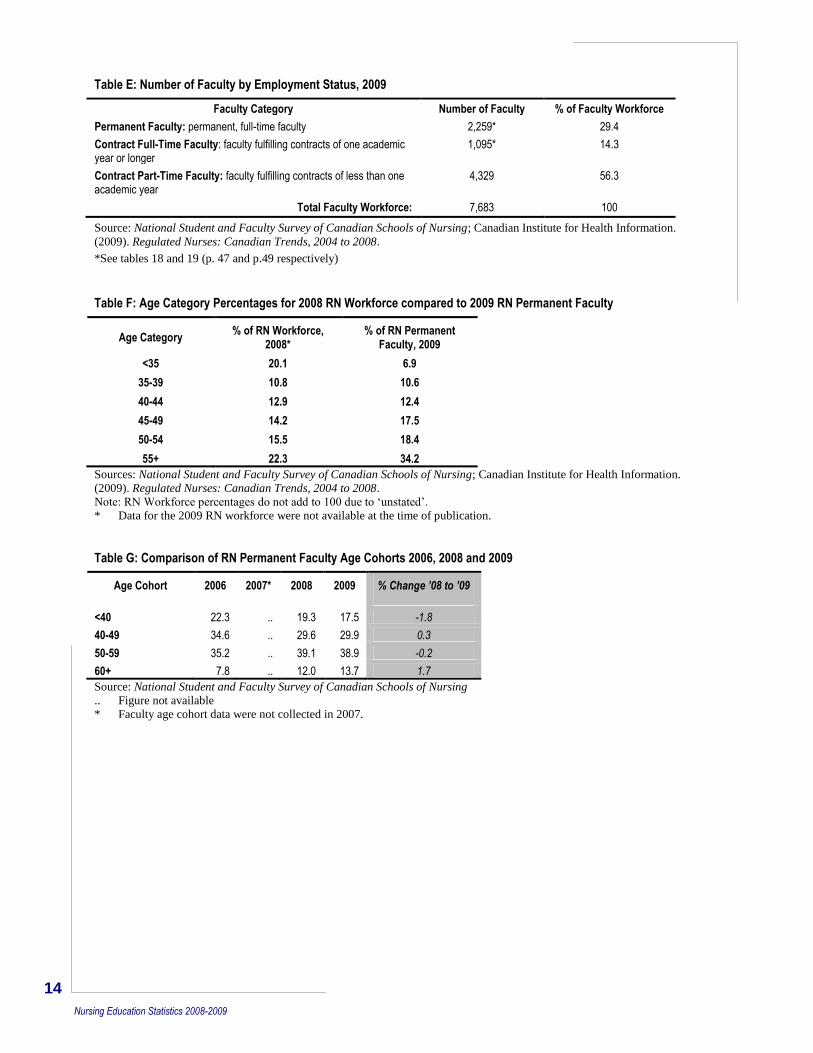
Less than 30% of faculty are permanent – 2,259 of the 7,683 RN faculty
(Table E).
52.6% of permanent faculty were 50 years of age or older; 34.2% of
permanent faculty were 55 years or older (Table F).
An increasing percentage of RN permanent faculty were in the 50+ age cohort with the
greatest percentage change in the 60+ age cohort (Table G).
The percentage of RN permanent faculty in the 50+ age cohort is 15 percentage points higher
than the percentage of 50+ in the RN workforce7 (Table F).
The response rate for the question about age cohorts was 65.8% (73 schools). The response rate for the
question about employment status was 90.1% (100 schools).
Faculty data are
2009 data as
compared with
2008 data.
14
Nursing Education Statistics 2008-2009
Table E: Number of Faculty by Employment Status, 2009
Faculty Category Number of Faculty % of Faculty Workforce
Permanent Faculty: permanent, full-time faculty 2,259* 29.4
Contract Full-Time Faculty: faculty fulfilling contracts of one academic year or longer
1,095* 14.3
Contract Part-Time Faculty: faculty fulfilling contracts of less than one academic year
4,329 56.3
Total Faculty Workforce: 7,683 100
Source: National Student and Faculty Survey of Canadian Schools of Nursing; Canadian Institute for Health Information.
(2009). Regulated Nurses: Canadian Trends, 2004 to 2008.
*See tables 18 and 19 (p. 47 and p.49 respectively)
Table F: Age Category Percentages for 2008 RN Workforce compared to 2009 RN Permanent Faculty
Age Category % of RN Workforce,
2008* % of RN Permanent
Faculty, 2009
<35 20.1 6.9
35-39 10.8 10.6
40-44 12.9 12.4
45-49 14.2 17.5
50-54 15.5 18.4
55+ 22.3 34.2
Sources: National Student and Faculty Survey of Canadian Schools of Nursing; Canadian Institute for Health Information.
(2009). Regulated Nurses: Canadian Trends, 2004 to 2008.
Note: RN Workforce percentages do not add to 100 due to „unstated‟.
* Data for the 2009 RN workforce were not available at the time of publication.
Table G: Comparison of RN Permanent Faculty Age Cohorts 2006, 2008 and 2009
Age Cohort 2006 2007* 2008 2009 % Change ’08 to ’09
<40 22.3 .. 19.3 17.5 -1.8
40-49 34.6 .. 29.6 29.9 0.3
50-59 35.2 .. 39.1 38.9 -0.2
60+ 7.8 .. 12.0 13.7 1.7
Source: National Student and Faculty Survey of Canadian Schools of Nursing
.. Figure not available
* Faculty age cohort data were not collected in 2007.
15
Nursing Education Statistics 2008-2009
RN Faculty Recruitment and Retirement
The information collected from recruitment and retirement questions revealed information
with implications for faculty supply, including hiring challenges, ongoing recruitment loads, and
concerns about the limited pool of master‟s and doctorally prepared nurses available to work in
academic positions.
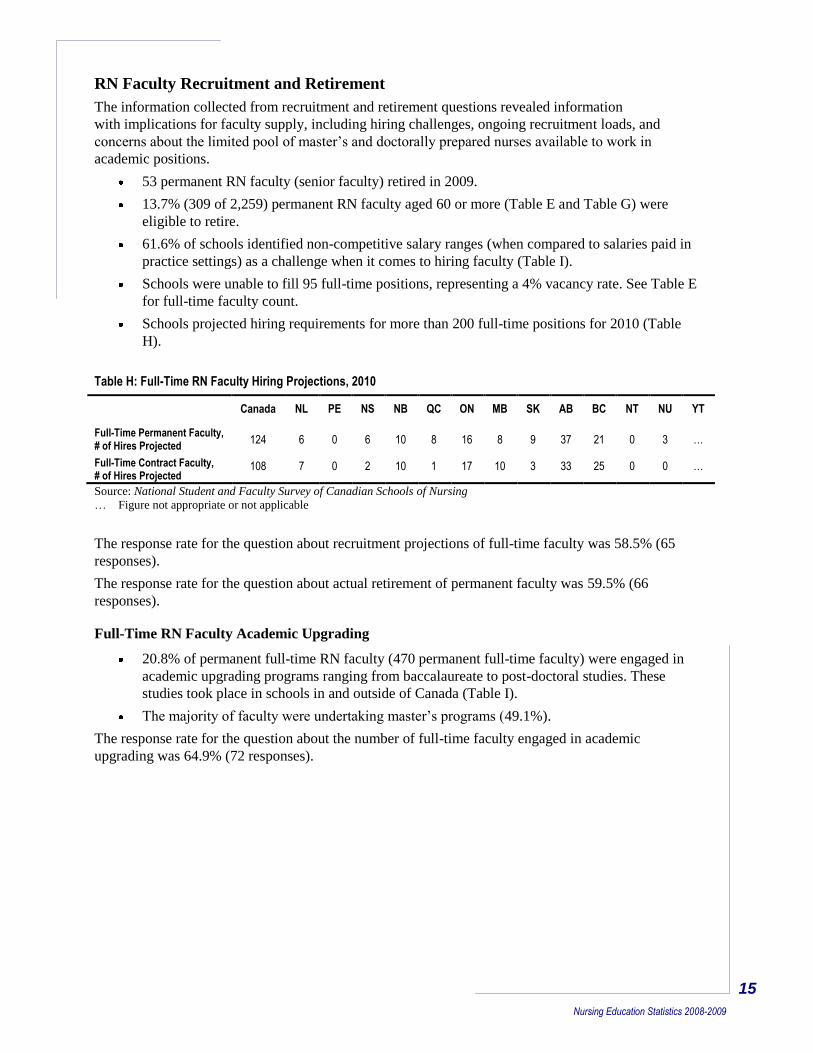
53 permanent RN faculty (senior faculty) retired in 2009.
13.7% (309 of 2,259) permanent RN faculty aged 60 or more (Table E and Table G) were
eligible to retire.
61.6% of schools identified non-competitive salary ranges (when compared to salaries paid in
practice settings) as a challenge when it comes to hiring faculty (Table I).
Schools were unable to fill 95 full-time positions, representing a 4% vacancy rate. See Table E
for full-time faculty count.
Schools projected hiring requirements for more than 200 full-time positions for 2010 (Table
H).
Table H: Full-Time RN Faculty Hiring Projections, 2010
Canada NL PE NS NB QC ON MB SK AB BC NT NU YT
Full-Time Permanent Faculty, # of Hires Projected
124 6 0 6 10 8 16 8 9 37 21 0 3 …
Full-Time Contract Faculty, # of Hires Projected
108 7 0 2 10 1 17 10 3 33 25 0 0 …
Source: National Student and Faculty Survey of Canadian Schools of Nursing
… Figure not appropriate or not applicable
The response rate for the question about recruitment projections of full-time faculty was 58.5% (65
responses).
The response rate for the question about actual retirement of permanent faculty was 59.5% (66
responses).
Full-Time RN Faculty Academic Upgrading
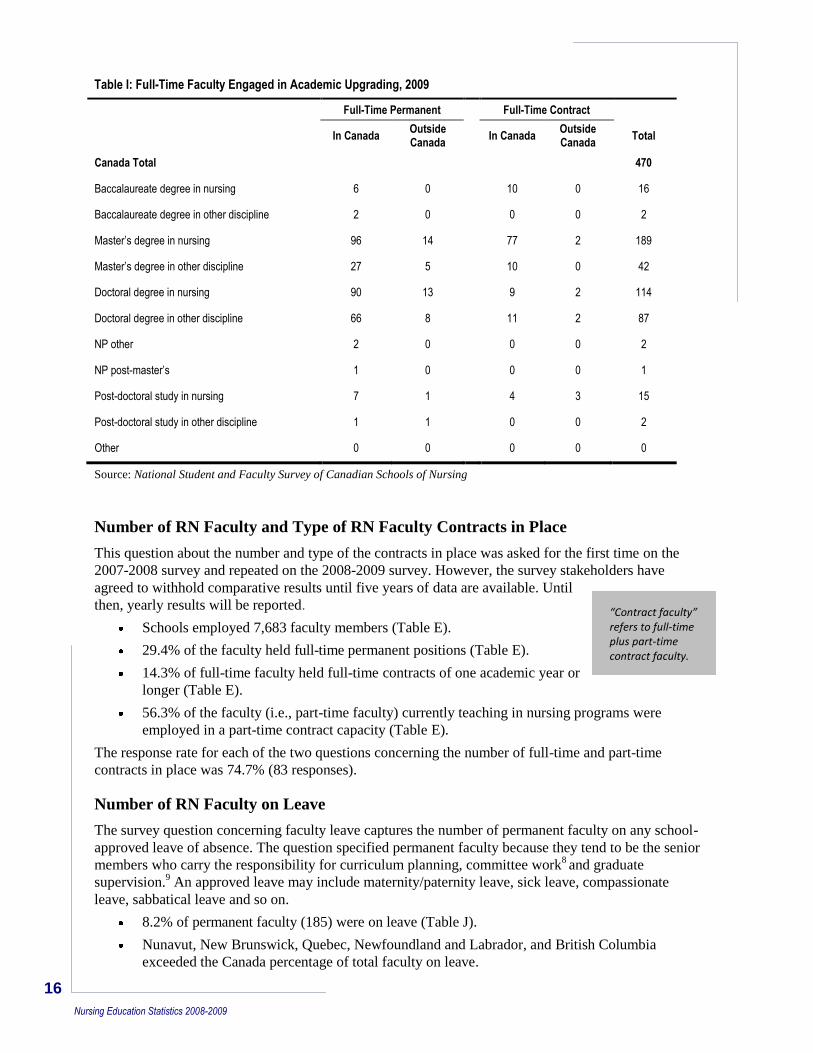
20.8% of permanent full-time RN faculty (470 permanent full-time faculty) were engaged in
academic upgrading programs ranging from baccalaureate to post-doctoral studies. These
studies took place in schools in and outside of Canada (Table I).
The majority of faculty were undertaking master‟s programs (49.1%).
The response rate for the question about the number of full-time faculty engaged in academic
upgrading was 64.9% (72 responses).
16
Nursing Education Statistics 2008-2009
Table I: Full-Time Faculty Engaged in Academic Upgrading, 2009
Full-Time Permanent Full-Time Contract
In Canada
Outside Canada
In Canada
Outside Canada
Total
Canada Total 470
Baccalaureate degree in nursing 6 0 10 0 16
Baccalaureate degree in other discipline 2 0 0 0 2
Master’s degree in nursing 96 14 77 2 189
Master’s degree in other discipline 27 5 10 0 42
Doctoral degree in nursing 90 13 9 2 114
Doctoral degree in other discipline 66 8 11 2 87
NP other 2 0 0 0 2
NP post-master’s 1 0 0 0 1
Post-doctoral study in nursing 7 1 4 3 15
Post-doctoral study in other discipline 1 1 0 0 2
Other 0 0 0 0 0
Source: National Student and Faculty Survey of Canadian Schools of Nursing
Number of RN Faculty and Type of RN Faculty Contracts in Place
This question about the number and type of the contracts in place was asked for the first time on the
2007-2008 survey and repeated on the 2008-2009 survey. However, the survey stakeholders have
agreed to withhold comparative results until five years of data are available. Until
then, yearly results will be reported.
Schools employed 7,683 faculty members (Table E).
29.4% of the faculty held full-time permanent positions (Table E).
14.3% of full-time faculty held full-time contracts of one academic year or
longer (Table E).
56.3% of the faculty (i.e., part-time faculty) currently teaching in nursing programs were
employed in a part-time contract capacity (Table E).
The response rate for each of the two questions concerning the number of full-time and part-time
contracts in place was 74.7% (83 responses).
Number of RN Faculty on Leave
The survey question concerning faculty leave captures the number of permanent faculty on any school-
approved leave of absence. The question specified permanent faculty because they tend to be the senior
members who carry the responsibility for curriculum planning, committee work8 and graduate
supervision.9 An approved leave may include maternity/paternity leave, sick leave, compassionate
leave, sabbatical leave and so on.
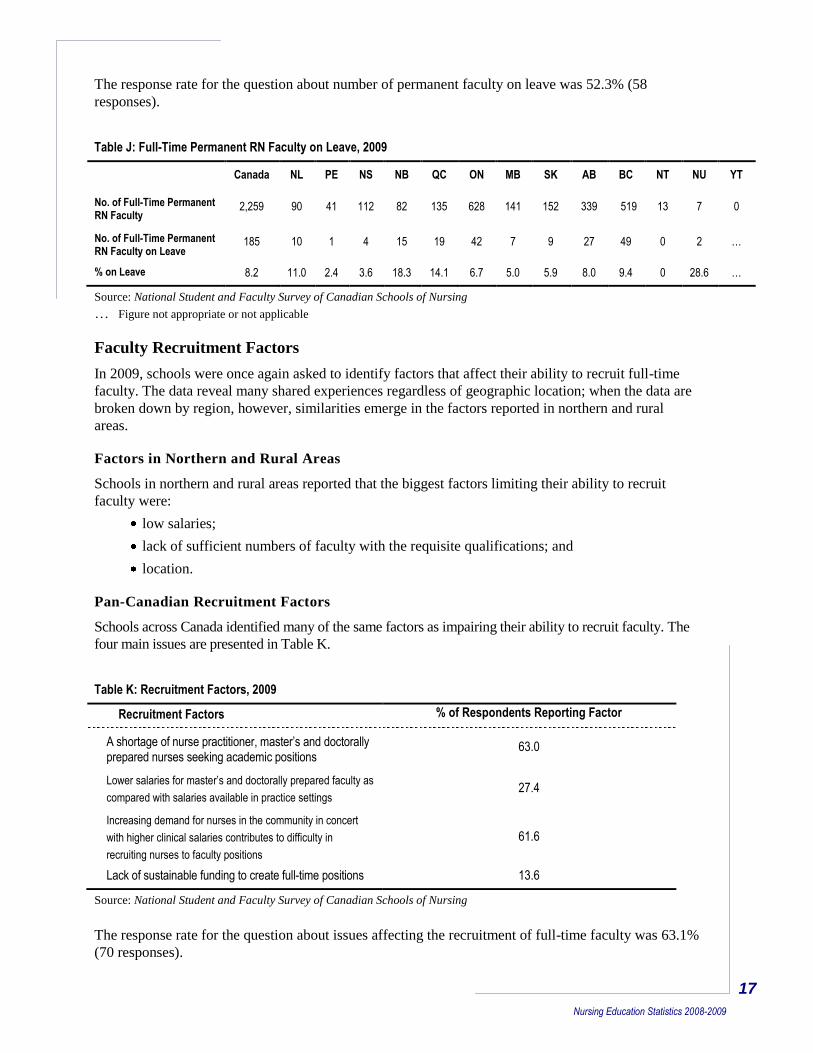
8.2% of permanent faculty (185) were on leave (Table J).
Nunavut, New Brunswick, Quebec, Newfoundland and Labrador, and British Columbia
exceeded the Canada percentage of total faculty on leave.
“Contract faculty” refers to full-time plus part-time contract faculty.
17
Nursing Education Statistics 2008-2009
The response rate for the question about number of permanent faculty on leave was 52.3% (58
responses).
Table J: Full-Time Permanent RN Faculty on Leave, 2009
Canada NL PE NS NB QC ON MB SK AB BC NT NU YT
No. of Full-Time Permanent RN Faculty
2,259 90 41 112 82 135 628 141 152 339 519 13 7 0
No. of Full-Time Permanent RN Faculty on Leave
185 10 1 4 15 19 42 7 9 27 49 0 2 …
% on Leave 8.2 11.0 2.4 3.6 18.3 14.1 6.7 5.0 5.9 8.0 9.4 0 28.6 …
Source: National Student and Faculty Survey of Canadian Schools of Nursing
… Figure not appropriate or not applicable
Faculty Recruitment Factors
In 2009, schools were once again asked to identify factors that affect their ability to recruit full-time
faculty. The data reveal many shared experiences regardless of geographic location; when the data are
broken down by region, however, similarities emerge in the factors reported in northern and rural
areas.
Factors in Northern and Rural Areas
Schools in northern and rural areas reported that the biggest factors limiting their ability to recruit
faculty were:
low salaries;
lack of sufficient numbers of faculty with the requisite qualifications; and
location.
Pan-Canadian Recruitment Factors
Schools across Canada identified many of the same factors as impairing their ability to recruit faculty. The
four main issues are presented in Table K.
Table K: Recruitment Factors, 2009
Recruitment Factors % of Respondents Reporting Factor
A shortage of nurse practitioner, master’s and doctorally prepared nurses seeking academic positions
63.0
Lower salaries for master’s and doctorally prepared faculty as
compared with salaries available in practice settings 27.4
Increasing demand for nurses in the community in concert
with higher clinical salaries contributes to difficulty in
recruiting nurses to faculty positions
61.6
Lack of sustainable funding to create full-time positions 13.6
Source: National Student and Faculty Survey of Canadian Schools of Nursing
The response rate for the question about issues affecting the recruitment of full-time faculty was 63.1%
(70 responses).
18
Nursing Education Statistics 2008-2009
Summary
Through the use of new program delivery methods, adoption of new technologies and seat
investments, schools continue to respond to the demand for more nurses to support the health-
care system.
Admissions reached a 10-year high in 2008-2009; 14,010 students entered ETP programs, an
increase of 4.6% (from 13,392 the previous year);
The number of fast-track programs increased 67.7% in 2009.
44.6% of all programs now use one form or another of distributed learning delivery, which
improves student access.
The survey identified serious, looming faculty issues that must be addressed:
34.2% of faculty were in the 55+ age cohort.
13.7% of faculty were in the 60+ age cohort.
The replacement pool (master‟s and doctoral graduates) for retiring faculty is inadequate.
Schools face considerable recruitment challenges.
19
Nursing Education Statistics 2008-2009
2008-2009 Results
The joint CNA and CASN portion of the 2008-2009 survey2 was issued to the 135 schools of nursing
offering entry-to-practice (ETP) pre-licensure education entitling successful graduates to apply for
initial licensure/registration as an RN, or for post-RN and graduate RN education.
Of the 135 schools, 111 schools completed the survey, including 86 of a possible 91 CASN members.
The overall survey response rate was 82%; the CASN member response rate was 95%. See the tables
starting on page 20 for more detailed information about omitted or unusable data. On average, 68% of
schools responded to the faculty questions.
Different collection periods and methodologies and under-reporting from a small proportion of schools
may result in differences between the records of a provincial or territorial government or regulatory
body and the data from the National Student and Faculty Survey of Canadian Schools of Nursing.
The following tables represent data as reported by each of the participating schools and do not include
data from other sources. Neither CNA nor CASN is responsible for errors in data reported by schools.
It is important to read the notes that accompany each table as well as the section “Methodological
Notes” on page 53, which contains information pertinent to all of the tables. The full survey
methodology and definitions are in Appendix A.
2 For information about psychiatric nurse and practical nurse education programs, visit the CNA website at http://www.cna-
aiic.ca/CNA/nursing/statistics/survey/default_e.aspx
20
Nursing Education Statistics 2008-2009
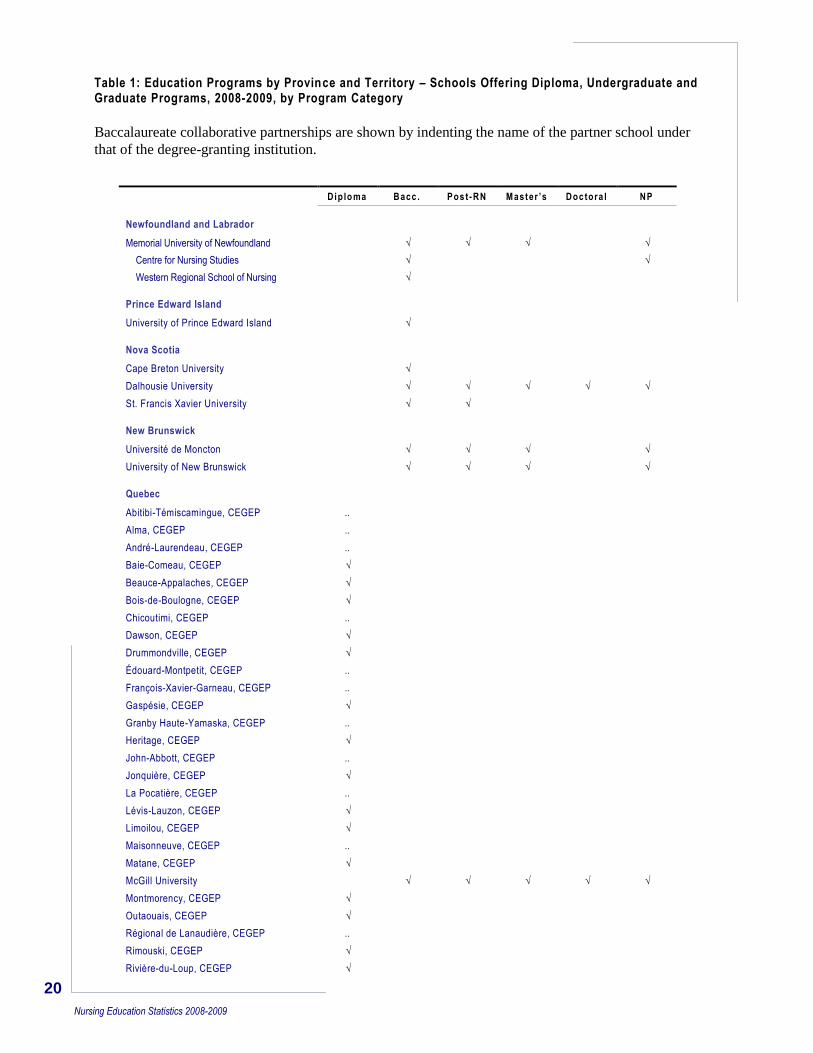
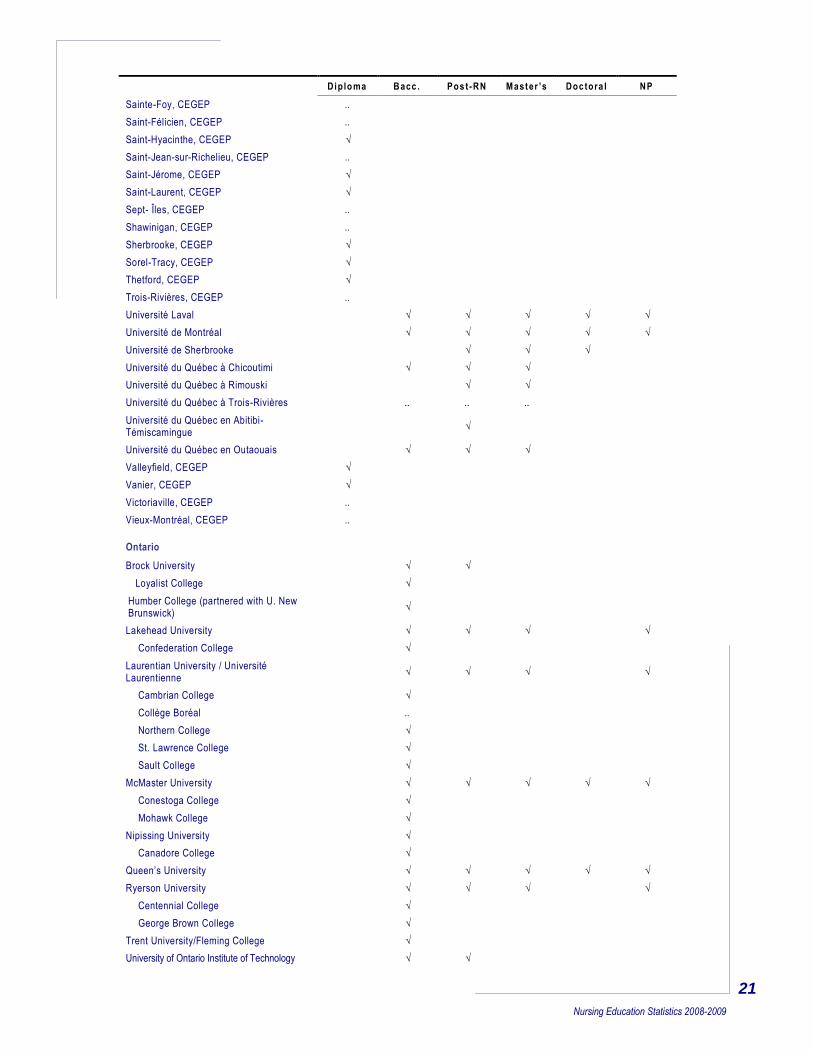
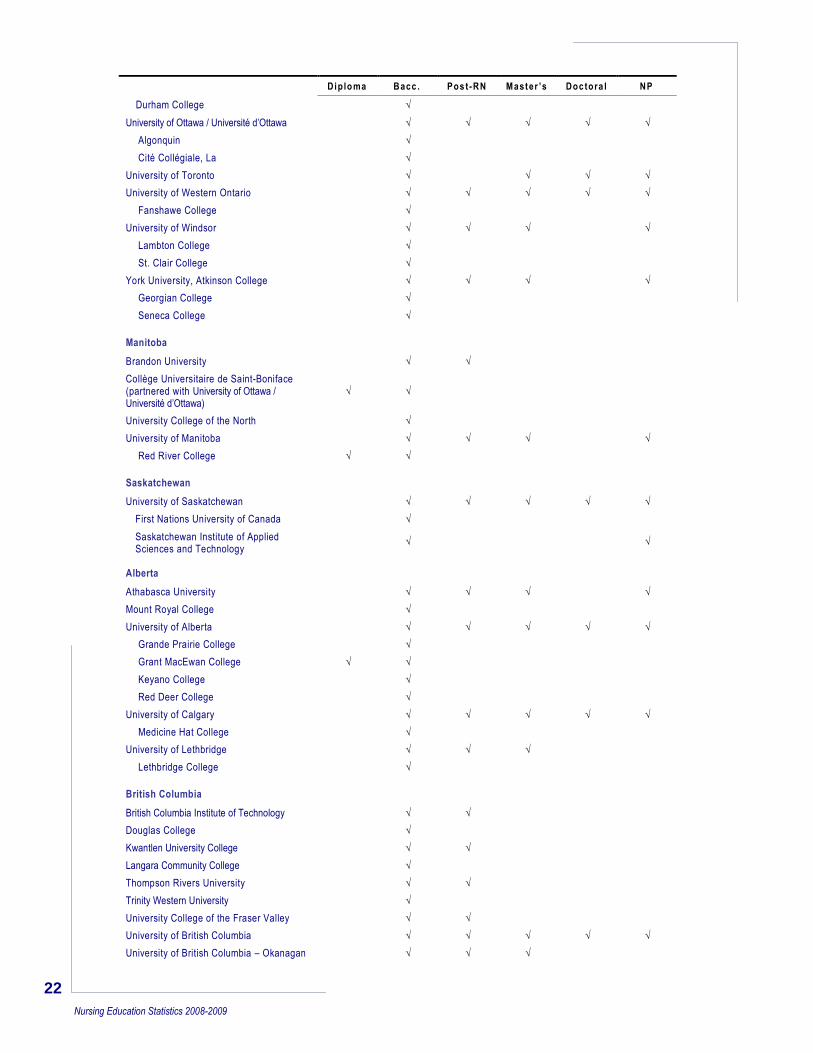
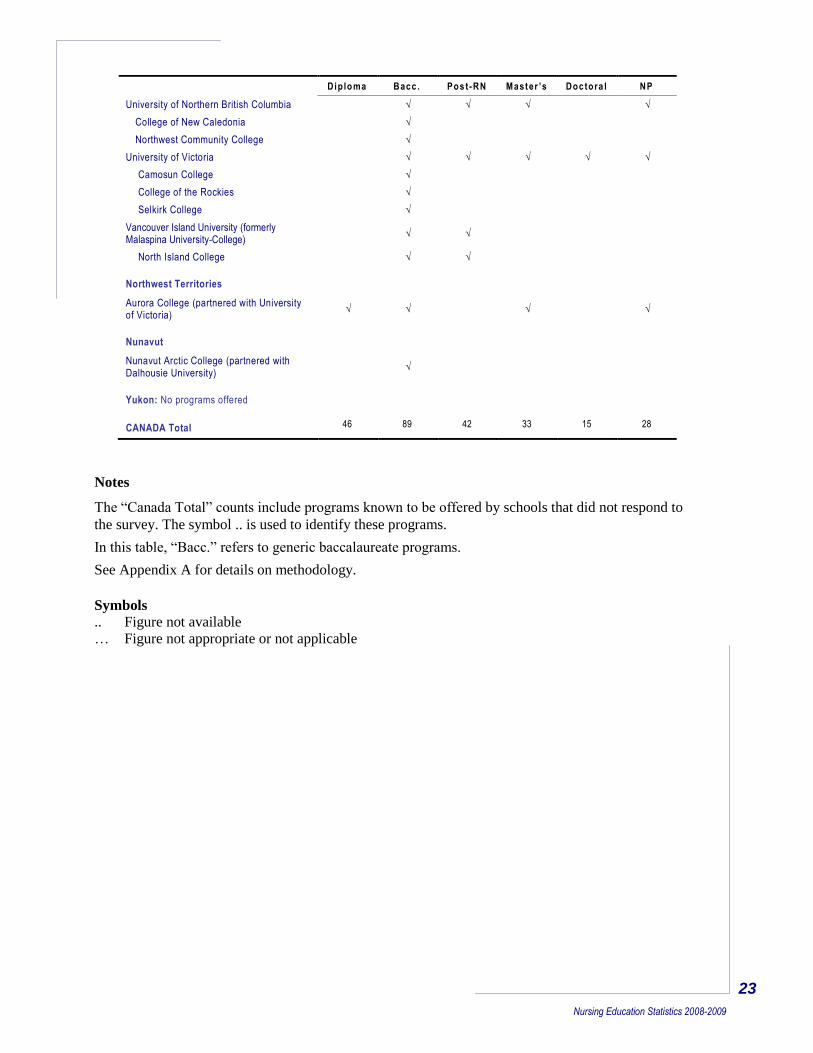
Table 1: Education Programs by Province and Territory – Schools Offering Diploma, Undergraduate and Graduate Programs, 2008-2009, by Program Category
Baccalaureate collaborative partnerships are shown by indenting the name of the partner school under
that of the degree-granting institution.
Diplo ma Bacc . Pos t-RN Master ’s Doc tora l NP
Newfoundland and Labrador
Memorial University of Newfoundland √ √ √ √
Centre for Nursing Studies √ √
Western Regional School of Nursing √
Prince Edward Island
University of Prince Edward Island √
Nova Scotia
Cape Breton University √
Dalhousie University √ √ √ √ √
St. Francis Xavier University √ √
New Brunswick
Université de Moncton √ √ √ √
University of New Brunswick √ √ √ √
Quebec
Abitibi-Témiscamingue, CEGEP ..
Alma, CEGEP ..
André-Laurendeau, CEGEP ..
Baie-Comeau, CEGEP √
Beauce-Appalaches, CEGEP √
Bois-de-Boulogne, CEGEP √
Chicoutimi, CEGEP ..
Dawson, CEGEP √
Drummondville, CEGEP √
Édouard-Montpetit, CEGEP ..
François-Xavier-Garneau, CEGEP ..
Gaspésie, CEGEP √
Granby Haute-Yamaska, CEGEP ..
Heritage, CEGEP √
John-Abbott, CEGEP ..
Jonquière, CEGEP √
La Pocatière, CEGEP ..
Lévis-Lauzon, CEGEP √
Limoilou, CEGEP √
Maisonneuve, CEGEP ..
Matane, CEGEP √
McGill University √ √ √ √ √
Montmorency, CEGEP √
Outaouais, CEGEP √
Régional de Lanaudière, CEGEP ..
Rimouski, CEGEP √
Rivière-du-Loup, CEGEP √
21
Nursing Education Statistics 2008-2009
Diplo ma Bacc . Pos t-RN Master ’s Doc tora l NP
Sainte-Foy, CEGEP ..
Saint-Félicien, CEGEP ..
Saint-Hyacinthe, CEGEP √
Saint-Jean-sur-Richelieu, CEGEP ..
Saint-Jérome, CEGEP √
Saint-Laurent, CEGEP √
Sept- Îles, CEGEP ..
Shawinigan, CEGEP ..
Sherbrooke, CEGEP √
Sorel-Tracy, CEGEP √
Thetford, CEGEP √
Trois-Rivières, CEGEP ..
Université Laval √ √ √ √ √
Université de Montréal √ √ √ √ √
Université de Sherbrooke √ √ √
Université du Québec à Chicoutimi √ √ √
Université du Québec à Rimouski √ √
Université du Québec à Trois-Rivières .. .. ..
Université du Québec en Abitibi-Témiscamingue
√
Université du Québec en Outaouais √ √ √
Valleyfield, CEGEP √
Vanier, CEGEP √
Victoriaville, CEGEP ..
Vieux-Montréal, CEGEP ..
Ontario
Brock University √ √
Loyalist College √
Humber College (partnered with U. New Brunswick)
√
Lakehead University √ √ √ √
Confederation College √
Laurentian University / Université Laurentienne
√ √ √ √
Cambrian College √
Collège Boréal ..
Northern College √
St. Lawrence College √
Sault College √
McMaster University √ √ √ √ √
Conestoga College √
Mohawk College √
Nipissing University √
Canadore College √
Queen’s University √ √ √ √ √
Ryerson University √ √ √ √
Centennial College √
George Brown College √
Trent University/Fleming College √
University of Ontario Institute of Technology √ √
22
Nursing Education Statistics 2008-2009
Diplo ma Bacc . Pos t-RN Master ’s Doc tora l NP
Durham College √
University of Ottawa / Université d’Ottawa √ √ √ √ √
Algonquin √
Cité Collégiale, La √
University of Toronto √ √ √ √
University of Western Ontario √ √ √ √ √
Fanshawe College √
University of Windsor √ √ √ √
Lambton College √
St. Clair College √
York University, Atkinson College √ √ √ √
Georgian College √
Seneca College √
Manitoba
Brandon University √ √
Collège Universitaire de Saint-Boniface (partnered with University of Ottawa / Université d’Ottawa)
√ √
University College of the North √
University of Manitoba √ √ √ √
Red River College √ √
Saskatchewan
University of Saskatchewan √ √ √ √ √
First Nations University of Canada √
Saskatchewan Institute of Applied Sciences and Technology
√ √
Alberta
Athabasca University √ √ √ √
Mount Royal College √
University of Alberta √ √ √ √ √
Grande Prairie College √
Grant MacEwan College √ √
Keyano College √
Red Deer College √
University of Calgary √ √ √ √ √
Medicine Hat College √
University of Lethbridge √ √ √
Lethbridge College √
British Columbia
British Columbia Institute of Technology √ √
Douglas College √
Kwantlen University College √ √
Langara Community College √
Thompson Rivers University √ √
Trinity Western University √
University College of the Fraser Valley √ √
University of British Columbia √ √ √ √ √
University of British Columbia – Okanagan √ √ √
23
Nursing Education Statistics 2008-2009
Diplo ma Bacc . Pos t-RN Master ’s Doc tora l NP
University of Northern British Columbia √ √ √ √
College of New Caledonia √
Northwest Community College √
University of Victoria √ √ √ √ √
Camosun College √
College of the Rockies √
Selkirk College √
Vancouver Island University (formerly Malaspina University-College)
√ √
North Island College √ √
Northwest Territories
Aurora College (partnered with University of Victoria)
√ √ √ √
Nunavut
Nunavut Arctic College (partnered with Dalhousie University)
√
Yukon: No programs offered
CANADA Total 46 89 42 33 15 28
Notes
The “Canada Total” counts include programs known to be offered by schools that did not respond to
the survey. The symbol .. is used to identify these programs.
In this table, “Bacc.” refers to generic baccalaureate programs.
See Appendix A for details on methodology.
Symbols
.. Figure not available
… Figure not appropriate or not applicable
24
Nursing Education Statistics 2008-2009
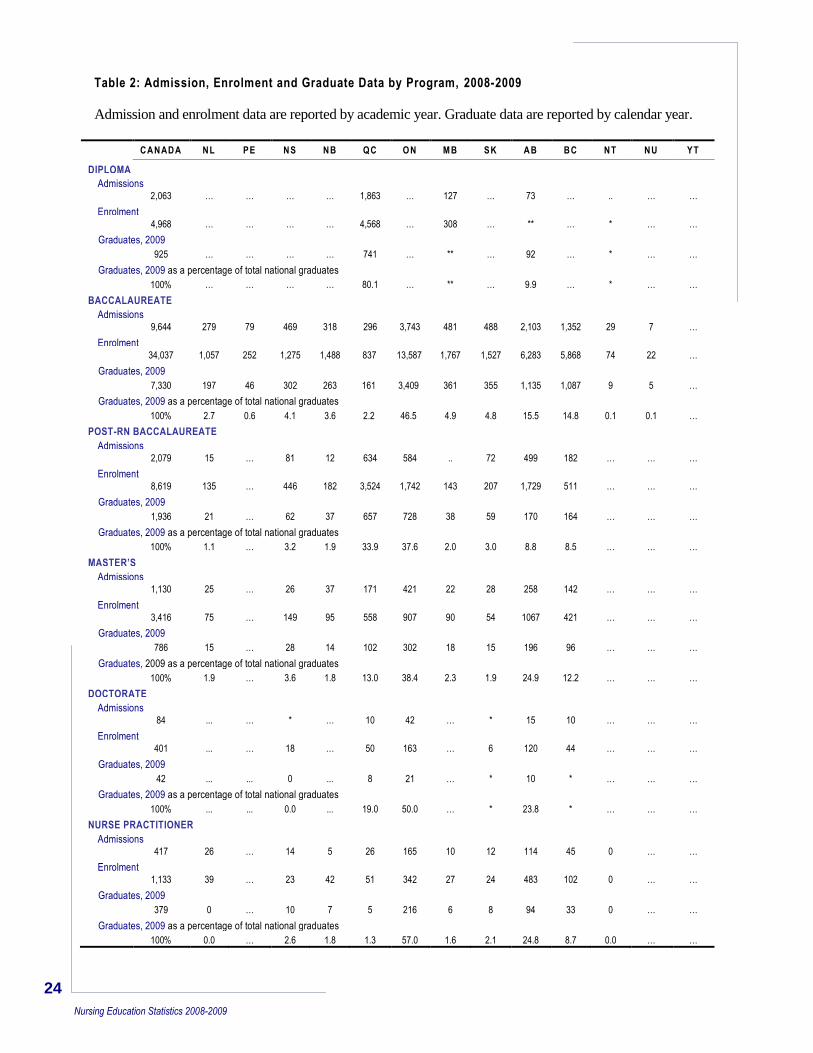
Table 2: Admission, Enrolment and Graduate Data by Program, 2008-2009
Admission and enrolment data are reported by academic year. Graduate data are reported by calendar year.
CANADA NL PE NS NB QC ON MB SK AB BC NT NU YT
DIPLOMA
Admissions 2,063 … … … … 1,863 … 127 … 73 … .. … …
Enrolment 4,968 … … … … 4,568 … 308 … ** … * … …
Graduates, 2009
925 … … … … 741 … ** … 92 … * … …
Graduates, 2009 as a percentage of total national graduates
100% … … … … 80.1 … ** … 9.9 … * … …
BACCALAUREATE
Admissions 9,644 279 79 469 318 296 3,743 481 488 2,103 1,352 29 7 …
Enrolment 34,037 1,057 252 1,275 1,488 837 13,587 1,767 1,527 6,283 5,868 74 22 …
Graduates, 2009
7,330 197 46 302 263 161 3,409 361 355 1,135 1,087 9 5 …
Graduates, 2009 as a percentage of total national graduates
100% 2.7 0.6 4.1 3.6 2.2 46.5 4.9 4.8 15.5 14.8 0.1 0.1 …
POST-RN BACCALAUREATE
Admissions 2,079 15 … 81 12 634 584 .. 72 499 182 … … …
Enrolment 8,619 135 … 446 182 3,524 1,742 143 207 1,729 511 … … …
Graduates, 2009
1,936 21 … 62 37 657 728 38 59 170 164 … … …
Graduates, 2009 as a percentage of total national graduates
100% 1.1 … 3.2 1.9 33.9 37.6 2.0 3.0 8.8 8.5 … … …
MASTER’S
Admissions 1,130 25 … 26 37 171 421 22 28 258 142 … … …
Enrolment 3,416 75 … 149 95 558 907 90 54 1067 421 … … …
Graduates, 2009
786 15 … 28 14 102 302 18 15 196 96 … … …
Graduates, 2009 as a percentage of total national graduates
100% 1.9 … 3.6 1.8 13.0 38.4 2.3 1.9 24.9 12.2 … … …
DOCTORATE
Admissions 84 ... … * … 10 42 … * 15 10 … … …
Enrolment 401 ... … 18 … 50 163 … 6 120 44 … … …
Graduates, 2009
42 ... ... 0 ... 8 21 … * 10 * … … …
Graduates, 2009 as a percentage of total national graduates
100% ... ... 0.0 ... 19.0 50.0 … * 23.8 * … … …
NURSE PRACTITIONER
Admissions 417 26 … 14 5 26 165 10 12 114 45 0 … …
Enrolment 1,133 39 … 23 42 51 342 27 24 483 102 0 … …
Graduates, 2009
379 0 … 10 7 5 216 6 8 94 33 0 … …
Graduates, 2009 as a percentage of total national graduates
100% 0.0 … 2.6 1.8 1.3 57.0 1.6 2.1 24.8 8.7 0.0 … …

25
Nursing Education Statistics 2008-2009
Notes
OIIQ reports the following for Quebec diploma and baccalaureate programs: 3,993 students
were admitted to diploma programs and 469 students to baccalaureate programs; 1,996
students graduated from diploma programs and 313 from baccalaureate programs. Enrolment
data were not reported.
Totals may not sum to 100% due to rounding.
Summary of omitted and unusable data:
New Brunswick
Post-RN Baccalaureate 1 school‟s admission data
Quebec
Baccalaureate 1 school‟s admission data
Post-RN Baccalaureate 2 schools‟ admission data
Master‟s 2 schools‟ admission data
Ontario
Baccalaureate 3 schools‟ admission data
Post-RN Baccalaureate 2 schools‟ admission data
Nurse Practitioner 2 schools‟ admission data
Manitoba
Post-RN Baccalaureate 2 schools‟ admission data
Alberta
Post-RN Baccalaureate 1 school‟s admission data
British Columbia
Baccalaureate 2 schools‟ admission data
Post-RN Baccalaureate 6 schools‟ admission data; 2 schools‟ enrolment data;
1 school‟s graduate data
Master‟s 1 school‟s admission data
Symbols
.. Figure not available … Figure not appropriate or not applicable
* Value suppressed in accordance with CNA privacy policy; cell value is between 1 and 4
** Value suppressed to ensure confidentiality; cell value is 5 or greater
26
Nursing Education Statistics 2008-2009
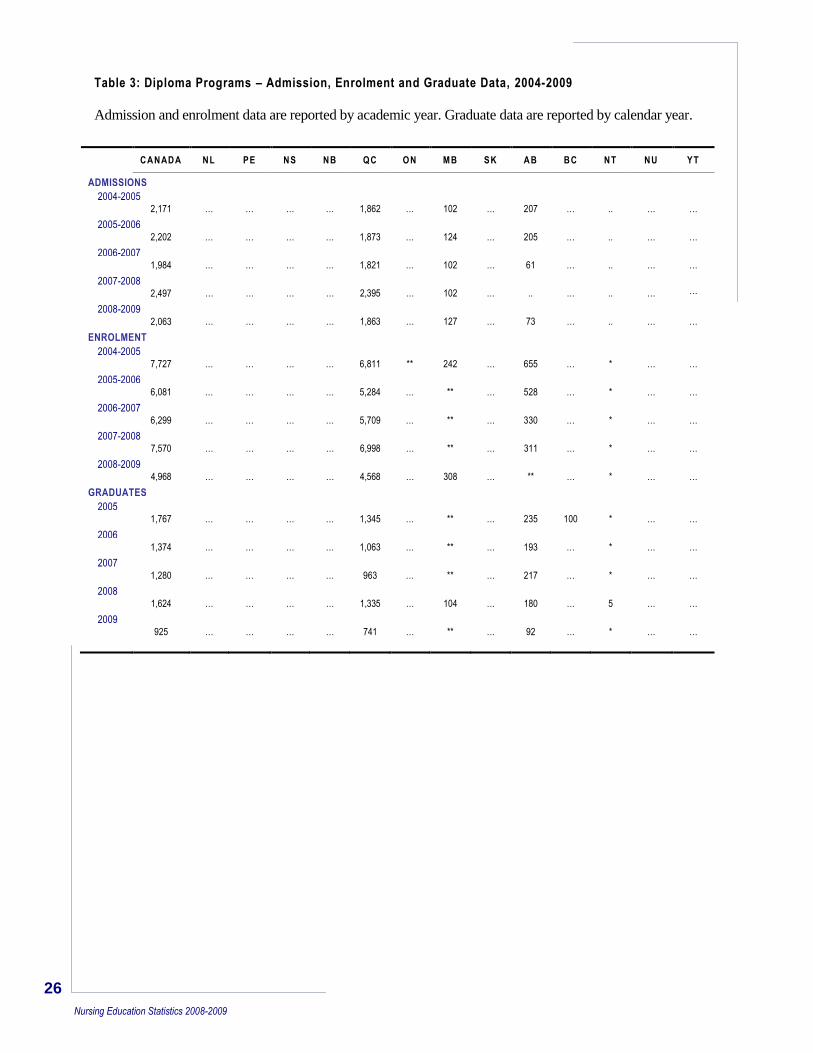
Table 3: Diploma Programs – Admission, Enrolment and Graduate Data, 2004-2009
Admission and enrolment data are reported by academic year. Graduate data are reported by calendar year.
CANADA NL PE NS NB QC ON MB SK AB BC NT NU YT
ADMISSIONS
2004-2005 2,171 … … … … 1,862 … 102 … 207 … .. … …
2005-2006 2,202 … … … … 1,873 … 124 … 205 … .. … …
2006-2007 1,984 … … … … 1,821 … 102 … 61 … .. … …
2007-2008 2,497 … … … … 2,395 … 102 … .. … .. … …
2008-2009
2,063 … … … … 1,863 … 127 … 73 … .. … …
ENROLMENT
2004-2005 7,727 … … … … 6,811 ** 242 … 655 … * … …
2005-2006 6,081 … … … … 5,284 … ** … 528 … * … …
2006-2007 6,299 … … … … 5,709 … ** … 330 … * … …
2007-2008 7,570 … … … … 6,998 … ** … 311 … * … …
2008-2009 4,968 … … … … 4,568 … 308 … ** … * … …
GRADUATES
2005 1,767 … … … … 1,345 … ** … 235 100 * … …
2006
1,374 … … … … 1,063 … ** … 193 … * … …
2007 1,280 … … … … 963 … ** … 217 … * … …
2008 1,624 … … … … 1,335 … 104 … 180 … 5 … …
2009 925 … … … … 741 … ** … 92 … * … …
27
Nursing Education Statistics 2008-2009
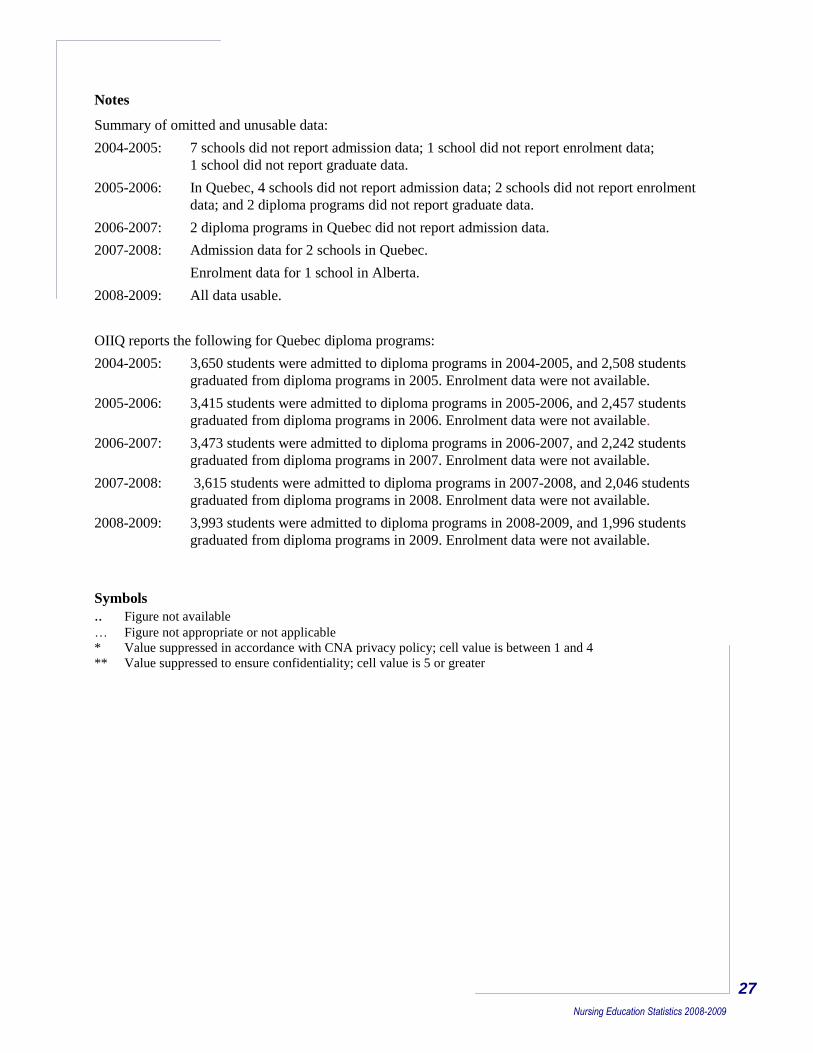
Notes
Summary of omitted and unusable data:
2004-2005: 7 schools did not report admission data; 1 school did not report enrolment data;
1 school did not report graduate data.
2005-2006: In Quebec, 4 schools did not report admission data; 2 schools did not report enrolment
data; and 2 diploma programs did not report graduate data.
2006-2007: 2 diploma programs in Quebec did not report admission data.
2007-2008: Admission data for 2 schools in Quebec.
Enrolment data for 1 school in Alberta.
2008-2009: All data usable.
OIIQ reports the following for Quebec diploma programs:
2004-2005: 3,650 students were admitted to diploma programs in 2004-2005, and 2,508 students
graduated from diploma programs in 2005. Enrolment data were not available.
2005-2006: 3,415 students were admitted to diploma programs in 2005-2006, and 2,457 students
graduated from diploma programs in 2006. Enrolment data were not available.
2006-2007: 3,473 students were admitted to diploma programs in 2006-2007, and 2,242 students
graduated from diploma programs in 2007. Enrolment data were not available.
2007-2008: 3,615 students were admitted to diploma programs in 2007-2008, and 2,046 students
graduated from diploma programs in 2008. Enrolment data were not available.
2008-2009: 3,993 students were admitted to diploma programs in 2008-2009, and 1,996 students
graduated from diploma programs in 2009. Enrolment data were not available.
Symbols
.. Figure not available … Figure not appropriate or not applicable
* Value suppressed in accordance with CNA privacy policy; cell value is between 1 and 4
** Value suppressed to ensure confidentiality; cell value is 5 or greater
28
Nursing Education Statistics 2008-2009
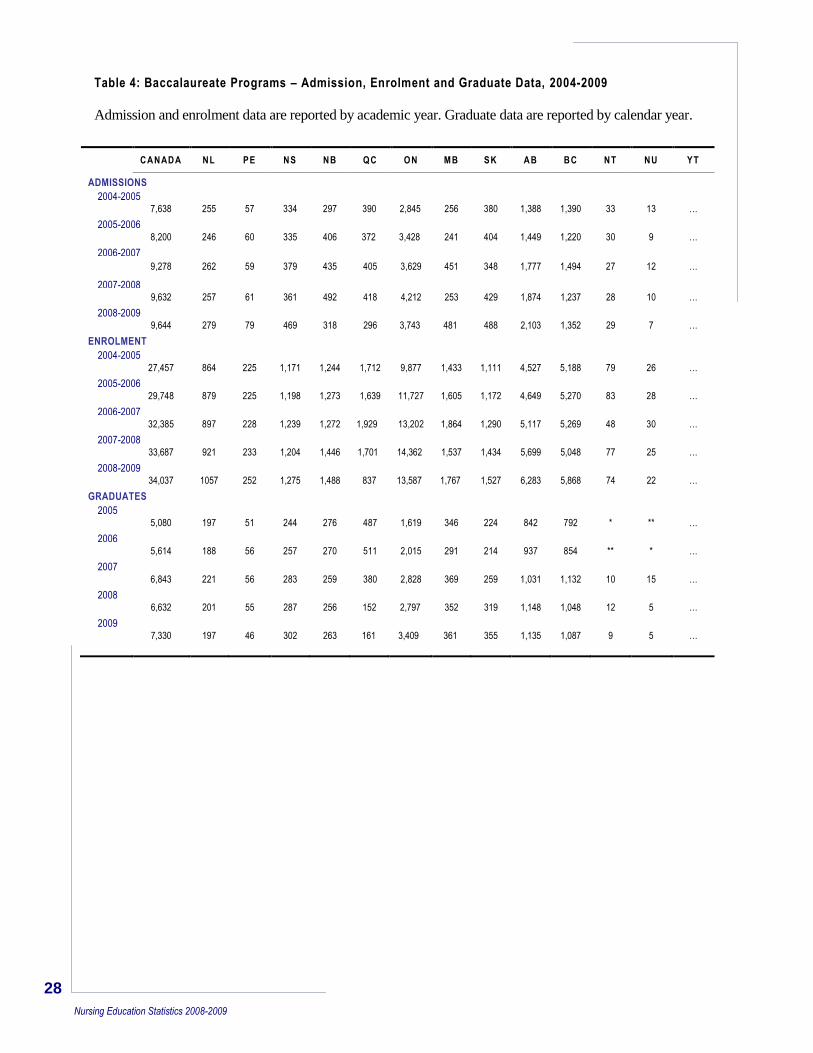
Table 4: Baccalaureate Programs – Admission, Enrolment and Graduate Data, 2004-2009
Admission and enrolment data are reported by academic year. Graduate data are reported by calendar year.
CANADA NL PE NS NB QC ON MB SK AB BC NT NU YT
ADMISSIONS
2004-2005 7,638 255 57 334 297 390 2,845 256 380 1,388 1,390 33 13 …
2005-2006 8,200 246 60 335 406 372 3,428 241 404 1,449 1,220 30 9 …
2006-2007 9,278 262 59 379 435 405 3,629 451 348 1,777 1,494 27 12 …
2007-2008 9,632 257 61 361 492 418 4,212 253 429 1,874 1,237 28 10 …
2008-2009 9,644 279 79 469 318 296 3,743 481 488 2,103 1,352 29 7 …
ENROLMENT
2004-2005 27,457 864 225 1,171 1,244 1,712 9,877 1,433 1,111 4,527 5,188 79 26 …
2005-2006 29,748 879 225 1,198 1,273 1,639 11,727 1,605 1,172 4,649 5,270 83 28 …
2006-2007 32,385 897 228 1,239 1,272 1,929 13,202 1,864 1,290 5,117 5,269 48 30 …
2007-2008 33,687 921 233 1,204 1,446 1,701 14,362 1,537 1,434 5,699 5,048 77 25 …
2008-2009 34,037 1057 252 1,275 1,488 837 13,587 1,767 1,527 6,283 5,868 74 22 …
GRADUATES
2005 5,080 197 51 244 276 487 1,619 346 224 842 792 * ** …
2006
5,614 188 56 257 270 511 2,015 291 214 937 854 ** * …
2007
6,843 221 56 283 259 380 2,828 369 259 1,031 1,132 10 15 …
2008
6,632 201 55 287 256 152 2,797 352 319 1,148 1,048 12 5 …
2009 7,330 197 46 302 263 161 3,409 361 355 1,135 1,087 9 5 …
29
Nursing Education Statistics 2008-2009
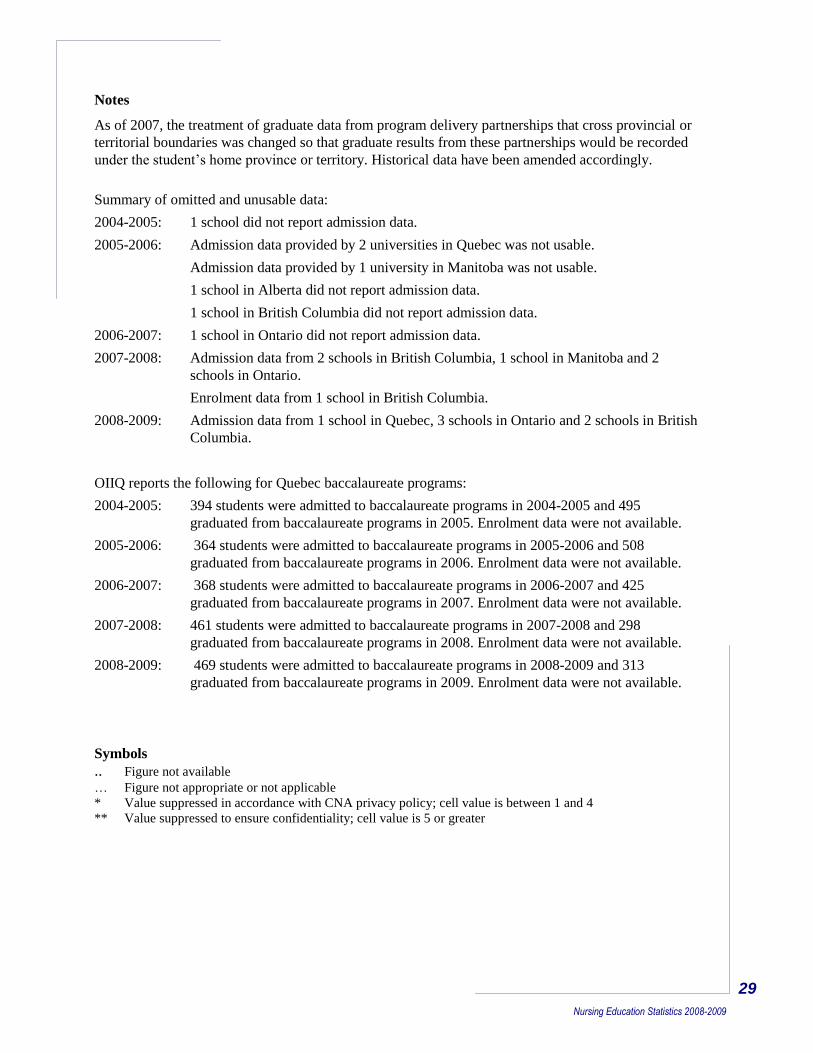
Notes
As of 2007, the treatment of graduate data from program delivery partnerships that cross provincial or
territorial boundaries was changed so that graduate results from these partnerships would be recorded
under the student‟s home province or territory. Historical data have been amended accordingly.
Summary of omitted and unusable data:
2004-2005: 1 school did not report admission data.
2005-2006: Admission data provided by 2 universities in Quebec was not usable.
Admission data provided by 1 university in Manitoba was not usable.
1 school in Alberta did not report admission data.
1 school in British Columbia did not report admission data.
2006-2007: 1 school in Ontario did not report admission data.
2007-2008: Admission data from 2 schools in British Columbia, 1 school in Manitoba and 2
schools in Ontario.
Enrolment data from 1 school in British Columbia.
2008-2009: Admission data from 1 school in Quebec, 3 schools in Ontario and 2 schools in British
Columbia.
OIIQ reports the following for Quebec baccalaureate programs:
2004-2005: 394 students were admitted to baccalaureate programs in 2004-2005 and 495
graduated from baccalaureate programs in 2005. Enrolment data were not available.
2005-2006: 364 students were admitted to baccalaureate programs in 2005-2006 and 508
graduated from baccalaureate programs in 2006. Enrolment data were not available.
2006-2007: 368 students were admitted to baccalaureate programs in 2006-2007 and 425
graduated from baccalaureate programs in 2007. Enrolment data were not available.
2007-2008: 461 students were admitted to baccalaureate programs in 2007-2008 and 298
graduated from baccalaureate programs in 2008. Enrolment data were not available.
2008-2009: 469 students were admitted to baccalaureate programs in 2008-2009 and 313
graduated from baccalaureate programs in 2009. Enrolment data were not available.
Symbols
.. Figure not available … Figure not appropriate or not applicable
* Value suppressed in accordance with CNA privacy policy; cell value is between 1 and 4
** Value suppressed to ensure confidentiality; cell value is 5 or greater
30
Nursing Education Statistics 2008-2009
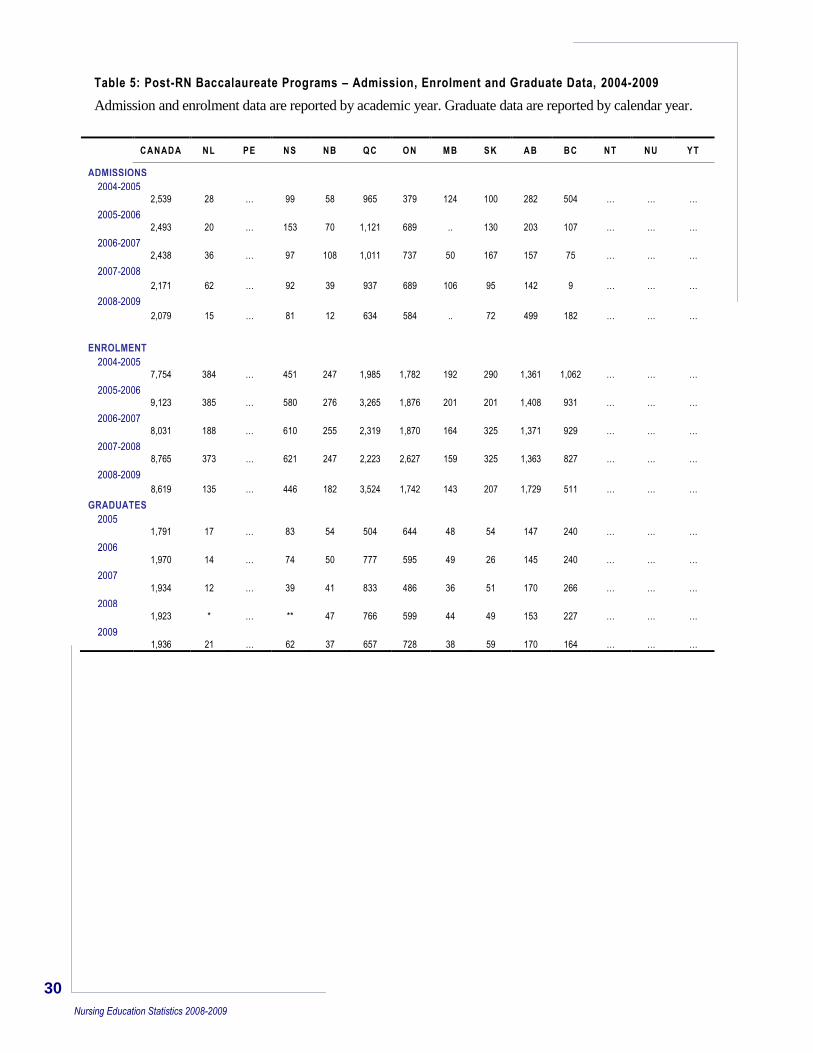
Table 5: Post-RN Baccalaureate Programs – Admission, Enrolment and Graduate Data, 2004-2009
Admission and enrolment data are reported by academic year. Graduate data are reported by calendar year.
CANADA NL PE NS NB QC ON MB SK AB BC NT NU YT
ADMISSIONS
2004-2005 2,539 28 … 99 58 965 379 124 100 282 504 … … …
2005-2006 2,493 20 … 153 70 1,121 689 .. 130 203 107 … … …
2006-2007 2,438 36 … 97 108 1,011 737 50 167 157 75 … … …
2007-2008
2,171 62 … 92 39 937 689 106 95 142 9 … … …
2008-2009
2,079 15 … 81 12 634 584 .. 72 499 182 … … …
ENROLMENT
2004-2005 7,754 384 … 451 247 1,985 1,782 192 290 1,361 1,062 … … …
2005-2006 9,123 385 … 580 276 3,265 1,876 201 201 1,408 931 … … …
2006-2007 8,031 188 … 610 255 2,319 1,870 164 325 1,371 929 … … …
2007-2008 8,765 373 … 621 247 2,223 2,627 159 325 1,363 827 … … …
2008-2009
8,619 135 … 446 182 3,524 1,742 143 207 1,729 511 … … …
GRADUATES
2005 1,791 17 … 83 54 504 644 48 54 147 240 … … …
2006 1,970 14 … 74 50 777 595 49 26 145 240 … … …
2007 1,934 12 … 39 41 833 486 36 51 170 266 … … …
2008 1,923 * … ** 47 766 599 44 49 153 227 … … …
2009 1,936 21 … 62 37 657 728 38 59 170 164 … … …
31
Nursing Education Statistics 2008-2009
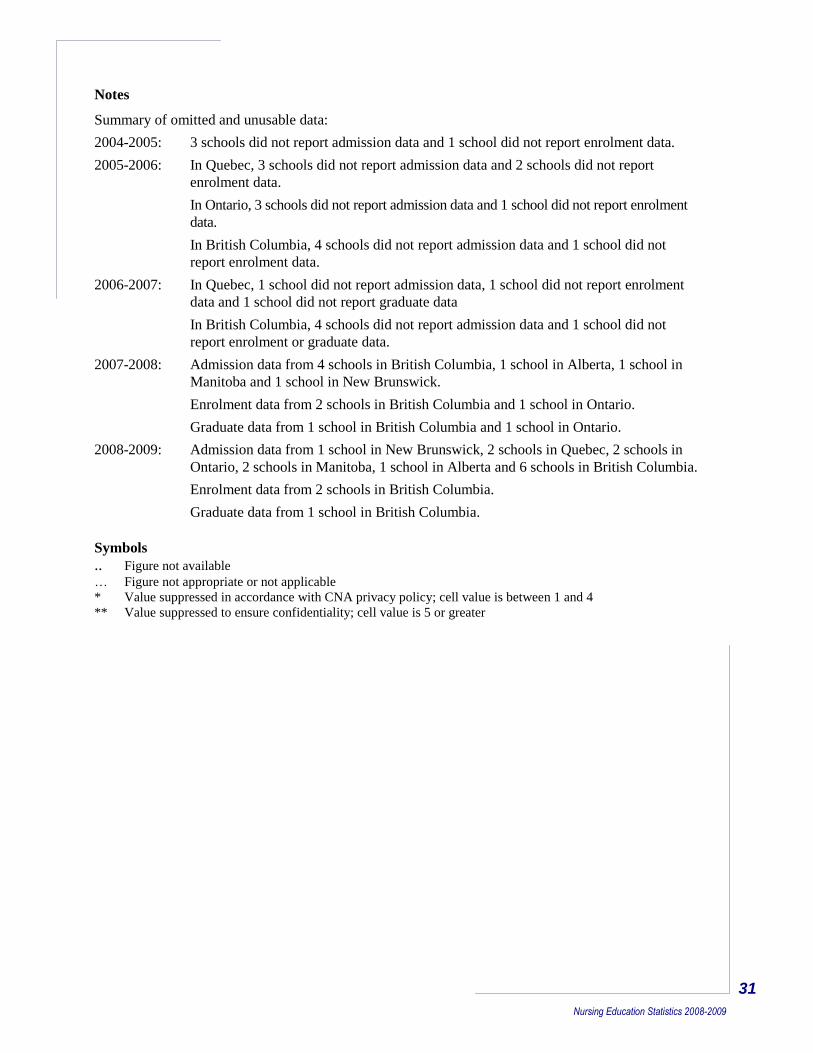
Notes
Summary of omitted and unusable data:
2004-2005: 3 schools did not report admission data and 1 school did not report enrolment data.
2005-2006: In Quebec, 3 schools did not report admission data and 2 schools did not report
enrolment data.
In Ontario, 3 schools did not report admission data and 1 school did not report enrolment
data.
In British Columbia, 4 schools did not report admission data and 1 school did not
report enrolment data.
2006-2007: In Quebec, 1 school did not report admission data, 1 school did not report enrolment
data and 1 school did not report graduate data
In British Columbia, 4 schools did not report admission data and 1 school did not
report enrolment or graduate data.
2007-2008: Admission data from 4 schools in British Columbia, 1 school in Alberta, 1 school in
Manitoba and 1 school in New Brunswick.
Enrolment data from 2 schools in British Columbia and 1 school in Ontario.
Graduate data from 1 school in British Columbia and 1 school in Ontario.
2008-2009: Admission data from 1 school in New Brunswick, 2 schools in Quebec, 2 schools in
Ontario, 2 schools in Manitoba, 1 school in Alberta and 6 schools in British Columbia.
Enrolment data from 2 schools in British Columbia.
Graduate data from 1 school in British Columbia.
Symbols
.. Figure not available … Figure not appropriate or not applicable
* Value suppressed in accordance with CNA privacy policy; cell value is between 1 and 4
** Value suppressed to ensure confidentiality; cell value is 5 or greater
32
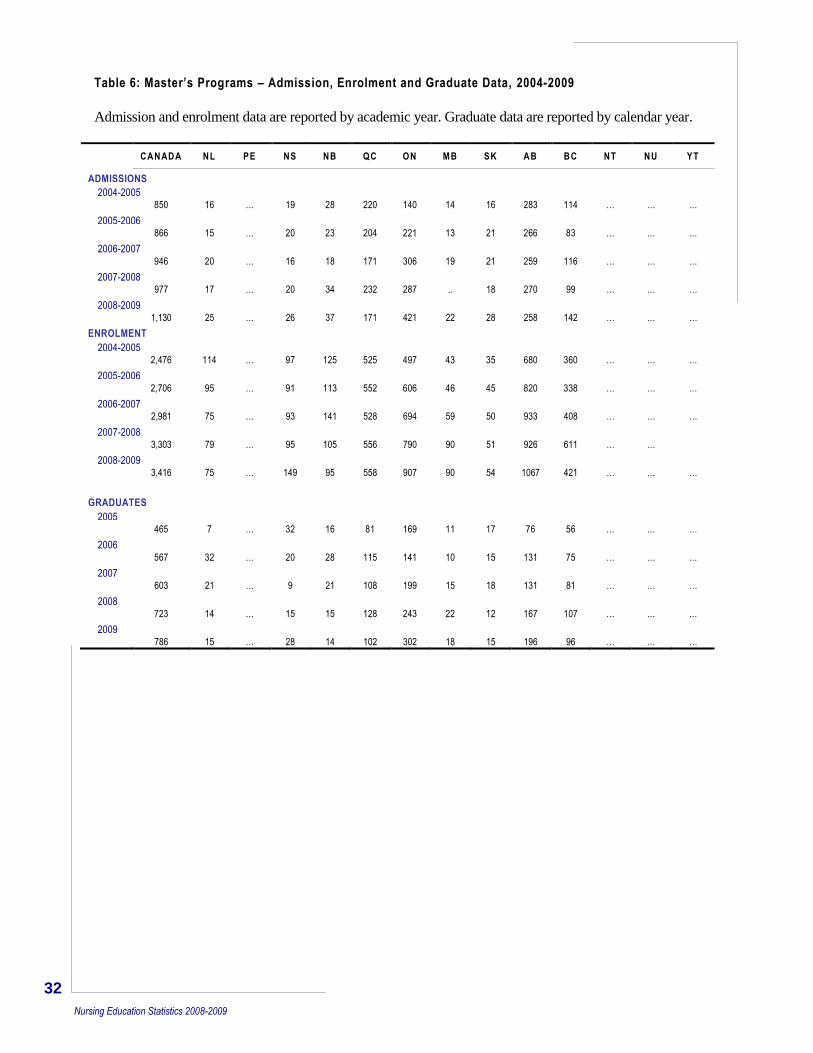
Nursing Education Statistics 2008-2009
Table 6: Master’s Programs – Admission, Enrolment and Graduate Data, 2004-2009
Admission and enrolment data are reported by academic year. Graduate data are reported by calendar year.
CANADA NL PE NS NB QC ON MB SK AB BC NT NU YT
ADMISSIONS
2004-2005 850 16 … 19 28 220 140 14 16 283 114 … … …
2005-2006 866 15 … 20 23 204 221 13 21 266 83 … … …
2006-2007 946 20 … 16 18 171 306 19 21 259 116 … … …
2007-2008 977 17 … 20 34 232 287 .. 18 270 99 … … …
2008-2009 1,130 25 … 26 37 171 421 22 28 258 142 … … …
ENROLMENT
2004-2005 2,476 114 … 97 125 525 497 43 35 680 360 … … …
2005-2006 2,706 95 … 91 113 552 606 46 45 820 338 … … …
2006-2007 2,981 75 … 93 141 528 694 59 50 933 408 … … …
2007-2008 3,303 79 … 95 105 556 790 90 51 926 611 … …
2008-2009 3,416 75 … 149 95 558 907 90 54 1067 421 … … …
GRADUATES
2005 465 7 … 32 16 81 169 11 17 76 56 … … …
2006 567 32 … 20 28 115 141 10 15 131 75 … … …
2007 603 21 … 9 21 108 199 15 18 131 81 … … …
2008 723 14 … 15 15 128 243 22 12 167 107 … … …
2009 786 15 … 28 14 102 302 18 15 196 96 … … …

33
Nursing Education Statistics 2008-2009
Notes
Summary of omitted and unusable data:
2004-2005: All schools reported all data.
2005-2006: In Ontario, 2 schools did not report admission data.
In British Columbia, 1 school did not report admission data.
2006-2007: In Quebec, 1 school did not report admission data, 1 school did not report enrolment
data and 1 school did not report graduate data.
In Ontario, 1 school did not report admission data.
In Alberta, 1 school did not report admission data.
In British Columbia, 1 school did not report admission data.
2007-2008: Admission data from 1 school in British Columbia, 1 school in Manitoba and 1 school
in Ontario.
2008-2009: Admission data from 2 schools in Quebec and 1 school in British Columbia.
Symbols
.. Figure not available … Figure not appropriate or not applicable
34
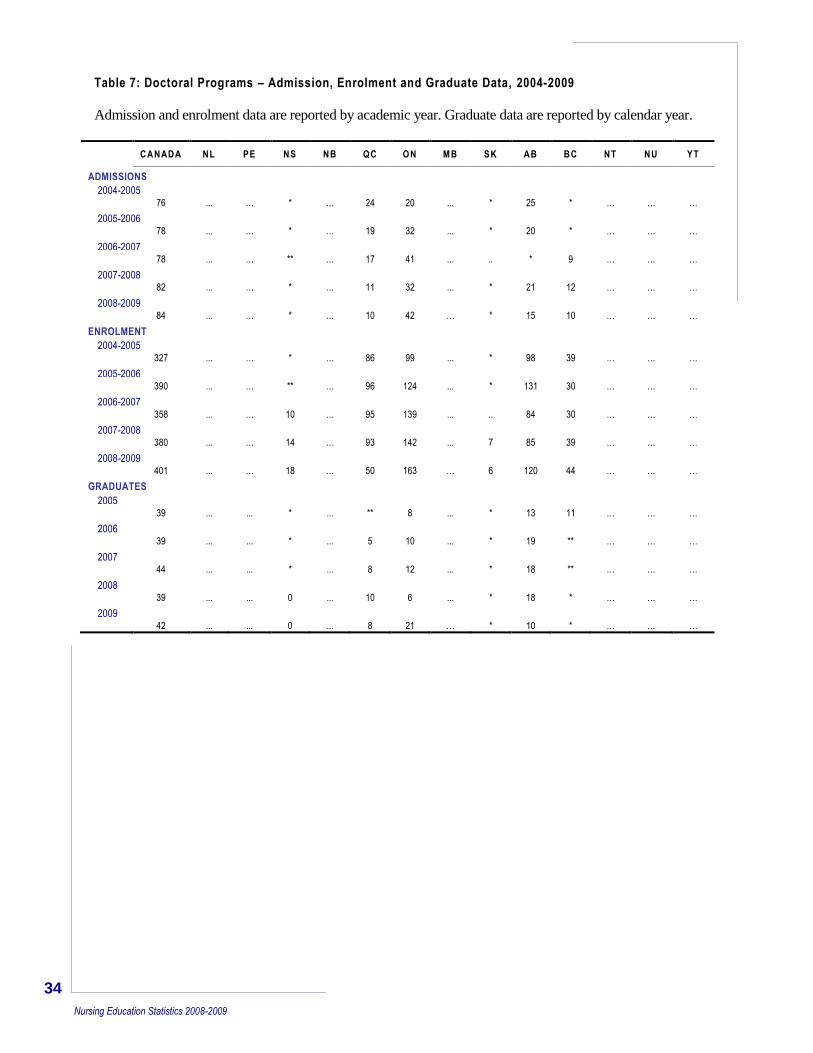
Nursing Education Statistics 2008-2009
Table 7: Doctoral Programs – Admission, Enrolment and Graduate Data, 2004-2009
Admission and enrolment data are reported by academic year. Graduate data are reported by calendar year.
CANADA NL PE NS NB QC ON MB SK AB BC NT NU YT
ADMISSIONS
2004-2005
76 ... … * … 24 20 ... * 25 * … … …
2005-2006
78 ... … * … 19 32 ... * 20 * … … …
2006-2007
78 ... … ** … 17 41 ... .. * 9 … … …
2007-2008
82 ... … * … 11 32 ... * 21 12 … … …
2008-2009 84 ... … * … 10 42 … * 15 10 … … …
ENROLMENT
2004-2005
327 ... … * … 86 99 ... * 98 39 … … …
2005-2006
390 ... … ** … 96 124 ... * 131 30 … … …
2006-2007
358 ... … 10 … 95 139 ... .. 84 30 … … …
2007-2008
380 ... … 14 … 93 142 ... 7 85 39 … … …
2008-2009 401 ... … 18 … 50 163 … 6 120 44 … … …
GRADUATES
2005
39 ... ... * ... ** 8 ... * 13 11 … … …
2006
39 ... ... * ... 5 10 ... * 19 ** … … …
2007
44 ... ... * ... 8 12 ... * 18 ** … … …
2008
39 ... ... 0 ... 10 6 ... * 18 * … … …
2009
42 ... ... 0 ... 8 21 … * 10 * … … …
35
Nursing Education Statistics 2008-2009
Notes
Summary of omitted and unusable data:
2004-2005: All schools reported all data.
2005-2006: In Quebec, 1 school did not report admission data.
In Manitoba, no doctoral data were reported.
In British Columbia, 1 school did not report admission data.
2006-2007: In Quebec, 1 school did not report admission data and 1 school did not report graduate
data.
In Alberta, 1 school did not report admission data.
2007-2008: Admission data from 1 school in Quebec.
2008-2009: All schools reported all data.
Symbols
.. Figure not available
… Figure not appropriate or not applicable
* Value suppressed in accordance with CNA privacy policy; cell value is between 1 and 4
** Value suppressed to ensure confidentiality; cell value is 5 or greater
36
Nursing Education Statistics 2008-2009
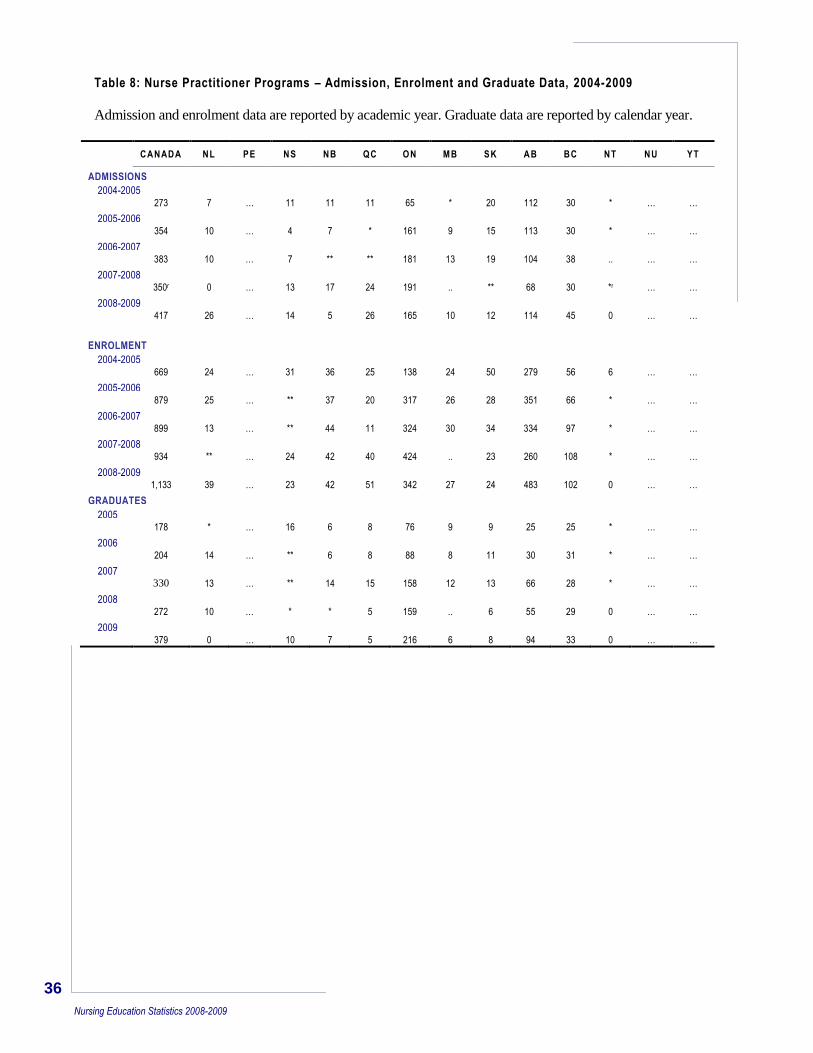
Table 8: Nurse Practitioner Programs – Admission, Enrolment and Graduate Data, 2004-2009
Admission and enrolment data are reported by academic year. Graduate data are reported by calendar year.
CANADA NL PE NS NB QC ON MB SK AB BC NT NU YT
ADMISSIONS
2004-2005
273 7 … 11 11 11 65 * 20 112 30 * … …
2005-2006
354 10 … 4 7 * 161 9 15 113 30 * … …
2006-2007
383 10 … 7 ** ** 181 13 19 104 38 .. … …
2007-2008
350r 0 … 13 17 24 191 .. ** 68 30 *r … …
2008-2009 417 26 … 14 5 26 165 10 12 114 45 0 … …
ENROLMENT
2004-2005
669 24 … 31 36 25 138 24 50 279 56 6 … …
2005-2006
879 25 … ** 37 20 317 26 28 351 66 * … …
2006-2007
899 13 … ** 44 11 324 30 34 334 97 * … …
2007-2008
934 ** … 24 42 40 424 .. 23 260 108 * … …
2008-2009 1,133 39 … 23 42 51 342 27 24 483 102 0 … …
GRADUATES
2005
178 * … 16 6 8 76 9 9 25 25 * … …
2006 204 14 … ** 6 8 88 8 11 30 31 * … …
2007 330 13 … ** 14 15 158 12 13 66 28 * … …
2008 272 10 … * * 5 159 .. 6 55 29 0 … …
2009 379 0 … 10 7 5 216 6 8 94 33 0 … …
37
Nursing Education Statistics 2008-2009
Notes
Summary of omitted and unusable data:
2004-2005: 4 schools did not report admission data.
2005-2006: 1 school in Ontario did not report admission data.
2006-2007: All schools reported all data.
2007-2008: Admission data from 2 schools in Alberta, 1 school in Manitoba and 1 school in
Newfoundland and Labrador.
Enrolment data from 2 schools in Alberta and 1 school in Manitoba.
Graduate data from 1 school in Alberta, 1 school in Manitoba and 1 school in the
Northwest Territories.
2008-2009: Admission data from 2 schools in Ontario.
Symbols
.. Figure not available
… Figure not appropriate or not applicable
* Value suppressed in accordance with CNA privacy policy; cell value is between 1 and 4
** Value suppressed to ensure confidentiality; cell value is 5 or greater r Revised figures
38
Nursing Education Statistics 2008-2009
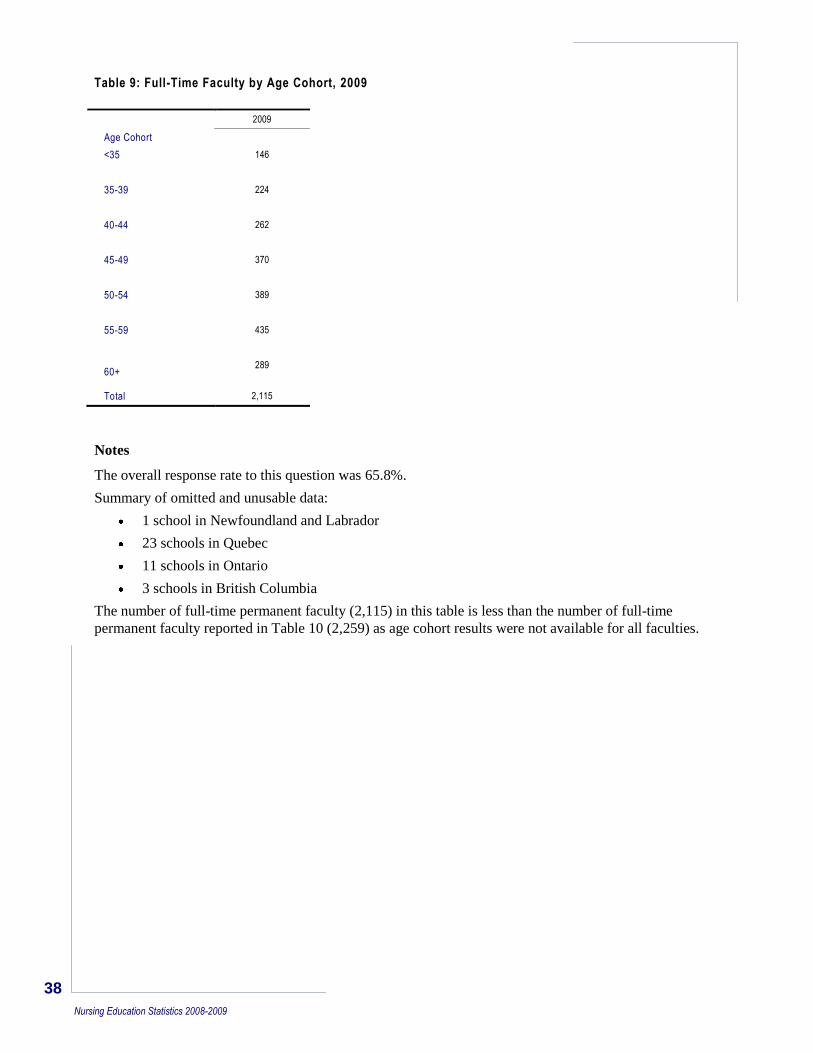
Table 9: Full-Time Faculty by Age Cohort, 2009
2009
Age Cohort
<35 146
35-39 224
40-44 262
45-49 370
50-54 389
55-59 435
60+ 289
Total 2,115
Notes
The overall response rate to this question was 65.8%.
Summary of omitted and unusable data:
1 school in Newfoundland and Labrador
23 schools in Quebec
11 schools in Ontario
3 schools in British Columbia
The number of full-time permanent faculty (2,115) in this table is less than the number of full-time
permanent faculty reported in Table 10 (2,259) as age cohort results were not available for all faculties.
39
Nursing Education Statistics 2008-2009
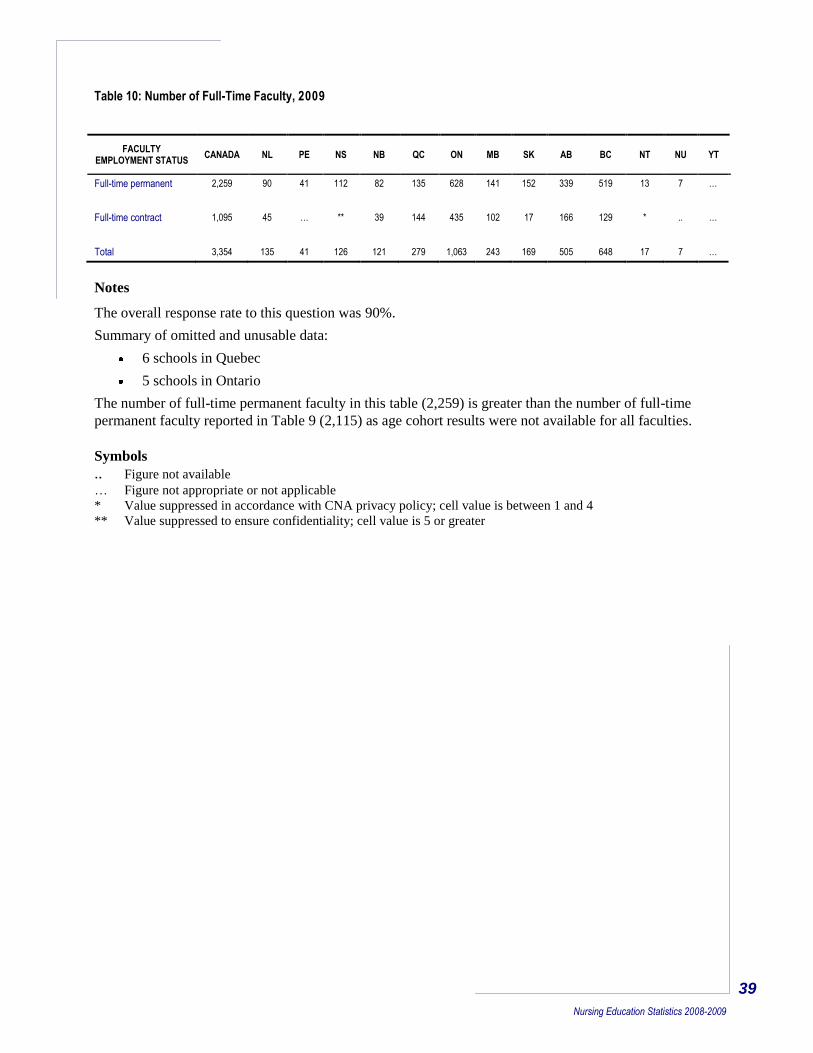
Table 10: Number of Full-Time Faculty, 2009
FACULTY EMPLOYMENT STATUS
CANADA NL PE NS NB QC ON MB SK AB BC NT NU YT
Full-time permanent 2,259 90 41 112 82 135 628 141 152 339 519 13 7 …
Full-time contract 1,095 45 … ** 39 144 435 102 17 166 129 * .. …
Total 3,354 135 41 126 121 279 1,063 243 169 505 648 17 7 …
Notes
The overall response rate to this question was 90%.
Summary of omitted and unusable data:
6 schools in Quebec
5 schools in Ontario
The number of full-time permanent faculty in this table (2,259) is greater than the number of full-time
permanent faculty reported in Table 9 (2,115) as age cohort results were not available for all faculties.
Symbols
.. Figure not available … Figure not appropriate or not applicable
* Value suppressed in accordance with CNA privacy policy; cell value is between 1 and 4
** Value suppressed to ensure confidentiality; cell value is 5 or greater
40
Nursing Education Statistics 2008-2009
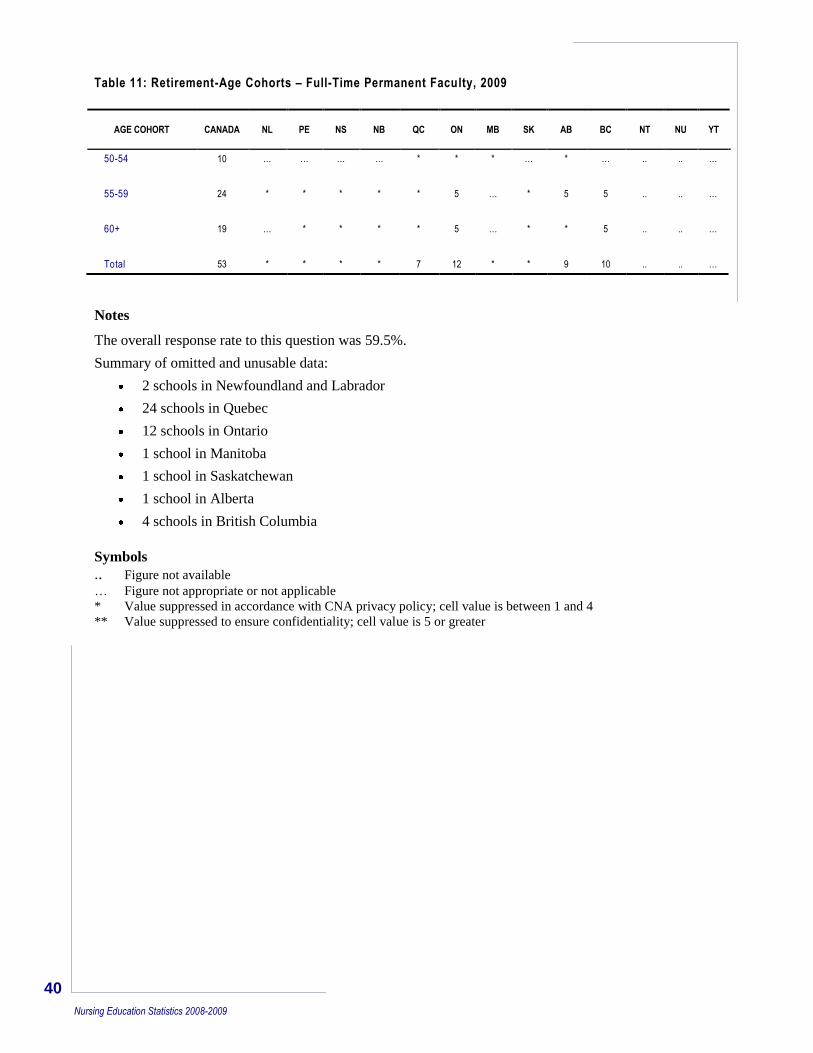
Table 11: Retirement-Age Cohorts – Full-Time Permanent Faculty, 2009
AGE COHORT CANADA NL PE NS NB QC ON MB SK AB BC NT NU YT
50-54 10 … … … … * * * … * … .. .. …
55-59 24 * * * * * 5 … * 5 5 .. .. …
60+ 19 … * * * * 5 … * * 5 .. .. …
Total 53 * * * * 7 12 * * 9 10 .. .. …
Notes
The overall response rate to this question was 59.5%.
Summary of omitted and unusable data:
2 schools in Newfoundland and Labrador
24 schools in Quebec
12 schools in Ontario
1 school in Manitoba
1 school in Saskatchewan
1 school in Alberta
4 schools in British Columbia
Symbols
.. Figure not available … Figure not appropriate or not applicable
* Value suppressed in accordance with CNA privacy policy; cell value is between 1 and 4
** Value suppressed to ensure confidentiality; cell value is 5 or greater
41
Nursing Education Statistics 2007-2008
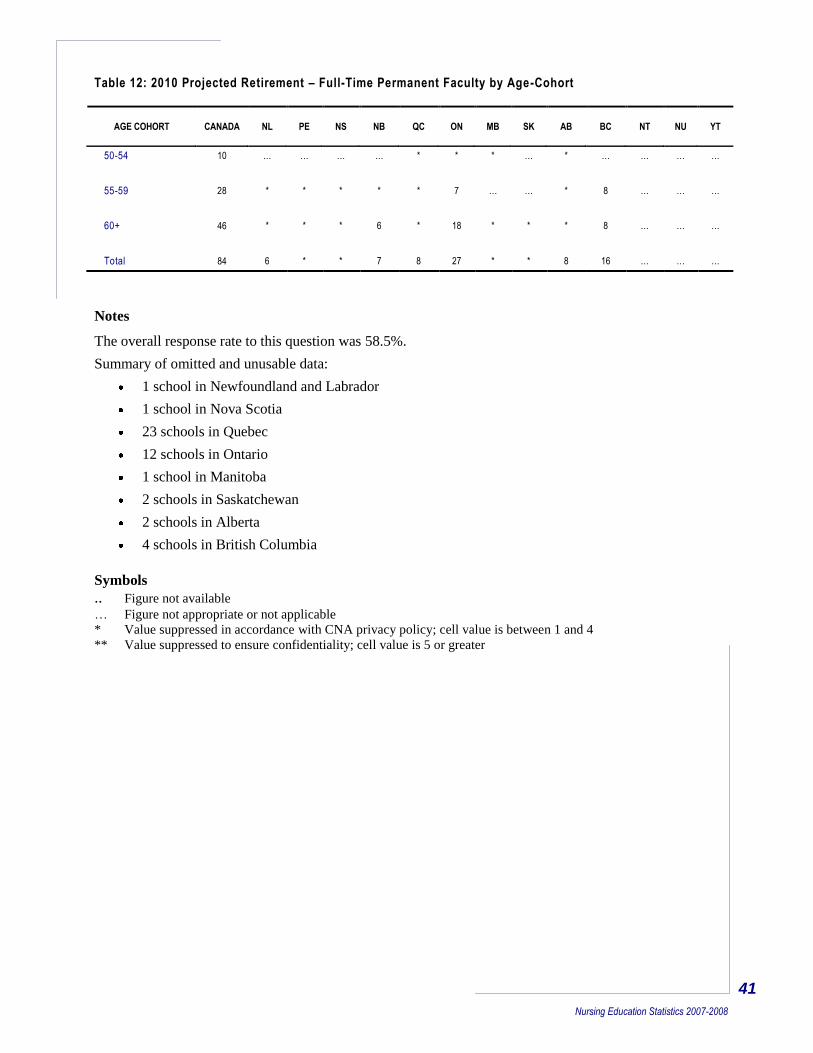
Table 12: 2010 Projected Retirement – Full-Time Permanent Faculty by Age-Cohort
AGE COHORT CANADA NL PE NS NB QC ON MB SK AB BC NT NU YT
50-54 10 … … … … * * * … * … … … …
55-59 28 * * * * * 7 … … * 8 … … …
60+ 46 * * * 6 * 18 * * * 8 … … …
Total 84 6 * * 7 8 27 * * 8 16 … … …
Notes
The overall response rate to this question was 58.5%.
Summary of omitted and unusable data:
1 school in Newfoundland and Labrador
1 school in Nova Scotia
23 schools in Quebec
12 schools in Ontario
1 school in Manitoba
2 schools in Saskatchewan
2 schools in Alberta
4 schools in British Columbia
Symbols
.. Figure not available … Figure not appropriate or not applicable
* Value suppressed in accordance with CNA privacy policy; cell value is between 1 and 4
** Value suppressed to ensure confidentiality; cell value is 5 or greater
42
Nursing Education Statistics 2008-2009
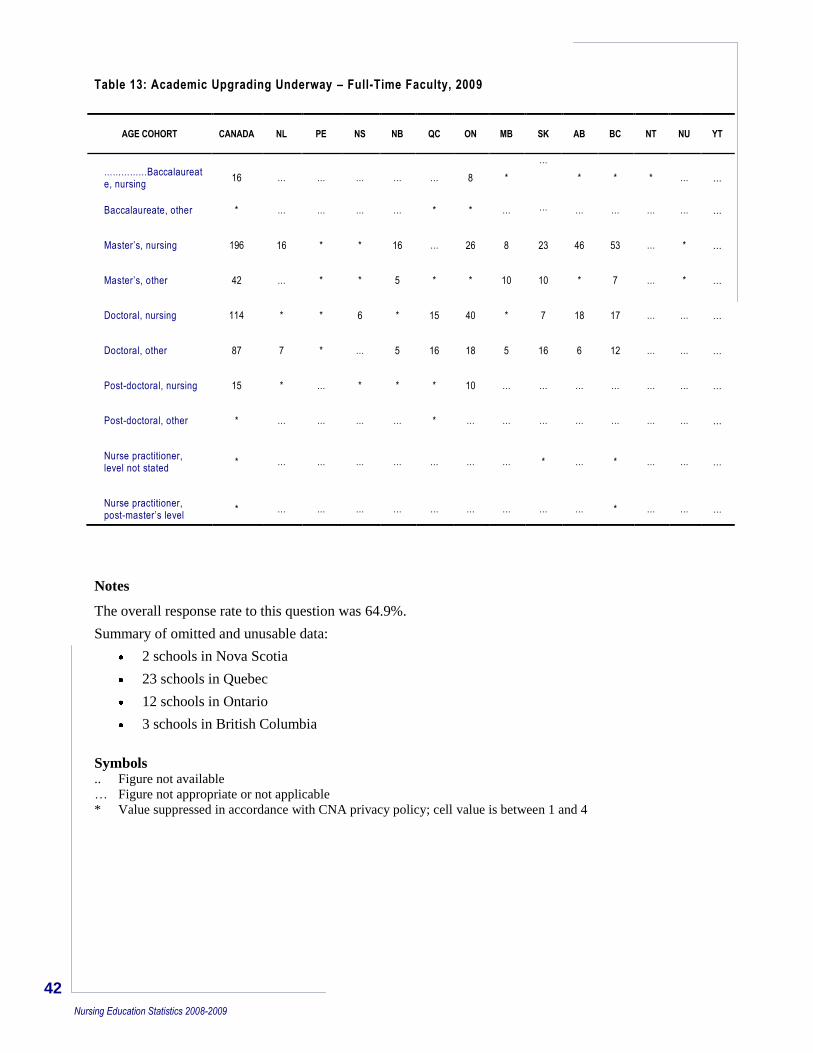
Table 13: Academic Upgrading Underway – Full-Time Faculty, 2009
AGE COHORT CANADA NL PE NS NB QC ON MB SK AB BC NT NU YT
……………Baccalaureate, nursing
16 … … … … … 8 *
…
*
* * … …
Baccalaureate, other * … … … … * * … … … … … … …
Master’s, nursing 196 16 * * 16 … 26 8 23 46 53 … * …
Master’s, other 42 … * * 5 * * 10 10 * 7 … * …
Doctoral, nursing 114 * * 6 * 15 40 * 7 18 17 … … …
Doctoral, other 87 7 * … 5 16 18 5 16 6 12 … … …
Post-doctoral, nursing 15 * … * * * 10 … … … … … … …
Post-doctoral, other * … … … … * … … … … … … … …
Nurse practitioner, level not stated
* … … … … … … … * … * … … …
Nurse practitioner, post-master’s level
* … … … … … … … … … * … … …
Notes
The overall response rate to this question was 64.9%.
Summary of omitted and unusable data:
2 schools in Nova Scotia
23 schools in Quebec
12 schools in Ontario
3 schools in British Columbia
Symbols .. Figure not available
… Figure not appropriate or not applicable
* Value suppressed in accordance with CNA privacy policy; cell value is between 1 and 4
43
Nursing Education Statistics 2008-2009
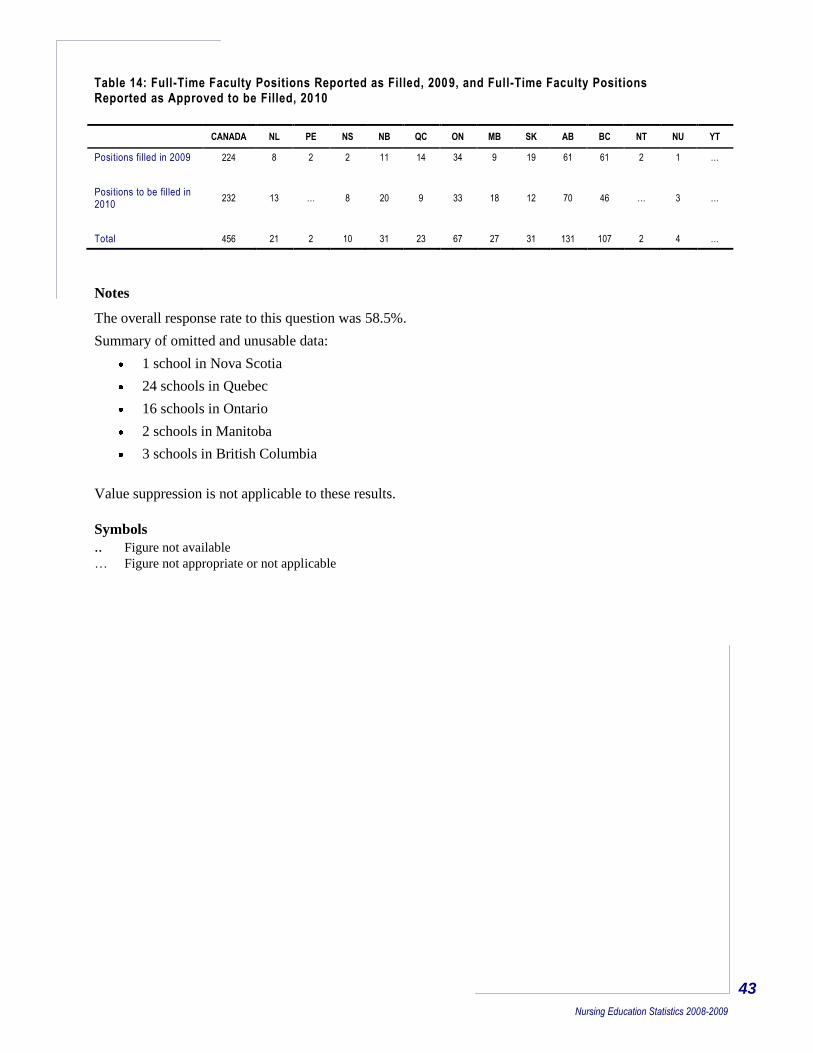
Table 14: Full-Time Faculty Positions Reported as Filled, 2009, and Full-Time Faculty Positions Reported as Approved to be Filled, 2010
CANADA NL PE NS NB QC ON MB SK AB BC NT NU YT
Positions filled in 2009 224 8 2 2 11 14 34 9 19 61 61 2 1 …
Positions to be filled in 2010
232 13 … 8 20 9 33 18 12 70 46 … 3 …
Total 456 21 2 10 31 23 67 27 31 131 107 2 4 …
Notes
The overall response rate to this question was 58.5%.
Summary of omitted and unusable data:
1 school in Nova Scotia
24 schools in Quebec
16 schools in Ontario
2 schools in Manitoba
3 schools in British Columbia
Value suppression is not applicable to these results.
Symbols
.. Figure not available … Figure not appropriate or not applicable
44
Nursing Education Statistics 2008-2009
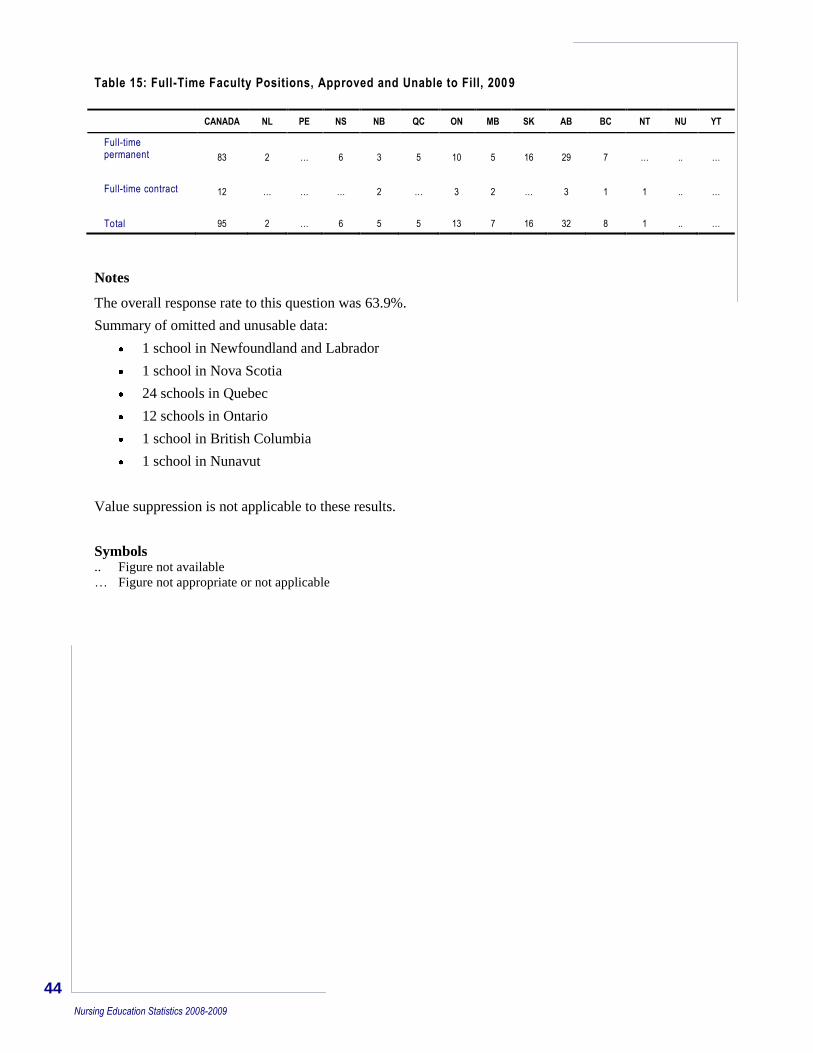
Table 15: Full-Time Faculty Positions, Approved and Unable to Fill, 200 9
CANADA NL PE NS NB QC ON MB SK AB BC NT NU YT
Full-time permanent 83 2 … 6 3 5 10 5 16 29 7 … .. …
Full-time contract 12 … … … 2 … 3 2 … 3 1 1 .. …
Total 95 2 … 6 5 5 13 7 16 32 8 1 .. …
Notes
The overall response rate to this question was 63.9%.
Summary of omitted and unusable data:
1 school in Newfoundland and Labrador
1 school in Nova Scotia
24 schools in Quebec
12 schools in Ontario
1 school in British Columbia
1 school in Nunavut
Value suppression is not applicable to these results.
Symbols .. Figure not available
… Figure not appropriate or not applicable
45
Nursing Education Statistics 2008-2009
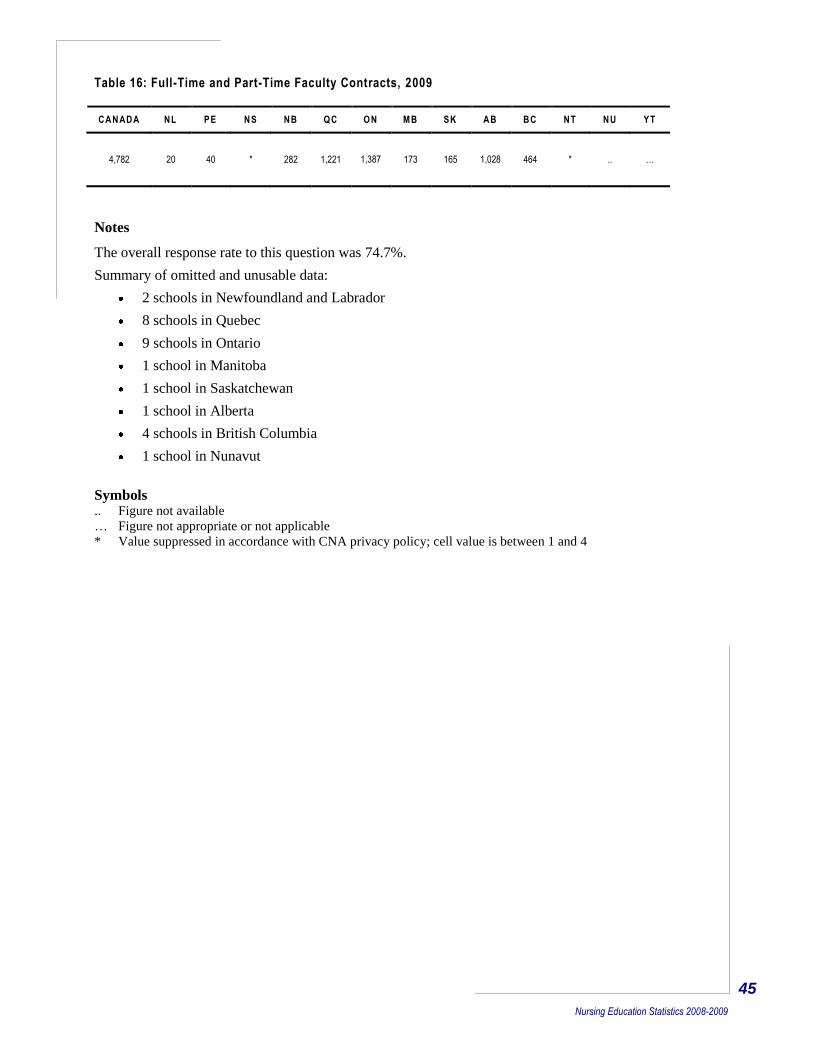
Table 16: Full-Time and Part-Time Faculty Contracts, 2009
CANADA NL PE NS NB QC ON MB SK AB BC NT NU YT
4,782 20 40 * 282 1,221 1,387
173 165 1,028
464 * .. …
Notes
The overall response rate to this question was 74.7%.
Summary of omitted and unusable data:
2 schools in Newfoundland and Labrador
8 schools in Quebec
9 schools in Ontario
1 school in Manitoba
1 school in Saskatchewan
1 school in Alberta
4 schools in British Columbia
1 school in Nunavut
Symbols .. Figure not available
… Figure not appropriate or not applicable
* Value suppressed in accordance with CNA privacy policy; cell value is between 1 and 4
46
Nursing Education Statistics 2008-2009
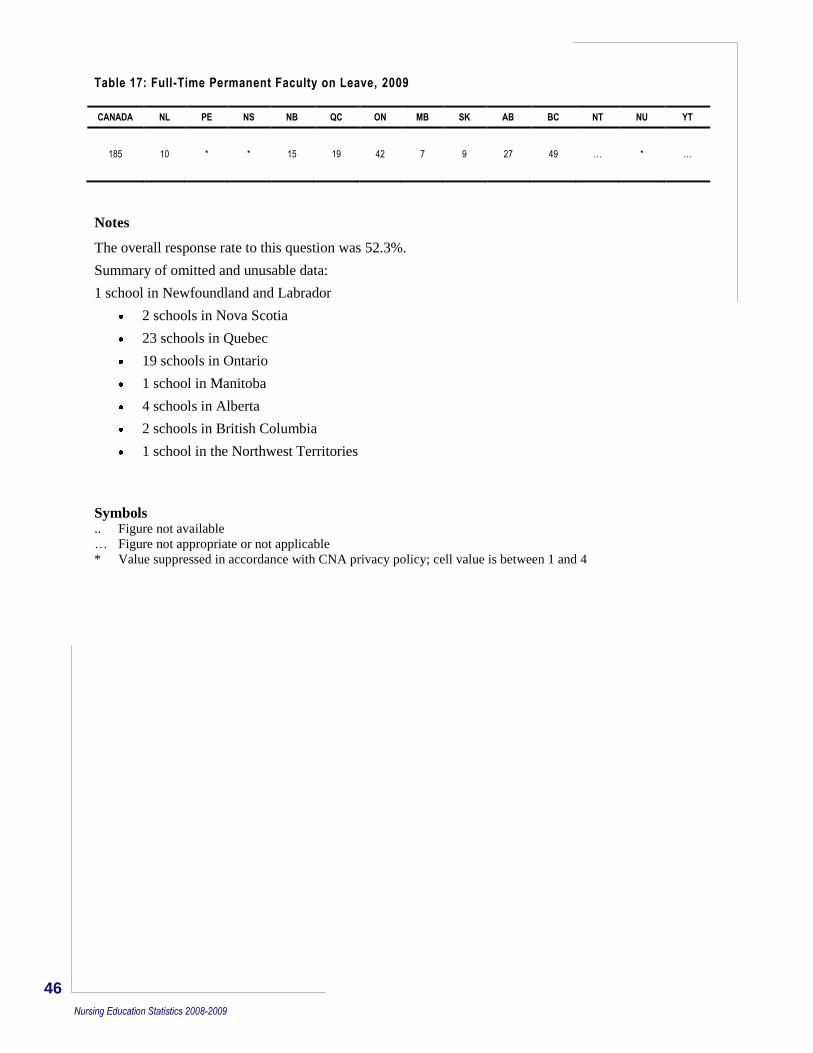
Table 17: Full-Time Permanent Faculty on Leave, 2009
CANADA NL PE NS NB QC ON MB SK AB BC NT NU YT
185 10 * * 15 19 42 7 9 27 49 … * …
Notes
The overall response rate to this question was 52.3%.
Summary of omitted and unusable data:
1 school in Newfoundland and Labrador
2 schools in Nova Scotia
23 schools in Quebec
19 schools in Ontario
1 school in Manitoba
4 schools in Alberta
2 schools in British Columbia
1 school in the Northwest Territories
Symbols .. Figure not available
… Figure not appropriate or not applicable
* Value suppressed in accordance with CNA privacy policy; cell value is between 1 and 4
47
Nursing Education Statistics 2008-2009
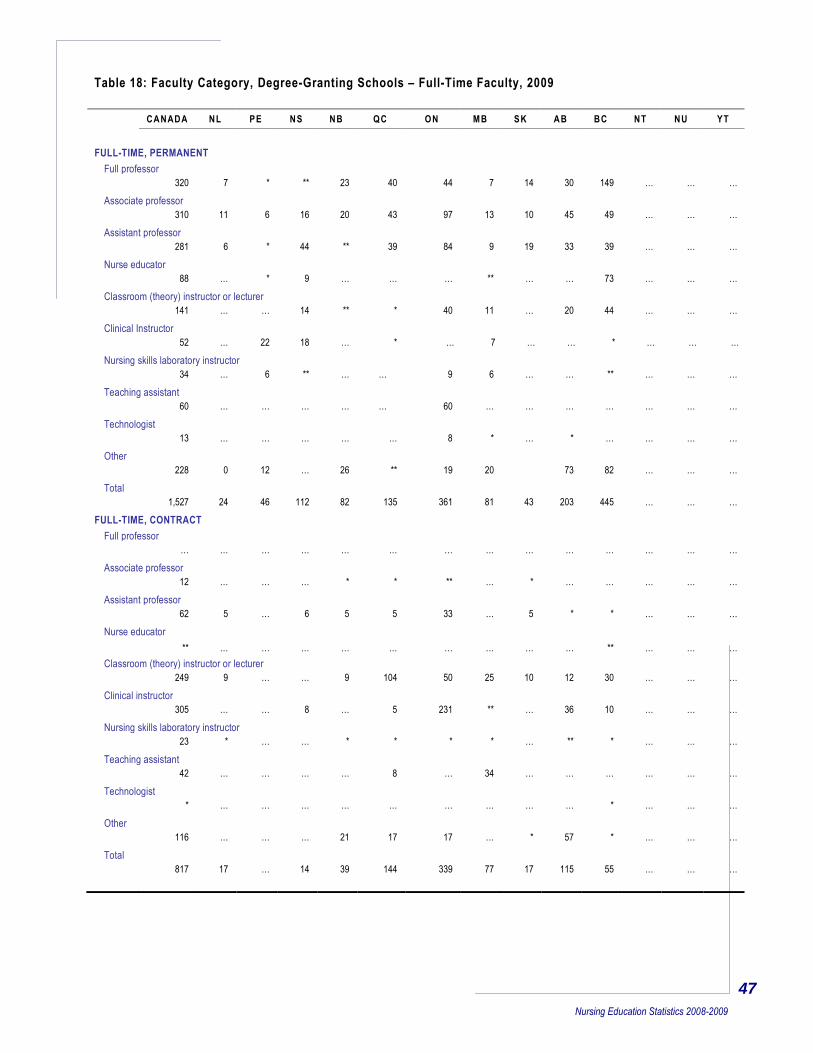
Table 18: Faculty Category, Degree-Granting Schools – Full-Time Faculty, 2009
CANADA NL PE NS NB QC ON MB SK AB BC NT NU YT
FULL-TIME, PERMANENT
Full professor
320 7 * ** 23 40 44 7 14 30 149 … … …
Associate professor
310 11 6 16 20 43 97 13 10 45 49 … … …
Assistant professor
281 6 * 44 ** 39 84 9 19 33 39 … … …
Nurse educator
88 … * 9 … … … ** … … 73 … … …
Classroom (theory) instructor or lecturer
141 … … 14 ** * 40 11 … 20 44 … … …
Clinical Instructor
52 … 22 18 … * … 7 … … * … … …
Nursing skills laboratory instructor
34 … 6 ** … … 9 6 … … ** … … …
Teaching assistant
60 … … … … … 60 … … … … … … …
Technologist
13 … … … … … 8 * … * … … … …
Other
228 0 12 … 26 ** 19 20 73 82 … … …
Total
1,527 24 46 112 82 135 361 81 43 203 445 … … …
FULL-TIME, CONTRACT
Full professor
… … … … … … … … … … … … … …
Associate professor
12 … … … * * ** … * … … … … …
Assistant professor
62 5 … 6 5 5 33 … 5 * * … … …
Nurse educator
** … … … … … … … … … ** … … …
Classroom (theory) instructor or lecturer
249 9 … … 9 104 50 25 10 12 30 … … …
Clinical instructor
305 … … 8 … 5 231 ** … 36 10 … … …
Nursing skills laboratory instructor
23 * … … * * * * … ** * … … …
Teaching assistant
42 … … … … 8 … 34 … … … … … …
Technologist
* … … … … … … … … … * … … …
Other
116 … … … 21 17 17 … * 57 * … … …
Total
817 17 … 14 39 144 339 77 17 115 55 … … …
48
Nursing Education Statistics 2008-2009
Notes
The overall response rate to this question was 90.9%.
The British Columbia total includes results from two degree-granting colleges (40 full-time permanent
professors, 11 classroom theory instructors, 4 nursing skills laboratory instructors and 49 full-time
permanent nurse educators).
Summary of omitted and unusable data:
6 schools in Quebec
5 schools in Ontario
Symbols .. Figure not available
… Figure not appropriate or not applicable
* Value suppressed in accordance with CNA privacy policy; cell value is between 1 and 4
** Value suppressed to ensure confidentiality; cell value is 5 or greater
49
Nursing Education Statistics 2008-2009
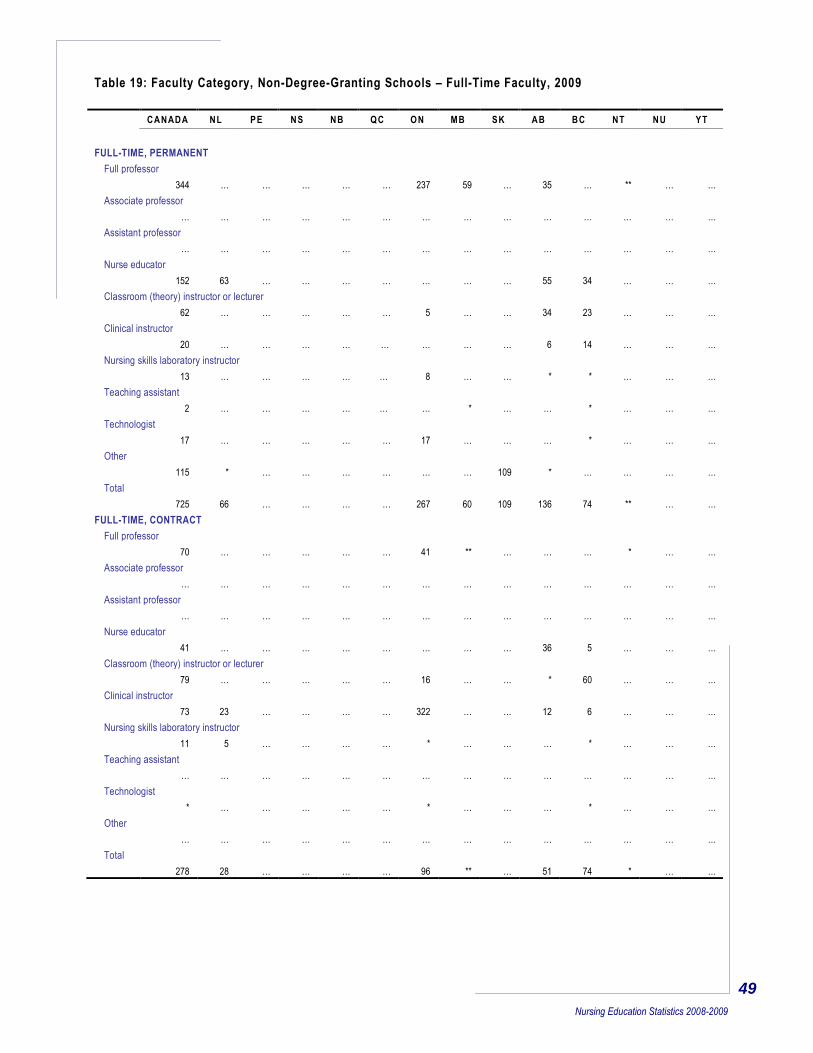
Table 19: Faculty Category, Non-Degree-Granting Schools – Full-Time Faculty, 2009
CANADA NL PE NS NB QC ON MB SK AB BC NT NU YT
FULL-TIME, PERMANENT
Full professor
344 … … … … … 237 59 … 35 … ** … …
Associate professor
… … … … … … … … … … … … … …
Assistant professor
… … … … … … … … … … … … … …
Nurse educator
152 63 … … … … … … … 55 34 … … …
Classroom (theory) instructor or lecturer
62 … … … … … 5 … … 34 23 … … …
Clinical instructor
20 … … … … … … … … 6 14 … … …
Nursing skills laboratory instructor
13 … … … … … 8 … … * * … … …
Teaching assistant
2 … … … … … … * … … * … … …
Technologist
17 … … … … … 17 … … … * … … …
Other
115 * … … … … … … 109 * … … … …
Total
725 66 … … … … 267 60 109 136 74 ** … …
FULL-TIME, CONTRACT
Full professor
70 … … … … … 41 ** … … … * … …
Associate professor
… … … … … … … … … … … … … …
Assistant professor
… … … … … … … … … … … … … …
Nurse educator
41 … … … … … … … … 36 5 … … …
Classroom (theory) instructor or lecturer
79 … … … … … 16 … … * 60 … … …
Clinical instructor
73 23 … … … … 322 … … 12 6 … … …
Nursing skills laboratory instructor
11 5 … … … … * … … … * … … …
Teaching assistant
… … … … … … … … … … … … … …
Technologist
* … … … … … * … … … * … … …
Other
… … … … … … … … … … … … … …
Total
278 28 … … … … 96 ** … 51 74 * … …
50
Nursing Education Statistics 2008-2009
Notes
The overall response rate to this question was 73.9%.
Summary of omitted and unusable data:
1 school in Nova Scotia
25 schools in Quebec
8 schools in Ontario
1 school in Nunavut
Symbols .. Figure not available
… Figure not appropriate or not applicable
* Value suppressed in accordance with CNA privacy policy; cell value is between 1 and 4
** Value suppressed to ensure confidentiality; cell value is 5 or greater
51
Nursing Education Statistics 2008-2009
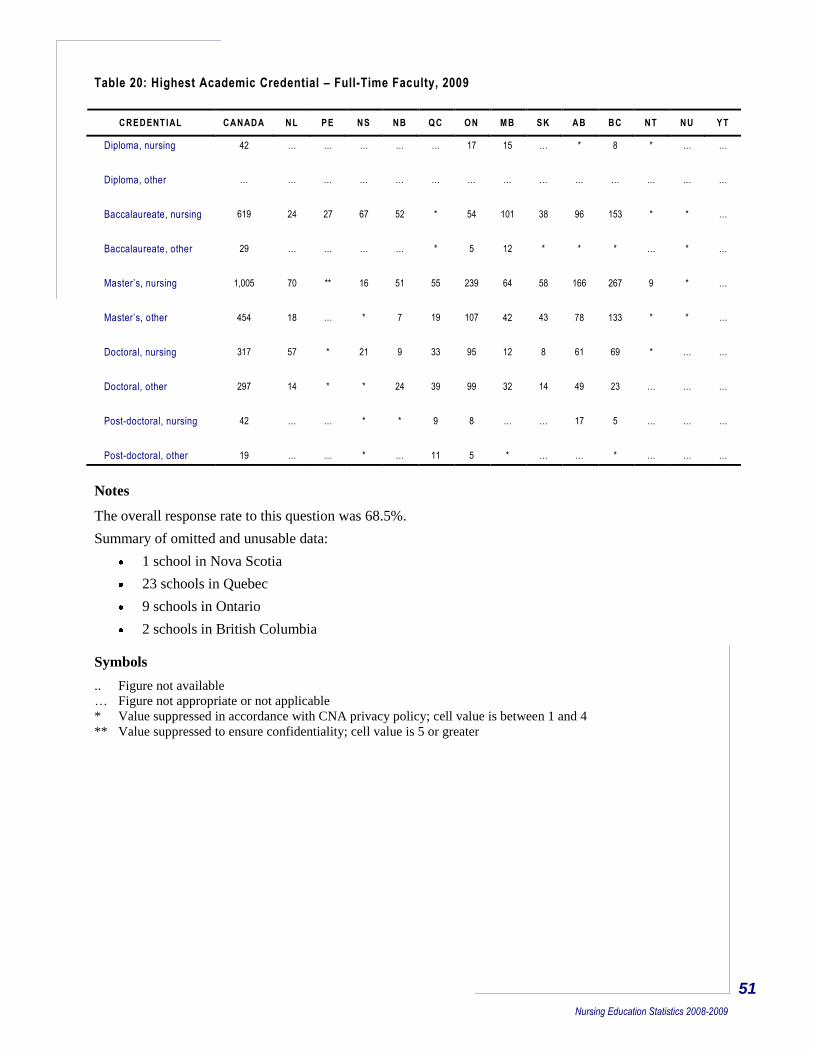
Table 20: Highest Academic Credential – Full-Time Faculty, 2009
CREDENT IAL CANADA NL PE NS NB QC ON MB SK AB BC NT NU YT
Diploma, nursing 42 … … … … … 17 15 … * 8 * … …
Diploma, other
… … … … … … … … … … … … … …
Baccalaureate, nursing 619
24 27 67 52 * 54 101 38 96 153 * * …
Baccalaureate, other
29 … … … … * 5 12 * * * … * …
Master’s, nursing 1,005 70 ** 16 51 55 239 64 58 166 267 9 * …
Master’s, other 454 18 … * 7 19 107 42 43 78 133 * * …
Doctoral, nursing 317 57 * 21 9 33 95 12 8 61 69 * … …
Doctoral, other 297 14 * * 24 39 99 32 14 49 23 … … …
Post-doctoral, nursing 42 … … * * 9 8 … … 17 5 … … …
Post-doctoral, other 19 … … * … 11 5 * … … * … … …
Notes
The overall response rate to this question was 68.5%.
Summary of omitted and unusable data:
1 school in Nova Scotia
23 schools in Quebec
9 schools in Ontario
2 schools in British Columbia
Symbols
.. Figure not available
… Figure not appropriate or not applicable
* Value suppressed in accordance with CNA privacy policy; cell value is between 1 and 4
** Value suppressed to ensure confidentiality; cell value is 5 or greater
52
Nursing Education Statistics 2006-2007
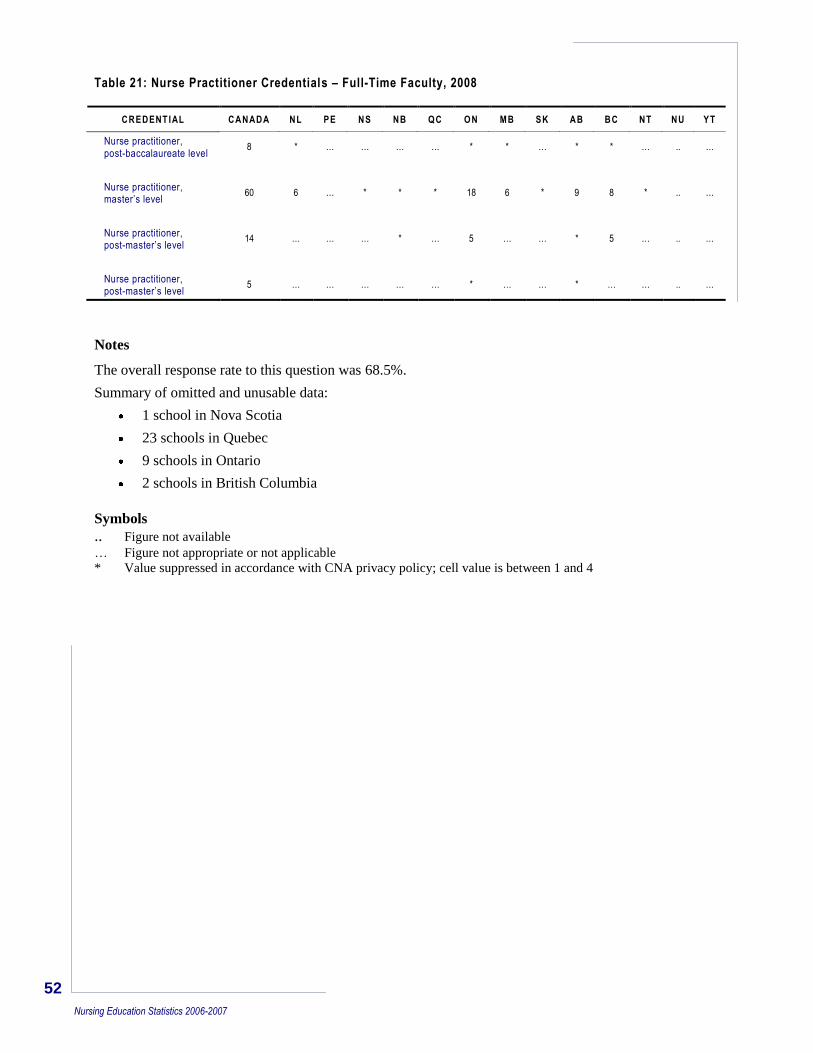
Table 21: Nurse Practitioner Credentials – Full-Time Faculty, 2008
CREDENT IAL CANADA NL PE NS NB QC ON MB SK AB BC NT NU YT
Nurse practitioner, post-baccalaureate level
8 * … … … … * * … * * … .. …
Nurse practitioner, master’s level
60 6 … * * * 18 6 * 9 8 * .. …
Nurse practitioner, post-master’s level
14 … … … * … 5 … … * 5 … .. …
Nurse practitioner, post-master’s level
5 … … … … … * … … * … … .. …
Notes
The overall response rate to this question was 68.5%.
Summary of omitted and unusable data:
1 school in Nova Scotia
23 schools in Quebec
9 schools in Ontario
2 schools in British Columbia
Symbols
.. Figure not available … Figure not appropriate or not applicable
* Value suppressed in accordance with CNA privacy policy; cell value is between 1 and 4
53
Nursing Education Statistics 2008-2009
Methodological Notes – Survey Tables
Classification of nursing programs
Programs are identified by a standard data code, which allows the RN education data to be attributed to
one of six program categories.
Diploma Diploma, Diploma Exit option, PN to RN, LPN to RN, DEC
Baccalaureate: Standard, Generic, Collaborative, Accelerated, Fast Track, Advanced,
Second Degree Entry, Compressed, LPN to RN and RPN to RN
Baccalaureate
Post-RN Baccalaureate: Post-RN Baccalaureate, DEC-BACC
Master‟s: Master‟s in Nursing, DESS
Doctoral: Doctorate in Nursing
Nurse Practitioner:* Nurse Practitioner, NP integrated with a degree program, e.g., MN/NP
*NP programs may be combined with or integrated into master‟s degree programs, and schools may or
may not report separate data for these integrated programs. Where the data are reported separately it is
recorded under both the NP program and the master‟s program.
Collection Period
Program inventory, admission and enrolment data are collected on the academic year. This year‟s
collection is for the 2008-2009 academic year.
Graduate and faculty data are collected on the calendar year. This year‟s collection captures these data
for calendar year 2009.
Data Collection Terms
Admission: Admission results are calculated by totalling the number of first-time nursing students
admitted to Year 1 of the program plus the number of advanced entrant students
admitted in any year of the program.
Admission results include data for each intake offered throughout the course of an
academic year.
Schools are asked to report admission results after the allowed withdrawal date of
their institution.
Enrolment: Enrolment results are a count of the number of students enrolled in each year of study.
Enrolment results include data for each intake offered throughout the course of an
academic year.
Schools are asked to report enrolment results after the allowed withdrawal date of
their institution.
54
Nursing Education Statistics 2008-2009
Entry-to-Practice
Programs: Entry-to-practice (RN-ETP) programs entitle the successful graduate to apply for
licensure/registration. RN-ETP programs include diploma, generic baccalaureate and
entry-to-practice master‟s.
Graduates: Graduate results are calculated by totalling the number of degrees awarded by each
institution throughout a calendar year.
See Appendix A for a list of the definitions provided to all schools.
Data Limitations
Data included in the survey tables are as reported by the schools that responded to the survey. See
“Survey Response” below for details on annual response rates.
Schools sometimes provide data that are unusable or fail to report requested data. Each table is
accompanied by a summary of omitted data.
Out-of-Province/Territory Partnerships
Colleges and universities may establish program delivery partnerships that cross provincial or
territorial boundaries. In 2007, the treatment of graduate data from program delivery partnerships that
cross provincial or territorial boundaries was amended so that graduate results would be recorded in the
home province or territory. Admission and enrolment data continue to be recorded according to the
program delivery responsibility of each partner. The handling of admission and enrolment data did not
change. Historical graduate data have been adjusted accordingly. Please see “Survey Methodology” for
additional details.
Out-of-province/territory baccalaureate collaborative partnerships as of 2008-2009 include: Aurora
College, N.W.T., partnered with the University of Victoria, B.C.; Collège Universitaire de Saint-
Boniface, M.B., partnered with University of Ottawa / Université d‟Ottawa. Ont.; Nunavut Arctic
College, Nunavut, partnered with Dalhousie University, N.S.; and Humber College, Ont., partnered
with the University of New Brunswick, N.B.
Survey Response
2004-2005: The 2004-2005 survey was sent to all 134 schools offering nursing programs; 120 schools
completed the survey; 13 Quebec CEGEPs/colleges (13 ETP diploma programs) and 1 Ontario college
(1 ETP baccalaureate program) did not complete the survey. The overall response rate was 90%.
Quebec‟s response rate was 75%. Ontario‟s response rate was 97%. In the remaining provinces and
territories, 100% participation was achieved.
2005-2006: The 2005-2006 survey was sent to all 134 schools offering nursing programs; 119 schools
completed the survey; 15 Quebec CEGEPs/colleges (15 ETP diploma programs) did not. The overall
response rate was 89%. Quebec‟s response rate was 70%. In all other provinces and territories, 100%
participation was achieved.
2006-2007: The 2006-2007 survey was sent to all 135 schools offering nursing programs; 118 schools
completed the survey; 1 Quebec university (1 ETP baccalaureate program, 1 post-RN baccalaureate
program, 1 master‟s program) and 17 Quebec CEGEPs/colleges (17 ETP diploma programs) did not
report. The overall response rate was 87%.
2007-2008: The 2007-2008 survey was sent to all 135 schools offering nursing programs. One school
suspended its baccalaureate program in 2007-2008, reducing eligible respondents to 134 schools; 118
schools completed the survey; 1 Quebec university (1 ETP baccalaureate program, 1 post-RN
baccalaureate program, 1 master‟s program), 1 Ontario college (1 ETP baccalaureate program) and 14
55
Nursing Education Statistics 2008-2009
CEGEPs/colleges (14 ETP diploma programs) did not complete the survey. The overall response rate
was 88%. CASN member response rate was 98%; 88 of 90 eligible member schools completed the
survey.
2008-2009: The survey was issued to all 135 schools offering nursing programs; 111 schools
completed the survey; 3 Ontario colleges (3 ETP baccalaureate programs) and 2 Quebec universities (2
ETP baccalaureate programs, 2 post-RN baccalaureate programs, 2 master‟s programs, 1 doctoral
program and 1 nurse practitioner program) and 19 Quebec CEGEPs/colleges (19 ETP diploma
programs) did not complete the survey. The overall survey response rate was 82%; the CASN member
response rate was 95%. See the tables starting on page 22 for more detailed information about omitted
or unusable data. On average, 66.1% of schools responded to the faculty questions.
Privacy and Confidentiality
In accordance with CNA‟s privacy policy, small cell entries between 1 and 4 are not reported. Some
cell values of 5 or greater have also been suppressed to protect confidentiality.3
3 Canadian Nurses Association. (2004). Protection of personal information. Ottawa: Author.
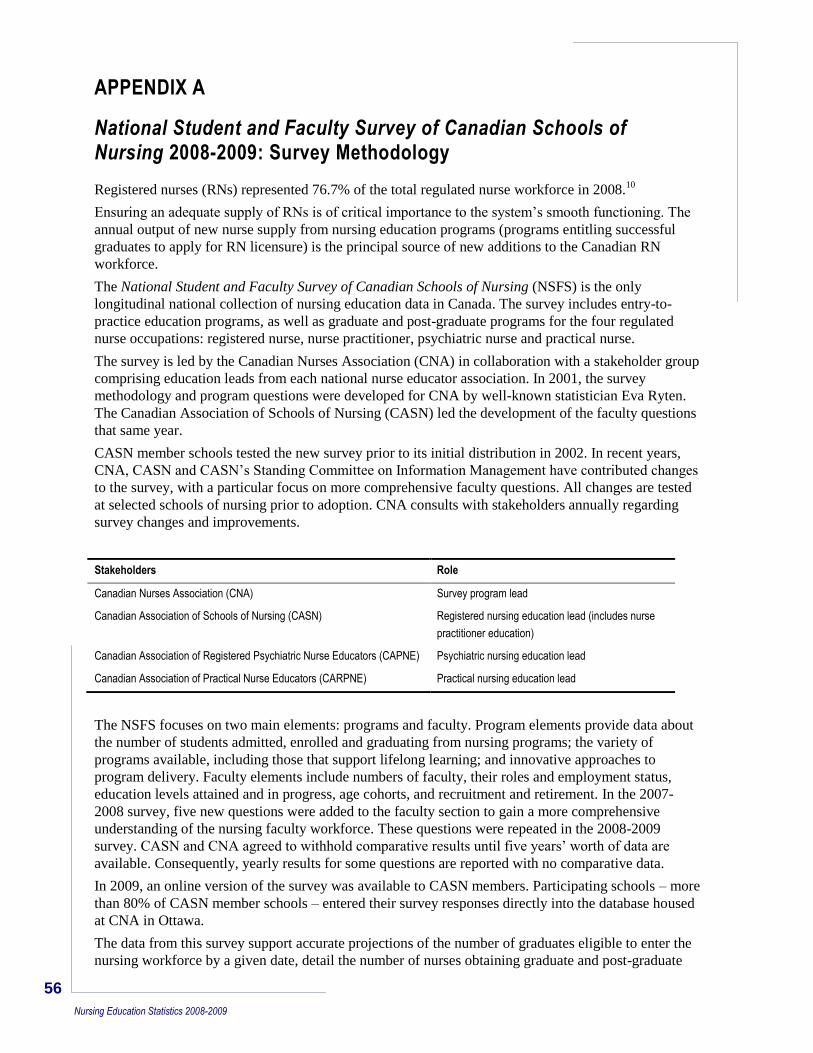
56
Nursing Education Statistics 2008-2009
APPENDIX A
National Student and Faculty Survey of Canadian Schools of Nursing 2008-2009: Survey Methodology
Registered nurses (RNs) represented 76.7% of the total regulated nurse workforce in 2008.10
Ensuring an adequate supply of RNs is of critical importance to the system‟s smooth functioning. The
annual output of new nurse supply from nursing education programs (programs entitling successful
graduates to apply for RN licensure) is the principal source of new additions to the Canadian RN
workforce.
The National Student and Faculty Survey of Canadian Schools of Nursing (NSFS) is the only
longitudinal national collection of nursing education data in Canada. The survey includes entry-to-
practice education programs, as well as graduate and post-graduate programs for the four regulated
nurse occupations: registered nurse, nurse practitioner, psychiatric nurse and practical nurse.
The survey is led by the Canadian Nurses Association (CNA) in collaboration with a stakeholder group
comprising education leads from each national nurse educator association. In 2001, the survey
methodology and program questions were developed for CNA by well-known statistician Eva Ryten.
The Canadian Association of Schools of Nursing (CASN) led the development of the faculty questions
that same year.
CASN member schools tested the new survey prior to its initial distribution in 2002. In recent years,
CNA, CASN and CASN‟s Standing Committee on Information Management have contributed changes
to the survey, with a particular focus on more comprehensive faculty questions. All changes are tested
at selected schools of nursing prior to adoption. CNA consults with stakeholders annually regarding
survey changes and improvements.
Stakeholders Role
Canadian Nurses Association (CNA) Survey program lead
Canadian Association of Schools of Nursing (CASN) Registered nursing education lead (includes nurse
practitioner education)
Canadian Association of Registered Psychiatric Nurse Educators (CAPNE) Psychiatric nursing education lead
Canadian Association of Practical Nurse Educators (CARPNE) Practical nursing education lead
The NSFS focuses on two main elements: programs and faculty. Program elements provide data about
the number of students admitted, enrolled and graduating from nursing programs; the variety of
programs available, including those that support lifelong learning; and innovative approaches to
program delivery. Faculty elements include numbers of faculty, their roles and employment status,
education levels attained and in progress, age cohorts, and recruitment and retirement. In the 2007-
2008 survey, five new questions were added to the faculty section to gain a more comprehensive
understanding of the nursing faculty workforce. These questions were repeated in the 2008-2009
survey. CASN and CNA agreed to withhold comparative results until five years‟ worth of data are
available. Consequently, yearly results for some questions are reported with no comparative data.
In 2009, an online version of the survey was available to CASN members. Participating schools – more
than 80% of CASN member schools – entered their survey responses directly into the database housed
at CNA in Ottawa.
The data from this survey support accurate projections of the number of graduates eligible to enter the
nursing workforce by a given date, detail the number of nurses obtaining graduate and post-graduate
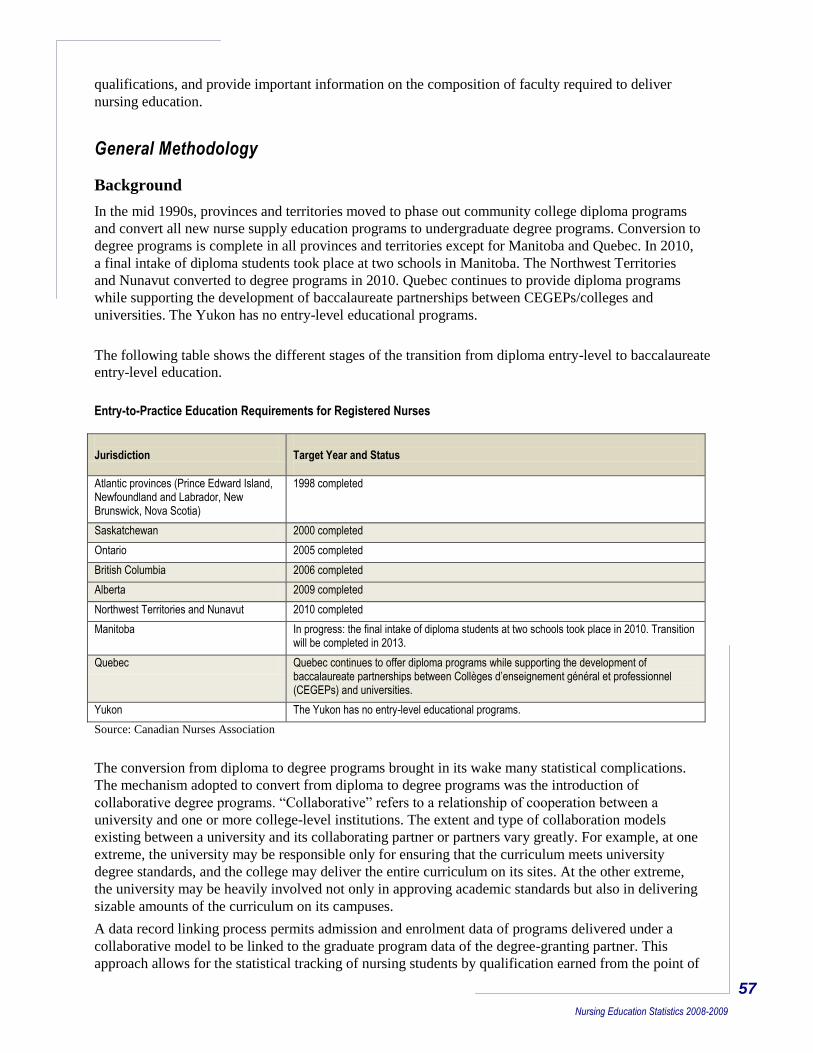
57
Nursing Education Statistics 2008-2009
qualifications, and provide important information on the composition of faculty required to deliver
nursing education.
General Methodology
Background
In the mid 1990s, provinces and territories moved to phase out community college diploma programs
and convert all new nurse supply education programs to undergraduate degree programs. Conversion to
degree programs is complete in all provinces and territories except for Manitoba and Quebec. In 2010,
a final intake of diploma students took place at two schools in Manitoba. The Northwest Territories
and Nunavut converted to degree programs in 2010. Quebec continues to provide diploma programs
while supporting the development of baccalaureate partnerships between CEGEPs/colleges and
universities. The Yukon has no entry-level educational programs.
The following table shows the different stages of the transition from diploma entry-level to baccalaureate
entry-level education.
Entry-to-Practice Education Requirements for Registered Nurses Jurisdiction
Target Year and Status
Atlantic provinces (Prince Edward Island, Newfoundland and Labrador, New Brunswick, Nova Scotia)
1998 completed
Saskatchewan 2000 completed
Ontario 2005 completed
British Columbia 2006 completed
Alberta 2009 completed
Northwest Territories and Nunavut 2010 completed
Manitoba In progress: the final intake of diploma students at two schools took place in 2010. Transition will be completed in 2013.
Quebec Quebec continues to offer diploma programs while supporting the development of baccalaureate partnerships between Collèges d’enseignement général et professionnel (CEGEPs) and universities.
Yukon The Yukon has no entry-level educational programs.
Source: Canadian Nurses Association
The conversion from diploma to degree programs brought in its wake many statistical complications.
The mechanism adopted to convert from diploma to degree programs was the introduction of
collaborative degree programs. “Collaborative” refers to a relationship of cooperation between a
university and one or more college-level institutions. The extent and type of collaboration models
existing between a university and its collaborating partner or partners vary greatly. For example, at one
extreme, the university may be responsible only for ensuring that the curriculum meets university
degree standards, and the college may deliver the entire curriculum on its sites. At the other extreme,
the university may be heavily involved not only in approving academic standards but also in delivering
sizable amounts of the curriculum on its campuses.
A data record linking process permits admission and enrolment data of programs delivered under a
collaborative model to be linked to the graduate program data of the degree-granting partner. This
approach allows for the statistical tracking of nursing students by qualification earned from the point of
58
Nursing Education Statistics 2008-2009
admission, by each year of enrolment, through to graduation. It also accommodates recent changes
whereby some colleges now award baccalaureate degrees or have changed their institution type from
college to university. Historical results have not been affected by these changes.
Data Collection
The survey requests information on the following:
Program inventory – covers all nursing programs leading to initial licensure (e.g., diploma,
diploma exit, baccalaureate, collaborative baccalaureate) as well as formal programs furthering
an RN‟s education (e.g., post-RN, master‟s, doctorate, nurse practitioner); includes distributed
learning programs, multiple language offerings and multiple partnership arrangements.
Collection period: academic year.
Quotas, admissions and enrolment – for each of the programs listed in the program inventory,
by partner, by site, where available. Collection period: academic year.
Graduates – by qualification earned, graduates by gender for each program listed in the
program inventory, by partner, by site, where available. Collection period: calendar year.
Faculty demographics – details on faculty responsible for the delivery of programs listed in the
program inventory, by gender, contract type, rank and status; these data include components
such as highest academic credential, age cohorts, faculty on leave, average age of retirement,
attrition other than retirement, and additional information on classroom ratios. Collection
period: calendar year.
Admission and enrolment data are collected for the previous academic year to ensure that fall, winter
and summer intake data are gathered. Graduate data are collected for the calendar year to align with
annual licensing examination practices and health human resources planning. Admission and
enrolment data are counted only after the school‟s allowed withdrawal date. Faculty data are collected
for the calendar year.
The data are completed by the appropriate designate at each school, and are reviewed and approved by
the dean, director, program head or equivalent. On receipt, the data are reviewed by CNA and CASN to
ensure that all programs, sites, partners and data elements have been included. Comparisons are made
to program inventories from previous years as well as program data listed on each school website to
ensure that data are representative of all programs offered by the school.
Disparities are resolved by the CNA program lead and the faculty member(s) responsible for the data
compiled. The dean, director, program head or equivalent validates the data‟s accuracy and
completeness, and approves the use of the data to prepare reports and to support research and policy
decisions affecting the future supply of nurses in Canada.
When data are not reported, the omitted data are sorted by data type and captured in one of two
categories: (1) not available, or (2) not appropriate or applicable. Omitted data are identified in the
reports.
In 2009, an online version of the survey was available to CASN members. Participating schools
entered their survey responses directly into the database housed at CNA in Ottawa. In 2010-2011, the
online survey will be available to all schools of nursing along with online school-level reports.
59
Nursing Education Statistics 2008-2009
Data Organization
As mentioned earlier, the data derived from the survey accommodate the increasing variety and
complexity of nursing education models in Canada, including NP education models. The data are
organized to allow for statistical trends to be tracked at provincial/territorial and national levels by
qualification earned.
Another component of data organization accommodates the increasing variety of nurse practitioner
(NP) programs. NP programs may be combined with or integrated into master‟s degree programs,
and schools may report separate data for these integrated programs. In these instances, data are
recorded under the NP program and under the corresponding master‟s program. If the school is
unable to provide the data separately (e.g., some integrated programs are reported such that all
admission, enrolment and/or graduate data are included in the master‟s program), then all the data
are included under the master‟s program.
Links are established between partners offering collaborative baccalaureate programs such that
admission, enrolment and graduate data records mirror the delivery of each partner. A baccalaureate
program is attributed to each partner offering a part of the baccalaureate program. This approach
allows for the statistical tracking of nursing students by qualification earned from the point of
admission, by each year of enrolment, at each partner site through to graduation. It also accommodates
recent changes whereby some colleges now award baccalaureate degrees or have changed their
institution type from college to university. Historical results have not been affected by these changes.
Colleges and universities may establish program delivery partnerships that cross provincial or
territorial boundaries. In 2007, the treatment of graduate data from program delivery partnerships that
cross provincial or territorial boundaries was amended so that graduate results would be recorded in the
student‟s home province or territory. Admission and enrolment data continue to be recorded according
to the program delivery responsibility of each partner. The handling of admission and enrolment data
did not change. Historical graduate data have been adjusted accordingly. Please see “Survey
Methodology” for additional details.
60
Nursing Education Statistics 2008-2009
Tables
The survey data are summarized in 21 tables for distribution to schools of nursing and interested
parties (e.g., CNA jurisdiction members, CASN member schools, researchers, government
departments). Each table contains important notes covering data scope, updates to previous years‟ data,
omissions and acknowledgments.
It is important to review the program names included in each of the program categories listed in the
various tables. Equally important is an understanding of the approach taken to collaborative
baccalaureate programs, data pertaining to NP programs and partnerships outside provincial or
territorial boundaries. See the section “Background,” above, for information on this point as well as
“Data Organization.” A review of the definitions used in the survey, in the next section, is also
recommended.
Data Confidentiality and Privacy
As part of the 2008-2009 survey submission procedures, each school completed a confidentiality and
approval release form authorizing CNA and CASN to release the data for purposes of research, policy-
making, advocacy and so on.
CNA staff adheres to CNA‟s policy on Protection of Personal Information, available on the CNA
website, and CASN staff adheres to CASN‟s privacy policy, available on the CASN website.
Definitions Used in the Survey
Advanced Entrants (counted as of the school’s allowed withdrawal date)
Students previously enrolled in a non-nursing program (e.g., Bachelor of Arts, Physiotherapy, and
Bachelor of Science) who transfer to an RN education program. These students have already completed
some of the program‟s required courses. As a result, they may be approved to join an existing student
cohort in Year 2 or Year 3, and so on. Data reported in this selection are included in the calculation of
admissions.
Advanced entrants include:
students previously enrolled in school X in a non-nursing program who transfer to an RN
education program in school X;
students previously enrolled in school Y in a non-nursing program who transfer to an RN
education program at school X; and
students with a degree from a non-nursing program who enter an RN education program.
Note: Advanced entrants differ from first-time students. See the definition for “first-time students.”
Baccalaureate Program Collaborative Delivery
A baccalaureate program offered in partnership between a university and another institution. Program
partners may also belong to a consortium.
Baccalaureate Program University Delivery
A baccalaureate program offered solely by a university; no partners are involved.
Campus Site
The school site (campus) where a program is offered.

61
Nursing Education Statistics 2008-2009
Continuing Students (counted as of the school’s allowed withdrawal date)
Continuing students include:
full-time students who progress to the next year of study without interruption, remaining with
the same student cohort from one year of study to the next;
part-time students who require more than one academic year to complete all required courses;
and
students who fail a course in a particular year of an RN education program but are permitted to
move to Year 2 (policy may vary from one school to another).
Employment Status
A description of the employment status of faculty members. Includes tenured/tenure-track (permanent),
non-tenured (non-permanent), full-time and part-time status.
Enrolment (counted as of the school’s allowed withdrawal date)
The number of students enrolled in each year of study.
Enrolment Status
The type of student enrolled in a given program. Student enrolment status options are:
first time;
continuing;
advanced entrant;
repeater;
returnee leave of absence;
transfer-in internal; and
transfer-in external.
Faculty Categories
The categories (i.e., faculty titles) provided may not apply to each school. Schools are encouraged to
enter faculty titles in use at their school.
F1 Category
Within a university, these people are tenured/tenurable faculty who teach nursing courses. Within a
college, these people are permanent full-time or permanent part-time faculty who teach nursing
courses.
F2 Category
Within a university, these people are non-tenurable faculty fulfilling time-limited contracts of one full
academic year or longer who teach nursing courses. Within a college, these people are contract/non-
permanent faculty fulfilling time-limited contracts of one full academic year or longer who teach
nursing courses.
F3 Category
Within a university, these people are non-tenurable faculty fulfilling time-limited contracts of less
than one full academic year who teach nursing courses. Within a college, these people are
contract/non-permanent faculty fulfilling time-limited contracts of less than one full academic year
who teach nursing courses.
62
Nursing Education Statistics 2008-2009
First-Time Students (counted as of the school’s allowed withdrawal date)
New entrants to Year 1 of an RN education program. First-time students are found only in Year 1 data.
Nursing students who are in Year 2 for the first time are not considered first-time students. Data
reported in this selection are included in the calculation of admissions.
Note: First-time students differ from advanced entrants. See the definition of advanced entrants.
Intake
The number of times in an academic year when students enter programs. Sometimes intake is confused
with the number of students admitted.
Number of Applications Received
The number of applications received by a school for a given program. These applications have not yet
been reviewed (no decision made).
Number of Admissions Offered to Students
This number is usually different from the total quota number; it represents all offers made to students
whether accepted or not.
Number of Qualified Applications Unable to Accommodate
The number of qualified applications the program is unable to accommodate when the program is
oversubscribed.
Program Category
Data are recorded in the database according to the following program categories: baccalaureate
programs – university delivery, baccalaureate program – collaborative delivery, post-RN, master‟s,
doctoral, nurse practitioner. Each program category may contain multiple programs.
Example: Program category “post-RN” – the school may offer a post-RN program on-site as well as a
post-RN program via distance. Both programs are listed under program category “post-RN.”
Program Duration
The expected number of years/semesters required to complete the entire program based on full-time
program delivery.
Qualification
The name of the credential awarded upon successful completion of a program (e.g., BN, BScN, MN).
Quota
The number of seats funded by the provincial/territorial governments for new first-year entrants and/or
the school‟s own quota for the program.
Repeater Students (counted as of the school’s allowed withdrawal date)
Students who must repeat an entire year of study because they failed to meet their RN education
program requirements in a given year (policy may vary from one school to another). However, students
who are allowed to move on to the next year of the program while at the same time repeating a course
from a previous year of study are not to be included in this enrolment status option. See “continuing
students.”
63
Nursing Education Statistics 2008-2009
Returnee Leave of Absence (LOA) Students (counted as of the school’s allowed withdrawal date)
Students who return to an RN education program following a school-sanctioned leave of absence
(LOA) (e.g., maternity leave). The school policy regarding the amount of time a student may be absent
dictates which students are included in this enrolment status option.
Roll-up Results
The combined total of program results where the programs belong to the same program category.
Total Quota All Sites, All Intakes
The total of all individual quotas for a given program category.
Transfer-In Internal Students (counted as of the school’s allowed withdrawal date)
These students continue in an RN education program without interruption but transfer to a different
campus of the same school to do so. These students have previously been counted in the program data
of the original campus. This new enrolment status option permits schools with multiple campuses to
better track the flow of nursing students across their various campus locations.
Note: In past years, some schools reported these students as “continuing students.” If possible, please
specify transfer-in internal students.
Transfer-In External Students (counted as of the school’s allowed withdrawal date)
Students who started an RN education program at one school and transferred to a second school to
continue their studies while remaining in the same program category. These students have previously
been included in the program data of the original school. This new enrolment status option allows the
receiving school to differentiate between transfers who are nursing students from other institutions and
non-nursing students (see related information under “advanced entrants”).
Note: In past years, some schools reported these students as “continuing students,” while others chose
“first time” in Year 2, etc. Transfer-in external students should be identified where possible.
64
Nursing Education Statistics 2008-2009
Endnotes
1 Canadian Council on Learning. (2009). Post-secondary education in Canada: Meeting our needs? Ottawa:
Author.
2 Statistics Canada. (2008). Educating health workers: A statistical portrait. Ottawa: Author.
3 Usher, A., & Dunn, R. (2009). On the brink: How the recession of 2009 will affect post-secondary education.
Toronto: Educational Policy Institute.
4 Plant, G. (2007). Campus 2020: Thinking ahead: The report. Victoria, BC: Ministry of Advanced Education.
Available at http://www.llbc.leg.bc.ca/public/pubdocs/bcdocs/409788/campus2020-thinkingahead-report.pdf
5Med-Emerg Inc.(2006). Building the future: An integrated strategy for nursing human resources in Canada.
Phase II final report. Ottawa: Nursing Sector Study Corporation.
6 Regan, S., Thorne, S., & Mildon, B. (2009). Uncovering blind spots in education and practice leadership:
Towards a collaborative response to the nurse shortage. Canadian Journal of Nursing Leadership, 22(2), 30-40.
7 Canadian Institute for Health Information. (2009). Regulated nurses: Canadian trends, 2004 to 2008. Ottawa:
Author.
8 Jones, D., Caton, B., DeWitt, J., Stubbs, N., & Conner, E. (2007). Student-to-faculty ratios, teaching loads, and
salaries in associate degree nursing programs in the central United States. Teaching and Learning in Nursing,
2(1), 17-21.
9 National Education Association: Higher Education Research Center. (2007). Part-time faculty: A look at data
and issues, 11(3), 1-12.
10
Canadian Institute for Health Information. (2009). Regulated nurses: Canadian trends, 2004 to 2008. Ottawa:
Author.
Recommended