American Institute of Aeronautics and Astronautics
1
OH PLIF Visualization of the UVa Supersonic Combustion
Experiment: Configuration C
Colin D. McRae1, Craig T. Johansen
2
University of Calgary, Calgary, AB, T2N 1N4
Paul M. Danehy3
NASA Langley Research Center, Hampton, VA, 23681-2199
Emanuela C.A. Gallo4, Luca M.L. Cantu
5, Gaetano Magnotti
6, Andrew D. Cutler
7
The George Washington University, Newport News, VA, 23602
Robert D. Rockwell, Jr.8, Christopher P. Goyne
9, James C. McDaniel
10
University of Virginia, Charlottesville, VA, 22904
Non-intrusive hydroxyl radical (OH) planar laser-induced fluorescence (PLIF)
measurements were obtained in configuration C of the University of Virginia supersonic
combustion experiment. The combustion of hydrogen fuel injected through an unswept
compression ramp into a supersonic cross-flow was imaged over a range of streamwise
positions. Images were corrected for optical distortion, variations in the laser sheet profile,
and different camera views. Results indicate an effect of fuel equivalence ratio on
combustion zone shape and local turbulence length scale. The streamwise location of the
reaction zone relative to the fuel injector was also found to be sensitive to the fuel
equivalence ratio. The flow boundary conditions in the combustor section, which are
sensitive to the fuel flow rate, are believed to have caused this effect. A combination of laser
absorption and radiative trapping effects are proposed to have caused asymmetry observed
in the images. The results complement previously published OH PLIF data obtained for
configuration A along with other non-intrusive measurements to form a database for
computational fluid dynamics (CFD) model validation.
I. Introduction
CRAMJET engine research has become increasingly reliant on non-intrusive flow measurement techniques over
conventional probes to build validation datasets for computational fluid dynamics (CFD) models. Model
validation is a key step in the development of numerical design tools since the interaction between turbulence,
chemistry, and shock wave propagation in supersonic flows is not well understood. Validated numerical models can
be used as efficient design tools and with optimization routines to improve hypersonic aerospace propulsion
technology. Laser diagnostics, in particular, can be used to extract both qualitative visualization data and
quantitative flow property information. Quantitative techniques are often limited by operating conditions, facility
design, and the type of data that can be acquired. Therefore, a complete experimental validation dataset requires
several measurement techniques performed in a ground-test facility where operating conditions and flow geometry
1 Graduate Student, Department of Mechanical and Manufacturing Engineering, Member AIAA.
2 Assistant Professor, Department of Mechanical and Manufacturing Engineering, Member AIAA.
3 Research Scientist, Advanced Sensing and Optical Measurement Branch, MS 493, Associate Fellow AIAA. 4 Doctoral Student, Department of Mechanical and Aerospace Engineering, Member AIAA. 5 Doctoral Student, Department of Mechanical and Aerospace Engineering, Member AIAA. 6 Doctoral Student, Department of Mechanical and Aerospace Engineering, Member AIAA. 7 Professor, Department of Mechanical and Aerospace Engineering, Associate Fellow AIAA. 8 Senior Scientist, Department of Mechanical and Aerospace Engineering, Member AIAA. 9 Research Associate Professor, Department of Mechanical and Aerospace Engineering, Associate Fellow AIAA. 10 Professor, Department of Mechanical and Aerospace Engineering, Associate Fellow AIAA.
S
https://ntrs.nasa.gov/search.jsp?R=20130003219 2020-07-17T21:41:57+00:00Z

American Institute of Aeronautics and Astronautics
2
can be varied systematically. The National Center for Hypersonic Combined Cycle Propulsion (NCHCCP) has
organized a series of ground-based experiments to further understand the flow field associated with a dual-mode
scramjet engine. This engine incorporates both a subsonic and supersonic combustion mode into a single design in
order to simulate mode transition. The University of Virginia Scramjet Combustion Facility (UVaSCF) allows
variable engine configurations, variable fuel types, and supports a host of non-intrusive optical diagnostics. The
diagnostics include focused schlieren,1 stereoscopic particle image velocimetry (SPIV),
1 tunable diode laser
absorption spectroscopy (TDLAS),2
tunable diode laser absorption tomography (TDLAT),3 coherent anti-Stokes
Raman spectroscopy (CARS),4
and hydroxyl radical (OH) planar laser-induced fluorescence (PLIF).5
This paper reports on OH PLIF visualization data obtained for a new hydrogen fuel combustor configuration and
compares results to previous work.5 To first order, OH PLIF images provide spatially correlated concentration
distributions of combustion radicals in the flow.6 Although OH persists outside of the reaction zone, the distribution
of OH represents the overall shape of the combustion front. Several factors limit the concentration measurements to
being qualitative. First, the fluorescence signal is sensitive to local flow field properties such as temperature,
pressure, and concentrations of major species. Collisional quenching, whereby excited molecules dissipate energy
through collisions rather than through spontaneous emission, is an example of a mechanism that causes this
sensitivity. Second, optical density effects can decrease signal-to-noise levels and introduce systematic bias errors.
Laser absorption, for example, causes an artificial reduction in fluorescence signal intensity in the direction of the
laser beam. This occurs in optically dense media where a portion of the laser energy is lost due to absorption,
leaving less incident laser energy to excite subsequent molecules. Radiative trapping occurs in optically dense media
where spontaneously emitted photons from excited molecules are reabsorbed by neighboring molecules.7 There are
techniques that can reduce optical density effects. For example, it is possible to make quantitative measurements of
OH PLIF using a KrF excimer laser with a higher pulse energy to excite (v’=3,v”=0) vibronic transitions where
optical density effects can be significantly reduced.8,9
Visualization data, however, are easier to acquire and still
provide useful information about reactions occurring in the flow field, flow field structures and combustion front
shape.
II. Facility and PLIF Setup
The UVaSCF is a vertically oriented direct-connect scramjet combustor apparatus designed to simulate Mach 5
flight enthalpy.4 An electrically heated tank provides pressurized air to a nozzle that accelerates the air to Mach 2
into the scramjet test section.
Figure 1. UVaSCF with complete test section configuration.

American Institute of Aeronautics and Astronautics
3
Figure 1 shows a schematic of the test section complete with all modular sections, an arrangement which is
denoted as configuration C. It consists of a constant area isolator with a 25.4 mm × 38.1 mm (1 in. × 1.5 in.) cross-
section, a combustor with an expanding cross-section, a constant area TDLAT section, and an expanding extender
section. Gas exits the extender into an exhaust duct that vents from the top of the building. The modular nature of
the facility allows for different configurations to be tested. A recent paper reported OH distributions in configuration
A (top panel in Fig. 2), which does not include the isolator or TDLAT sections.5 In the current study, configuration
C was used, shown in the bottom panel in Fig. 2. Similar to the configuration A tests, the stagnation pressure was
300 kPa and the stagnation temperature was 1200 K. In the combustor section, a single, unswept, compression ramp
injector is mounted to the wall. The ramp is oriented at 7.1 degrees relative to the freestream flow and 10 degrees
relative to the injector wall. The injector interior is conical with a converging-diverging nozzle. Hydrogen fuel is
accelerated to approximately Mach 1.7 at the injector exit plane. The injector wall in the combustor diverges at an
angle of 2.9 degrees. This same angle of divergence occurs in the extender section. The hydrogen fuel equivalence
ratio, ϕ, is a relative measure of the concentration of OH in the combustor. For the results presented, two fuel
equivalence ratios were used: a low fuel equivalence ratio of ϕ=0.18 and a high fuel equivalence ratio of ϕ=0.49. In
the configuration A tests, ϕ=0.17 and ϕ=0.34 were used.5
Figure 2. Modular configurations of the UVaSCF. Configuration C is used in the current study.
The PLIF setup is identical to that used in the previous configuration A experiments.5 An injection-seeded
Nd:YAG laser was frequency doubled to 532 nm to pump a Spectra Physics PDL-2 dye laser. The 567.1 nm output
was then frequency doubled resulting in tunable light near 283.55 nm with an 8 ns pulse width. This was used to
excite a relatively temperature insensitive Q1(8) transition of OH. Based on a similar scramjet experiment using this
transition, the fluorescence intensity was expected to vary with temperature by less than 20% over a range of
temperatures from 1300 K to 3000 K.10
A series of UV mirrors relayed the beam from the mobile laser cart onto a
motorized translation stage. The beam was expanded in one direction with a UV cylindrical lens (f = 25 mm) and
then collimated in the horizontal direction with a UV spherical lens (50 mm diameter, f = 250mm). In the vertical
direction (perpendicular to the flow axis), this spherical lens forms the laser beam into a <1 mm thick sheet. Optical
access into the combustor section was facilitated by two UV grade fused silica windows mounted on the side walls.
The laser sheet entered from one side of the duct and was viewed by a camera from the other side. A schematic of
the optical table setup is shown in Fig. 3.
American Institute of Aeronautics and Astronautics
4
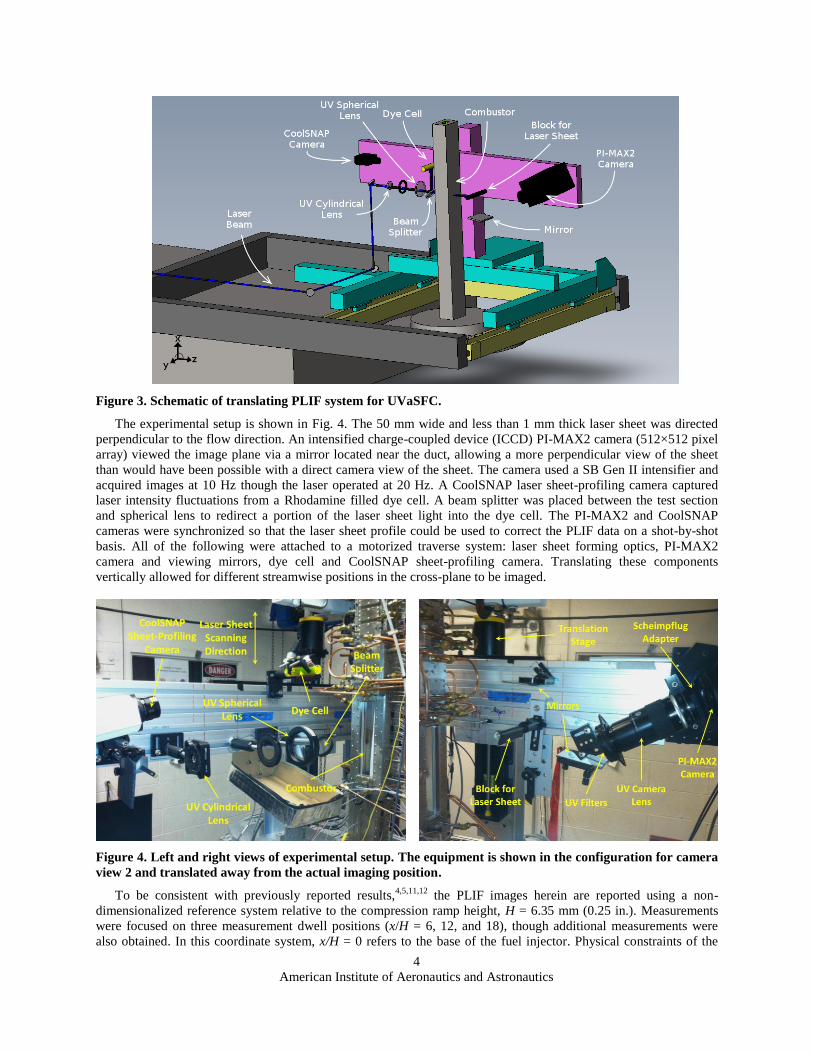
Figure 3. Schematic of translating PLIF system for UVaSFC.
The experimental setup is shown in Fig. 4. The 50 mm wide and less than 1 mm thick laser sheet was directed
perpendicular to the flow direction. An intensified charge-coupled device (ICCD) PI-MAX2 camera (512×512 pixel
array) viewed the image plane via a mirror located near the duct, allowing a more perpendicular view of the sheet
than would have been possible with a direct camera view of the sheet. The camera used a SB Gen II intensifier and
acquired images at 10 Hz though the laser operated at 20 Hz. A CoolSNAP laser sheet-profiling camera captured
laser intensity fluctuations from a Rhodamine filled dye cell. A beam splitter was placed between the test section
and spherical lens to redirect a portion of the laser sheet light into the dye cell. The PI-MAX2 and CoolSNAP
cameras were synchronized so that the laser sheet profile could be used to correct the PLIF data on a shot-by-shot
basis. All of the following were attached to a motorized traverse system: laser sheet forming optics, PI-MAX2
camera and viewing mirrors, dye cell and CoolSNAP sheet-profiling camera. Translating these components
vertically allowed for different streamwise positions in the cross-plane to be imaged.
Figure 4. Left and right views of experimental setup. The equipment is shown in the configuration for camera
view 2 and translated away from the actual imaging position.
To be consistent with previously reported results,4,5,11,12
the PLIF images herein are reported using a non-
dimensionalized reference system relative to the compression ramp height, H = 6.35 mm (0.25 in.). Measurements
were focused on three measurement dwell positions (x/H = 6, 12, and 18), though additional measurements were
also obtained. In this coordinate system, x/H = 0 refers to the base of the fuel injector. Physical constraints of the

American Institute of Aeronautics and Astronautics
5
translation stage and facility geometry required the use of two different camera configurations to image the full
range of streamwise positions in the combustor (Fig. 5). Camera view 1 covers the range from x/H = 23.7 to x/H = 6.
Camera view 2 covers the range from x/H = 6 to x/H = −10.5. Note that camera views 1 and 2 imaged the laser sheet
from opposite perspectives. Camera view 1 imaged the laser sheet from the upstream side, pointed downstream
through the flow. Camera view 2 imaged the sheet from the downstream side, pointed upstream through the flow.
While this would normally require a mirror correction in post-processing to properly synchronize the views between
the two camera configurations, the use of the extra physical mirror in camera view 2 naturally corrected the issue.
However, the different optical paths for each camera view resulted in different perspective distortions, spatial
resolutions, and radiative trapping bias errors for each camera view. This is discussed in the Results section below.
Figure 5. Camera views used to cover total streamwise range in combustor. Values are displayed in non-
dimensionalized units (x/H). Note the +y direction is into the page and injector ramp is on +y side of duct.

American Institute of Aeronautics and Astronautics
6
III. Image Processing
Four major steps are involved in processing of the PLIF images to correct for optical distortions and camera
perspective. These include background subtraction, image unwarping, laser sheet correction, and synchronization
between camera views and runs. With the exception of natural emission corrections, the steps are the same as those
described in the post-processing of configuration A images5 and are based on the procedure outlined by Danehy et
al. for nitric oxide (NO) PLIF.13
The unwarping procedure involves imaging a dotcard, which is a grid of uniform
square dots printed on a white card stock, placed in the plane of the laser sheet. The dots are equally spaced at 3.175
mm apart, allowing for determination of the spatial resolution of the images. The image processing software,
ImageJ,14
was used with the dotcard images to calculate a correction matrix for each camera view. This was applied
to all image data obtained from the PI-MAX2 camera to produce images without distortion (i.e., effectively normal
to the laser sheet). The spatial resolution after image unwarping was 12.6±0.1 pixels/mm. The images were
subsequently scaled so that each set has a magnification equivalent to that of configuration A, or 11.85 pixels/mm.
The background correction procedure used with configuration A images involved subtracting a constant
background signal from the entire set of images for each run.5 The magnitude of the background signal level was
determined from a 2000-shot average in a region of the image without PLIF signal. In the current study, an
alternative background correction was applied using natural emission images obtained with the facility running but
without laser excitation. These images captured flow luminosity at different streamwise positions and for both fuel
equivalence ratios. Figure 6 shows a raw single-shot PLIF image and the corresponding (100-shot averaged)
luminosity background image. It is clear that the luminosity is non-uniform in the vertical (y) direction, so a single-
value background subtraction cannot accurately correct for the natural luminosity of the flow.
Figure 6. Raw single-shot PLIF image (left) and corresponding averaged luminosity image (right) for camera
view 1 at x/H=12 and ϕ=0.18. Images have arbitrary intensity scaling. Dashed line indicates location of line
plots in Fig. 7.
The white dashed line across Fig. 6 indicates the location of the signal intensity line-plots shown in Fig. 7. Also
included in Fig. 7 is a line-plot of background signal intensity based on images without the facility or laser system
operating. The flow luminosity, which varied between 160 and 410 signal counts, includes the constant background
signal (approximately 124 signal counts). In cases where the laser sheet was translated between measurement dwell
positions and luminosity images were unavailable, an interpolation algorithm was used to construct the luminosity
images at intermediate streamwise positions. The luminosity images were used in place of a constant background
signal for the background subtraction.

American Institute of Aeronautics and Astronautics
7
Figure 7. Line plots showing signal comparison of raw PLIF image, luminosity image, and background noise
(x/H=12, ϕ=0.18) at a location indicated by the white dashed line in Fig. 6.
The results presented herein have been cropped to the approximate location of the facility walls based on the
magnification reported from the configuration A results as discussed above. The images have been rotated such that
the ramp injector wall is at the top of the images. In all of the images, the laser sheet direction is from left to right
(+z) and the downstream direction is into the page (+x). Approximate cropping locations are given in Fig. 8 below,
indicated by white dashed lines. Configuration A results were cropped such that they included scatter off of the
facility walls. The use of an additional filter (Semrock FF01-320/40-25, centered at 320 nm with a 40 nm bandpass,
25 mm diameter) in configuration C eliminated the majority of laser scatter from the facility walls.
0
1000
2000
3000
4000
5000
6000
7000
8000
9000
10000
-4 -3 -2 -1 0 1 2 3 4
Arb
itra
ry S
ign
al I
nte
nsi
ty C
ou
nt
z/H Position
Raw PLIF Image
100-Shot Averaged Luminosity Image
2000-Shot Averaged Background SignalImage
American Institute of Aeronautics and Astronautics
8
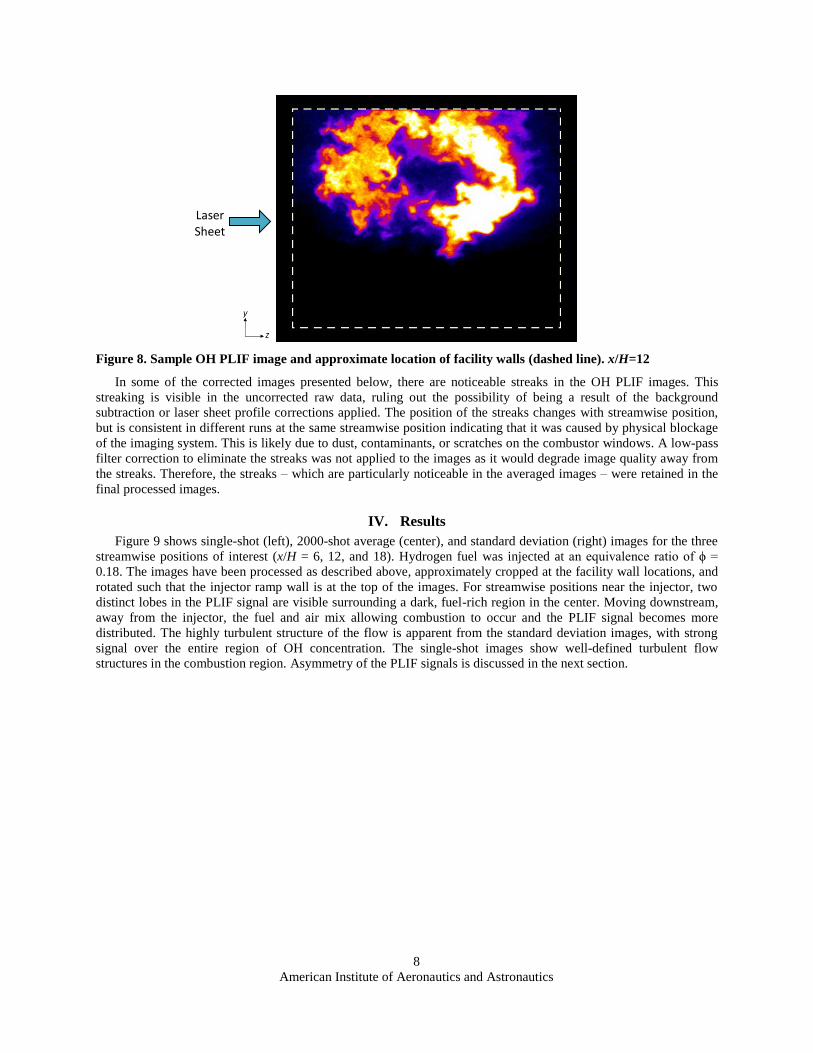
Figure 8. Sample OH PLIF image and approximate location of facility walls (dashed line). x/H=12
In some of the corrected images presented below, there are noticeable streaks in the OH PLIF images. This
streaking is visible in the uncorrected raw data, ruling out the possibility of being a result of the background
subtraction or laser sheet profile corrections applied. The position of the streaks changes with streamwise position,
but is consistent in different runs at the same streamwise position indicating that it was caused by physical blockage
of the imaging system. This is likely due to dust, contaminants, or scratches on the combustor windows. A low-pass
filter correction to eliminate the streaks was not applied to the images as it would degrade image quality away from
the streaks. Therefore, the streaks – which are particularly noticeable in the averaged images – were retained in the
final processed images.
IV. Results
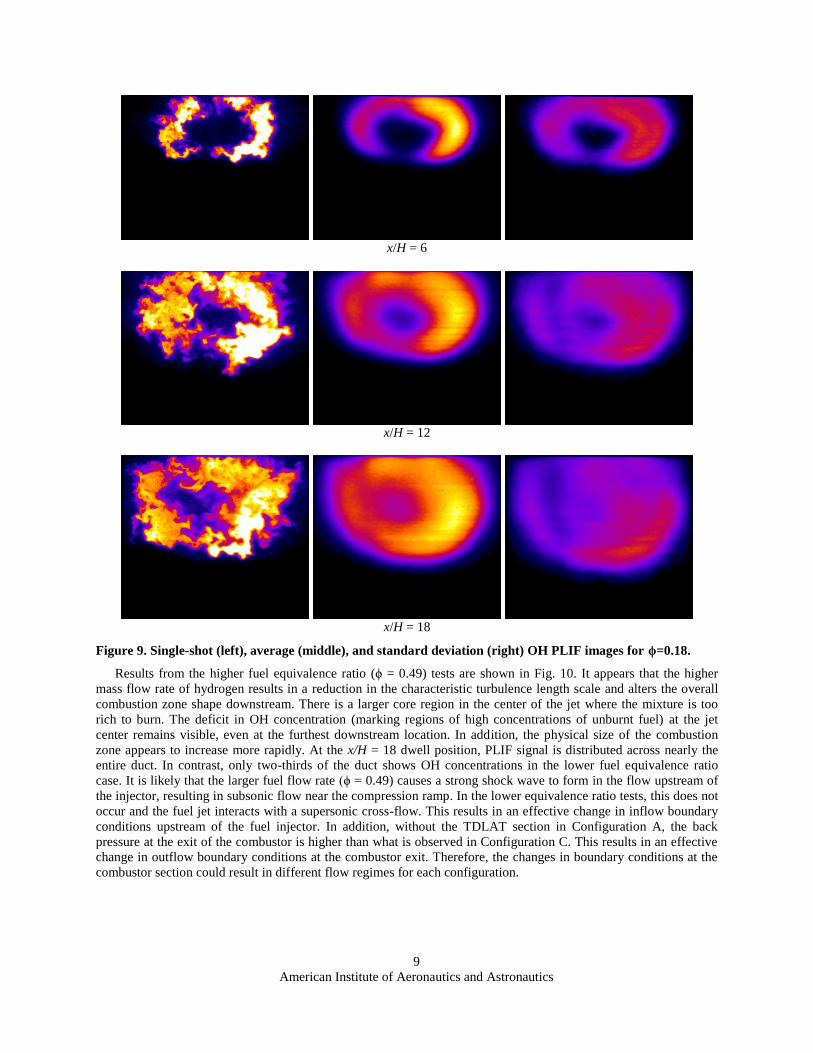
Figure 9 shows single-shot (left), 2000-shot average (center), and standard deviation (right) images for the three
streamwise positions of interest (x/H = 6, 12, and 18). Hydrogen fuel was injected at an equivalence ratio of ϕ =
0.18. The images have been processed as described above, approximately cropped at the facility wall locations, and
rotated such that the injector ramp wall is at the top of the images. For streamwise positions near the injector, two
distinct lobes in the PLIF signal are visible surrounding a dark, fuel-rich region in the center. Moving downstream,
away from the injector, the fuel and air mix allowing combustion to occur and the PLIF signal becomes more
distributed. The highly turbulent structure of the flow is apparent from the standard deviation images, with strong
signal over the entire region of OH concentration. The single-shot images show well-defined turbulent flow
structures in the combustion region. Asymmetry of the PLIF signals is discussed in the next section.
Laser Sheet
American Institute of Aeronautics and Astronautics
9
x/H = 6
x/H = 12
x/H = 18
Figure 9. Single-shot (left), average (middle), and standard deviation (right) OH PLIF images for ϕ=0.18.
Results from the higher fuel equivalence ratio (ϕ = 0.49) tests are shown in Fig. 10. It appears that the higher
mass flow rate of hydrogen results in a reduction in the characteristic turbulence length scale and alters the overall
combustion zone shape downstream. There is a larger core region in the center of the jet where the mixture is too
rich to burn. The deficit in OH concentration (marking regions of high concentrations of unburnt fuel) at the jet
center remains visible, even at the furthest downstream location. In addition, the physical size of the combustion
zone appears to increase more rapidly. At the x/H = 18 dwell position, PLIF signal is distributed across nearly the
entire duct. In contrast, only two-thirds of the duct shows OH concentrations in the lower fuel equivalence ratio
case. It is likely that the larger fuel flow rate (ϕ = 0.49) causes a strong shock wave to form in the flow upstream of
the injector, resulting in subsonic flow near the compression ramp. In the lower equivalence ratio tests, this does not
occur and the fuel jet interacts with a supersonic cross-flow. This results in an effective change in inflow boundary
conditions upstream of the fuel injector. In addition, without the TDLAT section in Configuration A, the back
pressure at the exit of the combustor is higher than what is observed in Configuration C. This results in an effective
change in outflow boundary conditions at the combustor exit. Therefore, the changes in boundary conditions at the
combustor section could result in different flow regimes for each configuration.

American Institute of Aeronautics and Astronautics
10
x/H = 6
x/H = 12
x/H = 18
Figure 10. Single-shot (left), average (middle), and standard deviation (right) OH PLIF images for ϕ=0.49.
Of particular interest in the PLIF visualization data is the combustion behavior near the injector exit plane.
Figure 11 and Figure 12 show reconstructed images near the injector for low and high fuel equivalence ratio tests,
respectively. The laser sheet was scanned in one millimeter steps from x/H = 0 (at the injector) to positions slightly
downstream. In the interest of space, only two positions (x/H = 0 and 0.6) are reported, and the images have been
cropped to a smaller area around the injector. Equivalent arbitrary brightness and contrast settings have been applied
to the figures below and they are not correlated to the rest of the results presented herein. Although PLIF signal is
visible at the injector face for both cases, it is much stronger (up to four times) in the higher equivalence ratio tests.
At x/H = 0, the rectangular shape of the injector face is clearly recognizable. In scans over the injector, there is no
signal upstream of x/H = 0 for both equivalence ratio tests.

American Institute of Aeronautics and Astronautics
11
Figure 11. OH distribution near the injector for ϕ=0.18; averaged image at x/H = 0 (left), averaged image at
x/H = 0.6 (center) and single-shot image at x/H = 0.6 (right).
Figure 12. OH distribution near the injector for ϕ=0.49; averaged image at x/H = 0 (left), averaged image at
x/H = 0.6 (center) and single-shot image at x/H = 0.6 (right). Intensity scaling is the same as used in Fig. 11.
To provide a sense of the streamwise distribution of OH and the progression of combustion, single-shot images
were overlaid onto a 3D wireframe of the combustor. Figure 13 shows the combustion zone progression for a fuel
equivalence ratio ϕ = 0.18, and Fig. 14 shows the progression for ϕ = 0.49. The single-shot images are separated by
a step size of 3 x/H, starting from a position of x/H = 1 to 22. For the lower fuel equivalence ratio, the confined size
of the plume even at far downstream positions is apparent. Conversely, the higher fuel equivalence ratio shows the
plume covering nearly the entire combustor cross-section. However, the distribution of OH is much more evenly
distributed in the lower fuel equivalence ratio case, especially at the furthest downstream positions. For comparison,
Fig. 15 shows corresponding configuration A results for an equivalence ratio of ϕ = 0.17.
Figure 13. Combustor 3D wireframe drawing with single-shot PLIF overlay showing streamwise distribution
from x/H = 1 to 22 for ϕ=0.18. Configuration C.

American Institute of Aeronautics and Astronautics
12
Figure 14. Combustor 3D wireframe drawing with single-shot PLIF overlay showing streamwise distribution
from x/H = 1 to 22 for ϕ=0.49. Configuration C.
Figure 15. Combustor 3D wireframe drawing with single-shot PLIF overlay showing streamwise distribution
from x/H = 1 to 22 for ϕ=0.17. Configuration A. Adapted from [5].
V. Discussion
The asymmetry apparent in the results presented above, particularly for the case of lower fuel equivalence ratio,
appears to be most severe at the upstream end of the combustor, towards the fuel injector. This observation agrees
with results from configuration A tests where the distribution became more symmetric further downstream.5 CARS
measurements in configuration A showed asymmetry in the temperature distribution upstream of the injector4 which
could be attributed to non-uniform electric heating in the facility heater. Since the fluorescence signal is sensitive to
the gas temperature, asymmetry in the PLIF signal could be partially caused by the temperature asymmetry observed
American Institute of Aeronautics and Astronautics
13
by CARS. Further, asymmetry in the test section geometry (compression ramp) could have an influence on PLIF
signal observed.
Asymmetry can also be caused by laser absorption where a decrease in PLIF signal occurs in the laser sheet
propagation direction. The effect is amplified at higher OH concentrations. However, the results show a PLIF signal
gradient opposite to what would be expected from laser absorption alone. In addition, at higher equivalence ratios, it
is expected that the severity of asymmetry would become worse. The PLIF results indicate that there is less
asymmetry for higher equivalence ratios.
Gas velocity components in the direction of the laser sheet (z) can result in a Doppler shift. This occurs as the
effective laser frequency changes when molecules travel toward or away from the laser source. Since the spectral
width of the laser is narrow (<1 cm-1
), a cross-stream Doppler shift could affect the PLIF signal and result in an
asymmetric distribution. However, CFD results reported by Fulton et al. for configuration A indicated that cross-
stream velocity magnitudes were relatively small.12
Therefore, it is not expected that the Doppler shift caused the
observed asymmetry.
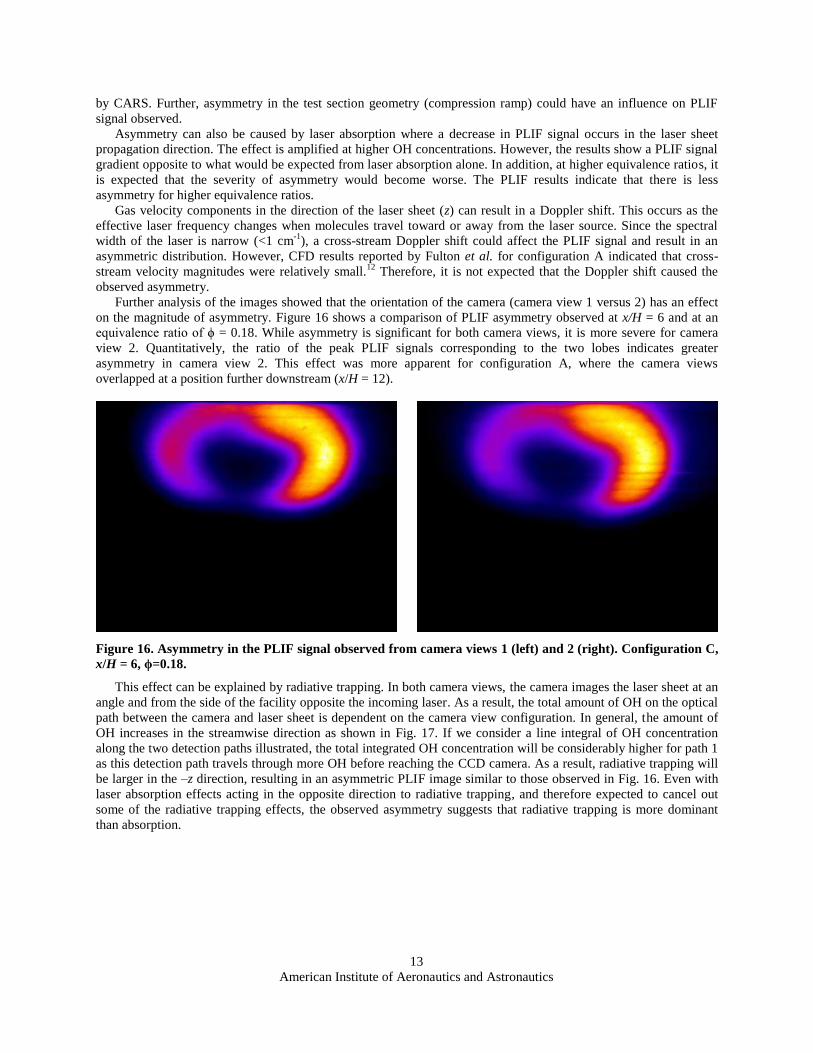
Further analysis of the images showed that the orientation of the camera (camera view 1 versus 2) has an effect
on the magnitude of asymmetry. Figure 16 shows a comparison of PLIF asymmetry observed at x/H = 6 and at an
equivalence ratio of ϕ = 0.18. While asymmetry is significant for both camera views, it is more severe for camera
view 2. Quantitatively, the ratio of the peak PLIF signals corresponding to the two lobes indicates greater
asymmetry in camera view 2. This effect was more apparent for configuration A, where the camera views
overlapped at a position further downstream (x/H = 12).
Figure 16. Asymmetry in the PLIF signal observed from camera views 1 (left) and 2 (right). Configuration C,
x/H = 6, ϕ=0.18.
This effect can be explained by radiative trapping. In both camera views, the camera images the laser sheet at an
angle and from the side of the facility opposite the incoming laser. As a result, the total amount of OH on the optical
path between the camera and laser sheet is dependent on the camera view configuration. In general, the amount of
OH increases in the streamwise direction as shown in Fig. 17. If we consider a line integral of OH concentration
along the two detection paths illustrated, the total integrated OH concentration will be considerably higher for path 1
as this detection path travels through more OH before reaching the CCD camera. As a result, radiative trapping will
be larger in the –z direction, resulting in an asymmetric PLIF image similar to those observed in Fig. 16. Even with
laser absorption effects acting in the opposite direction to radiative trapping, and therefore expected to cancel out
some of the radiative trapping effects, the observed asymmetry suggests that radiative trapping is more dominant
than absorption.

American Institute of Aeronautics and Astronautics
14
Figure 17. Illustration of OH concentration along the detection paths for camera view 1.
Figure 18 shows a schematic of the optical path for camera view 2. Similar to camera view 1, there is a larger
integrated OH concentration along path 1 compared to path 2. However, because overall OH levels increase in the
streamwise (+x) direction, the radiative trapping effect that causes asymmetry is amplified in images corresponding
to camera view 2. Because camera views 1 and 2 used different optical paths, the average PLIF signal intensity from
overlapping streamwise positions was used to calibrate the overall intensities between the two camera views.
Therefore, differences in overall signal levels associated with changes in radiative trapping between the camera
views were corrected. As the laser sheet moves downstream, magnitudes of radiative trapping and laser absorption
increase. However, it is likely that overall signal levels are artificially low at these downstream positions.

American Institute of Aeronautics and Astronautics
15
Figure 18. Illustration of OH concentration along the detection path for camera view 2.
At higher equivalence ratios, higher OH concentrations are expected at a given streamwise position. As a result,
the magnitude of laser absorption is higher and can counteract the effects of radiative trapping. This would result in
symmetric PLIF images, which is observed experimentally. In general, radiative trapping and laser absorption both
contribute to asymmetry, but the dominant effect is a function of the concentration of OH along the optical detection
path and the quantity of OH at the laser sheet location. Detailed modeling of the flow field and spectroscopic
absorption effects would be required to prove these claims.
In these tests, the Q1(8) transition of OH was used due to its relative insensitivity to changes in temperature,
allowing for a PLIF signal roughly proportional to local OH concentration. Unfortunately, the (v’=1,v”=0) band has
the drawback that for high concentrations of OH or larger dimensioned facilities there is an increase in laser beam
attenuation and radiative trapping. Although it is possible to defend against these effects by exciting a weaker band
(v’=3,v”=0), the overall signal-to-noise ratio is expected to be lower.15
VI. Conclusions
In this paper, processed OH PLIF images obtained from the University of Virginia Scramjet Combustion Facility
for configuration C have been presented. Similar to configuration A results, the fuel equivalence ratio was found to
have an effect on the combustion zone shape and the turbulence structure in the flow. It is proposed that the shock
wave structure in the freestream flow upstream of the compression ramp injector is sensitive to fuel flow rate and
magnitude of heat release. As a result, the Mach number of the freestream flow that interacts with the compression
ramp is affected, resulting in a change in the turbulence field and combustion zone shape further downstream.
Through this mechanism, higher fuel equivalence ratio tests with a corresponding subsonic freestream flow near the
injector result in combustion at the injector surface. In contrast, lower equivalence ratio tests with a corresponding
supersonic freestream flow do not show large OH concentration levels near the injector surface. Asymmetry of OH
PLIF images in configurations A and C is primarily attributed to optical density effects, including laser sheet
absorption and radiative trapping, and facility flow effects. While radiative trapping and laser sheet absorption result
in larger asymmetry near the fuel injector, these competing effects cause an overall reduction in PLIF signal.

American Institute of Aeronautics and Astronautics
16
Strategies to remove error from future tests due to optical density effects were discussed. The results presented
contribute to the growing database for computational fluid dynamics model validation for scramjet flows.
Acknowledgements
Dr. Johansen was supported by the Natural Sciences and Engineering Research Council of Canada (NSERC). This
work was supported by the AFOSR/NASA National Center for Hypersonic Combined Cycle Propulsion grant FA
9550-09-1-0611. The technical monitors are Chiping Li from the AFOSR and Rick Gaffney from NASA. We wish
to thank Killian Danehy for assisting in the preliminary processing and presentation of these data.
References
1 Rockwell, R.D., Goyne, C.P., Rice, B.E., Tatman, B.J., Smith, C., Kouchi, T., McDaniel, J.C., Fulton, J.A., and
Edwards, J.R., “Close-Collaborative Experimental and Computational Study of a Dual-Mode Scramjet Combustor,”
AIAA-2012-113, 50th AIAA Aerospace Sciences Meeting and Exhibit, Nashville, TN, 2012. 2 Goldstein, C.S., Shultz, I.A., Jeffries, J.B., and Hanson, R.K., “Tunable Diode Laser Absorption Sensor for
Measurements of Temperature and Water Concentration in Supersonic Flows,” AIAA-2011-1094, 49th AIAA
Aerospace Sciences Meeting and Exhibit, Orlando, FL, 2011. 3 Busa, K.M., Bryner, E., McDaniel, J.C., Goyne, C.P., Smith, C.T., and Diskin, G.S., “Demonstration of
Capability of Water Flux Measurement in a Scramjet Combustor using Tunable Diode Laser Absorption
Tomography and Stereoscopic PIV,” AIAA-2012-1294, 49th Aerospace Sciences Meeting and Exhibit, Orlando, FL,
2011. 4 Cutler, A.D, Magnotti, G., Cantu, L., Gallo, E., Danehy, P.M., Rockwell, R., Goyne, C., McDaniel, J., “Dual-
Pump CARS Measurements in the University of Virginia’s Dual-Mode Scramjet: Configuration A,” AIAA Paper
2012-0114, 50th AIAA Aerospace Sciences Meeting and Exhibit, Nashville, TN, 2012. 5 Johansen, C.T., McRae, C.D., Danehy, P.M., Gallo, E., Cantu, L., Magnotti, G., Cutler, A., Rockwell, R.,
Goyne, C., McDaniel, J., “OH PLIF Visualization of the UVa Supersonic Combustion Experiment: Configuration
A,” AIAA Paper 2012-2887, 42nd AIAA Fluid Dynamics Conference and Exhibit, New Orleans, LA, 2012. 6 Seitzman, J.M. and Hanson, R.K., “Comparison of Excitation Techniques for Quantitative Fluorescence
Imaging of Reacting Flows,” AIAA Journal, Vol. 31, No. 3, pp. 513-519, 1993. 7 Svelto, O., Principles of Lasers, 5th Edition, Springer, New York, 2009.
8 Quagliaroli, T.M., Laufer, G., Hollo, S.D., Krauss, R.H., Whitehurst, R.B., and McDaniel, J.C., “Planar KrF
Laser-Induced OH Fluorescence Imaging in a Supersonic Combustion Tunnel,” Journal of Propulsion and Power,
Vol. 10, No. 3, pp. 377-381, 1994. 9 Laufer, G., Quagliaroli, T.M., Krauss, R.H., Whitehurst III, R.B., McDaniel, J.C., and Grinstead, J.H., “Planar
OH Density and Apparent Temperature Measurements in a Supersonic Combusting Flow,” AIAA Journal, Vol. 34,
No. 3, pp. 463-469, 1996. 10
O’Byrne, S., Stotz, I., Neely, A.J., Boyce, R.R., Mudford, N.R., and Houwing, A.F.P., “OH PLIF Imaging of
Supersonic Combustion using Cavity Injection,” AIAA-2005-3357, 13th
International Space Planes and
Hypersonics Systems and Technologies Meeting, Capula, Italy, 2005. 11
Le, D.B., Goyne, C.P., and Krauss, R.H., “Shock Train Leading-Edge Detection in a Dual-Mode Scramjet,”
Journal of Propulsion and Power, Vol. 24, No. 5, pp. 1035-1041, 2008. 12
Fulton, J.A., Edwards, J.R., Hassan, H.A., Rockwell, R., Goyne, C., McDaniel, J., Smith, C., Cutler, A.,
Johansen, C., Danehy, P.M., and Kouchi, T., “Large-Eddy / Reynolds-Averaged Navier-Stokes Simulations of a
Dual-Mode Scramjet Combustor,” AIAA-2012-0115, 50th AIAA Aerospace Sciences Meeting and Exhibit,
Nashville, TN, 2012. 13
Danehy, P.M., Alderfer, D.W., Inman, J.A., Berger, K.T., Buck, G.M., and Schwartz, R.J., “Fluorescence
Imaging and Streamline Visualization of Hypersonic Flow over Rapid Prototype Wind-Tunnel Models,” Proc.
IMechE, Part G: J. Aerospace Engineering, 222(G5), pp. 637-651, 2008. 14
Rasband, W.S., ImageJ, U.S. National Institutes of Health, Bethesda, MD, USA, http://rsb.info.nih.gov/ij,
1997-2009. 15
Quagliaroli, T.M., Laufer, G., Krauss, R.H., and McDaniel, J.C., “Laser Selection Criteria for OH
Fluorescence Measurements in Supersonic Combustion Test Facilities,” AIAA Journal, Vol. 31, No. 3, pp. 520-527,
1993.
Recommended