Ø F-Distribution
ØTesting Means of Three or More Populations
ØBetween Group and Within Group Variability
ØANOVA Table
ØRole of Mean and Standard Deviation
One-Factor Analysis of Variance (ANOVA)
Lecture 29
Section 12.1
Four Stages of Statistics
• Data Collection þ
• Displaying and Summarizing Data þ
• Probability þ
• Inference• One Quantitative ü
• One Categorical ü
• One Quantitative and One Categorical• Matched Pairs ü
• Difference of Two Means ü
• ANOVA and Multiple Comparisons
• Two Categorical ü
• Two Quantitative
F-Distribution
• F-Distribution: continuous probability distribution that has the following properties:• Unimodal and right-skewed
• Always non-negative
• Two parameters for degrees of freedom• One for numerator and one for denominator
• Used to compare the ratio of two sources of variability

F-Distribution Table
• Because the F-distribution is not symmetric, the table only gives statistics for areas in the upper tail.• As degrees of freedom
increase, F-values decrease.
• To reject the null hypothesis, larger test statistics are needed for tests that have more degrees of freedom.
• A different table is needed for each area – this table shows .05 in the upper tail.
Table continues in both directions
Motivation: One-Factor ANOVA
• Scenario: Comparing average math SAT scores for 8 students in three different majors: computer science, economics, and history
• Question: Are the mean math SAT scores equal across all three majors?
• Answer: From the side-by-side boxplots:• Means appear to be ___________________
• But there is a _______________________________ in each group
• Sample size is ________________
• Takeaway: Need an inferential technique that compares ______________________________
One-Factor Analysis of Variance (ANOVA)
• One-Factor Analysis of Variance (ANOVA): statistical technique used to compare the means of three or more populations• Uses two sources of variability to compare means
• Between Group Variation: measures that amount of variability between the sample means of individual groups• “How different are the sample means from one another?”
•Within Group Variation: measures the amount of variability that exists within the samples• “How different are the individual observations from one another within
each group?”
Comparing Types of Variation
______________________ Group Variation• Means close together (40, 42, and 44)
______________________ Group Variation• Observations within groups far apart
• Range for each sample is about 40
______________________ Group• Means far apart (3, 13, and 23)
______________________ Group• Observations within groups close together
• Range for each sample is about 5
One-Factor ANOVA: Hypotheses and Conditions
•Hypotheses: Let be the number of groups being compared• !": #$ = #% = ⋯ = #'• !(: At least two means are not equal
• Additional Conditions Needed:• Sampling distributions of both means must be approximately normal
• Ratio of largest sample variance to smallest sample variance less than 2
Example: One-Factor ANOVA
• Scenario: Comparing average math SAT scores for 8 students in three different majors: computer science, economics, and history
• Question: Are the mean math SAT scores equal across all three majors?
•Hypotheses:• !": __________________________
• !(: _______________________________________________________________________________

Example: One-Factor ANOVA
• Question: Are the mean math SAT scores equal across all three majors?
• Conditions:• Nearly Normal: _______________• All three boxplots look ________________________________
• Skewness between _________________ for all 3 samples
• Kurtosis between _________________ for all 3 samples
• Equal Spread: _______________• Largest Variance: _____________________
• Smallest Variance: _____________________
• Ratio: _____________________
Grand Mean
• Grand Mean: the mean of all observations, disregarding the group from which the observations were sampled
*̿ =+$*̅$ + +%*̅% +⋯+ +'*̅'
+$ + +% +⋯+ +'
where *̅. is the mean of the observations from group / and +. is
the number of observations sampled from group /• Used in the calculation of the between group variation because it helps
us understand how different the sample means are.
Warning: Do not average the sample means! This tactic to find
the grand mean only works if all of the sample sizes are the same.
One-Factor ANOVA: Types of Variation
• Between Group Variation: How different are the sample means?
001 = +$ *̅$ − *̿ % + +% *% − *̿ % +⋯+ +' *̅' − *̿ %
•Within Group Variation: How different are the observations within each group?
003 = +$ − 1 5$% + +% − 1 5%
% +⋯+ +' − 1 5'%
• Total Variation: 006 = 001 + 003
Sample Size Sample Variance
Sample Size Sample Mean
Example: One-Factor ANOVA
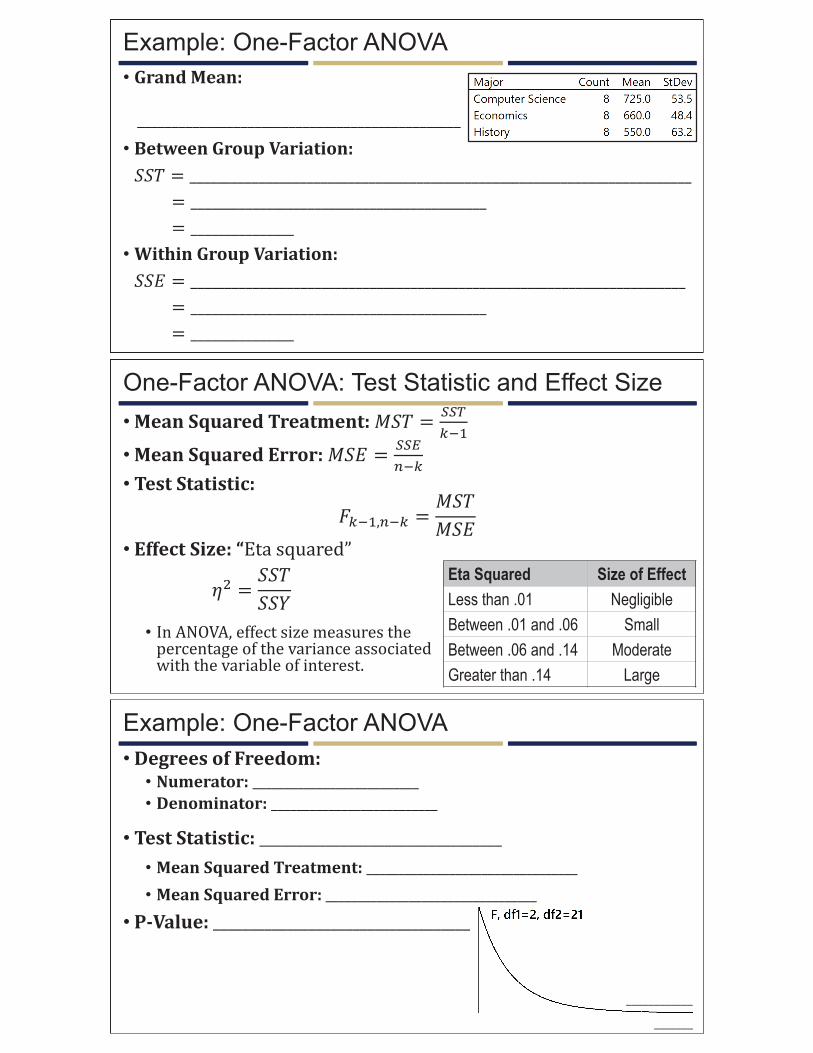
• Grand Mean:
_______________________________________________
• Between Group Variation:
001 = _________________________________________________________________________
= ___________________________________________
= _______________
• Within Group Variation:
003 = ________________________________________________________________________
= ___________________________________________
= _______________
One-Factor ANOVA: Test Statistic and Effect Size
•Mean Squared Treatment: 701 =889
';$
•Mean Squared Error: 703 =88<
>;'
• Test Statistic:
?';$,>;' =701
703• Effect Size: “Eta squared”
A% =001
006
• In ANOVA, effect size measures the percentage of the variance associated with the variable of interest.
Eta Squared Size of Effect
Less than .01 Negligible
Between .01 and .06 Small
Between .06 and .14 Moderate
Greater than .14 Large
Example: One-Factor ANOVA
• Degrees of Freedom:• Numerator: __________________________
• Denominator: __________________________
• Test Statistic: _________________________________
• Mean Squared Treatment: _________________________________
• Mean Squared Error: _________________________________
• P-Value: ___________________________________
____________
_______
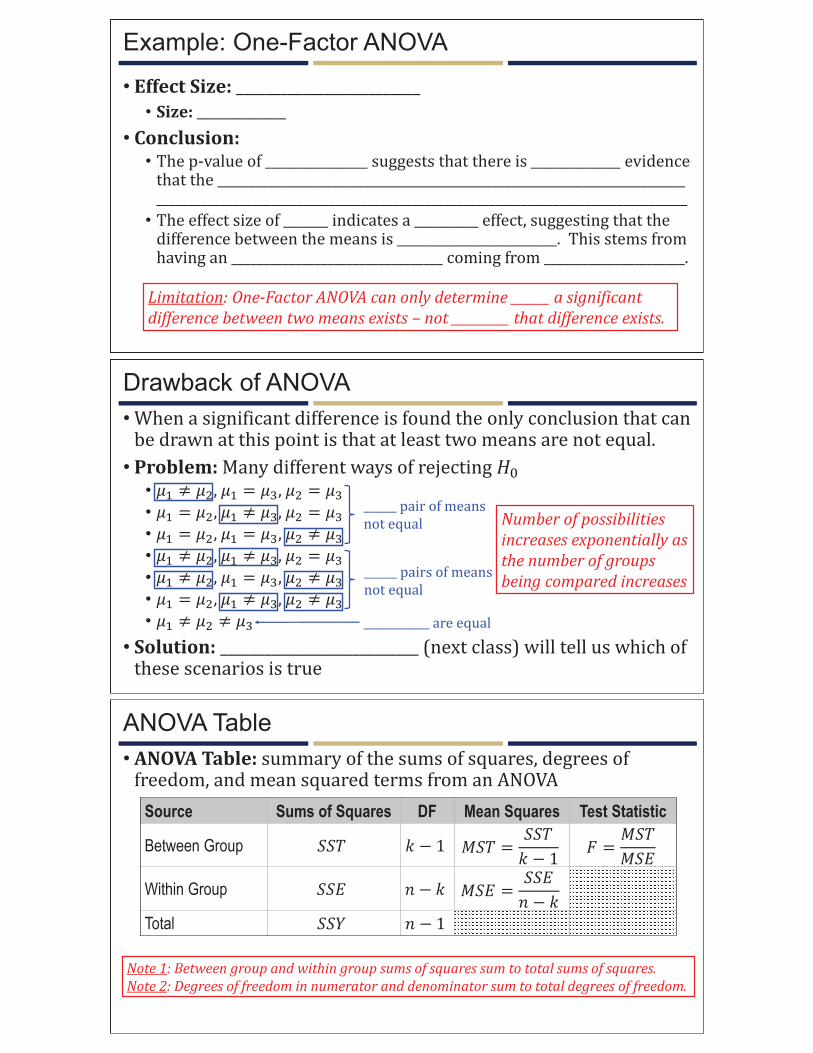
Example: One-Factor ANOVA
• Effect Size: _________________________
• Size: ______________
• Conclusion:• The p-value of ________________ suggests that there is ______________ evidence
that the _________________________________________________________________________ ___________________________________________________________________________________
• The effect size of _______ indicates a __________ effect, suggesting that the difference between the means is _________________________. This stems from having an _________________________________ coming from ______________________.
Limitation: One-Factor ANOVA can only determine ______ a significant
difference between two means exists – not _________ that difference exists.
Drawback of ANOVA
•When a significant difference is found the only conclusion that can be drawn at this point is that at least two means are not equal.
• Problem: Many different ways of rejecting !"
• #$ ≠ #%, #$ = #C, #% = #C• #$ = #%, #$ ≠ #C, #% = #C• #$ = #%, #$ = #C, #% ≠ #C• #$ ≠ #%, #$ ≠ #C, #% = #C• #$ ≠ #%, #$ = #C, #% ≠ #C• #$ = #%, #$ ≠ #C, #% ≠ #C• #$ ≠ #% ≠ #C
• Solution: ___________________________ (next class) will tell us which of these scenarios is true
______ pair of means
not equal
______ pairs of means
not equal
____________ are equal
Number of possibilities
increases exponentially as
the number of groups
being compared increases
ANOVA Table
• ANOVA Table: summary of the sums of squares, degrees of freedom, and mean squared terms from an ANOVA
Source Sums of Squares DF Mean Squares Test Statistic
Between Group 001 − 1 701 =001
− 1? =
701
703
Within Group 003 + − 703 =003
+ −
Total 006 + − 1
Note 1: Between group and within group sums of squares sum to total sums of squares.
Note 2: Degrees of freedom in numerator and denominator sum to total degrees of freedom.
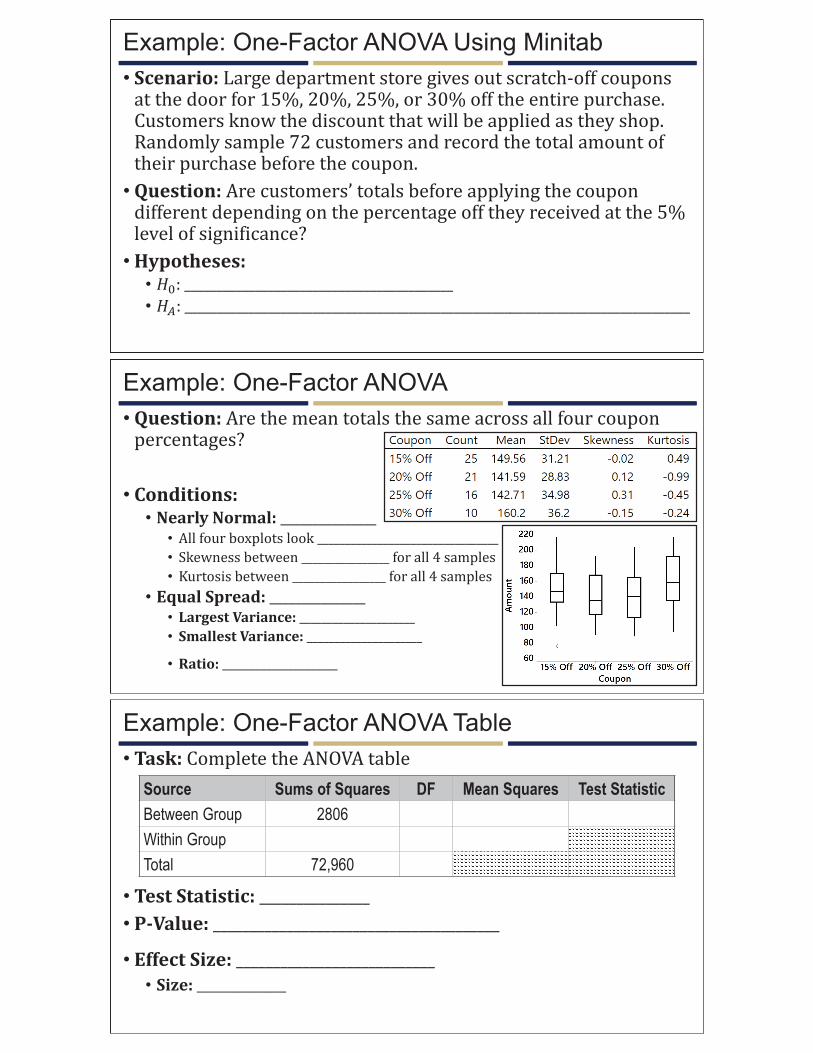
Example: One-Factor ANOVA Using Minitab
• Scenario: Large department store gives out scratch-off coupons at the door for 15%, 20%, 25%, or 30% off the entire purchase. Customers know the discount that will be applied as they shop. Randomly sample 72 customers and record the total amount of their purchase before the coupon.
• Question: Are customers’ totals before applying the coupon different depending on the percentage off they received at the 5% level of significance?
•Hypotheses:• !": __________________________________________
• !(: _______________________________________________________________________________
Example: One-Factor ANOVA
• Question: Are the mean totals the same across all four coupon percentages?
• Conditions:• Nearly Normal: _______________• All four boxplots look _________________________________
• Skewness between ________________ for all 4 samples
• Kurtosis between _________________ for all 4 samples
• Equal Spread: _______________• Largest Variance: _____________________
• Smallest Variance: _____________________
• Ratio: _____________________
Example: One-Factor ANOVA Table
• Task: Complete the ANOVA table
• Test Statistic: _______________
• P-Value: _______________________________________
• Effect Size: ___________________________
• Size: ______________
Source Sums of Squares DF Mean Squares Test Statistic
Between Group 2806
Within Group
Total 72,960
Example: One-Factor ANOVA
• Conclusion:• _____________________ because _________________ (or ___________________) and
conclude that the customers’ totals before applying the coupon __________ _________________________________________________________. That is, no mean total before the applying the coupon differs significantly ________________________ ________.
• The effect size of _____ indicates a ______ effect, indicating that the result is __________________________ despite the __________________.
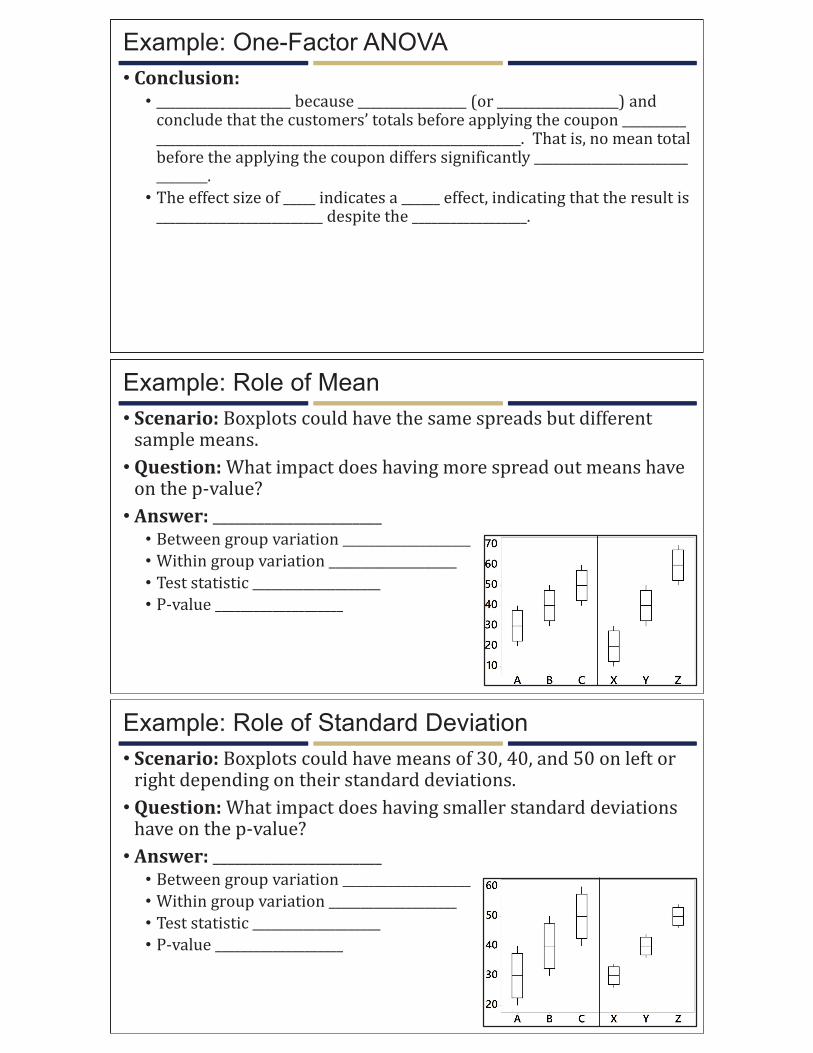
Example: Role of Mean
• Scenario: Boxplots could have the same spreads but different sample means.
• Question: What impact does having more spread out means have on the p-value?
• Answer: _______________________• Between group variation ____________________
• Within group variation ____________________
• Test statistic ____________________
• P-value ____________________
Example: Role of Standard Deviation
• Scenario: Boxplots could have means of 30, 40, and 50 on left or right depending on their standard deviations.
• Question: What impact does having smaller standard deviations have on the p-value?
• Answer: _______________________• Between group variation ____________________
• Within group variation ____________________
• Test statistic ____________________
• P-value ____________________
Recommended