i
PO BOX 1136 MANLY NSW 1655
7/150 Keppel Street Bathurst NSW 2795
P (02) 63377229
F (02) 47824862
M 0422857086
contact @appliedecology com.au
www.appliedecology.com.au
PARRAMATTA RIVER CATCHMENT
NATIVE HABITATS AND FAUNA Prepared for:
Parramatta River Catchment Group
August 2014

ii
DOCUMENT VERIFICATION
Project Title Parramatta River Catchment – Native Habitats and Fauna
Document Title Parramatta River Catchment – Native Habitats and Fauna – FINAL
report
Description Submission 2
Client Parramatta River Catchment Management Committee
Client contact Rob Stevenson City of Canada Bay
Revision Prepared by Reviewed by Date
A AC MB internal June 2014
B AE client Jul-Aug 2014
0 AE Aug 2014
COMMERCIAL IN CONFIDENCE All intellectual property rights, including copyright, in designs developed and documents created by APPLIED ECOLOGY Pty
Limited remain the property of that company. Any use made of any such design or document without the prior written
approval APPLIED ECOLOGY Pty Limited will constitute an infringement of the rights of that company which reserves all
legal rights and remedies in respect of any such infringement.
The information, including the intellectual property, contained in this document is confidential and proprietary to APPLIED
ECOLOGY Pty Limited. It may only be used by the person to whom it is provided for the stated purpose for which it is
provided, and must not be imparted to any third person without the prior written approval of APPLIED ECOLOGY Pty
Limited. APPLIED ECOLOGY Pty Limited reserves all legal rights and remedies in relation to any infringement of its rights in
respect of its confidential information.
DISCLAIMER
This report is prepared by APPLIED ECOLOGY Pty Limited for its clients' purposes only. The contents of this report are
provided expressly for the named client for its own use. No responsibility is accepted for the use of or reliance upon this
report in whole or in part by any third party. This report is prepared with information supplied by the client and possibly
other stakeholders. While care is taken to ensure the veracity of information sources, no responsibility is accepted for
information that is withheld, incorrect or that is inaccurate. This report has been compiled at the level of detail specified in
the report and no responsibility is accepted for interpretations made at more detailed levels than so indicated.
ACKNOWLEDGMENTS APPLIED ECOLOGY Pty Limited wishes to thank all representing organisations who contributed to the production or
commented on the content of this report:
Rob Stevenson City of Canada Bay
Sarah Clift, James Smallhorn & Pino Todarello Parramatta City Council, Jeremy Gray and Brendon Andrei Blacktown City
Council, Nicola Booth City of Ryde, Adam Ward Ashfield Council, Jacqui Vollmer Hunters Hill Council, Kerry Davies City of
Auburn, Alex Mackenzie Strathfield Council & BirdLife Australia
iii
Contents DOCUMENT VERIFICATION ................................................................................................ ii
DISCLAIMER ....................................................................................................................... ii
ACKNOWLEDGMENTS ........................................................................................................ ii
PART ONE:
PARRAMATTA RIVER CATCHMENT FAUNA DATABASE
INTRODUCTION ............................................................................................................... 13
Project context ................................................................................................................................ 13
Project background ......................................................................................................................... 13
The study area ................................................................................................................................ 14
Natural resources ........................................................................................................................ 15
Current impacts .......................................................................................................................... 15
Aboriginal cultural heritage ........................................................................................................ 16
European history ......................................................................................................................... 16
METHODOLOGY ............................................................................................................... 17
Literature Review ............................................................................................................................ 17
Desktop Mapping Assessment ........................................................................................................ 17
Supplementary Survey .................................................................................................................... 18
Reporting ........................................................................................................................................ 18
RESULTS ........................................................................................................................... 19
SUPPLEMENTARY SURVEYS ............................................................................................................. 19
THE FAUNA DATABASE ................................................................................................................... 22
DATA CURRENCY ............................................................................................................................. 22
DATA SOURCES ............................................................................................................................... 25
NSW BIRD ATLAS ......................................................................................................................... 25
Birdlife Australia Atlas ................................................................................................................. 25
Bionet.......................................................................................................................................... 25
Miscellanous sources .................................................................................................................. 26
SUMMARY DATA ......................................................................................................................... 26
PRESENTATION OF MAPPED DATA ............................................................................................. 29
UNDERSTANDING THE DATASET ..................................................................................................... 53
MEASURING ECOLOGICAL DIVERSITY ............................................................................................. 53
iv
DATA ANOMALIES ........................................................................................................................... 54
Presence-only data ..................................................................................................................... 54
Uneven survey effort .................................................................................................................. 55
Assumptions about equilibriums ................................................................................................ 55
WHERE IS FAUNA LOCATED? .......................................................................................................... 56
LINKING FAUNA WITH VEGETATION: .............................................................................................. 58
FAUNA AND VEGETATION COMMUNITY STRUCTURE ..................................................................... 58
VEGETATION STRUCTURE AND FAUNA ........................................................................................... 59
FAUNA IN ENDANGERED ECOLOGICAL COMMUNITIES .................................................................. 61
FAUNA OUTSIDE ENDANGERED ECOLOGICAL COMMUNITIES ........................................................ 62
PART TWO: PARRAMATTA RIVER CATCHMENT HABITAT
CORRIDORS
REVIEW OF LITERATURE FOR HABITAT CORRIDORS .......................................................... 65
Introduction .................................................................................................................................... 65
Some important definitions ............................................................................................................ 66
Wildlife corridors ............................................................................................................................ 67
What are Wildlife/Biodiversity Corridors? .................................................................................. 67
Connectivity Conservation .......................................................................................................... 67
PROS AND CONS OF VEGETATION BASED METHODS .................................................................. 68
MODELLING FAUNA SPECIES DISTRIBUTION ................................................................................... 69
LOCAL AREA BIOLINKS MAPPING (MACLAGAN/CEC, 2009) ............................................................ 70
Principles Used to Select Biolinks ................................................................................................ 70
Features Used to Select Biolinks ................................................................................................. 71
Prioritising Biolinks...................................................................................................................... 71
BIOLINKS IN URBAN LANDSCAPES................................................................................................... 71
Backyards for wildlife (Bathurst, Adelaide, and many others) .................................................... 71
Birds in Backyards (http://www.birdsinbackyards.net/about/Birds-Backyards)......................... 72
Urban Wildlife Corridor Projects around Sydney ........................................................................ 73
SELECTION OF CORRIDORS ............................................................................................... 76
REMOTE SENSING ........................................................................................................................... 76
GROUND TRUTHING CORRIDORS .................................................................................................... 77
Natural values ............................................................................................................................. 77
Social aspects .............................................................................................................................. 78

v
Threats to fauna .......................................................................................................................... 79
POTENTIAL FOR CORRIDOR IMPROVEMENT ................................................................................... 79
PRIORITISATION OF CORRIDORS ...................................................................................... 80
CORRIDORS AND THEIR PRIORITIES FOR EACH LGA .......................................................... 86
IMPROVING THE QUALITY OF FAUNA CORRIDORS/BIOLINKS ........................................... 90
WHAT DO FAUNA NEED WHEN IT COMES TO CORRIDORS? ........................................................... 90
GENERAL RECOMMENDATIONS FOR THIS PROJECT ....................................................................... 93
WORKS ACTIVITIES RECOMMENDED .............................................................................................. 94
BENEFITS FOR FAUNA ..................................................................................................................... 96
BIO-LINK TYPICAL TREATMENTS ..................................................................................................... 98
Street scape treatments (Blacktown) .......................................................................................... 98
Creek Treatment (Upper Duck River Rosnay Golf Course) .......................................................... 99
Golf Course water body treatments (Fox Hill) ........................................................................... 100
Park Clump Treatment .............................................................................................................. 101
APPENDIX 1: ASSESSING CONSERVATION VALUES ......................................................... 108
Common Nature Conservation Classification System (Chenoweth et al, 2000) ........................ 108
Biodiversity Assessment and Mapping Methodology (Qld EPA, 2002) ..................................... 108
BioCondition Assessment (Eyre et al, 2006) .............................................................................. 113
MaxEnt ...................................................................................................................................... 114
APPENDIX 2: OVERVIEW OF CORRIDORS IN THE CATCHMENT ........................................ 116
PREFERRED CORRIDORS FOR ASHFIELD LGA ................................................................................. 116
Ashfield 1a ................................................................................................................................ 116
Ashfield 1b ................................................................................................................................ 116
Ashfield 1c................................................................................................................................. 116
ASHFIELD CORRIDOR 1: EXISTING CONDITION.............................................................................. 117
KEY MAP.................................................................................................................................... 118
ASHFIELD 1A CORRIDOR IMPROVEMENT WORKS ..................................................................... 119
ASHFIELD 1B CORRIDOR IMPROVEMENT WORKS ..................................................................... 120
ASHFIELD 1C CORRIDOR IMPROVEMENT WORKS ..................................................................... 121
ASHFIELD CORRIDORS 2: EXISTING CONDITION ............................................................................ 123
KEY MAP.................................................................................................................................... 124
PREFERRED CORRIDOR ................................................................................................................. 125
Ashfield 2a ................................................................................................................................ 125
Ashfield 2b ................................................................................................................................ 125
vi
Ashfield 2c................................................................................................................................. 126
ASHFIELD 2A CORRIDOR IMPROVEMENT WORKS ..................................................................... 127
ASHFIELD 2A CORRIDOR IMPROVEMENT WORKS ..................................................................... 128
STRATHFIELD CORRIDORS .............................................................................................. 129
STRATHFIELD 1 CURRENT CORRIDOR CONDITION ........................................................................ 129
KEY MAP.................................................................................................................................... 130
PREFERRED CORRIDOR ................................................................................................................. 130
Strathfield 1a ............................................................................................................................ 130
Strathfield 1b ............................................................................................................................ 131
Strathfield 1c ............................................................................................................................. 132
Strathfield 1d ............................................................................................................................ 133
STRATHFIELD 1A CORRIDOR IMPROVEMENT WORKS ............................................................... 135
STRATHFIELD 1B CORRIDOR IMPROVEMENT WORKS ............................................................... 136
STRATHFIELD 1B CORRIDOR IMPROVEMENT WORKS – ALTERNATE ROUTE ............................. 137
STRATHFIELD 1C CORRIDOR IMPROVEMENT WORKS ............................................................... 138
STRATHFIELD 1D CORRIDOR IMPROVEMENT WORKS ............................................................... 139
AUBURN CORRIDORS ..................................................................................................... 140
AUBURN 1 CURRENT CONDITION ................................................................................................. 140
KEY MAP.................................................................................................................................... 141
PREFERRED CORRIDOR ................................................................................................................. 142
Auburn 1 ................................................................................................................................... 142
AUBURN 1 CORRIDOR IMPROVEMENT WORKS ........................................................................ 143
AUBURN 2 CURRENT CONDITION ................................................................................................. 144
KEY MAP.................................................................................................................................... 145
PREFERRED CORRIDOR ................................................................................................................. 145
Auburn 2 ................................................................................................................................... 145
AUBURN 2 CORRIDOR IMPROVEMENT WORKS ........................................................................ 146
HUNTERS HILL CORRIDORS ............................................................................................ 147
KEY MAP.................................................................................................................................... 147
AREA 1: PULPIT POINT RESERVE TO CLARKES POINT RESERVE ..................................................... 148
AREA 2: BEDLAM BAY TO TARBAN CREEK RIPARIAN CORRIDOR ................................................... 150
CITY OF RYDE CORRIDORS .............................................................................................. 152
KEY MAP.................................................................................................................................... 152
CORRIDOR 1: BRUSH PARK TO FORESHORE .................................................................................. 153
vii
A: BRUSH PARK TO VICTORIA ROAD.......................................................................................... 153
B: VICTORIA ROAD TO MEMORIAL PARK .................................................................................. 154
CORRIDOR 2: FORESHORE TO TYAGARAH PARK ........................................................................... 155
CORRIDOR 3: LOOKING GLASS BAY TO GLADES BAY ..................................................................... 156
BLACKTOWN CORRIDORS .............................................................................................. 157
KEY MAP.................................................................................................................................... 157
CORRIDOR 1: REFALO RESERVE TO JOSEPH BANKS PARK ............................................................. 158
REFALO RESERVE & TROUBADOR PARK TO TWIN GUMS RESERVE ........................................... 158
Key outcomes: .......................................................................................................................... 158
General comments:................................................................................................................... 158
CORRIDOR 2: TOONGABBIE TO MCCOYS PARK & MCCOYS TO STATION ROAD ............................ 159
Key outcomes ........................................................................................................................... 159
General comments .................................................................................................................... 160
CORRIDOR 3: ASHLEY BROWN RESERVE TO PEACE PARK & STATION ROAD TO SEVEN HILLS (PEACE
PARK) ............................................................................................................................................ 162
Key outcomes: .......................................................................................................................... 162
General comments:................................................................................................................... 162
CORRIDOR 4: PEACE PARK TO TIMBERTOP RESERVE .................................................................... 164
Key outcomes: .......................................................................................................................... 164
General comments:................................................................................................................... 165
CORRIDOR 5: BEST RD RESERVE TO GRANTHAM RESERVE & RAILWAY AVE RESERVE TO
GRANTHAM RESERVE.................................................................................................................... 167
Key outcomes ........................................................................................................................... 167
General comments .................................................................................................................... 167
CORRIDOR 6: (GRANTHAM RESERVE) AMAZON PARK TO PROSPECT PARK TO GREAT WESTERN
HIGHWAY & TIMBERTOP. ............................................................................................................. 170
Key outcomes ........................................................................................................................... 170
General comments .................................................................................................................... 170
CITY OF CANADA BAY COUNCIL ...................................................................................... 173
KEY MAP.................................................................................................................................... 173
CORRIDOR 1: IRONCOVE TO HEN AND CHICKEN BAY ................................................................... 174
A: PARRAMATTA RD TO RODD POINT/ NEILD PARK VIA FIVE DOCK PARK ................................ 174
B: FIVE DOCK BAY TO NIELD PARK............................................................................................. 175
C: CORRIDOR1 EXTENSION: TAPLIN PARK AND THE ESPLANADE .............................................. 176
D: HEN AND CHICKEN TO ABBOTSFORD BAY ............................................................................ 177

viii
CORRIDOR 2: KINGS BAY TO POWELLS CREEK .............................................................................. 178
A: KINGS BAY TO CANADA BAY ................................................................................................. 178
B: EXILE BAY & MASSEY PARK GOLF COURSE ............................................................................ 179
C: KINGS BAY TO QUEEN ELIZABETH PARK ................................................................................ 180
D: MAJORS BAY TO MASSEY PARK GOLF COURSE ..................................................................... 181
E: MAJORS BAY TO BICENNTENNIAL PARK ................................................................................ 182
E: RHODES PARK TO PORTERS CREEK ........................................................................................ 183
PARRAMATTA CORRIDORS ............................................................................................ 184
CORRIDOR 1: TOONGABBIE CREEK –QUARRY BRANCH ................................................................ 185
McCoy Park to Bundilla forest and Model Farms Reserve – Toongabbie Creek – Quarry Branch
.................................................................................................................................................. 185
CORRIDOR 2: TOONGABBIE CREEK TO PARRAMATTA RIVER ........................................................ 186
Robin Hood Park to Lake Parramatta Reserve And Parramatta Park ........................................ 186
CORRIDOR 3: THE PONDS CREEK TO VINEYARD CREEK – LINKS TO BRUSH PARK (CITY OF RYDE). 187
Galaringi and Eric Mobbs Memorial Park, Vineyard Creek Reserve to Ponds/Subiaco Creek
Reserve ..................................................................................................................................... 187
CORRIDOR 4: THE PARRAMATTA RIVER ........................................................................................ 188
Parramatta River Foreshore, George Kendall Riverside Park, Eric Primrose Reserve ................ 188
CORRIDOR 5: DUCK RIVER ............................................................................................................. 189
CORRIDOR 6: UPPER DUCK RIVER ................................................................................................. 190
Woodville Golf Course, Campbell Hill Pioneer Reserve, Norford Park, Everley Park, Duck River
Bushland Reserve ...................................................................................................................... 190
APPENDIX 3: VEGETATION MANAGEMENT .................................................................... 192
LOCAL PROVENANCE AND SPECIES FOR REVEGETATION ................................................ 192
WHEN TO REVEGETATE ................................................................................................................. 192
SPECIES SELECTION AND SEED COLLECTION ................................................................................. 192
REVEGETATION TECHNIQUES ....................................................................................................... 194
FLORABANK GUIDELINES .............................................................................................................. 197
PLANT SPECIES LISTS FOR REVEGETATION .................................................................................... 197
VEGETATION COMMUNITIES IN PARRAMATTA RIVER CATCHMENT ............................... 198
SUPPLEMENTARY PLANTING FOR HABITAT EXTENSION ................................................. 200
Sydney Turpentine Ironbark Forest (EEC) ..................................................................................... 201
Blue Gum High Forest (EEC) .......................................................................................................... 203
Cumberland Shale Plains Woodland (Cumberland Plain Woodland EEC) ..................................... 205
ix
Cumberland Shale Hills Woodland (Cumberland Plain Woodland) ............................................... 207
Cumberland Riverflat Forest (River Flat Eucalypt Forest EEC) ....................................................... 208
Cumberland Swamp Oak Riparian Forest (Cumberland Riverflat Forest EEC) ............................... 210
Coastal Freshwater Reedland EEC................................................................................................. 212
Castlereagh Ironbark Forest (Cooks River/Castlereagh Ironbark Forest EEC) ............................... 214
Estuarine Saltmarsh (Coastal Saltmarsh EEC)................................................................................ 217
Estuarine Swamp Oak Forest (Swamp oak floodplain forest EEC) ................................................ 218
Sydney Coastal Sandstone Enriched Moist Forest ........................................................................ 219
Coastal Enriched Sandstone Dry Forest ........................................................................................ 221
Coastal Sandstone Gully Forest ..................................................................................................... 223
Coastal Sandstone Gallery Rainforest ........................................................................................... 227
Hornsby Enriched Sandstone Exposed Woodland ........................................................................ 228
Coastal Shale-Sandstone Forest .................................................................................................... 230
Coastal Sandstone Foreshores Forest ........................................................................................... 233
Sydney Foreshores Shale Forest ................................................................................................... 235
Coastal Warm Temperate Rainforest ............................................................................................ 236
Coastal Headland Banksia Heath .................................................................................................. 238
BEST PRACTICE FOR BUSH REGENERATION IN CUMBERLAND PLAIN WOODLANDS ........ 240
STANDARD WEED CONTROL TECHNIQUES ..................................................................... 242
Cut and Paint Method ................................................................................................................... 242
Stem Injection: Drilling and Frilling ............................................................................................... 242
Scrape and Paint Method ............................................................................................................. 242
Manual Removal ........................................................................................................................... 243
Herbicide Spraying ........................................................................................................................ 243
Developing a Weed Management Strategy .................................................................................. 243
STANDARD PLANTING NOTES ........................................................................................ 244
Site Preparation ............................................................................................................................ 244
Weed Eradication ...................................................................................................................... 244
Top Soil Preparation.................................................................................................................. 245
Jute Matting Installation ........................................................................................................... 245
Guidelines for Plant Installation .................................................................................................... 245
Establishment phase maintenance ............................................................................................... 246
Monitoring plant growth and replanting .................................................................................. 246
Weed control ............................................................................................................................ 246

x
Protection from predation ........................................................................................................ 247
Plant replacement......................................................................................................................... 247
When to replant ........................................................................................................................ 247
Replanting techniques .............................................................................................................. 247
APPENDIX 4: MANAGEMENT ACTIONS FOR FAUNA– FURTHER INFORMATION .............. 248
Manage streambanks as potential habitat for water rats ............................................................. 248
Improve small bird habitat by planting a range of shrub species .................................................. 250
Improve wetlands habitat by planting a mix of reeds, sedges, and wetland shrubs ..................... 251
Plant roosting trees for nocturnal carnivorous birds (including owls and frogmouths) ................ 252
Include plant species that provide food resources for the Grey-headed Flying Fox ..................... 253
Manage streambanks as potential habitat for Spotted Pardalotes and terrestrial migratory birds
that use burrows in earth banks ................................................................................................... 255
Increase availability of feeding and roosting habitat resources for microbats ............................. 256
Feral bees and their control .......................................................................................................... 261
The origin of feral bees ............................................................................................................. 261
The feral bee problem in NSW .................................................................................................. 261
Feral bee control ....................................................................................................................... 262
Research on the efficacy of methods for feral bee control ....................................................... 262
Bell Miner Associated Dieback and some control techniques....................................................... 263
What is Bell Miner Associated Dieback ..................................................................................... 263
Bell miner habitat preferences ................................................................................................. 263
Bell miner effects on forests ..................................................................................................... 264
Bell Miner control methods ...................................................................................................... 264
CONSTRUCTED HABITAT ELEMENTS FOR RESERVES ....................................................... 265
Natural nest hollows ..................................................................................................................... 265
Native species that use nest boxes ............................................................................................... 265
Bats ........................................................................................................................................... 265
Parrots ...................................................................................................................................... 266
Ducks ........................................................................................................................................ 266
Possums: large and small .......................................................................................................... 266
Sugar gliders.............................................................................................................................. 266
Other bird species ..................................................................................................................... 266
Looking after your nest box .......................................................................................................... 267
Feral species.............................................................................................................................. 267

xi
APPENDIX 5 DETAILED SITE RECORDS ............................................................................ 268
APPENDIX 6 SPECIES LISTS BY LGA ................................................................................. 269
REFERENCES................................................................................................................... 305

12
PART ONE:
PARRAMATTA RIVER CATCHMENT
FAUNA DATABASE

13
INTRODUCTION
Project context The Parramatta River Catchment Group (PRCG) is a regional organisation of local councils, state agencies
and community representatives whose aim is to work together to improve the health of the Parramatta
River catchment. A steering committee is overseeing this project and includes representatives from
Ashfield, Auburn, Blacktown, Canada Bay, Hunters Hill, Ryde, Parramatta and Strathfield Councils,
Sydney Olympic Park Authority, and BirdLife Australia.
The current study underpins the Native habitat recovery in the Parramatta River catchment project,
which aims to expand, restore and manage the extent of native habitats in the fragmented landscapes
of the Parramatta River catchment. This collaborative project has been funded through a NSW
Environmental Trust grant, and involves a series of distinct stages:
The first phase will involve a study of recent fauna records to determine species richness and
distribution across the catchment and within extant vegetation communities and the parks and
reserves system (the current study).
Using this knowledge, high priority sites and potential corridors will be identified in the second
phase, and targeted for on-ground restoration and expansion, linking these communities across
the landscape (identified in this study).
The third phase will deliver targeted biodiversity awareness training to council outdoor staff
whose work may impact on terrestrial and aquatic biodiversity.
Project background Strategically approaching biodiversity, particularly native habitat restoration, at a landscape level is not
consistently being undertaken in the Parramatta River catchment leaving many sites as isolated islands
within the urban environment. These sites become increasingly vulnerable to impacts such as weed and
feral animal infestation, genetic seclusion due to reproductive restrictions, the effects of climate change,
and local extinction (http://www.parramattariver.org.au). In addition, the Parramatta River catchment
has one of the highest rates of human population growth in Australia. With the ongoing pressures of
urban consolidation, these vitally important areas of native habitat require a strategic, catchment-wide
management approach to ensure their ongoing survival. Identifying and establishing key linkages
between these remnant sites provides a critical stepping stone for dispersing fauna moving between
core areas of habitat such as the numerous national parks and nature reserves both north and south of
the catchment.
When addressing habitat restoration, much of the focus is placed on vegetation. However, vegetation
communities co-exist with the fauna that inhabit and symbiotically sustain them. There is an increasing
number of studies within the scientific literature to suggest that approaching restoration from the
perspective of fauna diversity and abundance is equally important and a potentially more responsive
and strategic method of managing biodiversity.
14
The project will approach habitat restoration on a landscape scale through the development of a
catchment-wide fauna species richness study. The study will provide a sound scientific foundation on
which to identify and prioritise sites of high biodiversity value. The project will also incorporate the
latest vegetation mapping to assist in determining key corridors and linkages between priority sites.
The project will provide a strategic view of where to invest future resources for biodiversity preservation
and enhancement across the catchment and will ultimately benefit all residents and visitors to the
Parramatta River catchment, by improving the health and vitality of the local environment in which they
live and work
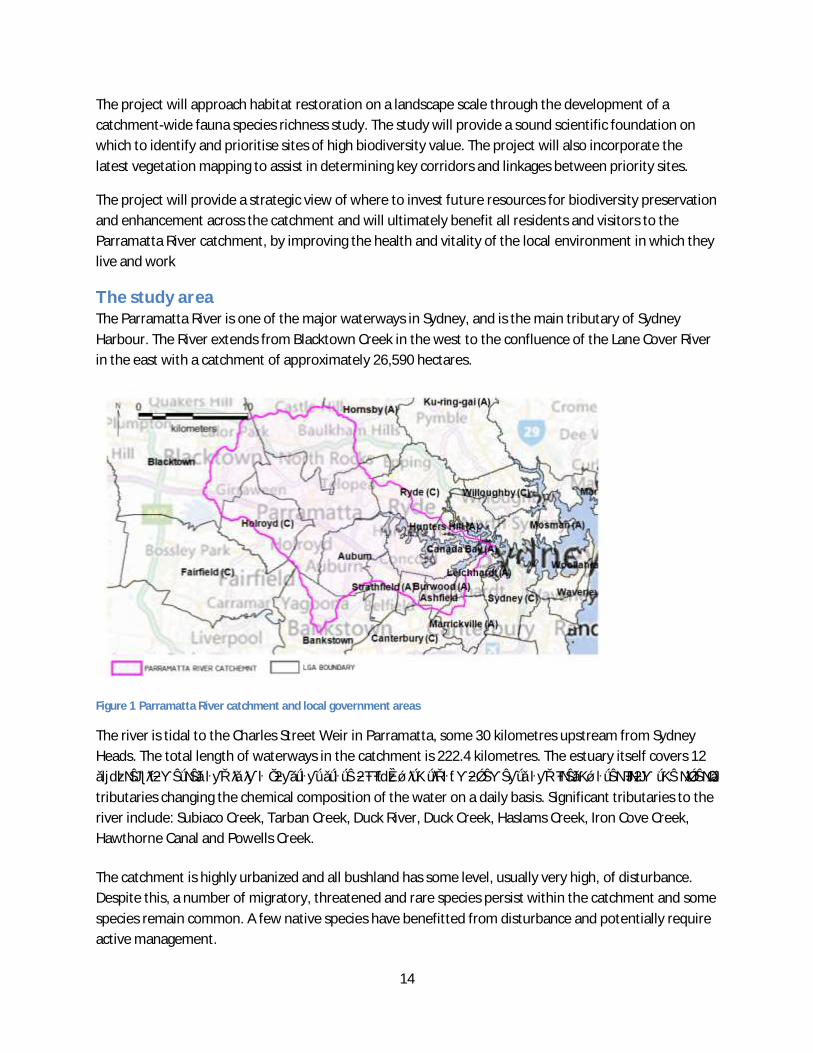
The study area The Parramatta River is one of the major waterways in Sydney, and is the main tributary of Sydney
Harbour. The River extends from Blacktown Creek in the west to the confluence of the Lane Cover River
in the east with a catchment of approximately 26,590 hectares.
Figure 1 Parramatta River catchment and local government areas
The river is tidal to the Charles Street Weir in Parramatta, some 30 kilometres upstream from Sydney
Heads. The total length of waterways in the catchment is 222.4 kilometres. The estuary itself covers 12
square kilometres and is in a constant state of flux with tidal movements and freshwater from the river’s
tributaries changing the chemical composition of the water on a daily basis. Significant tributaries to the
river include: Subiaco Creek, Tarban Creek, Duck River, Duck Creek, Haslams Creek, Iron Cove Creek,
Hawthorne Canal and Powells Creek.
The catchment is highly urbanized and all bushland has some level, usually very high, of disturbance.
Despite this, a number of migratory, threatened and rare species persist within the catchment and some
species remain common. A few native species have benefitted from disturbance and potentially require
active management.

15
Natural resources
The Parramatta River catchment is a unique area with a high biodiversity value. The catchment’s natural
resources include bushland, rivers & creeks, wetlands, estuaries and cultural heritage. A total of 85
threatened species are found in the Cumberland sub-region, of which the Parramatta River catchment
lies within, including:
12 Ecologically Endangered Communities
32 fauna species
31 flora species
Major wetlands include Bicentennial Park Wetlands (nationally significant, JAMBA CAMBA) and
Newington Wetlands (nationally significant, JAMBA CAMBA). There is also a wide diversity of aquatic
species as well as regionally significant plants and animals throughout the catchment.
Research into historical drawings and writings indicates that the significant stands of mangroves that
now exist along the River were far fewer at the time of English colonisation. The foreshores of the River
were often sandy beaches and outcrops of rock, with extensive tidal flats around Homebush Bay.
Excessive siltation of the river has enabled mangroves to thrive, often at the expense of more fragile
vegetation communities such as salt marsh.
Current impacts
The Parramatta River catchment is one of the most highly urbanised catchments in Australia, which
means that there are many different issues that are impacting upon the health of the catchment. One of
the main causes of poor river health is stormwater pollution. Weeds, introduced animals and erosion
also significantly contribute to an unhealthy catchment.
Stormwater
When it rains, excess water is carried through the stormwater pipe network, passing directly from
roadside drains to creeks and rivers. Anything that gets washed down the drains, such as oil, litter and
pesticides, ends up in the waterways. Weeds, soils and mulch are also easily mobilized during heavy
rain. In high rainfall events, large volumes of water enters rivers and creeks, transporting sediment,
litter, nutrients, toxic chemicals, herbicides, pesticides, oils and grease, animal waste and sewage. The
combined effect of this runoff over time is the degradation and pollution of local waterways as well as
siltation and sediment contamination in the Parramatta River estuary.
Weeds
Weeds have a significant impact on native flora and fauna, as well as the health of waterways. They
smother and out-complete native plants, modify or destroy the habitat of native animals, contribute to
the reduction of water quality, and choke waterways, leading to localised flooding. Most weeds in urban
bushland have escaped from urban backyards. Their seeds and cuttings are carried by the wind or
animals, or even swept away with the stormwater when it rains. Prunings, cuttings and grass clippings
are also dumped in the bushland, allowing weeds to quickly invade and spread.

16
Introduced animals
The Parramatta River Catchment is threatened by many introduced animals. Cats and foxes are very
successful urban predators preying on birds, small mammals and reptiles. Rabbits and some birds also
impact on the catchment to varying degrees including damaging vegetation, causing erosion and
competing with native animals for resources.
Erosion and sedimentation
When the ground is left bare by human activities, including clearing and building (and related activities),
soil is easily washed away when it rains. This erosion removes the fertile topsoil and the soil that is
washed into waterways can contain plant nutrients, minerals, organic matter and seeds. It can also
contain pesticides and toxic heavy metals. When soil, sand, dust, cement, paint and building debris
reach the waterways, they can:
increase the risk of flooding
block drains
spread weeds to bushland
result in algal blooms
cause health problems for swimmers
smother and suffocate water plants and animals and impact on their ability to reproduce
Aboriginal cultural heritage
The Parramatta River is an iconic part of Sydney’s European and Aboriginal history. Prior to white
settlement, the majority of the catchment was inhabited by the Dharug nation. Like all Aboriginal
people, the Darug people did not own the land but belonged to the land. They had a strong connection
to the land; respected it and referred to the land as their mother.
Recent excavations in Parramatta have revealed evidence of Aboriginal inhabitation going back 30,000
years. Today, much of the remaining natural bushland in the catchment contains items and places of
cultural significance, such as: middens, engravings, scare trees, grinding grooves and shelters.
European history
Parramatta is Australia’s second oldest settlement, established on 2 November 1788. The surrounding
area was used to farm crops for the new colony as the poor soils around Port Jackson would not support
stable food crops.
By the late 1850′s Parramatta was the main metropolis of NSW placing considerable pressure on the
natural environment. The River foreshore also became the site for heavy industry, resulting in extensive
soil contamination which still has a major impact on the estuary today.

17
METHODOLOGY To address the requirements of the study, the project was broken into a number of sections. The
following project tasks were involved:
a) A review of literature relating to the development of urban biodiversity corridors
b) The collation of existing data (including each Council’s fauna studies, HNCMA’s Rapid Fauna
Habitat Assessment, HNCMA’s Draft Native Vegetation of the SMCMA Area report, Sydney
Olympic Park Authority’s fauna studies, BirdLife Australia’s bird data, OEH’s Linking Landscapes
Through Local Action project and the Atlas of NSW Wildlife)
c) Supplementary surveys for areas with poor or no data available
d) Ranking fauna habitat sites based on their fauna species richness
e) Identifying key existing and potential vegetation corridors linking high priority sites across the
landscape
f) The development of a concise report, detailing the methodology used, high value sites, potential
and existing biodiversity corridors, and recommendations for future works including
recommendations of appropriate revegetation species to accommodate identified and potential
fauna usage
Literature Review A thorough review of all available literature including Council and other Agency (e.g. SMCMA,
DECCW/OEH, DII etc) documentation, policy, plans, studies, available mapping and aerial photographs
was carried out. This stage comprised the identification, assembly and assessment of the existing data to
identify gaps in the existing knowledge base. This stage guided the approach to further studies and gap
analysis. Review of available literature included:
State of the Environment reporting (SOE)
NSW Atlas data
DECCW/OEH community wildlife surveys
Native animal rescue groups eg WIRES records
Birdlife Australia data
NSW Bird Atlas records
Bush regeneration reports (from contractors) and Council reports
Flora and fauna studies
HNCMA’s Rapid Fauna Habitat Assessment
Desktop Mapping Assessment Consistent and accurate mapping of fauna habitats is an essential tool for planning and management
purposes. Councils need reliable data and accurate maps to make balanced and defensible decisions in
relation to initiating on-ground remediation projects, and to undertake day to day operations in areas of
high conservation assets. Data collation, mapping review and presentation was carried out using Map
Info Professional V12.5 with data geo-referenced to GDA94 MGA Zone 56 projection.
18
Applied Ecology completed a comprehensive review of data available including an analysis of the quality
and usefulness of this data in assessing the species richness and relative abundance of fauna in relation
to habitat assets across the catchment. Methods of collection, operators, metadata etc were detailed
for each resource. Unreliable data was excluded from the study. Once the data was collected and
collated into a uniform format a variety of approaches to mapping the “results” were developed,
including simple species richness by habitat area/reserve. Other approaches include mapping evenness
(a measure of the relative abundance of the different species making up the richness of an area) or using
diversity indices such as Simpson's Index of Diversity. All approaches, because of uneven sampling effort
and varying methodologies, were used to provide an indicative assessment of species richness/diversity
across the catchment only. Species richness mapping was overlaid on multiple layers of information
including existing vegetation, the reserve system and public lands to better understand which species
are poorly conserved by the reserve system (if any), potential biolinks and to clearly delineate between
assets on private lands and public lands.
Supplementary Survey The literature review and preliminary mapping identified gaps in fauna data which needed to be
targeted in this project. Applied Ecology allowed 16 hours to undertake “gap snapshot surveys” that
included an assessment of site habitat values, targeted bird surveys and opportunistic sightings of other
fauna.
Reporting The project report aims to identify options available to member Councils regarding appropriate
enhancement of habitat resources for fauna. The key objectives of the final report are:
1. To aid the survival and enhance the adaptive capacity of species, populations and ecological
communities of animals endemic to the Parramatta River Catchment and core habitat areas;
2. Identify high conservation value habitats and wildlife linkages that could form bio-links
(including ecosystems, habitats and species they contain) that require protection, ecological
restoration and/or threat abatement;
3. Encourage and promote the importance of biodiversity protection and restoration and develop
a greater understanding of fauna issues, values and solutions throughout the Catchment.

19
RESULTS
SUPPLEMENTARY SURVEYS
The project brief allowed for 16 hours of supplementary surveys to be undertaken in areas with
identified data gaps. The distribution of records across Council reserves was examined with reserve and
reserve complexes containing some remnant native vegetation and few or no records prioritised for
surveys. The following reserves were surveyed in the Blacktown City LGA: Timbertop Reserve, Mitchell
Reserve, Mujar Bija Reserve, William
Lawson Park, Leabon Walkway, Eddie Aaw
Reserve and various unnamed Reserves.
These reserves form a semi-contiguous
area of open space, artificial wetlands and
remnant bushland in the Blacktown LGA
totalling over 60 hectares in size.
Surprisingly there are no existing records
in these reserves in public databases.
Figure 2 Supplementary survey Blacktown Figure 3 Cumberland Plain Woodland EEC at Timbertop Reserve.
Surveys at this location were undertaken on the 26th of March & the 28th of April 2014 with two
observers for a period of 6 hours (12 person hours in total). 41 species were observed and added to the
project database (seeTable 1).

20
A further 60 hectares were surveyed in the
following reserves and public
lands in the Auburn City LGA: Webbs Ave Playing
Fields, Progress Park, Peter Hislop Park, Upper Duck River Reserve, Auburn Botanical Gardens, Rosnay
Golf Course and Princes Park. Again there were no records in many of these reserves despite adjoining
good bush in the upper Duck River Reserve in the Parramatta LGA. Surveys were undertaken on the 28th
of March 2014 for a period of 4 hours (8 person hours in total). 30 species were observed and added to
the project database (see Table 1). Reserve boundaries were not clear so some species were recorded in
adjacent reserves.
Figure 4 (right above) this Spangled Drongo was observed hawking on the edge of Princes Park
Figure 5(right below) This Australasian Grebe was observed on a dam on Rosnay Golf Course
Figure 6 (left) Supplementary survey Auburn

21
Figure 7 Duck River riparian corridor behind Progress Park was occupied by numerous Australian White Ibis.
Table 1 Species list supplementary surveys
RESERVE
Au
bu
rn
Co
mm
un
ity
Pic
nic
Are
a &
Bo
tan
ic
Gar
den
s A
CC
A
ub
urn
Go
lf
Co
urs
e A
CC
Mit
chel
l R
eser
ve,
Pro
spec
t B
CC
Mu
jar
Bija
Res
erve
BC
C
Ora
na
Par
k P
rosp
ect
BC
C
Pri
nce
s P
ark
AC
C
Tim
ber
top
R
eser
ve B
CC
Will
iam
law
son
R
eser
ve,
Pro
spec
t B
CC
Tota
l
SPECIES COUNTS
Australasian Grebe 1 1
Australian Magpie 1 2 1 2 2 4 12
Australian Raven 1 2 1 8 12
Australian White Ibis 8 3 5 8 7 31
Australian Wood Duck 10 2 7 12 31
Brown-striped Frog 7 7
Common Eastern Froglet 10 10
Common Myna 3 7 2 3 15
Common Starling 16 16
Crested Pigeon 8 1 2 8 19
Dusky Moorhen 4 2 3 9
Eastern Spinebill 2 2
Eastern Water Dragon 1 1
Eurasian Coot 5 5 10
Golden Whistler 1 1 2
Great Egret 1 1 2
Grey Butcherbird 2 2
Grey Fantail 1 1
Grey Teal 6 4 13 23
Hardhead 3 2 8 13
Hoary-headed Grebe 2 2
House Sparrow 7 7
Intermediate Egret 1 1
Little Pied Cormorant 1 2 3
Magpie-lark 2 1 1 2 2 8
Mallard 2 2

22
RESERVE
Au
bu
rn
Co
mm
un
ity
Pic
nic
Are
a &
Bo
tan
ic
Gar
den
s A
CC
A
ub
urn
Go
lf
Co
urs
e A
CC
Mit
chel
l R
eser
ve,
Pro
spec
t B
CC
Mu
jar
Bija
Res
erve
BC
C
Ora
na
Par
k P
rosp
ect
BC
C
Pri
nce
s P
ark
AC
C
Tim
ber
top
R
eser
ve B
CC
Will
iam
law
son
R
eser
ve,
Pro
spec
t B
CC
Tota
l
SPECIES COUNTS
Masked Lapwing 2 2 3 2 9
New Holland Honeyeater 3 3
Noisy Miner 13 7 12 2 6 5 2 12 59
Pacific Black Duck 6 6 12
Pied Currawong 2 2 1 5
Purple Swamphen 3 2 5
Rainbow Lorikeet 12 2 4 18
Red Wattlebird 2 2
Red-browed Finch 3 3
Red-whiskered Bulbul 3 3 6
Royal Spoonbill 1 1
Rufous Fantail 1 1
Spangled Drongo 1 1
Spotted Turtle-Dove 2 2 2 2 8
Superb Fairy-wren 8 6 14
Welcome Swallow 3 4 4 4 15
White-faced Heron 1 1
White-plumed Honeyeater 2 2
Willie Wagtail 1 2 1 1 5
Total 67 68 44 8 38 52 31 104 412
THE FAUNA DATABASE
DATA CURRENCY Data was compiled from records from 1st of January 2000 to January-February 2014. Miscellaneous
records were added between February 2014 and July 2014. This approach allowed for the use of records
with reasonable currency and reflects a time period where the key source information from semi-
professional and amateur groups was systematically collected. To ensure that there was not a significant
change in species composition between the earlier records and the present day the database was split
roughly in half and species gained (Table 2) and lost (Table 3) were assessed.
Table 2 Species recorded 2007-2014 not recorded 2000-2006
SPECIES “GAINED” SINCE 2007
Acritoscincus platynota Red-throated Skink
Aegotheles cristatus Australian Owlet-Nightjar
Alectura lathami Australian Brush-turkey
Artamus personatus Masked Woodswallow
Burhinus grallarius Bush Stone-curlew
Cacomantis variolosus Brush Cuckoo
Charadrius bicinctus Double-banded Plover
Chthonicola sagittata Speckled Warbler
Cincloramphus mathewsi Rufous Songlark
Circus assimilis Spotted Harrier
Cladorhynchus leucocephalus
Banded Stilt
Climacteris picumnus Brown Treecreeper

23
Corvus mellori Little Raven
Corvus orru Torresian Crow
Coturnix pectoralis Stubble Quail
Crocothemis nigrifrons Black-headed Skimmer
Demansia psammophis Yellow-faced Whip Snake
Egretta sacra Eastern Reef Egret
Entomyzon cyanotis Blue-faced Honeyeater
Eulamprus heatwolei Yellow-bellied Water-skink
Euploea core Common Crow
Excalfactoria chinensis King Quail
Falco subniger Black Falcon
Falsistrellus tasmaniensis Eastern False Pipistrelle
Geopelia cuneata Diamond Dove
Glyciphila melanops Tawny-crowned Honeyeater
Haematopus longirostris Australian Pied Oystercatcher
Litoria phyllochroa Leaf-green Tree Frog
Litoria tyleri Tyler's Tree Frog
Lophochroa leadbeateri Major Mitchell's Cockatoo
Melithreptus brevirostris Brown-headed Honeyeater
Meridolum corneovirens Cumberland Plain Land Snail
Milvus migrans Black Kite
Motacilla tschutschensis Eastern Yellow Wagtail
Neochmia modesta Plum-headed Finch
Ninox connivens Barking Owl
Nyctophilus gouldi Gould's Long-eared Bat
Oxyura australis Blue-billed Duck
Pandion cristatus Eastern Osprey
Petroica goodenovii Red-capped Robin
Phaps chalcoptera Common Bronzewing
Phaps elegans Brush Bronzewing
Pluvialis fulva Pacific Golden Plover
Pseudonaja textilis Eastern Brown Snake
Pseudophryne australis Red-crowned Toadlet
Pseudophryne bibronii Bibron's Toadlet
Ramphotyphlops nigrescens
Blackish Blind Snake
Rattus fuscipes Bush Rat
Rostratula australis Australian Painted Snipe
Sericornis magnirostra Large-billed Scrubwren
Sericulus chrysocephalus Regent Bowerbird
Stipiturus malachurus Southern Emu-wren
Strepera versicolor Grey Currawong
Tachyglossus aculeatus Short-beaked Echidna
Tringa glareola Wood Sandpiper
Turnix varius Painted Button-quail
Vanellus tricolor Banded Lapwing
Vespadelus regulus Southern Forest Bat
Wallabia bicolor Swamp Wallaby
Xenus cinereus Terek Sandpiper
Table 3 Species recorded 2000-2006 not recorded 2007-20014
SPECIES “LOST” SINCE 2007
Botaurus poiciloptilus Australasian Bittern
Cacomantis pallidus Pallid Cuckoo
Calyptorhynchus lathami Glossy Black-Cockatoo
Chalinolobus dwyeri Large-eared Pied Bat
Cheramoeca leucosterna White-backed Swallow
Cincloramphus cruralis Brown Songlark
Cinclosoma punctatum Spotted Quail-thrush
Dendrocygna arcuata Wandering Whistling-Duck
Dendrocygna eytoni Plumed Whistling-Duck
Gelochelidon nilotica Gull-billed Tern
Geopelia striata Peaceful Dove
Irediparra gallinacea Comb-crested Jacana
Ixobrychus dubius Australian Little Bittern
Lichenostomus leucotis White-eared Honeyeater
Merops ornatus Rainbow Bee-eater
Ornithorhynchus anatinus
Platypus
Petroica phoenicea Flame Robin
Platalea flavipes Yellow-billed Spoonbill
Polytelis alexandrae Princess Parrot
Sericornis citreogularis Yellow-throated Scrubwren
Stictonetta naevosa Freckled Duck

24
The increase in species diversity may be a reflection of the focus of surveys or changing conditions
within the catchment (for example -improved vegetation management practices) or regional, broad
scale influences such as prevailing rainfall both locally and broadly across the state. For example the
appearance of water fowl in the Parramatta River catchment that are generally present west of the
ranges may indicate a lack of resources, particularly open water, for these species within their
normal distribution during times of drought. Major long term changes in the catchment are obvious
from a comparison of historic and current aerial photography noting that forested areas may have
actually improved in quality despite hardening of the catchment.
Figure 8 (top) Current aerial photography for the Parramatta River catchment; and (bottom) 1943 aerial photography for the same catchment (Six Maps)

25
DATA SOURCES
The project database consists of records extracted from three large existing databases and other
miscellaneous records. Details of these sources are provided in the following sections.
NSW BIRD ATLAS
Data for the study area was purchased from the NSW Bird Atlassers Inc (NSWBA) in February 2014.
The NSWBA database contains in excess of 3 million records. Records for this database are obtained
from members who submit records on a standard Atlas proforma. The NSW Bird Atlas is currently
derived from records from over 172,000 atlas sheets that have been submitted by members, plus
some data from other bird watching groups.
The accuracy and completeness of all records in the database is reviewed on a regular basis by a
panel of 3 expert field ornithologists. This panel also evaluates records of species reported outside
their normal/published range. Either a NSW appraisal committee or a national appraisal committee
assesses records of the rarest species or those otherwise considered unusual. For such species, only
reports accepted by one of these committees are retained as valid records within the database.
Records from this database are generally stored in grid cells of 10’ of latitude by 10’ of longitude.
This resolution was not suitable for inclusion into the project database. Records containing co-
ordinates or with specific location details, for example “Lake Parramatta Reserve” were assigned
coordinates and incorporated in the project database. Less than 5% of this data was able to be
accommodated in the current project (Table 4).
Birdlife Australia Atlas
Data for the study area was purchased from the BirdLife Australia Atlas in February 2014.
Established in 1998 the Birdlife Atlas 1998 has over 7000 atlassers and has amassed over 420,000
surveys, comprising over 7.1 million bird records. Records are uploaded via the “birddata” portal by
registered users. Preferred methods for Birdlife Australia atlassers are 20minute searches of a 2
hectare area to be surveyed at least once every 12 months, fixed route monitoring, small or large
area searches and incidental records of rare, uncommon or unusual species or surveys of specific
groups such as waders. There is emphasis on repeating surveys where possible. Data accuracy is
monitored by experienced ornithologists.
Bionet
Bionet/The Atlas of NSW Wildlife (the Wildlife Atlas) is the Office of Environment and Heritage’s
(OEH) database of flora and fauna records. The Atlas contains records of plants, mammals, birds,
reptiles, amphibians, some fungi, some invertebrates (such as insects and snails listed under the
Threatened Species Conservation Act) and some fish. The flora and fauna records in the Atlas come
from various sources including:
survey data held in the Atlas’s in-built systematic survey modules (fauna survey and VIS Flora
survey)

26
OEH, including data from the Royal Botanic Gardens herbarium database, and from National
Parks and Wildlife staff and:
Australian Museum
Coffs Harbour Herbarium Specimen Register
Department of Primary Industries (Forests NSW)
Department of Sustainability, Environment, Water, Population and Communities –
Australian Bird and Bat Banding Scheme data for NSW; and
data submitted by ecological consultants, research scientists, and others (as part of the
scientific licence procedure)
data provided by other agencies, such as Forests NSW, the Australian Museum and the
Australian Bird and Bat Banding Scheme
historical reports
the general public
Data accuracy is monitored by OEH staff.
Miscellanous sources
Records were collected form a variety of other miscellaneous sources including
Ebird (moderated location based data -now sharing data with Birdlife Australia Atlas)
Council staff observations
Bushcare records
Bush regeneration (Council) contractors
Internal & public Council documents such as REFs, Plans of Management, flora and fauna
surveys
SUMMARY DATA
Approximately 78,250 records of native fauna are included in the project database which includes
515,434 species observations.
Table 4 DATA SOURCES
DATA SOURCE TOTAL RECORDS USED
EBIRD 1907 1716
NSW BIRD ATLAS 46280 1936
BIRDLIFE AUSTRALIA 38414 27460
OEH DATA FROM SCIENTIFIC LICENCES DATASET 44231
AUSTRALIAN BIRD & BAT BANDING SCHEME 6
NSW BIRD ATLASSERS INC. 235
OEH DEFAULT SIGHTINGS 174
SYDNEY METRO CMA RAPID FAUNA 431
OTHER 2364
Exotic species were recorded in all of the key database sources. Native and exotic species were
separated into 2 databases. Exotic species were not included in species richness calculations or
mapping (unless specified otherwise). Summary findings include the data in the following Tables:

27
Table 5 SUMMARY DATA - TOTAL NATIVE AND EXOTIC SPECIES
PROJECT DATA > YR 2000
PARAMETER NUMBER
NATIVE SPECIES RECORDS 78254
NATIVE SPECIES FAMILIES 98
EXOTIC SPECIES RECORDS 8153
EXOTIC SPECIES FAMILIES 17
Table 6 SUMMARY- SPECIES RECORDS PER CLASS
CLASS COUNT
AMPHIBIA 2895
AVES 73850
GASTROPA 7
MAMMALIA 757
REPTILIA 745
Table 7 DATA SUMMARY BY LGA (RECORDS WITHIN PARRAMATTA RIVER CATCHMENT)1
LGA/AREA RECORDS OBSERVATIONS SPECIES RICHNESS
ASHFIELD 713 1329 60
AUBURN 46110 275978** 261
BANKSTOWN 253 384 38
BLACKTOWN 2840 2848 123
BURWOOD 99 447 24
CANADA BAY 2961 9444 165
HOLROYD 202 221 73
HUNTERS HILL 383 957 97
LEICHHARDT 3347 5899 71
MARRICKVILLE 309 710 44
PARRAMATTA 10190 143013* 237
RYDE 955 1621 136
STRATHFIELD 1824 4682 130
THE HILLS 4744 7604 210
THE RIVER 3087 60151 117
THE CATCHMENT 78254 515434 392
* Figure Dominated By Grey-Headed Flying-Fox Counts
** Figure Dominated By Shore-Bird/Wader Counts
1 Full species lists and counts by LGA can be found in Appendix 6

28
Seven Councils within the catchment are undertaking onground works as part of the ongoing larger
project deliverables. Better understanding of the distribution of fauna across these LGAs would
assist with prioritising onground works, so to this end the data for these Councils was separated
from the project database. A further refinement was to group Council reserves by combining
reserves that were less than 30m apart into one functional complex. This allowed areas of
contiguous vegetation or open space to be treated as “one reserve” to better understand how fauna
is distributed across the catchment. 583 parks and parks”groups/complexes” were identified within
the subject LGAs. Less than 100 of these contained fauna records, so that a total of 90 reserve
groups were assessed. Detailed site descriptions and species lists for these locations are provided in
Appendix 5 of this report. Within these locations the following 2 tables list the most commonly
observed species.
Table 8 TOP 25 OBSERVED SPECIES IN ALL RESERVE & RESERVE COMPLEXES
CLASS NAME
SCIENTIFIC NAME COMMON NAME COUNT
Aves Himantopus himantopus Black-winged Stilt 28232
Aves Limosa lapponica Bar-tailed Godwit 23786
Aves Chroicocephalus novaehollandiae Silver Gull 20689
Aves Anas castanea Chestnut Teal 20095
Aves Calidris acuminata Sharp-tailed Sandpiper 19379
Aves Anas gracilis Grey Teal 11140
Aves Threskiornis molucca Australian White Ibis 9988
Aves Fulica atra Eurasian Coot 7572
Aves Malurus cyaneus Superb Fairy-wren 7137
Aves Corvus coronoides Australian Raven 5693
Aves Hirundo neoxena Welcome Swallow 4987
Aves Recurvirostra novaehollandiae Red-necked Avocet 4800
Aves Elseyornis melanops Black-fronted Dotterel 4718
Aves Vanellus miles Masked Lapwing 4697
Aves Gallinula tenebrosa Dusky Moorhen 4591
Aves Anas superciliosa Pacific Black Duck 4365
Aves Trichoglossus haematodus Rainbow Lorikeet 4245
Aves Phalacrocorax sulcirostris Little Black Cormorant 4088
Aves Manorina melanocephala Noisy Miner 3992
Amphibia Crinia signifera Common Eastern Froglet 3597
Amphibia Limnodynastes peronii Brown-striped Frog 3426
Amphibia Litoria aurea Green and Golden Bell Frog 3387
Aves Porphyrio porphyrio Purple Swamphen 3013
AVES Pelecanus conspicillatus Australian Pelican 2966
Aves Petrochelidon ariel Fairy Martin 2782
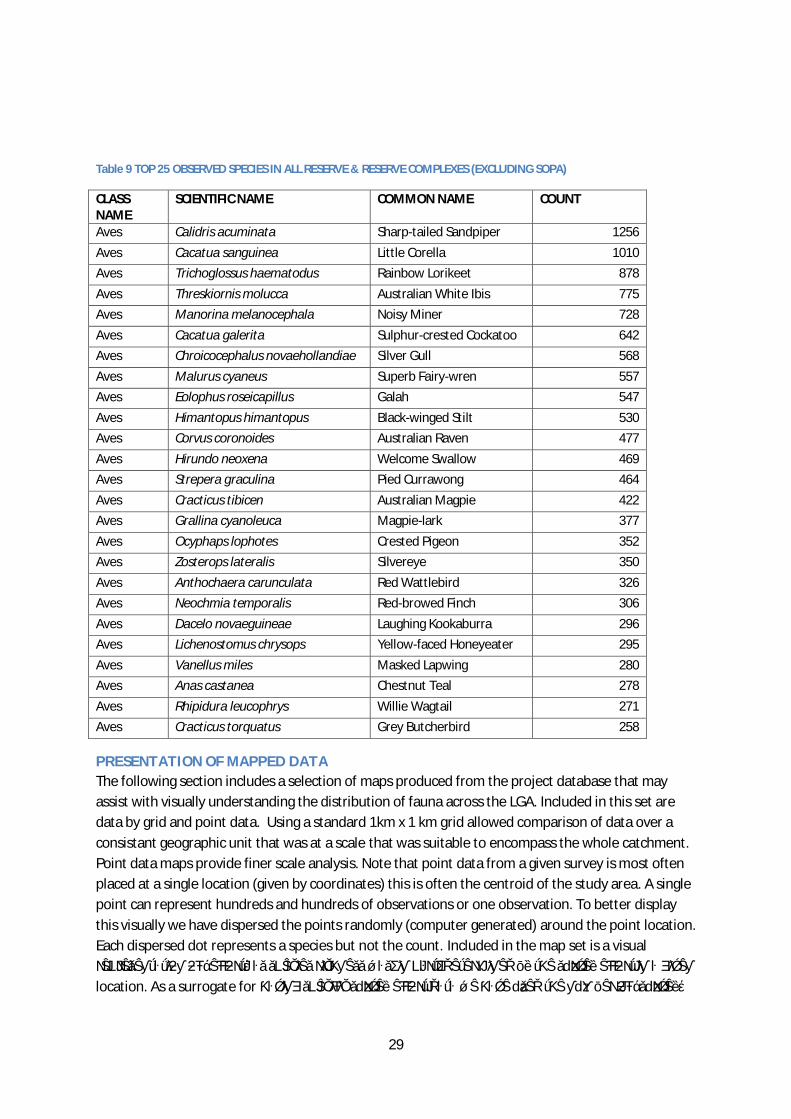
The second table excludes data collected in the SOPA precinct as the shorebird counts undertaken
there dominate results.
29
Table 9 TOP 25 OBSERVED SPECIES IN ALL RESERVE & RESERVE COMPLEXES (EXCLUDING SOPA)
CLASS NAME
SCIENTIFIC NAME COMMON NAME COUNT
Aves Calidris acuminata Sharp-tailed Sandpiper 1256
Aves Cacatua sanguinea Little Corella 1010
Aves Trichoglossus haematodus Rainbow Lorikeet 878
Aves Threskiornis molucca Australian White Ibis 775
Aves Manorina melanocephala Noisy Miner 728
Aves Cacatua galerita Sulphur-crested Cockatoo 642
Aves Chroicocephalus novaehollandiae Silver Gull 568
Aves Malurus cyaneus Superb Fairy-wren 557
Aves Eolophus roseicapillus Galah 547
Aves Himantopus himantopus Black-winged Stilt 530
Aves Corvus coronoides Australian Raven 477
Aves Hirundo neoxena Welcome Swallow 469
Aves Strepera graculina Pied Currawong 464
Aves Cracticus tibicen Australian Magpie 422
Aves Grallina cyanoleuca Magpie-lark 377
Aves Ocyphaps lophotes Crested Pigeon 352
Aves Zosterops lateralis Silvereye 350
Aves Anthochaera carunculata Red Wattlebird 326
Aves Neochmia temporalis Red-browed Finch 306
Aves Dacelo novaeguineae Laughing Kookaburra 296
Aves Lichenostomus chrysops Yellow-faced Honeyeater 295
Aves Vanellus miles Masked Lapwing 280
Aves Anas castanea Chestnut Teal 278
Aves Rhipidura leucophrys Willie Wagtail 271
Aves Cracticus torquatus Grey Butcherbird 258
PRESENTATION OF MAPPED DATA
The following section includes a selection of maps produced from the project database that may
assist with visually understanding the distribution of fauna across the LGA. Included in this set are
data by grid and point data. Using a standard 1km x 1 km grid allowed comparison of data over a
consistant geographic unit that was at a scale that was suitable to encompass the whole catchment.
Point data maps provide finer scale analysis. Note that point data from a given survey is most often
placed at a single location (given by coordinates) this is often the centroid of the study area. A single
point can represent hundreds and hundreds of observations or one observation. To better display
this visually we have dispersed the points randomly (computer generated) around the point location.
Each dispersed dot represents a species but not the count. Included in the map set is a visual
representation of “effort” as species richness was, in part, determined by the survey effort in a given
location. As a surrogate for having specific survey effort data we have used the number of “survey”

30
days with survey days being the date of a given observation. We recognised that there would be
more records from accessible areas with good habitat and the grid analysis certainly supports that.
Figure 9 THIS FIGURE ILLUSTRATES THE SAME DATA-RAW DATA POINTS (LEFT) AND DISPERSED POINTS (RIGHT)

31
Figure 10 Species richness based on records from fauna databases from 2000-2014

32
Figure 11 Species Richness (2000-2014) by data source for the Parramatta River Catchment

33
Figure 12 Vegetation of the Parramatta River Catchment

34
Figure 13 Threatened Aves

35
Figure 14 Threatened amphibians

36
Figure 15 All Mammals
37
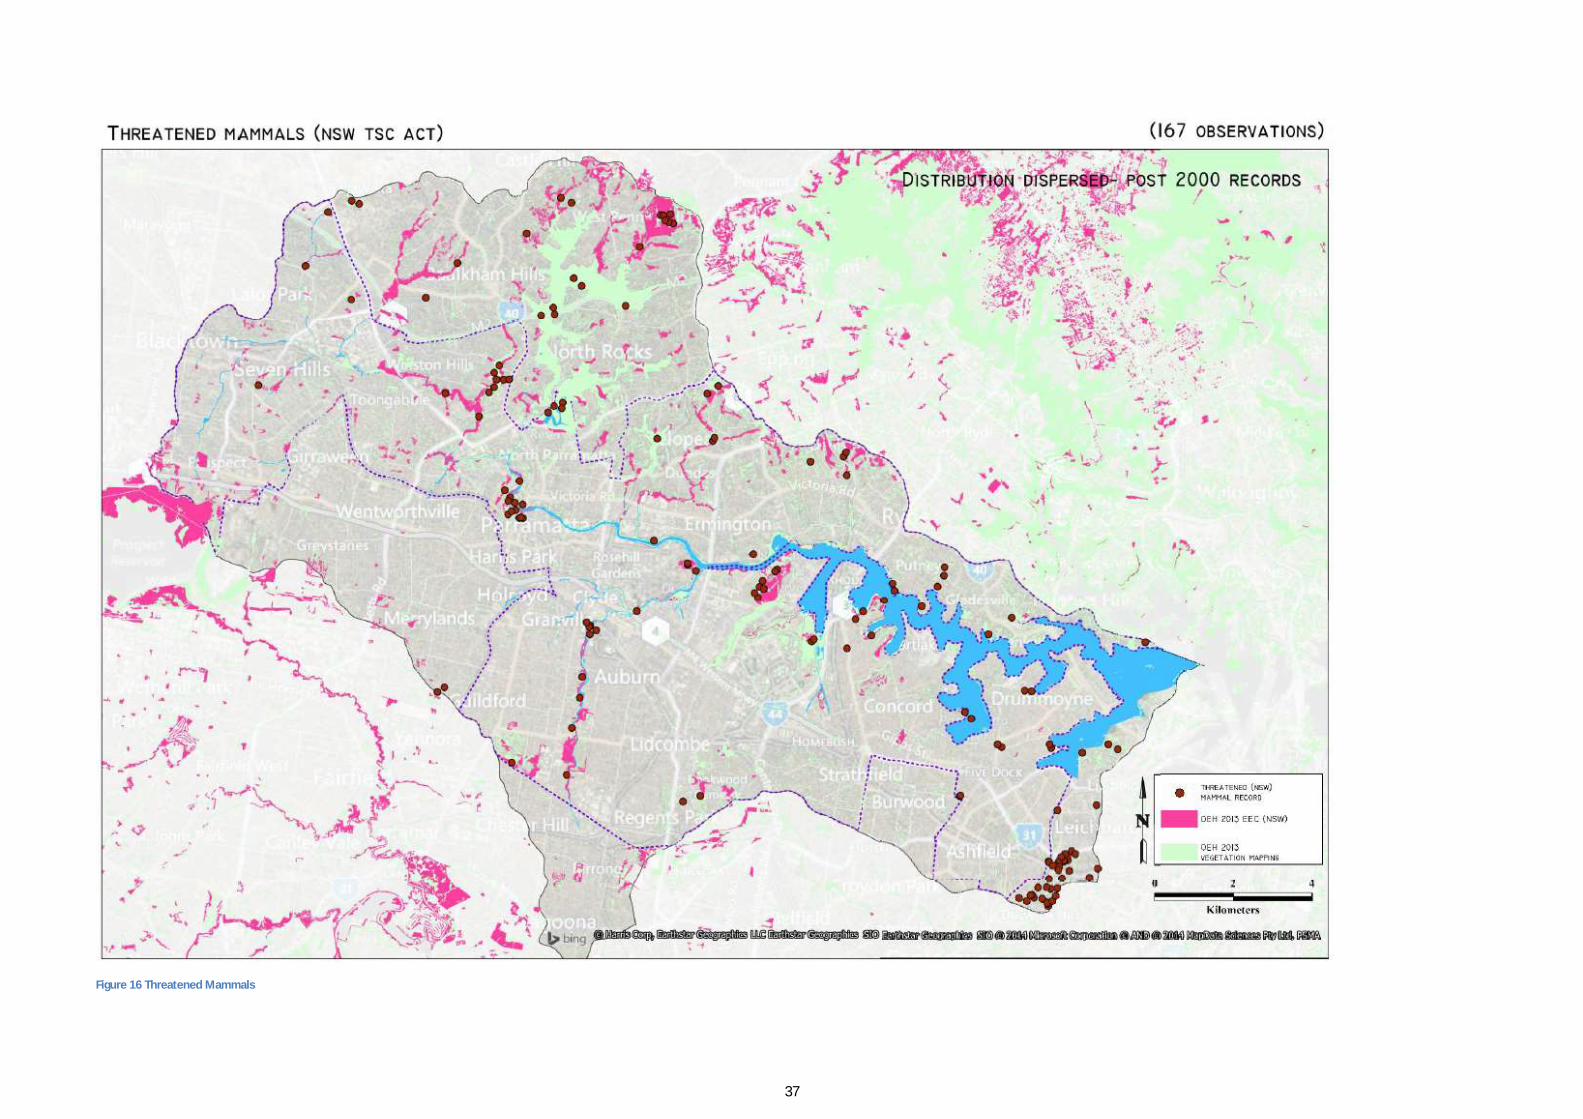
Figure 16 Threatened Mammals

38
Figure 17 Species richness across Parramatta River catchment using a 1km2 grid (range: 1 to 168)

39
Figure 18 Survey effort for Parramatta River catchment using a 1km2 grid (range: 1 survey event to 742 survey events)

40
Figure 19 Distribution of fauna records across the Parramatta River catchment, based on number of species and number of observations (range: 1 record to 12,689 records)
41
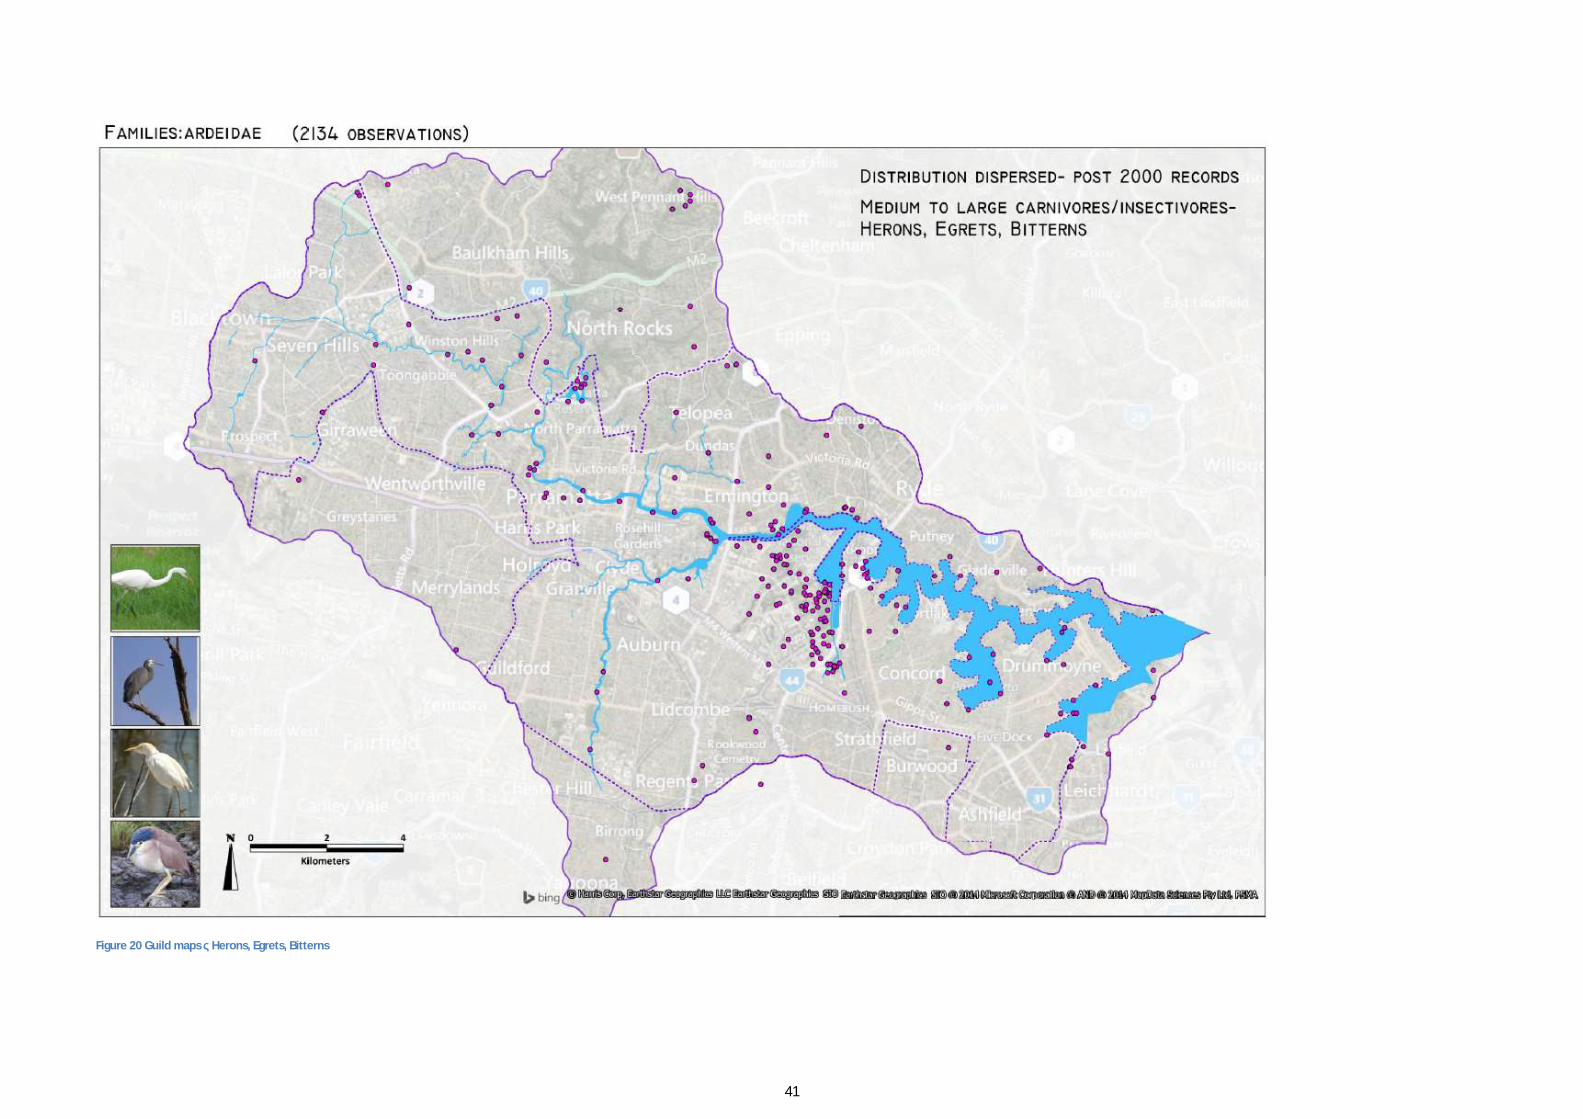
Figure 20 Guild maps – Herons, Egrets, Bitterns

42
Figure 21 Guild maps- Honeyeaters

43
Figure 22 Guild maps- medium insectivores

44
Figure 23 Guild maps- riparian zone medium insectivores
45
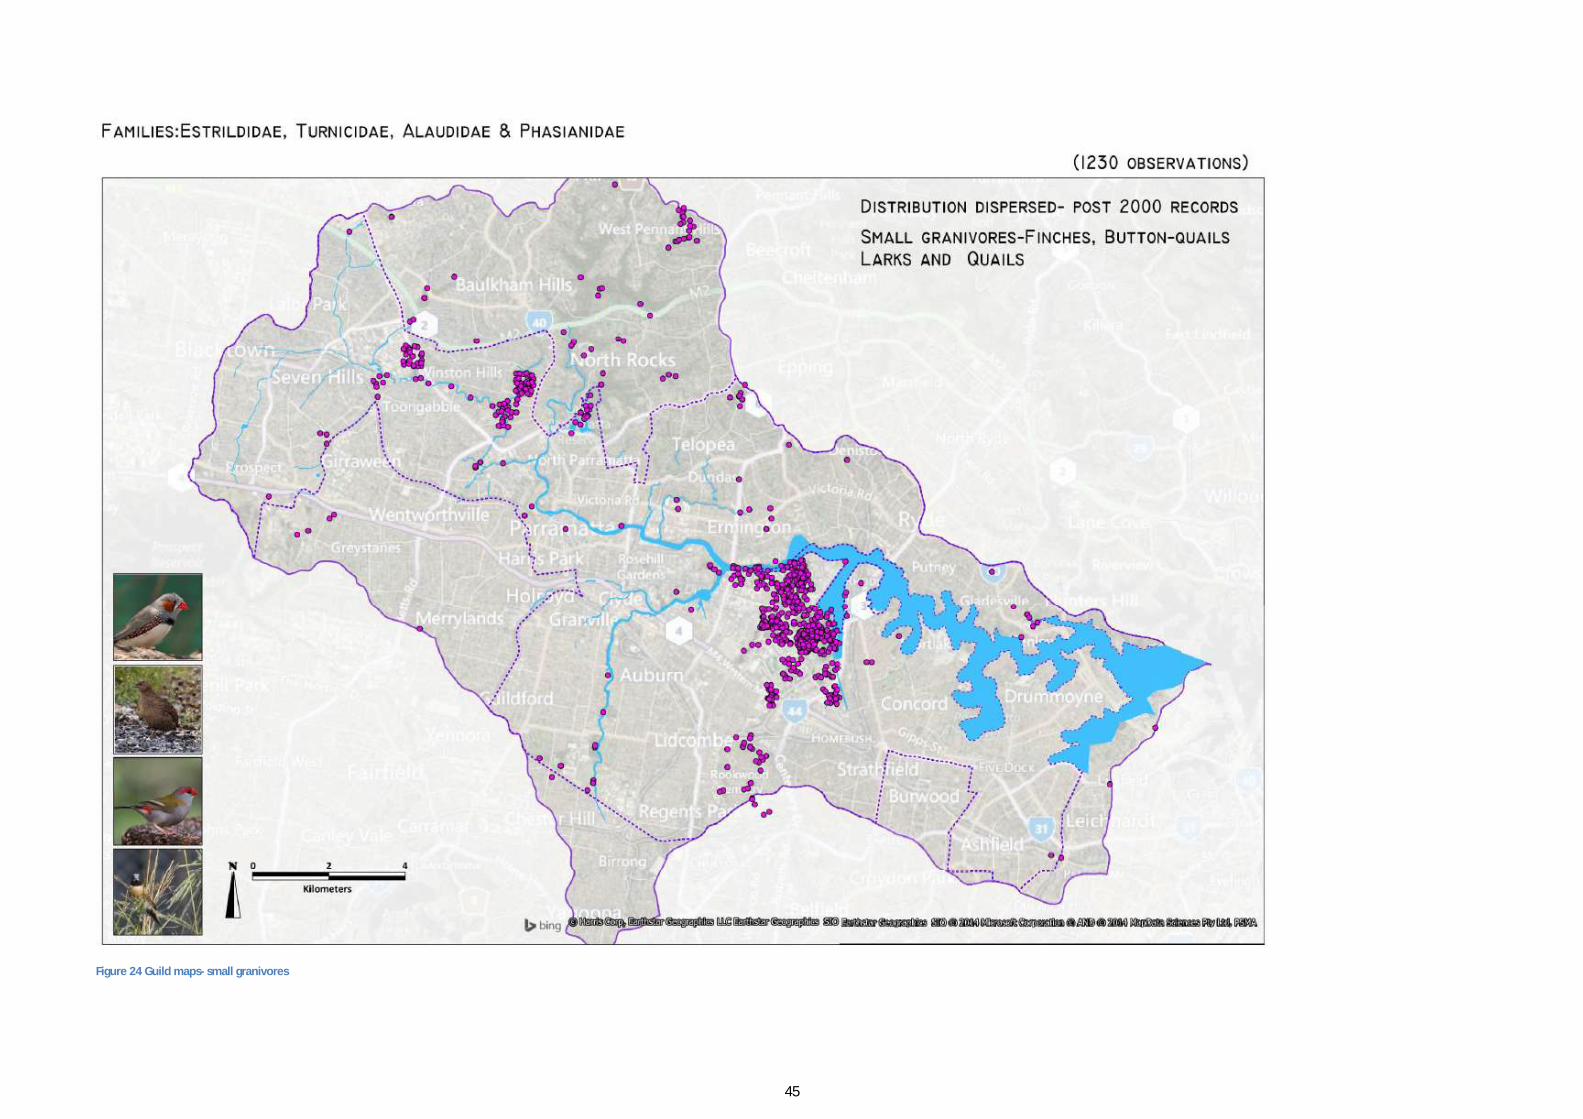
Figure 24 Guild maps- small granivores
46
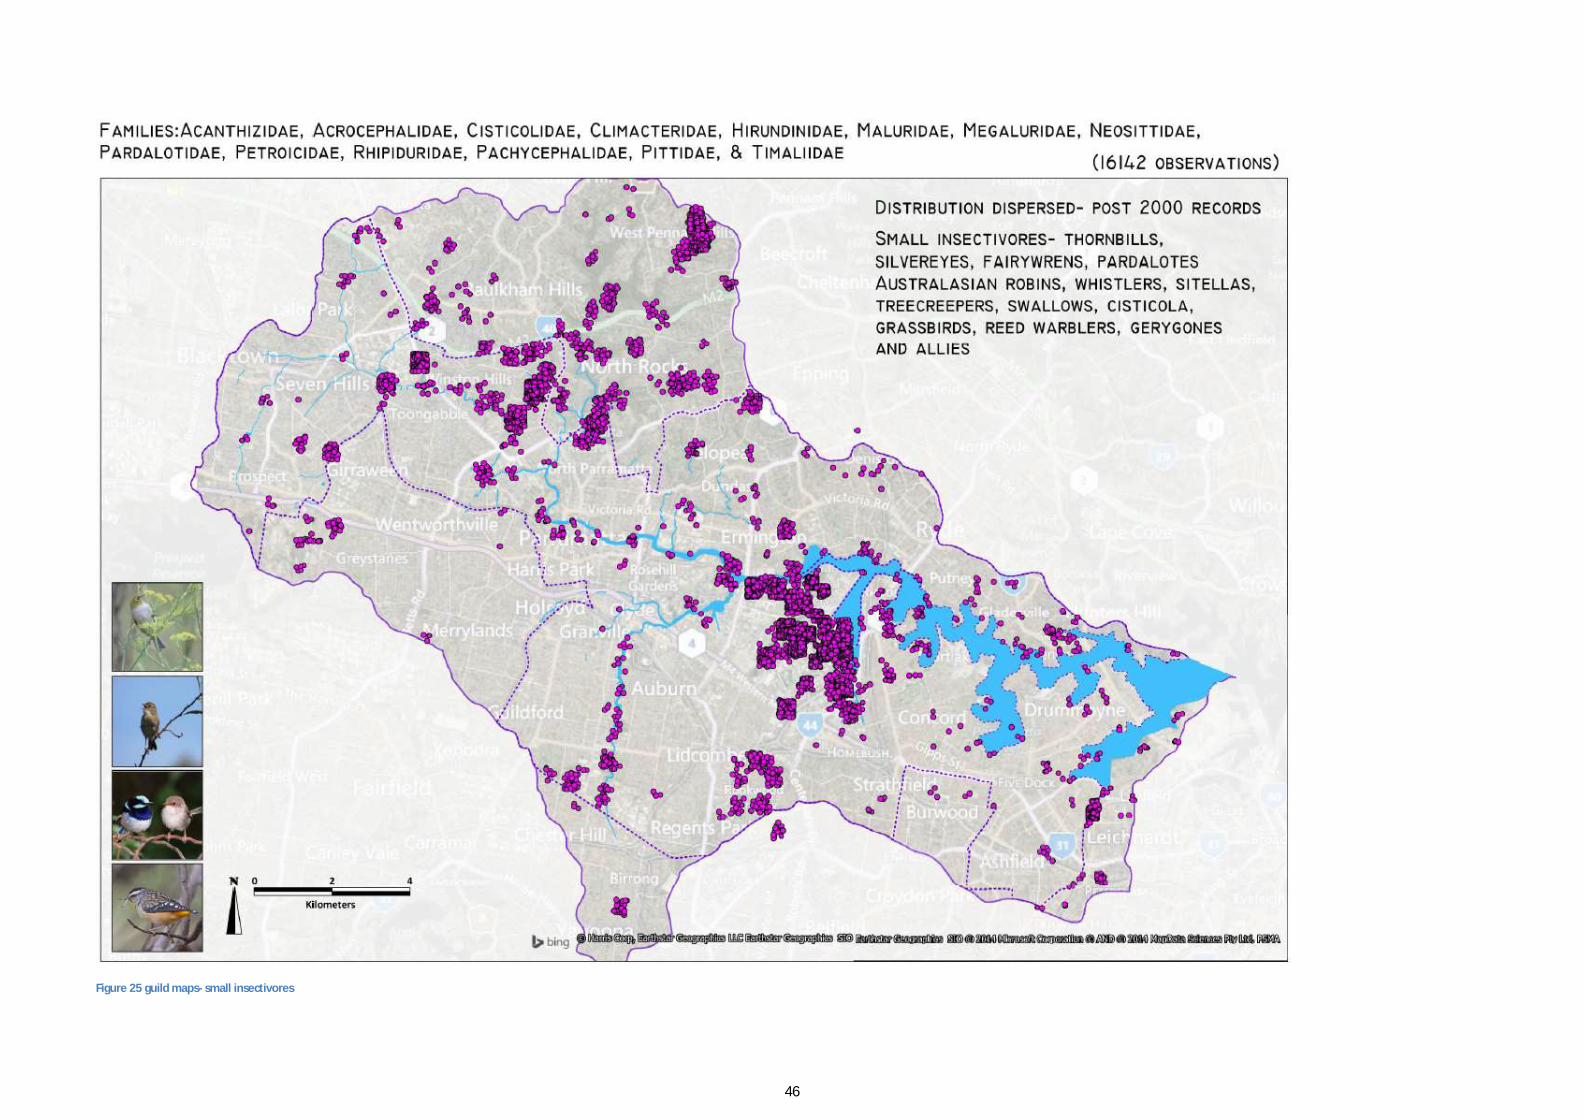
Figure 25 guild maps- small insectivores
47
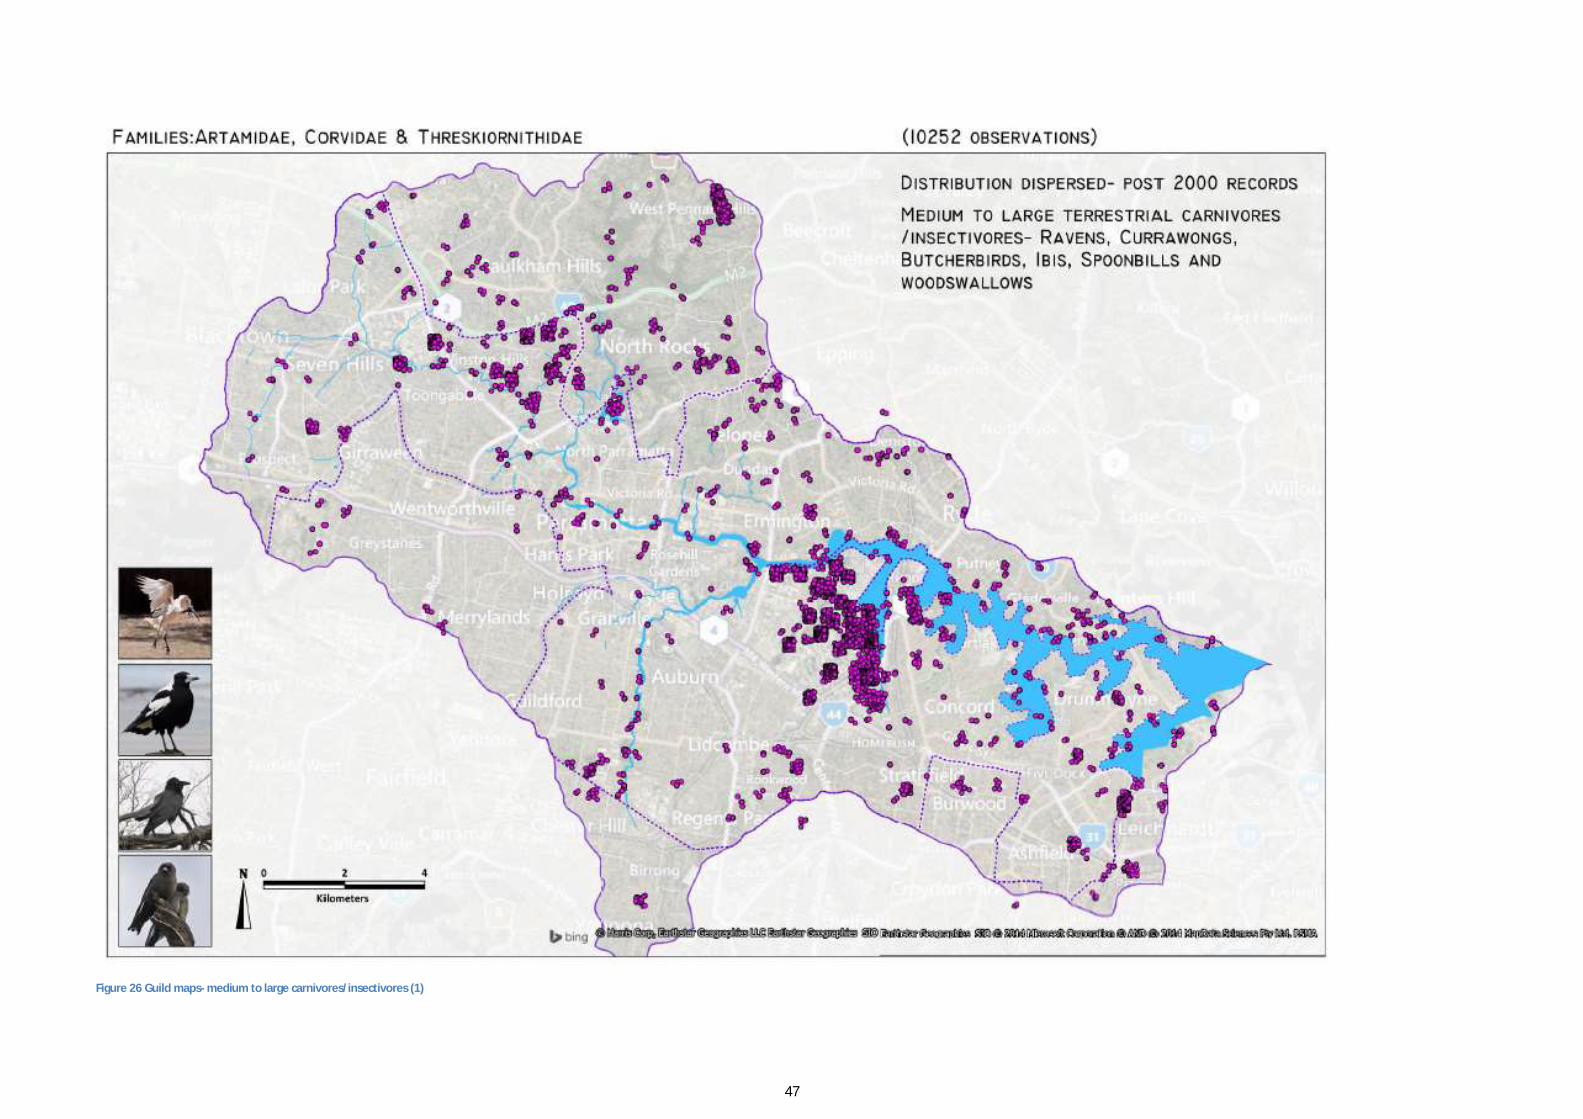
Figure 26 Guild maps- medium to large carnivores/insectivores (1)

48
Figure 27 Guild maps- medium to large carnivores/insectivores (2)
49
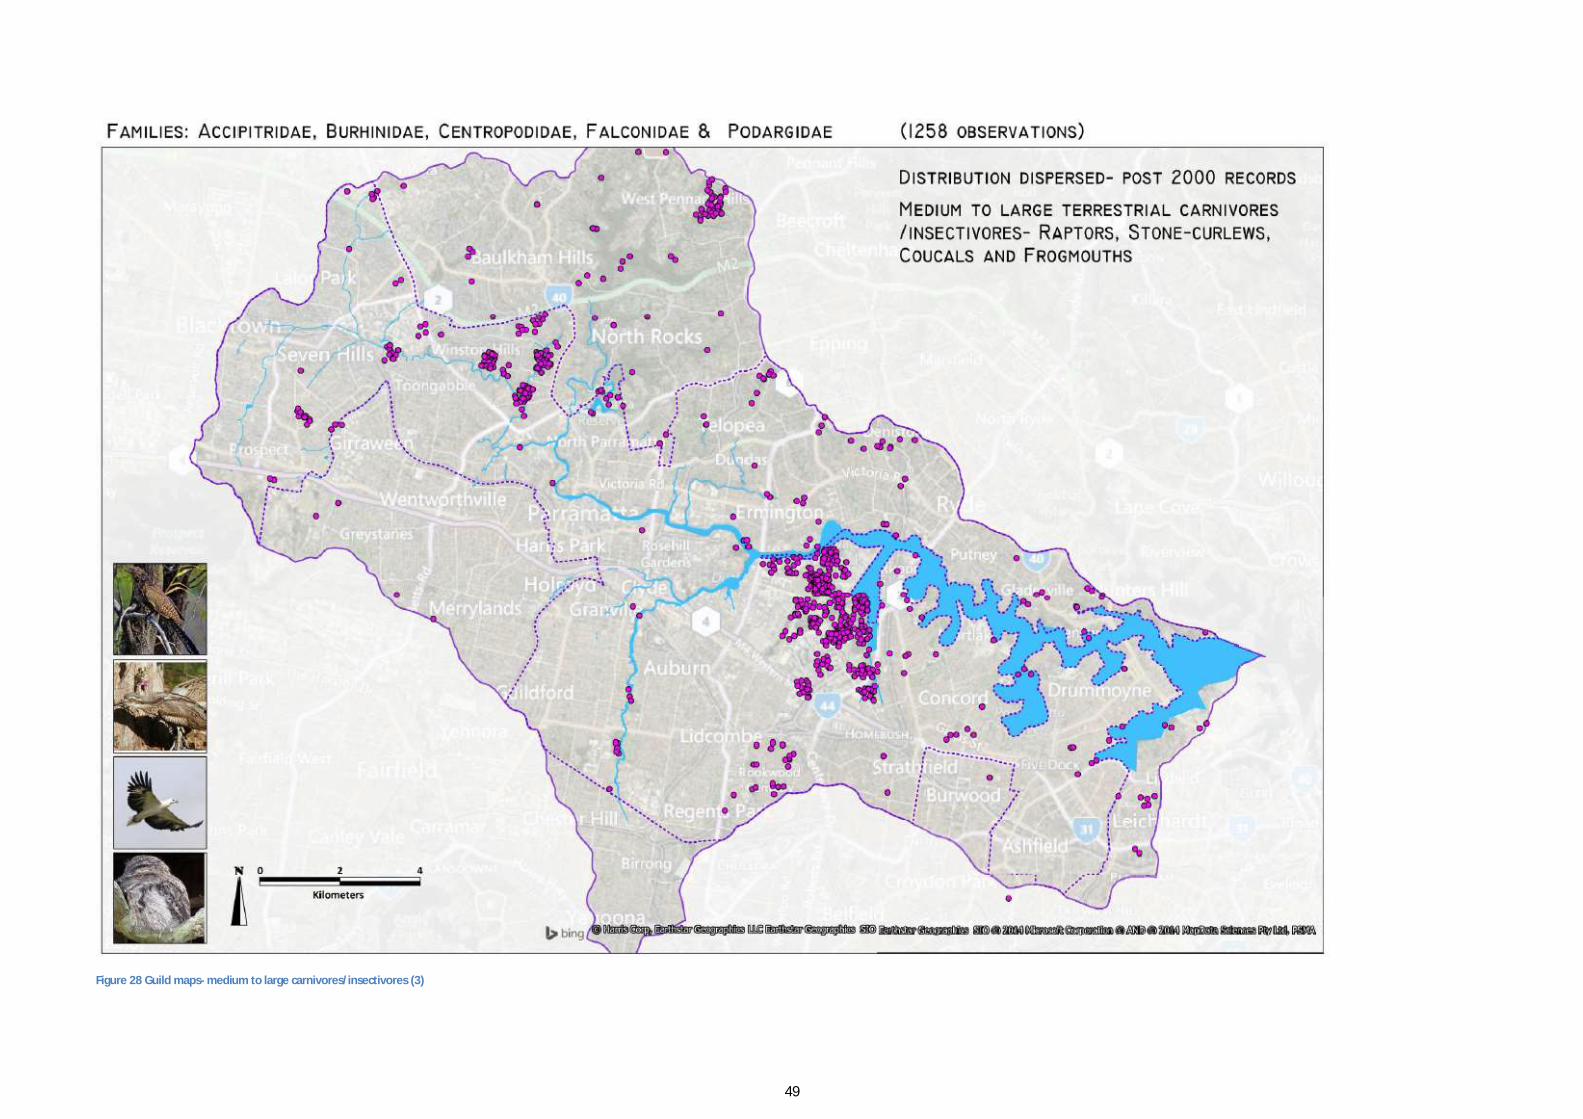
Figure 28 Guild maps- medium to large carnivores/insectivores (3)

50
Figure 29 guild maps- Medium to large water birds
51
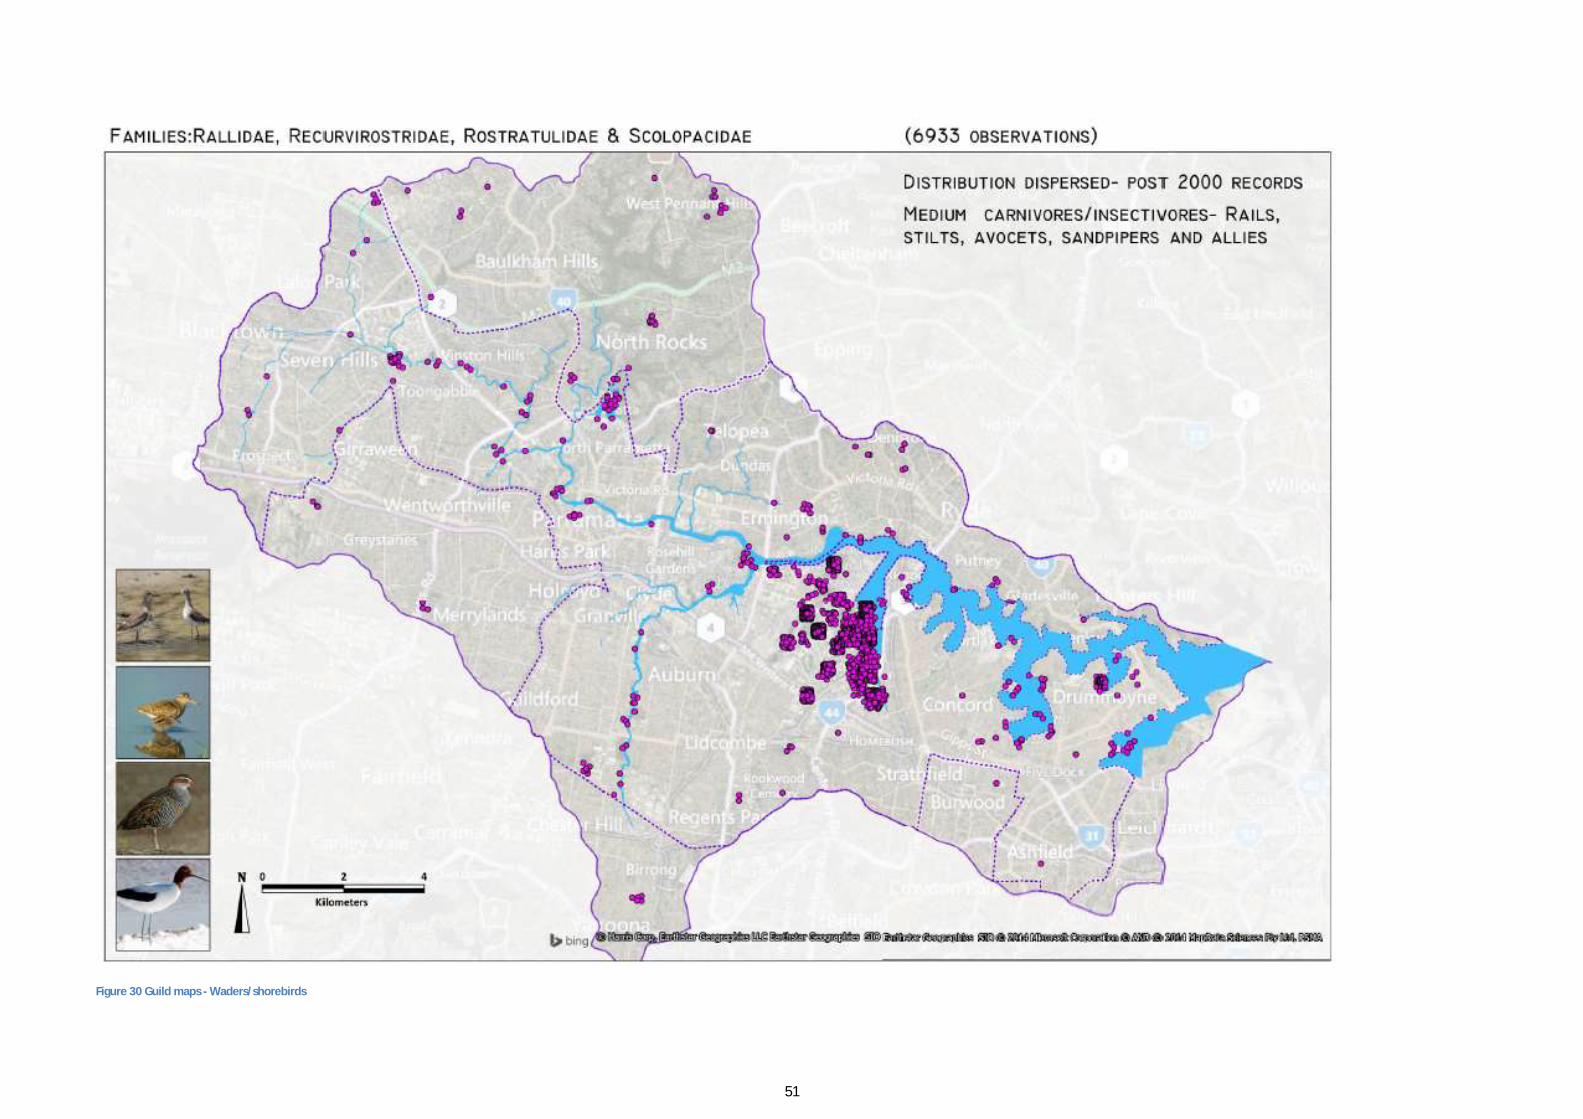
Figure 30 Guild maps - Waders/shorebirds

52
Figure 31 Guild maps- Large granivores

53
UNDERSTANDING THE DATASET Some of the key questions that need to be answered for this type of project relate to existing
methods of allocating funding. To assist with decision making in this area, the following questions
were addressed:
Where is the best fauna habitat?
Does this fit with existing funding targets (such as EECs/TS)?
To begin the process of answering this, the collated dataset was assessed using a number of
techniques to determine species richness and abundance, which combine to give diversity for a
given “community” of individuals.
MEASURING ECOLOGICAL DIVERSITY A simple count of species gives no information about their relative frequencies. For two theoretical
communities, both have four species giving equal species richness, but differ in the abundance of
each species (Figure 32). For one habitat the species are present in equal abundance, giving a high
diversity. For the other habitat, one species almost completely dominates and the community has
low diversity.
Figure 32 The difference between species richness and diversity – both have 4 species, so richness is equal, but the abundance of each species is different, so diversity is not equal (Shaw, 2003)
The aim of diversity indices is to encapsulate these concepts in one number, which can then be used
to compare the relative diversity of two or more communities. The two most commonly used indices
in ecology are the Simpson’s index and the Shannon-Weiner index.
Simpson’s index – uses probability of repeated samples from a population containing the
same species. The higher the diversity the less likely this is to happen, at which point
Simpson approaches a maximum value of 1.0)
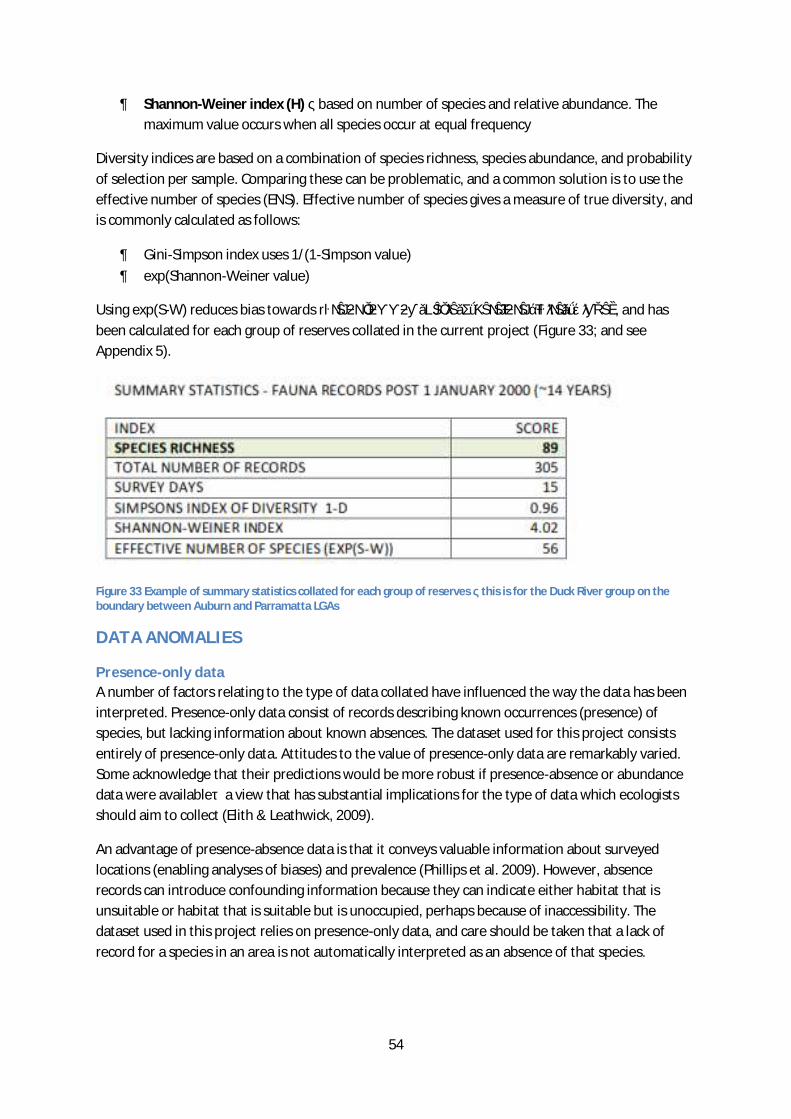
54
Shannon-Weiner index (H) – based on number of species and relative abundance. The
maximum value occurs when all species occur at equal frequency
Diversity indices are based on a combination of species richness, species abundance, and probability
of selection per sample. Comparing these can be problematic, and a common solution is to use the
effective number of species (ENS). Effective number of species gives a measure of true diversity, and
is commonly calculated as follows:
Gini-Simpson index uses 1/(1-Simpson value)
exp(Shannon-Weiner value)
Using exp(S-W) reduces bias towards rare or common species, therefore “fairest” index, and has
been calculated for each group of reserves collated in the current project (Figure 33; and see
Appendix 5).
Figure 33 Example of summary statistics collated for each group of reserves – this is for the Duck River group on the boundary between Auburn and Parramatta LGAs
DATA ANOMALIES
Presence-only data
A number of factors relating to the type of data collated have influenced the way the data has been
interpreted. Presence-only data consist of records describing known occurrences (presence) of
species, but lacking information about known absences. The dataset used for this project consists
entirely of presence-only data. Attitudes to the value of presence-only data are remarkably varied.
Some acknowledge that their predictions would be more robust if presence-absence or abundance
data were available—a view that has substantial implications for the type of data which ecologists
should aim to collect (Elith & Leathwick, 2009).
An advantage of presence-absence data is that it conveys valuable information about surveyed
locations (enabling analyses of biases) and prevalence (Phillips et al. 2009). However, absence
records can introduce confounding information because they can indicate either habitat that is
unsuitable or habitat that is suitable but is unoccupied, perhaps because of inaccessibility. The
dataset used in this project relies on presence-only data, and care should be taken that a lack of
record for a species in an area is not automatically interpreted as an absence of that species.
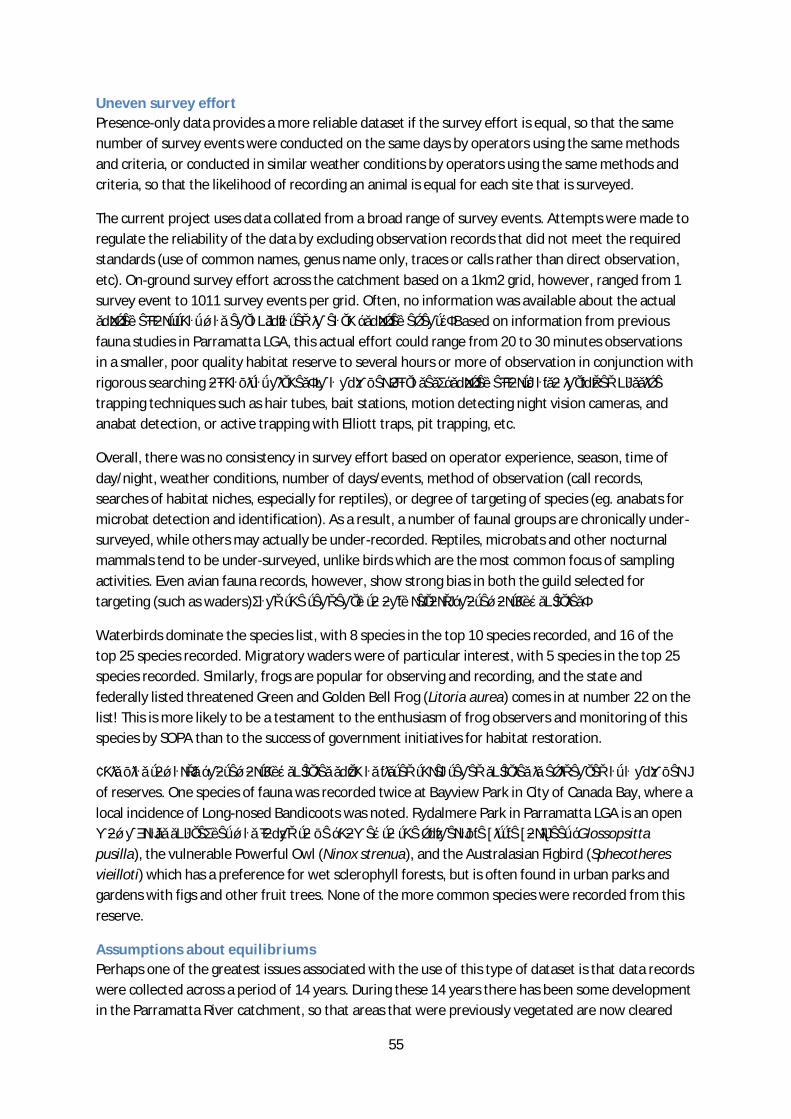
55
Uneven survey effort
Presence-only data provides a more reliable dataset if the survey effort is equal, so that the same
number of survey events were conducted on the same days by operators using the same methods
and criteria, or conducted in similar weather conditions by operators using the same methods and
criteria, so that the likelihood of recording an animal is equal for each site that is surveyed.
The current project uses data collated from a broad range of survey events. Attempts were made to
regulate the reliability of the data by excluding observation records that did not meet the required
standards (use of common names, genus name only, traces or calls rather than direct observation,
etc). On-ground survey effort across the catchment based on a 1km2 grid, however, ranged from 1
survey event to 1011 survey events per grid. Often, no information was available about the actual
survey effort that was encapsulated in each “survey event”. Based on information from previous
fauna studies in Parramatta LGA, this actual effort could range from 20 to 30 minutes observations
in a smaller, poor quality habitat reserve to several hours or more of observation in conjunction with
rigorous searching of habitat niches. In a number of cases, “survey effort” also included passive
trapping techniques such as hair tubes, bait stations, motion detecting night vision cameras, and
anabat detection, or active trapping with Elliott traps, pit trapping, etc.
Overall, there was no consistency in survey effort based on operator experience, season, time of
day/night, weather conditions, number of days/events, method of observation (call records,
searches of habitat niches, especially for reptiles), or degree of targeting of species (eg. anabats for
microbat detection and identification). As a result, a number of faunal groups are chronically under-
surveyed, while others may actually be under-recorded. Reptiles, microbats and other nocturnal
mammals tend to be under-surveyed, unlike birds which are the most common focus of sampling
activities. Even avian fauna records, however, show strong bias in both the guild selected for
targeting (such as waders), and the tendency to only record “noteworthy” species.
Waterbirds dominate the species list, with 8 species in the top 10 species recorded, and 16 of the
top 25 species recorded. Migratory waders were of particular interest, with 5 species in the top 25
species recorded. Similarly, frogs are popular for observing and recording, and the state and
federally listed threatened Green and Golden Bell Frog (Litoria aurea) comes in at number 22 on the
list! This is more likely to be a testament to the enthusiasm of frog observers and monitoring of this
species by SOPA than to the success of government initiatives for habitat restoration.
This bias towards “noteworthy” species such as listed threatened species is evidenced at a number
of reserves. One species of fauna was recorded twice at Bayview Park in City of Canada Bay, where a
local incidence of Long-nosed Bandicoots was noted. Rydalmere Park in Parramatta LGA is an open
mown grass space, yet was found to be “home” to the vulnerable Little Lorikeet (Glossopsitta
pusilla), the vulnerable Powerful Owl (Ninox strenua), and the Australasian Figbird (Sphecotheres
vieilloti) which has a preference for wet sclerophyll forests, but is often found in urban parks and
gardens with figs and other fruit trees. None of the more common species were recorded from this
reserve.
Assumptions about equilibriums
Perhaps one of the greatest issues associated with the use of this type of dataset is that data records
were collected across a period of 14 years. During these 14 years there has been some development
in the Parramatta River catchment, so that areas that were previously vegetated are now cleared

56
and hardened. As a result of these changes in the extent and/or quality of habitat available, there
are likely to be some changes in the suites of species that are able to be supported in some areas.
The result of this can be a set of species records that are unrepresentative of the new conditions. An
example of this is Birnie Avenue Reserve in Auburn (Figure 34).
Figure 34 Excerpt from site summary data showing the current extent of the reserve, with high species diversity associated with the previous extent of the reserve
The reserve extent is 0.8ha, with 0.5ha of vegetation, forming a long narrow strip of land between
several factory buildings and the M4 Motorway. Fauna surveys were carried out on 32 days in 2002-
3, and the result was 96 species of birds, including several threatened species and numerous
waterbirds. Clearly this reserve no longer supports this suite of fauna. Some care needs to be taken
with the interpretation of the dataset at certain locations for this reason.
WHERE IS FAUNA LOCATED? In the last five years there has been considerable work directed towards a single robust set of
vegetation community mapping and descriptions. Towards this end the SMCMA developed a draft
“Native Vegetation of the Sydney Metropolitan Area” (SMCMA, 2009), which was recently finalised
following extensive ground truthing and verification. The latest version (OEH, 2013) has updated
vegetation communities, mapping and descriptions, and forms a reasonably reliable and consistent
way of analysing the relationships between fauna distribution and vegetation communities present.
Some anomalies exist in the vegetation mapping, however, with some areas lacking mapped
vegetation. Contrary to expectations, and perhaps relict from the non-equilibrium condition of the
catchment, a number of areas of “unmapped” vegetation have high numbers of species observation
records in the same area (Figure 35).
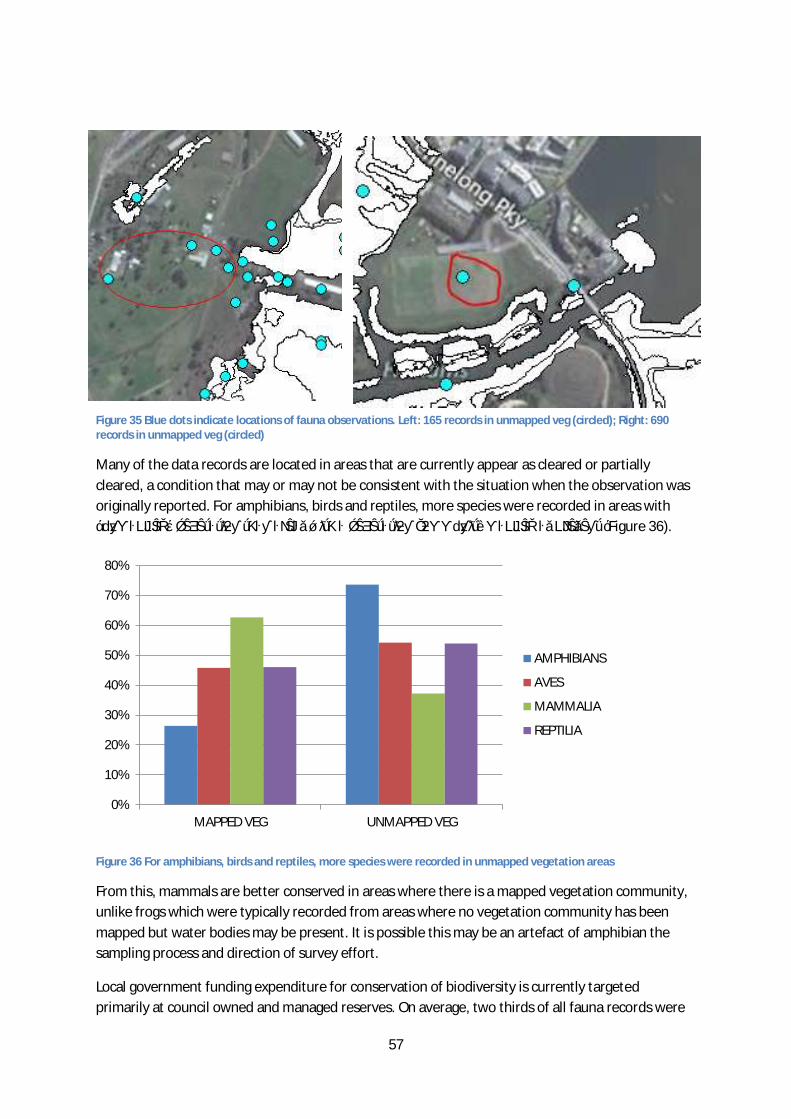
57
Figure 35 Blue dots indicate locations of fauna observations. Left: 165 records in unmapped veg (circled); Right: 690 records in unmapped veg (circled)
Many of the data records are located in areas that are currently appear as cleared or partially
cleared, a condition that may or may not be consistent with the situation when the observation was
originally reported. For amphibians, birds and reptiles, more species were recorded in areas with
“unmapped” vegetation than areas with a vegetation community mapped as present (Figure 36).
Figure 36 For amphibians, birds and reptiles, more species were recorded in unmapped vegetation areas
From this, mammals are better conserved in areas where there is a mapped vegetation community,
unlike frogs which were typically recorded from areas where no vegetation community has been
mapped but water bodies may be present. It is possible this may be an artefact of amphibian the
sampling process and direction of survey effort.
Local government funding expenditure for conservation of biodiversity is currently targeted
primarily at council owned and managed reserves. On average, two thirds of all fauna records were
0%
10%
20%
30%
40%
50%
60%
70%
80%
MAPPED VEG UNMAPPED VEG
AMPHIBIANS
AVES
MAMMALIA
REPTILIA

58
for species located in LGA reserves (Figure 37). In direct contrast, less than one third of all fauna
observations were located directly in areas of Endangered Ecological Communities (Figure 37). For
most faunal groups the number of records in EECs was considerably less than one third, with less
than 20% of observations of birds reported from EECs, and less than 5% of observations of
amphibians reported from EEC areas.
Figure 37 Number of fauna records reported for (left) council reserve areas, and (right) in Endangered Ecological Communities, expressed as a percentage of all observations
From this, funding that is directed towards EECs may not be contributing effectively to the
conservation of many faunal groups. Again, this observation should be taken with some caution as it
is likely to be an artefact of the survey effort, at least for some part.
LINKING FAUNA WITH VEGETATION: Several approaches were taken to identify any key relationships between fauna diversity hotspots
and aspects of vegetation in the Parramatta River catchment. These included determining the nature
of relationships between:
fauna and vegetation structure
fauna in Endangered Ecological Communities
fauna outside of Endangered Ecological Communities
This is described in more detail in the following sections.
FAUNA AND VEGETATION COMMUNITY STRUCTURE Many of the faunal groups and guilds within groups do not strongly differentiate between specific
vegetation communities. For example, the small granivores guild includes finches, button quails,
larks and quails that feed predominantly on a mixture of grains from grasses and some herbs. As a
result, they are generally found in a range of grassy woodlands and dry sclerophyll forests, and may
be found in wet sclerophyll forests and some areas of “other vegetation”.
To help understand how fauna is distributed in the Parramatta River catchment, each of the mapped
communities with fauna present were allocated to vegetation structural groups (Table 10).
0%
10%
20%
30%
40%
50%
60%
70%
80%
COUNCIL RESERVES EEC PRESENT
AMPHIBIANS
AVES
MAMMALIA
REPTILIA

59
Table 10 Vegetation communities with fauna present allocated to vegetation structural groups
DRY
SCLEROPHYLL
FORESTS
FORESTED
WETLANDS
GRASSY
WOODLANDS
SALINE
WETLANDS
WET
SCLEROPHYLL
FORESTS
OTHER
VEGETATION
Castlereagh
Ironbark
Forest
Coastal Flats
Swamp
Mahogany
Forest
Cumberland
Shale Plains
Woodland
Estuarine
Saltmarsh
Blue Gum
High Forest
Urban Native
and Exotic
Cover
Coastal
Sandstone
Foreshores
Forest
Cumberland
Swamp Oak
Riparian
Forest
Cumberland
Shale Hills
Woodland
Estuarine
Mangrove
Forest
Sydney
Turpentine-
Ironbark
Forest
Weeds and
Exotics
Coastal
Enriched
Sandstone
Dry Forest
Cumberland
Riverflat
Forest
Coastal
Enriched
Sandstone
Moist Forest
Unmapped
vegetation
Coastal
Shale-
Sandstone
Forest
Plantations
Each of the structural groups includes at least one Endangered Ecological Community, except for
those grouped as “Other Vegetation”. This category includes all the fauna that isn’t directly located
in a mapped vegetation unit.
VEGETATION STRUCTURE AND FAUNA Over 90 reserves/reserve groups contained fauna records and in the Parramatta River catchment
(see Appendix 4 for detailed site analysis). These were grouped into vegetation structure based on
the structure of the dominant vegetation community mapped for that reserve group. Mean number
of fauna species recorded (with range of species richness scores) was determined for each category
of vegetation structure (Figure 38). The greatest species richness was recorded in a Saline Wetland
(the SOPA site), while the greatest average number of species was recorded in Dry Sclerophyll
Forests.
Given the extremely high survey effort, and the focus on migratory waders and wetland species as
well as other faunal groups and guilds at the highly diverse SOPA site, this site was removed from
the assessment to determine if this clarified any trends present (Figure 39).

60
Figure 38 Mean number of species, with range of values, for reserves in each vegetation structure category (n= number of reserve groups in each structural category)
Without the SOPA site the Saline Wetlands no longer dominated the assessment. Mean values for
species richness in Dry Sclerophyll Forests was double that for most other categories of vegetation
structure, and nearly double those reported for Wet Sclerophyll Forests.
Figure 39 Mean number of species, with range of values, without SOPA site, for reserves in each vegetation structure category
The greatest faunal diversity was most consistently reported from Dry Sclerophyll Forests, which
includes Castlereagh Ironbark Forest EEC, Coastal Sandstone Foreshores Forest, and Coastal
Enriched Sandstone Dry Forest.
0
50
100
150
200
250
300
Dry SclerophyllForests
ForestedWetlands
GrassyWoodlands
Saline Wetlands Wet SclerophyllForests
Other
N=14 N=8
N=5 N=14
N=30
N=15
0
20
40
60
80
100
120
140
Dry SclerophyllForests
ForestedWetlands
GrassyWoodlands
Saline Wetlands Wet SclerophyllForests
Other

61
FAUNA IN ENDANGERED ECOLOGICAL COMMUNITIES Reserves and reserve groups were allocated to EECs based on the dominant mapped vegetation
community. For reserves/groups which did not have an EEC as the dominant vegetation (such as a
number of major reserves in Parramatta LGA), but did have an EEC as a significant minor vegetation
community (between 20% and 50% of the reserve extent), these reserves were also allocated
directly to the EEC category as these reserves are generally eligible or in receipt of funding on this
basis. Mean and range of faunal species richness was compared for each EEC category (Figure 40).
Figure 40 Mean number of species, with range of values, for reserves in each Endangered Ecological Community category (see Table 11 for an explanation of abbreviations; n = number of reserves/groups with that EEC present)
Table 11 Explanation of abbreviations used for Endangered Ecological Communities
ENDANGERED COMMUNITY ABBREVIATION ENDANGERED COMMUNITY ABBREVIATION
Blue Gum High Forest BGHF Cumberland Shale Plains Woodland
CSPW
Castlereagh Ironbark Forest CIF Cumberland Swamp Oak Riparian Forest
CSORF
Coastal Flats Swamp Mahogany Forest
CFSMF Estuarine Saltmarsh ES
Cumberland Riverflat Forest CRF Sydney Turpentine-Ironbark Forest
STIF
Cumberland Shale Hills Woodland
CSHW
Of the 15 saline wetlands, only one site was an EEC – Estuarine Saltmarsh EEC. The greatest species
richness (129 species) was recorded for this EEC, followed most closely by Castlereagh Ironbark EEC
(89 species in a Dry Sclerophyll Forest). Both these EEC groups included a single sample site which is
providing effective habitat for a diverse suite of fauna. Relatively high species richness was also
0
20
40
60
80
100
120
140
BGHF(n=7)
CIF (n=1) CFSMF(n=1)
CRF (n=5) CSHW(n=3)
CSPW(n=11)
CSORF(n=2)
ES (n=1) STIF (n=6)

62
reported from Sydney Turpentine Ironbark Forest EEC (a Wet Sclerophyll Forest) with a mean of 59
species, and a range of 23 to 117 species for the 6 reserves/groups in this EEC category.
This suggests that some EECs may support greater species richness than others, but that the actual
species richness present will also be dependent on other factors, such as reserve size and shape,
floristic diversity, level of ongoing perturbation, and degree of connectivity.
FAUNA OUTSIDE ENDANGERED ECOLOGICAL COMMUNITIES Fauna observations were also recorded from reserves that did not have a specific vegetation
community present. Reserves/groups which were not able to be allocated to a dominant or co-
dominant vegetation community were assessed separately to determine the role these areas have in
conserving faunal biodiversity (Figure 41).
Figure 41 Species richness for reserves lacking mapped vegetation communities (n = number of reserves per category)
Over 25% of the reserve groups assessed in the Parramatta River catchment have vegetation that is
comprised of “Urban Native and Exotic Cover”, which typically includes areas of highly degraded
vegetation that consists of some remnant native species, along with high density weed infestations.
It also includes areas of planted native species. Greatest species diversity was reported for this
vegetation category, with a mean diversity of 16 species and range of 2 to 61 species present. This
data is significant as it acknowledges the role that high density weed infestations can play in
providing feeding and roosting resources for a range of fauna species (Figure 42, Figure 43).
Care should be taken to ensure that reserves with degraded vegetation are managed in a manner
that ensures that fauna habitat resources are maintained or supplemented during weed control and
revegetation activities.
0
10
20
30
40
50
60
70
Plantations (n=2) Unmapped (n=4) Urban Native and ExoticCover (n=24)
Weeds and Exotics(n=3)

63
Figure 42 Left: Red-browed finch eating seed of Bidens pilosa (farmers friends); right: Eastern Spinebill eating nectar from Cestrum parqui (green cestrum) (photos from Hunters Hill bird corridors)
Figure 43 Button Quail forage in weeds and amongst dumped rubbish along a road edge
Recommended