I

II

King Saud University ــــ College of Science ــــ Biochemistry Department
III
2011
Practical Note
Molecular Biology
(BCH 361)
Prepared by
Dr .Mohammad Alanazi
Dr. Farid Ataya
Dr. Mohamed Elrobh
Dr. Wajaht Khan
Dr. Soaad Al-Daihan
Dr. Arjumand Warsi
Dr.Samina Haq
kingdom of Saudi Arabia
Ministry of Higher Education
king Saud University
College of Science
Biochemistry Department

Molecular Biology - BCH 361 Biochemistry Department
IV
Table of Contents
1. Introduction to Molecular Biology Laboratory ...................................... 1
1.1 General Lab Safety in Molecular Biology ........................................... 1
1.1.1 Ultra Violet Light .............................................................. 2
1.1.2 Electricity ........................................................................... 2
1.2 General Tips for conducing a safe and successful
Experiment ......................................................................................... 2
1.3 Preparation of Solutions ..................................................................... 3
1.3.1 Calculations to prepare Molar, % and X Solutions ................. 3
1.3.1.1 Percent Solution ...................................................... 3
1.3.1.2 X Solution ............................................................... 3
1.3.2 Preparation of Working Solutions from the Concentrated
Solution .................................................................................. 3
1.3.3 Tips for making solutions for Molecular Biology .................. 3
1.4 Glassware and Plastic Ware ............................................................... 4
2 Preparation of Genomic DNA from Blood ............................................. 5
2.1 Introduction ........................................................................................ 5
2.2 Theory ................................................................................................ 5
2.3 Objective ............................................................................................ 5
2.4 Materials .............................................................................................. 5
2.4.1 Chemicals .......................................................................... 5
2.4.2 Equipments ........................................................................ 5
2.4.3 Glassware ........................................................................... 6
2.4.4 Preparation of Solutions ..................................................... 6
2.5 Experimental Protocol ........................................................................ 6
2.5.1 Blood Collection ................................................................ 6
2.5.2 DNA Extraction ................................................................. 6
2.6 Results ................................................................................................ 7

Molecular Biology - BCH 361 Biochemistry Department
V
2.7 Discussion .......................................................................................... 8
2.8 Questions ............................................................................................ 8
2.9 References .......................................................................................... 8
3 Preparation of Genomic DNA from Plant tissues ................................... 9
3.1 Introduction ........................................................................................ 9
3.2 Theory ................................................................................................. 9
3.3 Objective ............................................................................................. 9
3.4 Materials ............................................................................................... 9
3.4.1 Materials ................................................................................. 9
3.4.2 CTAB Buffer 100 ml ........................................................... 10
3.4.3 1M Tris pH 8.0 ...................................................................... 10
3.5 Experimental Protocol ........................................................................ 10
3.6 Results ............................................................................................... 11
3.7 Discussion ........................................................................................ 11
3.8 References ........................................................................................ 11
4 Plasmid Isolation and Purification ....................................................... 13
4.1 Introduction ...................................................................................... 13
4.2 Theory .............................................................................................. 13
4.3 Objective .......................................................................................... 13
4.4 Materials ........................................................................................... 13
4.4.1 Buffer Solutions ................................................................ 13
4.4.1.1 Alkline Lysis Solution I ....................................... 13
4.4.1.2 Alkline Lysis Solution II ...................................... 14
4.4.1.3 Alkline Lysis Solution III .................................... 14
4.4.2 LB Broth (Luria – Bertani Medium) ................................. 14
4.4.3 Ampicillin ......................................................................... 14
4.4.4 Bacterial Colony ................................................................ 14
4.4.5 Apparatus and Solutions ................................................... 14
4.4.5.1 Apparatus and Solutions .................................... 14
4.4.5.2 Solutions I and II on Ice ..................................... 15
4.5 Experimental Protocol ....................................................................... 15
4.5.1 Preparation of Cells ......................................................... 15
4.5.2 Cell Lyses and Recovery of Plasmid DNA ..................... 15

Molecular Biology - BCH 361 Biochemistry Department
VI
4.6 Results ............................................................................................... 17
4.7 Discussion ........................................................................................ 17
4.8 References ........................................................................................ 17
5 Characterization of the DNA by: (1) The Spectrophotometric Assay;
(2) The Melting Temperature (TM) ...................................................... 18
5.1 Introduction ....................................................................................... 18
Determination of DNA Purity and Concentration by
Spectrophotometric Assay ................................................... 18
5.1.1 Determination of Melting Temperature (Tm)
of Isolated DNA .................................................................. 18
5.2 Theory .............................................................................................. 19
5.3 Objective .......................................................................................... 19
5.4 Materials ........................................................................................... 19
5.4.1 Chemicals ............................................................................. 19
5.4.2 Equipments ........................................................................... 19
5.4.3 Glassware ............................................................................. 19
5.4.4 20 X SSC Buffer to make 1L use ......................................... 19
5.4.5 Experimental Protocao; for Characterization of DNA by
Spectrophotometeric Assay .................................................. 20
5.4.6 Experimental Protocol for Melting Point Determination .... 20
5.5 Results .............................................................................................. 21
5.6 Discussion ........................................................................................ 21
5.7 Questions ........................................................................................... 21
5.8 References ......................................................................................... 22
6 Primer Design ………………………………………….…………………… 23
6.1 General Considerations in Primer Design .......………………………. 23
6.1.1 Specificity …………………………………………….…… 23
6.1.2 The distance between the primers …………………………. 24
6.1.3 Melting Temperature (Tm) ……………….…………….…. 24
6.2 General points should be considered for Tm ……….………………… 25
6.3 Primer length ……………………………….………………………… 25

Molecular Biology - BCH 361 Biochemistry Department
VII
6.4 Product size …………………………………………………………… 25
6.5 Primer Dimer ………………………………………………………… 26
6.6 Hairpins ……………………………………………………………… 26
6.7 Primer Dimers………………………………………………………… 26
6.8 G/C content …………………………………………………………… 27
6.9 G/C clamp …………………………………………………………… 27
6.10 Web Based Tools for Primer Design ………………………………… 28
6.10.1 How to find a primer …………………………………….. 28
6.11 Discussion …………………………………………………………….. 30
6.12 References ……………………………………………………………. 31
7 PCR (Polymerase Chain Reaction) Optimization
(Annealing Temperature) ........................................................................ 32
7.1 Introduction ...................................................................................... 32
7.2 Theory .............................................................................................. 32
7.2.1 The Amplification: The Cycling Reactions ......................... 33
7.2.2 Denaturation at Around 94°C ................................................ 33
7.2.2.1 Annealing of the Primer to the Template
at around 54°C ....................................................... 33
7.2.2.2 Extension at around 72°C ..................................... 33
7.3 Objective ........................................................................................... 33
7.4 Materials ............................................................................................ 33
7.4.1 Chemicals and Materials ....................................................... 33
7.4.2 Equipments ............................................................................ 34
7.4.3 Setting Up PCR ...................................................................... 34
7.4.4 PCR Cycling ......................................................................... 35
7.4.5 Verifying PCR Amplification ................................................ 35
7.5 Results ............................................................................................... 35
7.6 Discussion ........................................................................................ 35
7.7 Questions .......................................................................................... 36
7.8 References ........................................................................................ 36
Molecular Biology - BCH 361 Biochemistry Department
VIII
8 Preparation of DNA for more advanced Applications
(Cut from Gel and Purity) ....................................................................... 37
8.1 Introduction ...................................................................................... 37
8.2 Objective .......................................................................................... 37
8.3 Theory .............................................................................................. 37
8.4 Materials .......................................................................................... 37
8.5 Experimental Procedure ................................................................. 37
8.6 Results ............................................................................................. 39
8.7 Discussions ...................................................................................... 39
8.8 Questions ......................................................................................... 39
8.9 References ....................................................................................... 39
9 Digestion of DNA with Restriction Enzymes Bamhi under different Salt
Concentration ............................................................................... 40
9.1 Introduction ....................................................................................... 40
9.2 Theory .............................................................................................. 40
9.3 Objective ........................................................................................... 41
9.4 Materials ........................................................................................... 41
9.4.1 Materials ............................................................................... 41
9.4.2 Equipment ............................................................................ 41
9.4.3 Glassware and Disposables .................................................. 41
9.5 Experimental Protocol ......................................................................... 41
9.6 Results ............................................................................................... 42
9.7 Discussion ........................................................................................ 42
9.8 References ........................................................................................ 42
10 Electrophoretic
10.1 Separation of DNA and DNA Fragmentsin Agarose Gel. ............... 43
10.1.1 Introduction ........................................................................ 43
10.1.2 Theory ................................................................................ 43
10.1.3 Objectives ........................................................................... 44
10.1.4 Materials ............................................................................ 44
10.1.4.1 Chemicals ........................................................... 44
10.1.4.2 Equipment .......................................................... 44
10.1.4.3 Plastic Ware ....................................................... 44

Molecular Biology - BCH 361 Biochemistry Department
IX
10.1.4.4 Preparation of Solutions ..................................... 44
10.1.5 Experimental Procedure .................................................... 45
10.1.5.1 Pouring the Gel .................................................. 45
10.1.5.2 Preparation of Samples ...................................... 45
10.1.5.3 Applying Samples and Running Gel
Electrophoresis ................................................... 46
10.1.5.4 Visual Analysis of the Gel ................................. 46
10.1.6 Results ............................................................................... 46
10.1.7 Discussion ......................................................................... 47
10.1.8 Questions ........................................................................... 47
10.1.9 References ........................................................................... 47
10.2 Separation of PCR Product in Agarose Gel ..................................... 47
10.2.1 Introduction ........................................................................ 47
10.2.2 Theory ............................................................................... 47
10.2.3 Objective of the Experiment ............................................. 47
10.2.4 Materials Required ............................................................. 48
10.2.4.1 Chemicals ........................................................... 48
10.2.4.2 Equipment .......................................................... 48
10.2.4.3 Plastic Ware ........................................................ 48
10.2.4.4 Preparation of Solutions ...................................... 48
10.2.5 Experimental Procedure .................................................... 48
10.2.6 Results ................................................................................ 50
10.2.7 Discussion ......................................................................... 50
10.2.8 Questions ........................................................................... 50
10.2.9 References .......................................................................... 50
10.3 Separation of Plasmid and Genomic DNA in Agarose Gel .............. 51
10.3.1 Introduction ......................................................................... 51
10.3.2 Theory ............................................................................... 51
10.3.3 Objectives ........................................................................... 51
10.3.4 Materials ............................................................................. 52
10.3.4.1 Chemicals ............................................................ 52
10.3.4.2 Equipment ........................................................... 52
10.3.4.3 Plastic Ware ........................................................ 52

Molecular Biology - BCH 361 Biochemistry Department
X
10.3.4.4 Preparation of Solutions ...................................... 52
10.3.5 Experimental Procedure ..................................................... 52
10.3.6 Results ................................................................................ 53
10.3.7 Discussion ......................................................................... 53
10.3.8 Questions ........................................................................... 53
10.4 Effect of DNA shape on DNA Separation on Agarose Gel ............. 53
10.4.1 Introduction ....................................................................... 53
10.4.2 Theory ............................................................................... 54
10.4.3 Objectives of the Experiment ............................................ 54
10.4.4 Materials ........................................................................... 54
10.4.4.1 Chemicals ........................................................... 54
10.4.4.2 Equipment ........................................................... 54
10.4.4.3 Plastic Ware ....................................................... 54
10.4.4.4 Preparation of Solutions ..................................... 54
10.4.5 Experimental Procedure ..................................................... 55
10.4.6 Results ................................................................................ 55
10.4.7 Discussion .......................................................................... 55
10.4.8 Questions ........................................................................... 55
10.4.9 References ......................................................................... 55
11 RNA Extraction ......................................................................................... 56
11.1 RNA Extraction ............................................................................... 56
11.1.1 Introductin .......................................................................... 56
11.1.2 Theory .............................................................................. 56
11.1.3 Objective ............................................................................ 56
11.1.4 Materials ............................................................................. 56
11.1.4.1 Materials .............................................................. 56
11.1.4.2 Equipment .......................................................... 57
11.1.4.3 Glassware ............................................................ 57
11.1.5 Experimental Protocol ........................................................ 57
11.1.6 Results ............................................................................... 58
11.1.7 Discussion .......................................................................... 58
11.1.8 References .......................................................................... 58
11.2 RNA Electrophoresis ...................................................................... 59
Molecular Biology - BCH 361 Biochemistry Department
XI
11.2.1 Introduction ........................................................................ 59
11.2.2 Theory .............................................................................. 59
11.2.3 Objective ........................................................................... 59
11.2.4 Materials ............................................................................ 59
11.2.5 Experimental Procedure .................................................... 60
11.2.5.1 Pouring the Gel ................................................... 60
11.2.5.2 Running and analysing formaldehyde agarose
gels for RNA analysis RNA loading buffer ....... 61
11.2.5.3 Electrophoresis buffers ....................................... 61
11.2.5.4 Sample preparation for Electrophoresis ............. 62
11.2.5.5 Electrophoreis .................................................... 62
11.2.5.6 Precautions ......................................................... 63
11.2.5.7 Visualization ....................................................... 63
11.2.6 Results .............................................................................. 63
11.2.7 Discussions ......................................................................... 63
11.2.8 Questions ............................................................................ 63
11.2.9 References ......................................................................... 63
12 DNA Finger Printing ............................................................................... 64
12.1 Introduction ..................................................................................... 64
12.2 Theory .............................................................................................. 64
12.3 Objective .......................................................................................... 64
12.4 Materials .......................................................................................... 65
12.4.1 Chemicals ........................................................................... 65
12.4.2 Equipment .......................................................................... 65
12.4.3 Plastic Ware ....................................................................... 65
12.4.4 Preparation of Solutions .................................................... 65
12.5 Experimental Procedure ................................................................. 65
12.5.1 Digestion of DNA Samples by Alu-1 Enzyme ................. 65
12.5.2 Separation the digested DNA on Agarose
Electrophoresis Gel .......................................................... 66
12.6 Results ............................................................................................ 66
12.7 Discussion ........................................................................................ 66
12.8 Questions ........................................................................................ 67

Molecular Biology - BCH 361 Biochemistry Department
XII
12.9 References ....................................................................................... 67

Molecular Biology - BCH 361 Biochemistry Department
1
1. INTRODUCTION TO MOLECULAR BIOLOGY LABORATORY
"Molecular Biology" is the study of biology at the molecular level and is
concerned with the understanding of the genetic material. The interactions between the
nucleic acids (DNA and RNA) and synthesis of proteins, and how these processes
(replication, transcription, translation) are regulated, form the basis of molecular
biology. Since the late 1950s and early 1960s, Molecular Biologists have learned to
characterize, isolate, and manipulate these molecular components. The techniques used
for these studies are referred to as "Techniques of Molecular Biology".
The first step is to isolate DNA or RNA, for these techniques to be carried out.
The DNA or RNA can be obtained either from the cells (e.g. plasmid DNA, genomic
DNA, mRNA) or can be prepared [complimentary DNA (cDNA)]. Various methods are
used for characterization and manipulation of the isolated DNA or RNA. These include:
i) Purification of DNA or RNA (by electroelution).
ii) Determining the purity of nucleic acids by spectrophotometer method.
iii) Determining the DNA composition by measuring its melting temperature
(Tm). To calculate the GC content of the sample DNA.
iv) Digesting DNA samples with different restriction enzymes
v) Determining the size of the DNA and RNA fragments by running on agarose
gel electrophoresis.
vi) Amplifying the DNA fragments of interest ( by polymerase chain reaction;
or by cloning)
In addition, a number of techniques are available for analyzing DNA. These
include various mutation detection methods, such as amplification, denaturing gradient
gel electrophoresis (DGGE), single stranded conformation polymorphism (SSCP), dot
blot analysis, amplification mutation refractory system (ARMS), and reverse dot blot,
chemical cleavage mismatch, Southern blotting, DNA sequencing and others. In this
course some of the techniques mentioned above will be carried out.
The students should be thoroughly aware of the following lab safety methods in
molecular biology and understand the steps to be adopted for conducting successful
molecular biology experiment.
1.1. General Lab Safety in Molecular Biology
In molecular biology lab a number of chemicals are used that are hazardous and
can cause severe burn and long term sickness requiring immediate medical attention.
Hence, before conducting an experiment it is essential to know the safety precautions
and risk associated with handling the chemical compounds. The following chemicals
are especially noteworthy:
Phenol: cause severe burns.
Molecular Biology - BCH 361 Biochemistry Department
2
Acryl amide: potential neurotoxin.
Ethidium bromide: a strong carcinogen
In order to assure the safe handling of the chemicals, always follow the following
safety precautions:
1. Wear gloves while handling hazardous chemicals
2. Never mouth pipettes any chemicals
3. Always use fresh tips or pipette for each solution and samples to avoid
contamination of the samples and the solutions.
4. If any chemical is accidently spilt on the skin, immediately rinse with a lot
of water and inform the instructor.
5. Always discard the waste in appropriate waste disposal as instructed by the
instructor.
1.1.1 Ultra Violet Light
UV lamp will be used to visualize the DNA bands on the
gel following electrophoresis. Direct exposure to UV light can cause
acute eye irritation and skin allergy. Since retina cannot detect UV light,
serious eye damage may be caused if exposed to UV, therefore always
wear safety goggles or eye protection when using UV lamps.
1.1.2 Electricity
The voltage used for electrophoresis is sufficient to cause
electrocution. Cover the buffer reservoir during electrophoresis and
always switch off the power supply and unplug the lead before removing
the gel from electrophoresis unit.
1.2. General Tips for Conducting a safe and successful experiment.
a) Always keep the work area clean of any unwanted tubes, beakers and dirty
dishes.
b) All reagents should be marked clearly with reagent name and concentration.
c) All sample3s should be numbered and labeled correctly with the names and
dates.
d) Make sure that after use the reagents and chemical are placed in the fridge or
freezer as required.
e) In bacterial cultures make sure the reagents and dishes are autoclaved
properly and label using autoclave taps.
f) Always mark the bottom of the bacterial culture dishes and not the lid, as the
lids can easily be mixed up.
Molecular Biology - BCH 361 Biochemistry Department
3
1.3. Preparation of Solutions
1.3.1. Calculations to prepare molar, % and X solutions
A Molar Solution is one in which 1 liter of solution contains the
number of grams equal to its molecular weight e.g. to make up 100 ml of
a 5M NaCl solution = 58.456 (mw of NaCl) g/mol x 5 moles/liter x 0.1
liter = 29.29 g in 100 ml of solution.
Percent Solution: w/v weight (gms) in 100ml. e.g. to make a
0.7% solution of agarose in TBE buffer, weigh 0.7 of agarose and bring
up volume to 100 ml with TBE buffer. Percentage v/v is = volume (ml)
in 100ml.
X Solution: Many enzyme buffers are prepared as concentrated
solutions. e.g. 5X, 10X (five or ten times the concentrated of the working
solution). These concentrated solutions are then diluted accordingly to
give the final concen-tration of 1X of working buffer. e.g. to set up a
restriction digestion in 25 μl of IX buffer, add 2.5 μl of a 10X buffer, the
other reaction components, and water to a final volume of 25 μl.
1.3.2. Preparation of Working Solution from the Concentrated Solution
Many buffers in molecular biology require same concentration
but at different times. To avoid having to make every buffer from
scratch, it is useful to prepare several concentrated stock solutions and
dilute as needed. e.g. to prepare 100 ml of TE buffer (10 mM Tris, 1 mM
EDTA), combine 1 ml of a 1 M Tris solution and 0.2 ml of 0.5 M EDTA
and 98.8 ml sterile water. The following is useful for calculating amounts
of stock solution needed:
ci x vi = cf x vf , where ci = initial concentration, or conc of stock
solution; vi = initial vol, or amount of stock solution needed cf = final
concentration, or conc of desired solution; vf = final vol, or volume of
desired solution.
1.3.3. Tips for making solutions for molecular biology
a) Careful handling and measurement of chemicals is crucial for a
successful experiment in molecular biology. Following tips will help
to make a solution:
b) Weigh out correctly the desired amount of chemicals. When using
amount less than 0.1g use analytical balance.
c) Prepare all solution with double distilled water.
d) Autoclave all the solution for bacterial culture and where ever
necessary

Molecular Biology - BCH 361 Biochemistry Department
4
e) Some solutions cannot be autoclaved, for example, SDS. These
should be filter sterilized through a 0.22 μm or 0.45 μm filters.
f) Media for the bacterial cultures should be autoclaved the same day
prepared. Never prepare bacterial culture one or two days in advance
of autoclaving.
g) Solid media for bacterial cultures can be made in advance,
autoclaved and stored in a bottle. When needed the microwave can
be melted and additional substance like antibiotics can be added and
poured onto the culture plate.
h) Make sure the lid of the bottle of bacterial culture, is loose while
placing into the microwave oven as the tight lid bottle can explode in
the microwave while heating.
1.4. Glassware and Plastic Ware:
Glass and plastic ware used for molecular biology must be scrupulously clean.
Dirty test tubes, bacterial contamination and traces of detergent can inhibit reactions or
degrade nucleic acid.
Glassware should be rinsed with distilled water and autoclaved or baked at
1500C for 1 hour. For experiments with RNA, glassware and solutions should be treated
with diethylpyrocarbonate to inhibit RNases which can be resistant to autoclaving.
Plastic ware such as pipettes and culture tubes are often supplied sterile. Tubes made of
polypropylene are turbid and are resistant to many chemicals, like phenol and
chloroform; polycarbonate or polystyrene tubes are clear and not resistant to many
chemicals. Make sure that the tubes in use are resistant to the chemicals used in the
experiment. Micropipette tips and microfuge tubes should be autoclaved before use.

Molecular Biology - BCH 361 Biochemistry Department
5
2. PREPARATION OF GENOMIC DNA FROM BLOOD
2.1 Introduction
There are different protocols and several commercially available kits that can be
used for the extraction of DNA from whole blood. This procedure is one routinely used
both in research and clinical service provision and is cheap and robust. It can also be
applied to cell pellets from dispersed tissues or cell cultures (omitting the red blood
lysis step).
2.2 Theory
Successful nucleic acid isolation protocols have been published for nearly all biological
materials. They involve the physical and chemical processes of tissue homogenisation (to
increase the number of cells or the surface area available for lysis), cell permeabilisation, cell
lysis (using hypotonic buffers), removal of nucleases, protein degradation, protein precipitation,
solubilisation of nucleic acids and finally various washing steps. Cell permeabilisation may be
achieved with the help of non-ionic (non DNA-binding) detergents such as SDS and Triton.
2.3 Objective
To isolate pure DNA from blood.
2.4 Materials
2.4.1 Chemicals
1 EDTA
2 NaOH
3 Tris-HCl
4 Sucrose
5 MgCl2
6 Triton X
7 Sodium dodecyl sulphate.
8 NaCl
9 Sodium perchlorate
10 TE Buffer
11 Chloroform
12 Ethanol
2.4.2 Equipments
1. Waterbath set at 65°C.
2. Centrifuge tubes (15 mL; Falcon).
3. Microfuge (1.5 mL) tubes.

Molecular Biology - BCH 361 Biochemistry Department
6
4. Tube roller/rotator.
2.4.3 Glassware
1 Glass Pasteur pipetts, heated to seal the end and curled to form a
“loop” or “hook” for spooling DNA.
2 Tubes
2.4.4 Preparation of Solutions
This method uses standard chemicals that can be obtained from any
major supplier, e.g.Sigma;
1. Ethylene diamine tetra acetate (EDTA) (0.5 M), pH 8.0: Add 146.1 g
of anhydrous EDTA to 800 mL of distilled water. Adjust pH to 8.0
with NaOH pellets (this will require about 20 g). Make up to 1 L
with distilled water. Autoclave at 15 p.s.i. for 15 min.
2. 1 M Tris-HCl, pH 7.6: Dissolve 121.1 g of Tris base in 800 mL of
distilled water. Adjust pH with concentrated HCl (this requires about
60 mL). CAUTION: the addition of acid produces heat. Allow
mixture to cool to room temperature before finally correcting pH.
Make up to 1 L with distilled water. Autoclave at 15 p.s.i. for 15 min.
3. Reagent A: Red blood cell lysis solution: 0.01M Tris-HCl pH 7.4,
320 mM sucrose, 5 mM MgCl2, 1% Triton X 100.
4. Add 10 mL of 1 M Tris, 109.54 g of sucrose, 0.47 g of MgCl2, and
10 mL of Triton X-100 to 800 mL of distilled water. Adjust pH to
8.0, and make up to 1 L with distilled water. Autoclave at 10 p.s.i. for
10 min (see Note 1).
5. Reagent B: Cell lysis solution: 0.4 M Tris-HCl, 150 mM NaCl, 0.06
M EDTA, 1% sodium dodecyl sulphate (SDS), pH 8.0. Take 400 mL
of 1 M Tris (pH 7.6), 120 mL of 0.5 M EDTA (pH 8.0), 8.76 g of
NaCl, and adjust pH to 8.0 with NaoH . Make up to 1 L with distilled
water. Autoclave for 15 min at 15. p.s.i. After autoclaving, add 10 g
of SDS.
2.5 Experimental Protocol
2.5.1 Blood Collection
Draw blood in EDTA-containing Vacutainer tube by venipuncture.
Store at room temperature or 40 C and extract within the same working
day.
2.5.2 DNA Extraction
To extract DNA from cell cultures or disaggregated tissues, omit
steps 1 through 3.

Molecular Biology - BCH 361 Biochemistry Department
7
1. Place 3 mL of whole blood in a 15-mL falcon tube.
2. Add 12 mL of reagent A.
3. Mix on a rolling or rotating blood mixer for 4 min at room
temperature.
4. Centrifuge at 3000g for 5 min at room temperature.
5. Discard supernatant without disturbing cell pellet. Remove remaining
moisture by inverting the tube and blotting onto tissue paper.
6. Add 1 mL of reagent B and vortex briefly to resuspend the cell pellet.
7. Add 250 μL of 5 M sodium perchlorate and mix by inverting tube
several times.
8. Place tube in water bath for 15 to 20 min at 65°C.
9. Allow to cool to room temperature.
10. Add 2 mL of ice-cold chloroform.
11. Mix on a rolling or rotating mixer for 30 to 60 min.
12. Centrifuge at 2400g for 2 min.
13. Transfer upper phase into a clean falcon tube using a sterile pipette.
14. Add 2 to 3 ml of ice-cold ethanol and invert gently to allow DNA to
precipitate.
15. Using a freshly prepared flamed Pasteur pipette spool the DNA onto
the hooked end.
16. Transfer to a 1.5-mL Eppendorf tube and allow to air dry.
17. Resuspend in 200 μL of TE buffer.
As a final step in nucleic acid isolation, the yield and purity of the
extracted nucleic acid may need to be determined.
2.6 Results
Molecular Biology - BCH 361 Biochemistry Department
8
2.7 Discussion
2.8 Questions
1. What do you think is the purpose of the cell lysis solution?
2. What is the purpose of ethanol?
3. Isolated DNA should be free from contaminating protein, heme and other
cellular macromolecule, what precautions did you take to solve this
situation?
4. Heme, the non-protein iron component of hemoglobin, is a primary
contaminant of DNA from blood preparations, how can you detect this type
of contaminant in the isolated DNA?
5. In this procedure, if you didn’t have sodium perchlorate, what other
chemical can you use instead?
2.9 References
1. Bartlett JMS and Stirling D, Methods in Molecular Biology, second edition
(226):29-33
2. Helms C. Salting out Procedure for Human DNA extraction. In: The Donis-
Keller Lab - Lab Manual Homepage [online]. 24 April 1990. [cited 19 Nov.
2002; 11:09 EST]. Available from:
http://hdklab.wustl.edu/lab_manual/dna/dna2.html.
3. Epplen JE and Lubjuhn T. DNA profiling and DNA fingerprinting.
Birhkhauser Verlag, Berlin. 1999; p.55.

Molecular Biology - BCH 361 Biochemistry Department
9
3. PREPARATION OF GENOMIC DNA FROM PLANT TISSUES
3.1 Introduction
DNA extraction from plant tissue can vary depending on the material used.
Essentially any mechanical means of breaking down the cell wall and membranes to
allow access to nuclear material, without its degradation is required. For this, usually an
initial grinding step with liquid nitrogen is employed to break down cell wall material
and allow access to DNA while cellular enzymes and other biochemicals are
inactivated. Once the tissue has been sufficiently ground, it can then be resuspended in a
suitable buffer, such as CTAB. In order to purify DNA, insoluble particulates are
removed by centrifugation, while soluble proteins and other material are separated
through mixing with chloroform and centrifugation. DNA must then be precipitated
from the aqueous phase and washed thoroughly to remove contaminating salts. The
purified DNA is then resuspended and stored in TE buffer or sterile distilled water. This
method has been shown to give intact genomic DNA from plant tissue. To check the
quality of the extracted DNA, a sample is run on an agarose gel, stained with ethidium
bromide, and visualised under UV light.
3.2 Theory
Method used for extraction of DNA from the plants is different from extracting
DNA from animal sources as the plant contains hard cellulose cell wall. A number of
protocol for isolating DNA from plant sources are available which ranges from using
simple chemicals in the lab to a more sophisticated Isolation protocol by using kits. The
main goal of developing all these protocol is to search, for a more efficient means of
extracting DNA of both higher quality and yield. However the fundamental of DNA
extraction remains the same. DNA must be purified from cellular material in a manner
that prevents degradation. Because of this, even crude extraction procedures can still be
adopted to prepare a sufficient amount of DNA to allow for multiple end uses.
3.3 Objective
To isolate and purify plant genomic DNA
3.4 Materials
3.4.1 Materials
CTAB buffer
Microfuge tubes
Mortar and Pestle
Liquid Nitrogen
Microfuge
Absolute ethanol (ice cold)
70 % Ethanol (ice cold)
Molecular Biology - BCH 361 Biochemistry Department
10
7.5 M Ammonium acetate
550 C water bath
Chloroform: Iso Amyl alcohol (24:1)
Water (sterile)
3.4.2 CTAB buffer 100ml
2.0 g CTAB (Hexadecyl trimethyl-ammonium bromide)
10.0 ml 1 M Tris pH 8.0
o ml 0.5 M EDTA pH 8.0 (EDTA Di-sodium salt)
28.0 ml 5 M NaCl
40.0 ml H2O
1g PVP 40 (polyvinyl pyrrolidone (vinylpyrrolidine homopolymer)
Mw 40,000)
Adjust all to pH 5.0 with HCl and make up to 100 ml with H2O.
3.4.3 1 M Tris pH 8.0
Dissolve 121.1 g of Tris base in 800 ml of H2O. Adjust pH to 8.0 by
adding 42 ml of concentrated HCl. Allow the solution to cool to room
temperature before making the final adjustments to the pH. Adjust the volume to
1 L with H2O. Sterilize using an autoclave.
3.5 Experimental Protocol
1. Grind 200 mg of plant tissue to a fine paste in approximately 500 μl of
CTAB buffer.
2. Transfer CTAB/plant extract mixture to a microfuge tube.
3. Incubate the CTAB/plant extract mixture for about 15 min at 55o
C in a
recirculating water bath.
4. After incubation, spin the CTAB/plant extract mixture at 12000 g for 5 min
to spin down cell debris. Transfer the supernatant to clean microfuge tubes.
5. To each tube add 250 μl of chloroform: iso amyl alcohol (24:1) and mix the
solution by inversion. After mixing, spin the tubes at 13000 rpm for 1 min.
6. Transfer the upper aqueous phase only (contains the DNA) to a clean
microfuge tube.
7. To each tube add 50 μl of 7.5 M ammonium acetate followed by 500 μl of
ice cold absolute ethanol.
8. Invert the tubes slowly several times to precipitate the DNA. Generally the
DNA can be seen to precipitate out of solution. Alternatively the tubes can

Molecular Biology - BCH 361 Biochemistry Department
11
be placed for 1 hr at -20 o C after the addition of ethanol to precipitate the
DNA.
9. Following precipitation, the DNA can be pipetted off by slowly
rotating/spinning a tip in the cold solution. The precipitated DNA sticks to
the pipette and is visible as a clear thick precipitate. To wash the DNA,
transfer the precipitate into a microfuge tube containing 500 μl of ice cold 70
% ethanol and slowly invert the tube.
10. Repeat (alternatively the precipitate can be isolated by spinning the tube at
13000 rpm for a minute to form a pellet. Remove the supernatant and wash
the DNA pellet by adding two changes of ice cold 70 % ethanol).
11. After the wash, spin the DNA into a pellet by centrifuging at 13000 rpm for
1 min.
12. Remove all the supernatant and allow the DNA pellet to dry (approximately
15 min). Do not allow the DNA to over dry or it will be hard to re-dissolve.
13. Resuspend the DNA in sterile DNase free water (approximately 50-400 μl
H2O; the amount of water needed to dissolve the DNA can vary, depending
on how much is isolated). RNaseA (10 μg/ml) can be added to the water
prior to dissolving the DNA to remove any RNA in the preparation (10 μl
RNaseA in 10ml H2O).
14. After resuspension, the DNA is incubated at 65o C for 20 min to destroy any
DNases that may be present and stored at 4o C.
15. Agarose gel electrophoresis of the DNA will show the integrity of the DNA,
while spectrophotometry will give an indication of the concentration and
purity of isolated DNA.
3.6 Results
3.7 Discussion
1. DNA from other sources like mitochondria and chloroplast can precipitate
out with your genomic or nuclear DNA, Discuss How you can overcome this
problem?
2. What are the sources of contamination of DNA in your sample?
3. What precautions you should use while isolating DNA?
4. Discuss your results and discuss how you can make this experiment more
effective?
3.8 References

Molecular Biology - BCH 361 Biochemistry Department
12
1. Doyle JJ, Doyle JL A rapid DNA isolation procedure for small quantities of
fresh leaf tissue. Phytochemical Bullettin 1987; 19: 11-15.

Molecular Biology - BCH 361 Biochemistry Department
13
4. PLASMID ISOLATION AND PURIFICATION
4.1 Introduction
Bacterial plasmids are closed circular molecules of double-stranded DNA that
range in size from 1 to >200 kb. They are found in a variety of bacterial species, where
they behave as additional genetic units, inherited and replicated independently of the
bacterial chromosome. However, they rely upon enzymes and proteins provided by the
host for their successful transcription and replication. Plasmids often contain genes that
code for enzymes that can be advantageous to the host cell in some circumstances. The
encoded enzymes may be involved in resistance to, or production of, antibiotics,
resistance to toxins found in the environment e.g., complex organic compounds, or the
production of toxins by the bacteria itself. Once purified, plasmid DNA can be used in a
wide variety of downstream applications such as sequencing, Polymerase Chain
Reaction (PCR), expression of proteins, transfection, and gene therapy.
4.2 Theory
Plasmid DNA is introduced into bacteria by the process of transformation.
Transformation is inefficient and the plasmids become stably established in only a small
number of bacterial populations. Selectable markers carried by the plasmid enable the
transformed bacteria to be identified. The markers typically provide a specific resistance
(ability to grow in the presence of) to antibiotics such as ampicillin or kanamycin. There
are numerous method (and kits) available for the isolation of plasmid DNA from a
transformed bacteria culture. In this experiment, alkaline lyses, together with treatment
with the detergent sodium dodecyl sulphate (SDS), a method adapted from Protocol 1,
Molecular-cloning [1], is used for isolating plasmids.
Sodium dodecyl sulphate is a strong anionic detergent, which lyses bacterial cell
membrane, separates chromosomal DNA from proteins and releases plasmid DNA into
the supernatant, at alkaline pH. The alkaline solution acts to disrupt base pairing which
has no effect on the closed circular plasmid DNA. The degraded chromosomal DNA
and protein, along with the components of the cell wall form large aggregated
complexes that are precipitated during the plasmid isolation and removed by
centrifugation.
4.3 Objective
To isolate and handling plasmid DNA.
4.4 Materials
4.4.1 Buffers/Solutionss
4.4.1.1 Alkaline Lysis Solution I
i. 50 mM glucose
ii. 25 mM Tric HCl (pH 8.0)

Molecular Biology - BCH 361 Biochemistry Department
14
iii. 10 mM EDTA (pH 8.0)
(Prepare in batches ~100 ml and autoclave for 15 min at 15 psi
(1.05kg2/cm) on liquid cycle and store at 4
0C).
4.4.1.2 Alkaline Lysis Solution II
i) 0.2 N NaOH (freshly diluted from 10 N stock).
ii) 1% (w/v) SDS (prepare solution and store at room
temperature).
4.4.1.3 Alkaline Lysis Solution III
i) 5 M potassium acetate (60 ml).
ii) Glacial acetic acid (11.5 ml)
iii) H2O 28.5 ml
iv) The resulting solution is 3 M with respect to potassium and
5 M with respect to acetate.
v) Store the solution at 4oC and transfer to an ice bucket just
before use.
4.4.2 LB Broth (Luria - Bertani Medium)
Per Liter:
To 950 ml of deionized H2O, add:
Tryptone 10 g
Yeast extract 5 g
NaCl 10 g
Shake until the solutes dissolve. Adjust pH to 7.0 with 5 N NaCl (~0.2
ml). Adjust volume to 1 L with deionized H2O. Sterilize by autoclaving
for 20 minutes at 15 psi (1.05kg2/cm) on liquid cycle.
4.4.3 Ampicillin (Amp)
4.4.4 Bacterial Colony:
4.4.5 Apparatus and Solutions
4.4.5.1 Per Group
Tooth picks
Gloves
Vortexer
Vacuum line and aspirator
Balance

Molecular Biology - BCH 361 Biochemistry Department
15
Ice bucket and ice
Sharpie marker
8 Microfuge tubes (1.5 ml) and tube rack
2x 10 ml test tubes with loose fitting lids
2 x 2ml LB broth
1000 μl Pipetteman and blue tips
200 μl Pipettman and yellow tips
Sterile water (or TE)
Solutions I, II and III
4.4.5.2 Solution I and III on Ice
Set of Pipettman pipettes (automated) and tips
Ethanol
250 ml flask and kim wipes
Graduated cylinder
Dry waste beaker
Liquid waste beaker
4.5 Experimental Protocol
4.5.1 Preparation of Cells
Rich media with the correct antibiotic for selection is used in the
bacterial culture. To ensure that the culture is adequately aerated, use a
flask/tube with a volume at least 4 times greater than the volume of the culture,
cap the tube loosely and incubate with vigorous agitation.
1. Prepare two test tubes containing 2 ml of LB broth with a final
concentration of 100 µg/ml Amp. (The stock [Amp] = 50 mg/ml in
water).
2. Inoculate each with a single colony of bacteria from the given
sample.
3. Incubate overnight at 37ºC.
4.5.2 Cell Lyses and Recovery of Plasmid DNA
1. Remove 1.5 ml aliquot of the culture to a microcentrifuge tube.
Repeat for the second culture into a second microcentrifuge tube.
Make sure that the tubes are labeled.
2. Centrifuge at 4ºC, maximum speed for 30 seconds in a microfuge.
Label the unused portions of the original culture and store at 4ºC.

Molecular Biology - BCH 361 Biochemistry Department
16
3. After centrifugation, remove the medium by aspiration (as shown in
Figure 1, below), leaving the bacterial pellet as dry as possible.
4. Resuspend each bacterial pellet in 100 µl of ice cold Alkaline Lysis
Solution I. Vortex vigorously.
5. Add 200 µl of freshly prepared Alkaline Lysis Solution II to each
bacterial suspension. Invert the tube rapidly 5 times. Do not vortex!
Store the tube on ice.
6. Add 150 µl ice cold Alkaline Lysis Solution III to each microfuge
tube. Invert the tube 3 to 5 times. Incubate tubes on ice for 3 to 5
minutes.
7. Centrifuge the bacterial lysate at maximum speed, 4ºC for 2 minutes.
Transfer the supernatant to a fresh labeled tube.
8. Add 2 volumes of ethanol at room temperature. Vortex and allow
tubes to stand at room temperature for 2 minutes
9. Centrifuge at maximum speed , 4ºC for 5 minutes. Orient the
microfuge tubes so that the plastic hinges point outwards. The
precipitate will collect on inside surface of the tube furthest from the
center of rotation.
Figure 1: Aspiration of supernatant (From Sambrook,et al 2001).
10. Remove the supernatant by gentle aspiration. As shown in Figure 1.
11. Stand the tube in an inverted position over a paper towel to allow all
fluid to drain away.
12. Add 1ml 70% ethanol, invert the closed tube several times.
Centrifuge at maximum speed, 4ºC for 5 minutes.
13. Remove the supernatant by gentle aspiration.

Molecular Biology - BCH 361 Biochemistry Department
17
14. Remove any beads of ethanol from the sides of the tube. Leave tube
open at room temperature (upright position) until residual ethanol has
evaporated (5 to 10 minutes).
15. Dissolve the pellet in 25 µl sterile water or TE and vortex the
solution gently for a few seconds. The DNA can be stored at -20ºC.
4.6 Results
4.7 Discussion
In the discussion section you need to answer the following questions and discuss
your results.
1. What is the importance of antibiotic gene in the plasmid? How does it help
you in isolation and purification protocol for plasmid isolation?
2. Discuss the difficulties you have encountered in isolation and purification
protocol.
3. Discuss the advantage and disadvantages of the particular plasmid you have
taken for isolation?-
4. Discuss the importance of copy number of plasmid. How does it effect the
isolation protocol?
4.8 References
1. Sambrook J, Fritsch EF & Maniatis T. Molecular Cloning. A laboratory
Manual. 3rd
Edition. Cold Spring Harbor Laboratory Press. New York, 2001

Molecular Biology - BCH 361 Biochemistry Department
18
5. CHARACTERIZATION OF THE DNA BY: (1) THE
SPECTROPHOTOMETRIC ASSAY;
(2) THE MELTING TEMPERATURE (TM)
5.1 Introduction
The isolated and purified DNA can be characterized by different ways. In this
experiment the purity and concentration of DNA obtained in the last experiment will be
determined and the DNA will be characterized by measuring its melting temperature
(Tm).
5.1.1 Determination of DNA purity and concentration by spectro-
photometric assay:
A simple method for determining nucleic acid extraction efficiency and
purity is via the use of UV spectrophotometer. Single stranded DNA, double
stranded DNA and RNA have specific absorption coefficients of 0.027, 0.020
and 0.025 μg per ml per cm at 260 nm, respectively. Moreover, the absorption
ratio of 260/280 nm is an indicator for DNA purity. RNA, protein or phenol
contamination alters the ratio. Proteins have a maximum adsorption at 280 nm,
and when the ratio is below 1.8 or above 2.0, a significant amount of impurities
is still present within the sample. Highly purified samples of DNA have a
260/280 nm ratio of 1.8–1.9 whilst highly purified samples of RNA have a
260/280 nm ratio of 1.9–2.0. Many spectrophotometers will automatically
calculate the 260/280 nm ratio and quantity of nucleic acid. Phenol/urea
contamination may be assessed at 230 nm. The spectrophotometer is calibrated
with a blank prior to measuring nucleic acid concentrations. This blank should
comprise the solution in which the nucleic acid is resuspended in (e.g. nuclease
free water, Tris EDTA buffer) only. Disposable or cleaned quartz cuvettes must
be used for each new measurement. Electrophoresis of a small sample of the
extract on an agarose gel along with molecular weight marker (ladder) and/or
known quantities of nucleic acid, can also be used for assessing the efficiency of
nucleic acid extraction.involves the. Molecular weight markers with bands
comprising a known quantity of DNA are available and can be purchased.
5.1.2 Determination of melting temperature (Tm) of isolated DNA.
When DNA is heated it denatures or melts i.e. the double stranded DNA
separates into its single stranded components. When the temperature is
decreased the strands re-associate to form the double stranded molecule
(renaturation). The melting temperature (Tm) is defined as the temperature at
which half of the DNA strands have melted i.e half are in double-helical state
and half are in the "random-coil" states. The melting temperature depends on the
nucleotide composition of the DNA molecule and the length of the DNA.
Higher Tm are associated with higher GC content, since GC base pairs are
linked by three H-bonds while AT base pairs are linked by two H-bond. Hence
GC base pairs are stronger, requiring higher temperature for melting. The Tm
can be used to calculate the GC content of the DNA.

Molecular Biology - BCH 361 Biochemistry Department
19
5.2 Theory
DNA melting and reassociation can be monitored by measuring the absorbance
at 260 nm. Double-stranded DNA has a lower absorbance, but when it is single-
stranded, the unstacking of the bases leads to an enhancement of absorbance. This is
called the hyperchromic effect. Therefore, the extent to which DNA is single-stranded
or double-stranded can be determined by monitoring UV absorption. Temperature for
midpoint of denaturation gives the Tm. By increasing temperature slowly and measuring
absorbance at 260 nm as melting profile can be generated.
5.3 Objective
1. To determine nucleic acid extraction efficiency and purity using UV
spectrophotometry.
2. To measure the AT/CG ratio and the percentage of GC content of a DNA
isolated from different sources (plasmid, plant and human) using the equation.
5.4 Materials
5.4.1 Chemicals
1. DNA Template (source; plasmid, human Genomic DNA, plant
Genomic DNA)
2. SSC buffer
3. UV spectrophotometer and quartz cuvettes
5.4.2 Equipments
1. Water bath
2. Spectrophotometer UV
5.4.3 Glassware
Quartz cuvette
5.4.4 20 X SSC Buffer to make 1L use:
175.3 g NaCl
88.2 g Na Citrate dihydrate
Dil HCl
Dissolve in approximately 800 ml dH20. Adjust to pH 7.0 with dilute
HCl. Bring up to a final volume of 1L and autoclave. Store at room
temperature.

Molecular Biology - BCH 361 Biochemistry Department
20
5.4.5 Experimental Protocol for the Characterization of DNA by
Spectrophotometer Assay.
1. Dissolve a small quantity of your extracted DNA in 3.0 ml of 0.1X
SSC.
2. Turn on and blank a UV spectrophotometer at 220 nm (use 0.1X SSC
as the blank). Determine the absorbance of your sample DNA at 230
nm.
3. Change the wavelength to 230 nm, reblank the spectrophotometer
and measure the absorbance of the sample at 230 nm.
4. Increment the wavelength by 10 nm and repeat blanking and
measuring the absorbance until readings are taken through 300 nm.
5. Compute the absorbance ratio 260 nm to 280 nm. Pure DNA
(without protein or RNA) will have a 260:280 absorbance ratio of
1.85. RNA will have a 260:280 ratio of 2.0.
6. Plot the absorbance spectrum of your sample and indicate the
260:280 ratio, as well as the amount of protein contamination on the
graph.
5.4.6 Experimental Protocol for Melting Point Determination
1. Dissolve your DNA preparation in SSC to give a final concentration
of approximately 20 µg DNA/ml.
2. Place the dissolved DNA in a quartz cuvette along with a second
cuvette containing SSC as a blank.
3. Place the cuvettes into a waterbath at 25 ° C and allow to temperature
equilibrate. Remove the blank, wipe the outside dry and rapidly
blank the instrument at 260 nm. Transfer the sample to the
spectrophotometer (be sure to dry and work rapidly) and read the
absorbance.
4. Raise the temperature of the bath to 50° C and repeat step .
5. Raise the temperature sequentially to 60° C, 65° C, 70° C, 75° C and
80° C and repeat the absorbance measurements
6. Slowly raise the temperature above 80° and make absorbance
measurements every 2° until the absorbance begins to increase. At
that point, increase the temperature, but continue to take readings at
1° C intervals
7. Correct all of the absorbance readings for solvent expansion relative
to 25° C.
8. List the corrected values as A

Molecular Biology - BCH 361 Biochemistry Department
21
9. Plot the value of A /A vs temperature and calculate the midpoint of
any increased absorbance. This midpoint is the melting point (Tm)
for your DNA sample.
5.5 Results
Wavelength (nm) Absorbance
220
230
240
250
260
270
280
290
300
Calculate the GC content of your sample using the formula
Percent of G + C = k(Tm -69.3) x 2.44.
5.6 Discussion
5.7 Questions
1. How pure is your DNA samples? Reflect on the possible sources of
contaminations in your DNA samples from different sources?
2. Compare the different melting temperature of DNA obtained from different
sources?
3. What does the ratio of AT/CG tells you?
4. Why does the melting temperature of the DNA sample depends on the GC
content?

Molecular Biology - BCH 361 Biochemistry Department
22
5.8 References
1. SantaLucia J Jr. "A unified view of polymer, dumbbell, and oligonucleotide
DNA nearest-neighbor thermodynamics". Proc. Natl. Acad. Sci. USA. 1998;
95 (4): 1460–5.
2. Mandel M and Marmur J. "Use of Ultravialet Absorbance-Temperature
Profile for Determining the Guanine plus Cytosine Content of DNA".
Methods in Enzymology 1968; 12 (2): 198–206.
3. Cell Biology Laboratory Manual online Dr. William H. Heidcamp, Biology
Department, Gustavus Adolphus College, St. Peter, MN 56082 –

Molecular Biology - BCH 361 Biochemistry Department
23
6. Primer Design
Primers are short single-stranded oligonucleotides which anneal to template DNA and
serve as a “primer” for DNA synthesis. In order to achieve the geometric amplification
of a DNA fragment, there must be two primers, one flanking each end of the target DNA.
The most critical step in your PCR experiment will be designing your oligonucleotide
primers. Poor primers could result in little or even no PCR product. Alternatively, they
could amplify many unwanted DNA fragments. Either way, it would interfere in
subsequence cloning steps. Therefore it is critical that you design your primers carefully.
Primer design requires extensive computer-based sequence analysis and this tutorial is
designed to lead you through that analysis.
6.1 General Considerations in Primer Design
I-Specificity
II-The distance between the primers
III-Melting Temperature (Tm)
VI Primer Length
V Product Size
VI Primer Dimers
VII Hairpins
VII Primer Dimers
VIII G/C Content
IX G/C clamp
6.1.1 Specificity
Two critical issues for specificity:
1. Primers must be complementary to flanking sequences of target region
2. Primers should not be complementary to many non-target regions of genome.
Consider the following fragment of DNA. (Remember, that when both strands of DNA
are shown the top strand runs 5’-3’) The location of two primers is indicated by >>’s.

Molecular Biology - BCH 361 Biochemistry Department
24
Ideally primers would be complementary only to the target sequence. This would ensure
that the taq polymerase only copies the target region. However, when using genomic
DNA as the template, there will likely be other sequences which are complementary or
nearly complementary to the primers.
6.1.2 The distance between the primers
It is rather flexible, ranging up to 10 kb. There can be, however, a considerable
drop-off in synthesis efficiency with distances 3 kb (Jeffreys et al., 1988).
Small distances between primers, however, lessen the ability to obtain much
sequence information or to reamplify with nested internal oligonucleotides,
should that be necessary.
6.1.3 Melting Temperature (Tm)
Two issues are critical for Tm.
1. The two primers should have a similar Tm.
2. The Tm should be within55-72º, around 60º is ideal.
The annealing temperature for a PCR reaction is based on the melting temperature (Tm)
of the primers. The Tm is the temperature at which a population of a double stranded
DNA molecule is partially denatured such that half of the molecules are in the single
stranded state and half are in the double stranded state.
541 CATTATCAACAAAATACTCCAATTGGCGATGGCCCTGTCCTTTTACCAGACAACCATTAC
GTAATAGTTGTTTTATGAGGTTAACCGCTACCGGGACAGGAAAATGGTCTGTTGGTAATG
601 CTGTCCACACAATCTGCCCTTTCGAAAGATCCCAACGAAAAGAGAGACCACATGGTCCTT
GACAGGTGTGTTAGACGGGAAAGCTTTCTAGGGTTGCTTTTCTCTCTGGTGTACCAGGAA
>>>>>>>>>>>>>>>>>>
661 CTTGAGTTTGTAACAGCTGCTGGGATTACACATGGCATGGATGAACTATACAAATAA
GAACTCAAACATTGTCGACGACCCTAATGTGTACCGTACCTACTTGATATGTTTATT
<<<<<<<<<<<<<<<<<<<<
The forward primer (>>>>>) which will be complementary to the lower strand and
must run 5’-3’ will have the sequence: 5’-CTGTCCACACAATCTGCC -3’
The reverse primer (<<<<<) which will be complementary to the upper strand and
must run 3’-5’ and will have the sequence: 3’-GACCCTAATGTGTACCGTAC-5’.
However, we always write DNA sequences in the 5’-3’ direction so the reverse primer
would be written: 5’-CATGCCATGTGTAATCCCAG-3’

Molecular Biology - BCH 361 Biochemistry Department
25
6.2 General points should be considered for Tm
At temperatures above the Tm the DNA molecules will be in the single stranded
form
At temperatures below the Tm the DNA can form the double stranded form.
If the annealing temperature is too high, the primer will not anneal to the target
DNA.
If the annealing temperature is too low the primer will mis-anneal to sequences
which aren’t perfectly complementary.
In order for the primers to anneal to the target DNA the annealing temperature
must be below the Tm of the primers. Typically, the annealing reaction is carried
out about 5º below the Tm.
The most important consequence of this is that the two primers designed for a
PCR experiment should have very similar Tm’s. Typically the Tm should be
within 5º of each other. The closer the Tm’s the better.
The Tm of a molecule is dependent on its sequence, however the relationship
between sequence and Tm is not simple. In general the greater the GC content of
DNA the higher its Tm. The Wallace formula can be used to give a rough
estimate of Tm.
Tm = 2(A+T) + 4(G+C).
6.3 Primer Length
A primer should be 20 to 30 bases in length. . It is long enough to be specific to
the target region, yet short enough to anneal efficiently.
Must be neither too short nor too long. If primers are too short they will lack
specificity. For example consider a primer only 4 nucleotides long, GATC. it
will bind to thousands of sequences on the chromosomes. This could lead to
amplification of unwanted sequences.
6.4 Product Size
The choice of primers determines the size of the PCR product.
If the two primers are complementary to nearby regions on the template DNA,
then a small fragment of DNA will be amplified.
If the two primers are complementary to regions farther apart, then a larger
fragment of DNA will be amplified.
Basic taq polymerase can easily amplify fragments up to 1000 to 2000bp.
(Special polymerases can be used to amplify larger fragments.)

Molecular Biology - BCH 361 Biochemistry Department
26
For standard PCR, the primers should be complmentary to regions on the target
DNA within 1000bp of each other.
6.5 Primer Dimers
If the primers have self-complementary sequences the primers, which are in high
concentration, will anneal with themselves.
If they anneal with themselves they are not available to bind to the target DNA.
There are two types of potential self-complementary sequences, those that lead to
hairpins and those that lead to primer dimers.
6.6 Hairpins
Intramolecular complementary sequences can lead to base pairing within a
molecule. Consider the primer GGC GGT ATG ATC CCG CTA GTT
AC. It can base pair internally and form the following hairpin structure.
A primer that is base pairing with itself cannot base pair with its target
DNA.
Primers must be designed to minimize intramolecularl base pairing.
Intramolecular base pairing is usually analyzed using computer programs.
Avoid primers that contain more than a string of 3 intra molecular base
pairs.
6.7 Primer Dimers
Primers can also participate in intermolecule base pairing. This is base pairing between
two different primer molecules.
o If the base pairing is between the forward and the reverse primer it is
called heterodimer formation.
o If the base pairing is between just one of the two primers it is called self-
dimer formation.

Molecular Biology - BCH 361 Biochemistry Department
27
o The example primer used above can form several self-dimers (see the 2
boxes below). Both examples of primer dimer are problematic. The first
is a highly stable structure with numerous base pairs. If the primers are
base pairing with themselves they cannot base pair with the target DNA.
6.8 G/C Content
it is important that primers be about 50% G/C and 50% A/T.
It is also important that regions within the primer not have long runs of G/C or
A/T.
A stretch of A/T’s might only weakly base pair while a stretch of G/C might
promote mis-annealing.
It is also useful to avoid a long string of a single nucleotide or even long strings of
purines or pyrimidines.
6.9 G/C clamp
Stable base pairing of the 3’ end of a primer and the target DNA is necessary for efficient
DNA synthesis. To ensure the stability of this interaction, primers are often designed
ending in either a G or a C. (GC base pairs are more stable than AT base pairs.) This
terminal G or C is called a G/C clamp.
Summary
1. primers should be 17-28 bases in length;
2. base composition should be 50-60% (G+C);
3. primers should end (3') in a G or C, or CG or GC: this prevents "breathing" of ends
and increases efficiency of priming;
4. Tms between 55-80oC are preferred;
5. primer self-complementarity (ability to form 2o structures such as hairpins or primer
dimers) should be avoided;
6. it is especially important that the 3'-ends of primers should not be complementary (ie.
base pair), as otherwise primer dimers will be synthesised preferentially to any other
product;
7. runs of three or more Cs or Gs at the 3'-ends of primers may promote mispriming at G
or C-rich sequences (because of stability of annealing), and should be avoided.
5' GGCGGTATGATCCCGCTAGTTAC
|||| || || ||||
3' CATTGATCGCCCTAGTATGGCGG

28
6.10 Web Based Tools for Primer Design
This semester we will be using two different internet applications for our primer
design. The first is an application in Biology Workbench called Primer3. This
application will analyze target regions and recommend forward and reverse primer
sequences. Its analysis can be directed to specific target regions of genes and analyzes
factors such as product size, primer size, tm, GC content GC clamps and dimer
formation. The second application, oligocalc,
<http://www.idtdna.com/analyzer/Applications/OligoAnalyzer/
Default.aspx> is provided by one of the companies that we order primers, IDT. It has
applications for analysis of hairpins, homodimers and heterodimers. We will use it to
double check the primers identified by Primer3.
6.10.1 How to find a primer
1. Access biology workbench and import the region of your gene that you plan to
amplify using PCR.
2. Run primer3 program in workbench.
3. Scroll down to primer criteria on the primer 3 page and change the first two
default settings.
a. Under product size change range from 100-300 to 400-600.
b. Change the GC clamp size from its setting of zero to a setting of one.
4. Click Submit to complete the analysis.
5. Primer3’s output includes an “optimal” pair of primers. The locations of these
primer sequences on the target sequence are reported. Four pairs of alternative
primers are also reported.
1-
Go to primer 3 program

29
Paste your sequence hear Paste your sequence hear Paste your sequence hear Paste your sequence hear Paste your sequence hear
Click
hear to
pick
primet
Click
hear to
pick
primet
Click
hear to
pick
primer
Paste your sequence hear
Criteria that u can
change and select
size, Tm, GC%,..

30
6.11 Discussion
In the discussion section you need to answer the following questions and discuss your
results.
5. Did u manage to deign your own primer using manual and software
methods
6. Discuss the importance of GC content Tm and length of your primer
Product size
Forward primer
Reverse primer
Position of forward primer
Position of Reverse primer

31
7. Discuss the advantage and disadvantages of primer design using the
software program?
8. Discuss the importance of Primer desigan and How does it can affect your
PCR?
6.12 References
Medberry, S., Gallagher, S., and Moomaw, B. 2004. The Polymerase chain reaction.
Curr. Protoc. Mol. Biol. 66:10.5.1-10.5.11.
32
7. PCR (POLYMERASE CHAIN REACTION) OPTIMIZATION
(ANNEALING TEMPERATURE).
7.1 Introduction
The polymerase chain reaction (PCR) is a powerful method for fast in vitro
enzymatic amplifications of specific DNA sequences. PCR amplifications can be
grouped into three different categories: standard PCR, long PCR, and multiplex PCR.
Standard PCR involves amplification of a single DNA sequence that is less than 5 kb
in length and is useful for a variety of applications, such as cycle sequencing, cloning,
mutation detection, etc. Long PCR is used for the amplification of a single sequence
that is longer than 5 kb and up to 40 kb in length. Its applications include long-range
sequencing; amplification of complete genes; PCR-based detection and diagnosis of
medically important large-gene insertions or deletions; molecular cloning; and
assembly and production of larger recombinant constructions for PCR-based
mutagenesis (1,2). The third category, multiplex PCR, is used for the amplification of
multiple sequences that are less than 5 kb in length. Its applications include forensic
studies; pathogen identification; linkage analysis; template quantitation; genetic
disease diagnosis; and population genetics (3–5). There is no single set of conditions
that is optimal for all PCR. Therefore, each PCR is likely to require specific
optimization for the template/primer pairs chosen. Lack of optimization often results
in problems, such as no detectable PCR product or low efficiency amplification of the
chosen template; the presence of nonspecific bands or smeary background; the
formation of “primer-dimers” that compete with the chosen template/primer set for
amplification; or mutations caused by errors in nucleotide incorporation. It is
particularly important to optimize PCR that will be used for repetitive diagnostic or
analytical procedures where optimal amplification is required. Optimization of a
particular PCR can be time consuming and complicated because of the various
parameters that are involved. These parameters include the following:
i) quality and concentration of DNA template;
ii) design and concentration of primers;
iii) concentration of magnesium ions;
iv) concentration of the four deoxynucleotides (dNTPs);
v) PCR buffer systems;
vi) selection and concentration of DNA polymerase;
vii) PCR thermal cycling conditions;
viii) addition and concentrations of PCR additives/cosolvents; and
ix) use of the “hot start” technique. Optimization of PCR may be affected by
each of these parameters individually, as well as the combined
interdependent effects of any of these parameters.
7.2 Theory
The purpose of a PCR is to produce a large number of copies of a DNA
fragment of interest (e.g. a gene or a part of a gene). This is necessary to have enough
starting template for studing DNA fragment e.g. sequencing.

33
7.2.1 The Amplification: The Cycling Reactions
There are three major steps in a PCR, which are repeated for 30 or 40
cycles. This is done on an automated cycler (a thermo cycler), which can heat
and cool the tubes with the reaction mixture in a very short time.
7.2.2 Denaturation at around 94°C
By heating the DNA at high temperature e.g. 940C. the DNA is
denatured. During the denaturation, the double strand DNA melts and
seperates into the two single strands. All enzymatic reactions stop (for
example : the extension from a previous cycle).
7.2.2.1 Annealing of the Primer to the Template, at around 54°C
The primers are in motion, known as Brownian movement. Ionic
bonds are constantly formed and broken between the free bases on
single stranded primer and complementary bases on the single stranded
DNA template. The more stable bonds last a little bit longer (primers
that fit exactly) and on that little piece of double stranded DNA
(template and primer), the polymerase can attach and starts copying the
template. Once there are a few bases built in, the ionic bond is so
strong between the template and the primer, that it does not break
anymore.
7.2.2.2 Extension at around 72°C
For the DNA polymerase the ideal working temperature is around
720C. The primers, where there are a few bases built in, already have a
stronger ionic attraction to the template than the forces breaking these
attractions. Primers that are on positions with no exact match get loose
again (because of the higher temperature) and don't give an extension
of the fragment. The bases (complementary to the template) are
coupled to the primer on the 3' side. The DNA polymerase adds
dNTP's from 5' to 3', reading the template from 3' to 5' side, and bases
are added complementary to the template.
7.3 Objective
The objective of this procedure is:
1. to determine the parameters that may affect the specificity, fidelity, and
efficiency of PCR,
2. as well as approaches that can be taken to achieve optimal PCR
amplifications.
7.4 Materials
7.4.1 Chemicals and Materials
1. Template DNA (e.g., plasmid DNA, genomic DNA).
2. Forward and reverse PCR primers.
3. MgCl2 (25 mM).

34
4. dNTPs (a mixture of 2.5 mM dATP, dCTP, dGTP, and dTTP).
5. 10× PCR buffer: 500 mM KCl, 100 mM Tris-HCl, pH 8.3, 25°C.
6. Thermal stable DNA polymerase (e.g., Taq DNA polymerase).
7. PCR additives/cosolvents (optional; e.g., betaine, glycerol, DMSO,
formamide, bovine serum albumin, ammonium sulfate,
polyethylene glycol, gelatin, Tween-20, Triton X-100,
7.4.2 Equipments
1. Automated pipettes
2. Microfuge
3. Thermocyclers
4. Electrophoresis tanks
5. Vortex
6. Power packs
7. –20°C freezerDist H2O source
8. Laminar cabinet
9. Microwave
10. Work stations
11. Ice machine
12. Gel viewing system
13. Balance
14. Gel documentation system
15. pH meter
7.4.3 Setting up PCR
The common volume of a PCR is 10, 25, 50, or 100 μL. Although
larger volumes are easier to pipette, they also use up a larger amount of
reagents, which is less economical.
All of the reaction components can be mixed in together in a 0.5-mL
PCR tube in any sequence except for the DNA polymerase, which should be
added last. It is recommended to mix all the components right before PCR
cycling.
For each PCR, the following components are mixed together:
1. Template DNA (1–500 ng).
2. Primers (0.05–1.0 μM).
3. Mg2+ (0.5–5 mM).
4. dNTP (20–200 μM each).
5. 1× PCR buffer: 1 mM Tris-HCl and 5 mM KCl.

35
6. DNA polymerase (0.5–2.5 U for each 50 μL of PCR).
As a real-life example, the following PCR was set up to amplify the cII gene
from bacteriophage lambda DNA (total volume = 50 μL):
1. 1 μL of 1 ng/μL lambda DNA (final amount = 1 ng).
2. 1 μL of 50 μM forward PCR primer (final concentration = 1 μM).
3. 1 μL of 50 μM reverse PCR primer (final concentration = 1 μM).
4. 5 μL of 25 mM MgCl2 (final concentration = 2.5 mM).
5. 4 μL of 2.5 mM dNTPs (final concentration = 200 μM).
6. 5 μL of 10× PCR buffer (final concentration = 1×).
7. 0.25 μL of 5 U/μL Taq DNA polymerase (final amount = 1.25 U).
7.4.4 PCR Cycling
A common PCR cycling program usually starts with an initial
dissociation step at 92 to 95°C for 2 to 5 min to ensure the complete separation
of the DNA strands. Most PCR will reach sufficient amplification after 20 to
40 cycles of strand denaturation at 90 to 98°C for 10 s to 1 min, primer
annealing at 55 to 70°C for 30 s to 1 min, and primer extension at 72 to 74°C
for 1 min per kilobase of expected PCR product.
It is suggested that a final extension step of 5 to 10 min at 72°C will
ensure that all amplicons are fully extended, although no solid evidence proves
that this step is necessary. For example, the cycling program used to amplify
the previously described lambda cII gene is as follows: initial denaturation for
4 min at 94°C, followed by 30 cycles of 1 min at 94°C, 1 min at 55°C, and 1
min at 72°C, then held at 4°C.
7.4.5 Verifying PCR Amplification
To measure the success of PCR amplification, 5 to 10 μL of the final
PCR product is run on a 2% agarose gel and visualized by staining with
ethidium bromide.
7.5 Results
7.6 Discussion

36
7.7 Questions
The critical questions are as follows which should be discussed in the
Discussion section:
1. Is there a band on the gel?
2. 2) Is the band at the expected size?
3. (3) Are there any nonspecific bands beside the expected PCR band on the
gel?
4. (4) Is there smear on the gel? A successful PCR amplification should
display a single band with the expected size without nonspecific bands and
smear.
7.8 References
1. Higuchi, R. Using PCR to engineer DNA, in PCR Technology: Principles
and Applications for DNA Amplifications (Erlich, H. A., ed.), Stockton Press,
Inc., New York, pp. 1989; 61–70.
2. Foord, O. S. and Rose, E. A. Long-distance PCR, in PCR Primer
(Dieffenback, C. W. and Dveksler, G. S., ed.), Cold Spring Harbor Laboratory
Press, Cold Spring, NY, 1995; pp. 63–77.
3. Edwards, A., Civitello, A., Hammond, H. A., and Caskey, C. T. DNA typing
and genetic mapping with trimeric and tetrameric tandem repeats. Am. J. Hum.
Genet. 1991; 49: 746–756.
4. Edwards, A., Hammond, H. A., Jin, L., Caskey, C. T., and Chakroborty, R.
Geneticvariation at five trimeric and tetrameric tandem repeat loci in four
human population groups. Genomics 1992; 12: 241–253.
5. Klimpton, C. P., Gill, P., Walton, A., Urquhart, A., Millican, E. S., and
Adams, M. (1993) Automated DNA profiling employing multiplex
amplification of short tandem repeat loci. PCR Methods Appl. 3, 13–
37
8. PREPARATION OF DNA FOR MORE ADVANCED
APPLICATIONS
(CUT FROM GEL AND PURIFY)
8.1 Introduction
Following digestion with appropriate restriction enzymes, the DNA of interest
is subjected to electrophoresis on a preparative agarose gel. The portion of the gel
containing the restriction fragment to be purified is then physically removed from the
gel. This agarose slice is placed into a buffer-filled piece of dialysis tubing and again
subjected to electrophoresis. The restriction fragment migrates out of the gel slice into
the buffer, and the DNA is further purified and concentrated. This procedure is
effective with fragment sizes ranging from 50 to 20,000 bp.
8.2 Objective
Isolation of DNA fragments from agarose gels. The isolated DNA fragments
can be used for cloning, ligation reactions, PCR protocols, sequencing and so many
other applications.
8.3 Theory
The DNA fragments are subjected to electrophoresis so that it came out of the
agarose slice. The quality of the preparative DNA digest and the resolution of the
preparative gels are critical for obtaining optimal yields of fragments from all
protocols. If the preparative gel is overloaded, cross-contamination will occur as a
small amount of each fragment becomes “trapped” in the other bands. This low level
of contamination can be significant if the fragment is to be used for some cloning
procedures, or as a probe in some hybridization. If it is necessary to obtain a large
amount of highly pure fragment, the first preparation should be re-electrophoresed
and repurified.
8.4 Materials
1. DNA fragment encoding sequence of interest
2. Ethidium bromide solution
3. TAE buffer pH
4. M NaCl
5. 100% and 70% ethanol
6. TE buffer, pH 8.0
7. Spectrapor 3 dialysis membrane tubing (11.5-mm diameter with MWCO
of 3500; Baxter).
8.5 Experimental Protocol
1. Digest 0.1 to 25 ug DNA to completion with appropriate restriction enzyme as
described before in experiment 6.
2. Load sample onto the appropriate agarose gel and subject to electrophoreseis.

38
3. After electrophoresis, stain the gel with ethidium bromide solution as
described before and photograph the gel.
4. Using UV light for visualizing bands carefully cut out the target band with a
scalpel.
5. Rinse dialysis tubing with TAE buffer.
6. Tightly tie off one end of the tubing with two knots. Slide the gel slice into the
tubing.
7. Fill the tubing with TAE buffer until it is almost completely expanded. Knot
or clip the top of the tubing closed.
8. Place the sealed dialysis bag in a horizontal gel electrophoresis apparatus. Fill
the apparatus with 1x TAE buffer until the dialysis bag is just covered with
solution.
9. Electroelute at a constant voltage of 2 V/cm between the two wires. For a 50-
to 500-bp target fragment, electroelute 30 to 45 min. For a 500- to 2000-bp
fragment, electroelute 2 hr. For a 2000- to 4000-bp fragment, electroelute 4 hr.
For larger fragments, electroelute at 1 V/cm overnight.
10. After electroelution is complete, reverse the polarity of the electrodes and turn
on voltage at 100 V for 30 sec.
11. Carefully open the top of the dialysis bag and collect TAE buffer with a
Pasteur pipette. Massage gel slice out of the bag and wash the bag with a pipet
of TAE buffer.
12. Add an equal volume of phenol/chloroform/isoamyl alcohol to the DNA
solution to be purified in a 1.5-ml microcentrifuge tube.
13. Vortex vigorously for 10 sec and microcentrifuge 15 sec at maximum speed,
room temperature.
14. Carefully remove the top (aqueous) phase containing the DNA using a 200 ml
(or μl) pipette and transfer to a new tube. If a white precipitate is present at the
aqueous/organic interface, repeat steps 12 to 10.
15. Add 1/10 vol. of 3 M sodium acetate, pH 5.2, to the solution of DNA. Mix by
vortexing briefly or by flicking the tube several times with a finger.
16. Add 2 to 2.5 vol of ice-cold 100% ethanol. Mix by vortexing and place in
crushed dry ice for 5 min or longer.
17. Microcentrifuge 5 min at maximum speed and remove the supernatant.
18. Add 1 ml room-temperature 70% ethanol. Invert the tube several times and
microcentrifuge as in step 17.
19. Remove the supernatant as in step 17. Dry the pellet in a desiccator under
vacuum or in a Speedvac evaporator.
20. Dissolve the dry pellet in an appropriate volume of water if it is going to be
used for further enzymatic manipulations requiring specific buffers. Dissolve
in TE buffer, pH 8.0, if it is going to be stored indefinitely.

39
8.6 Results
8.7 Discussion
8.8 Questions
1. Is agarose gel suitable for separating short DNA fragments?
2. Why do you reverse the electric current for 30 sec before the end of the run?
3. Write down the role of ethanol in precipitating nucleic acids? Can it be
substituted?
8.9 References
Ausubel FM, Brent R, Kingston RE, Moore DD, Seidman JG, Smith JA,
Struhl K. Current Protocols in Molecular Biology. (eds.) John Wiley & Sons,
Inc. New York, 2003

40
9. DIGESTION OF DNA WITH RESTRICTION ENZYMES
BAMHI UNDER DIFFERENT SALT
CONCENTRATIONS
9.1 Introduction
Restriction endonucleases (RE) are enzymes, produced by bacterial cells that
have the ability to cleave the sugar phosphate backbones in double stranded DNA at
specific restriction sites. However, they do not cleave the host DNA as the restriction
sites are methylated, and hence seem to function in host defense, as bacteria use them
to cut DNA from foreign sources, like the viruses that infect them (i.e.
bacteriophages). Each RE recognizes a specific sequence of 4-6 nucleotides in length.
Table 6.1 presents examples of a few RE with their recognition sites.
Table 6.1: Some RE and their restriction sites
Restriction
Endonuclease
Microorganism Source Restriction Site
EcoRI Escherichia coli RY 13 C-A-A-T-T-G
G-T-T-A-A-C
Hind III Haemophilus influenzae Rd A-A-C-G-T-T
T-T-G-C-A-A
Hpa I Haemophilus Para influenzae C-T-T-A-A-C
G-A-A-T-T-C
Bam HI Bacillus amyloliquefaciens H. G-G-A-T-C-C
C-C-T-A-G-G
Pst I Providencia stuarti I C-C-G-G
G-G-C-C
Over 300 RE have been isolated and the nomenclature depends on the
organism from which they are derived e.g. Bam HI from Bacillus amyloliquefaciens
H, ECoR1 from E coli, Hind II and Hind III from Haemophilus influenzae, and XhoI
from Xanthomonas holcicola. Like other enzymes each restriction enzyme functions
best under optimal conditions of temperature, pH and ionic strength.
9.2 Theory
Restriction endonuclease cleavage is accomplished by incubating the genomic
DNA or DNA fragments obtained following amplification using polymerase chain
reaction (PCR) with the RE under appropriate experimental conditions. The RE
restricts the DNA at sites where the specific sequence recognized by the RE are
present, resulting in the production of different size fragments. These fragments can
be separated on electrophoresis using agarose gel.
In this experiment the restriction of genomic DNA using BamHI will be
investigated and the effect of different NaCl concentrations on the activity of BamHI
will be studied.

41
9.3 Objective
To determine the optimum concentration of sodium chloride (NaCl) for the restriction
enzyme digestion of DNA by BamHI.
9.4 Materials
9.4.1 Materials
1. DNA (genomic DNA or PCR product) in H2O or TE buffer
2. Restriction endonuclease (BamHI)
3. 10X restriction endonuclease buffer
4. NaCl: 1M
5. 0.5 M EDTA, pH 8.0
9.4.2 Equipment
1. Automated pipettes
2. Weighing balance
3. pH meter
4. Water bath
5. Centrifuge
9.4.3 Glassware and Disposables
1. Autoclaved Tubes
2. Tips
3. Gloves
6. Centrifuge tubes
9.5 Experimental Protocol
1. Lable six clean microcentrifuge tubes, 1-3 in duplicates.
2. In the three microcentrifuge tubes pipet the following:
Solution Tube 1 Tube 2 Tube 3
DNA solution 1 ul 1 ul 1 ul
10Xrestriction
buffer
2 ul 2 ul 2 ul
NaCl solution 0 1 ul 2 ul
Water 17 ul 16 ul 15 ul
3. Add BamHI (3 U/μg DNA) and incubate the reaction mixture for 1 hr at
370 C in an incubator.
4. Stop the reaction by adding 0.5 μl of 0.5 M EDTA (12.5 mM final
concentration), and prepare it for agarose gel electrophoresis by adding 5
μl of gel loading buffer.

42
9.6 Results
9.7 Discussion
Discuss the following points:
Is the DNA digested, and if so how many fragments are produced and
what are their sizes?
Is the standard graph a straight line?
What is the effect of NaCl exclusion and inclusion on the activity of
BamHI?
Did you fulfill your objectives?
9.8 References
1. Alberts, B.,Bray, D, Lewis, J., et al. The Molecular Biology of the Cell.
Garland Publishing, New York.
2. Danna, AJ. Determination of fragment order through partial digests and
multiple enzyme digests. Methods Enzymol. 1980; 65: 449-467.
3. Ausubel, F.M. Brent, R. Kingston, R.E. et al. (eds). Short Protocols in
Molecular Biology. 1999 - John Wiley & sons, Inc. New York.

43
10.1. ELECTROPHORETIC SEPARATION OF DNA AND DNA
FRAGMENTS IN AGAROSE GEL
10.1.1 Introduction
Agarose gel electrophoresis is the easiest and frequently used technique for
separating and analyzing DNA. Gels allow separation and identification of nucleic
acids based on migration under the influence of an electric charge. Migration of
nucleic acid molecules in an electric field is determined by size and conformation,
allowing nucleic acid fragments of different sizes to be separated. The purpose of the
gel electrophoresis may also be to observe the DNA, to quantify it or to isolate a
particular band.
10.1.2 Theory
Gel electrophoresis is an essential technique for analyzing DNA. When a
charged molecule is placed in an electric field, it will migrate towards the electrode
with the opposite charge. All nucleic acids carry a net negative charge due to the
presence of phosphate in the structure. The amount of negative charge is almost the
same in all DNA molecules, since all the nucleic acids carry the same amount of
negative charge per unit size. Hence DNA will migrate towards the positive electrode
(the red one) according to the size of the molecule. Smaller molecular weight DNA
fragments will migrate faster than the larger ones. Agarose gel analysis is the most
frequently used method for analyzing DNA fragments between 0.1 and 25 kb. Low
agarose concentrations are used to separate large DNA fragments, while high agarose
concentrations allow resolution of small DNA fragments. Talbe 9,1.1 lists the ideal
concentration of agarose for different size DNA fragments.
The size of the separated DNA can be calculated by comparing the distance it
migrated in the gel with standard molecular-weight markers.
Table 9,1.1 : Electrophoretic Superation of different sizes of DNA on
different concentrations of Gel.
Agarose concentration
(g%)
DNA fragment range
(Kb)
0.3 5–60
0.5 1–30
0.7 0.8–12
1.0 0.5–10
1.2 0.4–7
1.5 0.2–3
2.0 0.1–2

44
10.1.3 Objectives
Separation of DNA using agarose gel electrophoresis can shed light into many
applications. Electrophoretic separation of DNAfragments is carried out with the
following objectives:
1. To calculate the molecular size of DNA fragment by comparing the separated
band with known standard molecular weight marker.
2. To quantify DNA fragment by comparing the separated band with known
quantity of DNA.
3. To obtain the purity of DNA preparation.
4. To Isolate a particular band for the purpose of purification.
10.1.4 Materials
10.1.4.1 Chemicals
1. Agarose, buffers
2. Ethidium bromide
3. Standard DNA ladder
4. DNA to be studied.
10.1.4.2 Equipment
1. Horizontal Electrophoresis apparatus
2. Power supply
3. Microwave
4. Transilluminator, and
5. photoimager machine.
10.1.4.3 Plastic wares:
1. Eppendorf tubes
2. Automatic pipettes
3. tips
10.1.4.4 Preparation of Solutions
A. Loading buffers
1. 25mg bromophenol blue
2. 4g sucrose
3. H2O to 10mL
4. Store at 4°C to avoid mould growing in the sucrose
B. Electrophoresis Running and gel buffer (TBE)
1. 10.9 g Tris base
2. 5.5 g Boric acid
3. 0.465 g EDTA

45
Dissolve the ingredients in 900 ml of distilled water. Adjust pH to
about 8.3 using NaOH and make up to 1 L
10.1.5 Experimental Procedure
10.1.5.1 Pouring the gel
1. Prepare enough 1x electrophoresis buffer both to pour the gel
and fill the electrophoresis tank. The most commonly used
buffers for agarose gel electrophoresis are TBE (Tris-borate–
EDTA) and TAE (Tris-acetate–EDTA).
2. Add an appropriate amount of agarose (depending on the
concentration required) to an appropriate volume of
electrophoresis buffer (depending on the type of electrophoresis
apparatus being used) in a flask or bottle. The vessel should not
be more than half full. Cover the vessel to minimize evaporation.
3. Heat the slurry in a microwave or boiling water bath, swirling
the vessel occasionally, until the agarose is dissolved. Ensure
that the lid of the flask is loose to avoid buildup of pressure. Be
careful not to let the agarose solution boil over as it becomes
super-heated. If the volume of liquid reduces considerably
during heating due to evaporation, make up to the original
volume with distilled water. This will ensure that the agarose
concentration is correct and that the gel and the electrophoresis
buffer have the same buffer composition.
4. Cool the agarose to 55–60°C. Add the visualization dye,
ethidium bromide (EtBr) (final concentration 0.5 ug/ml)
5. Pour the agarose solution onto the gel tray to a thickness of 3–5
mm. Insert the comb either before or immediately after pouring
the gel. Leave the gel to set (30–40 min) to solidify. Ensure that
there is enough space between the bottom of the comb and the
glass plate (0.5–1.0 mm) to allow proper formation of the wells
and avoid sample leakage. Make sure that there are no air
bubbles in the gel or trapped between the wells.
6. Carefully remove the comb, from the gel. Fill the tank
containing the gel with electrophoresis buffer. Add enough
buffer to cover the gel with a depth of approximately 1 mm
liquid above the surface of the gel. If too much buffer is used the
electric current will flow through the buffer instead of the gel.
10.1.5.2 Preparation of samples:
Add 1 volume of gel loading buffer to 6 volumes DNA
sample and mix. Samples should always be mixed with gel loading
buffer prior to loading on a gel.
Gel loading buffer serves three main purposes:
1. To increase the density of the samples to ensure that they sink
into the wells on loading.

46
2. To add color to the samples through use of dyes such as
bromophenol blue or xylene cyanol, facilitating loading.
3. To allow tracking of the electrophoresis due to co-migration of
the dyes with DNA fragments of a specific size. Do not use
sample volumes close to the capacity of the wells, as samples
may spill over into adjacent wells during loading. Be sure that all
samples have the same buffer composition. High salt
concentrations, for example in some restriction buffers, will
retard the migration of the DNA fragments. Ensure that no
ethanol is present in the samples, as this will cause samples to
float out of the wells on loading.
10.1.5.3 Applying Samples and Running Gel Electrophoresis:
1. Apply samples in gel loading buffer to the wells of the gel. Prior
to sample loading, remove air bubbles from the wells by rinsing
them with electrophoresis buffer.Make sure that the entire gel is
submerged in the electrophoresis buffer.To load samples, insert
the pipette tip deep into the well and expel the liquid slowly. Take
care not to break the agarose with the pipette tip.Once samples are
loaded, do not move the gel tray/tank as this may cause samples to
float out of the wells. Be sure to always include at least one lane of
appropriate molecular weight markers.
2. Connect the electrodes to the Power pack, so that the DNA will
migrate towards the anode (positive electrode, red electrode).
3. Turn on the power supply and run the gel at 1–10 V/cm until the
dyes have migrated an appropriate distance. This will depend on
the size of DNA being analyzed, the concentration of agarose in
the gel, and the separation required. Avoid use of very high
voltages which can cause trailing and smearing of DNA bands in
the gel, particularly with high molecular weight DNA.
10.1.5.4 Visual Analysis of the gel
Ethidium bromide–DNA complexes display increased fluorescence
compared to the dye in solution. This means that illumination of a
stained gel under UV light (254–366 nm) allows bands of DNA to be
visualized against a background of unbound dye. The gel image can be
recorded by taking a Polaroid™ photograph or using a gel
documentation system (a photo imager).
10.1.6 Results
47
10.1.7 Discussion:
1. Discuss the mobility of different sizes and shape of the DNA on the
agarose gel and describe how the concentrations of the agarose gel affect
the mobility of the DNA samples.
2. Why do you think selection of the right percentage of agarose gel is crucial
in separation of the DNA sample?
10.1.8 Questions
1. Following electrophoresis of DNA fragments through an agarose gel,
which band is closest to the positive electrode and which is the closest to
the negative electrode?
2. Why should we use low agarose concentration gels to separate large DNA
fragments?
3. Why do we add bromophenol blue to the loading buffer?
4. What precautions are necessary when using ethidium bromide and why?
5. Why should we add sucrose to the loading buffer?
10.1.9 References
1. A Guide to Analytical Gels: Qiagen Bench Guide
http://www1.qiagen.com/literature/render.aspx?id=23553
2. Dale JW and von Schantz M. From Genes to Genomes, Concepts and
applications of DNA technology. 2nd
Ed. 2007, John Willey and Sons,
INC.
10.2 Separation of PCR Product in Agarose Gel
10.2.1 Introduction
A normal way of analyzing PCR product is to separate the sample DNA in an
agarose electrophoresis gel. This ascertains that only one fragment is obtained in each
reaction.
10.2.2 Theory
When a DNA molecule is placed under an electric field, it will migrate
towards the electrode with the opposite charge (the positive electrode, the red one)
according to the size of the molecule. Smaller molecular size DNA fragments will
migrate faster than the larger one. The size of PCR amplification product depends on
how far is one primer from the other primer when annealed to the template DNA to be
amplified.
10.2.3 Objectives of the experiment:
1. To Study the efficiency of PCR reaction.
2. To calculate the molecular size of the amplified DNA fragment by
comparing the separated band with known standard molecular weight
marker.

48
3. To Separate the amplified DNA fragment for further purification and
cloning.
10.2.4 Materials Required
10.2.4.1 Chemicals
1. Agarose
2. Buffers
3. Ethidium bromide
4. Standard DNA ladder
5. PCR amplified DNA.
10.2.4.2 Equipment
1. Horizontal Electrophoresis apparatus
2. Power supply
3. Microwave
4. Transilluminator and photoimager machine.
10.2.4.3 Plastic Wares
1. Eppindorf tubes
2. Automatic pipettes.
10.2.4.4 Preparation of Solutions
A. Loading buffers
1. 25mg bromophenol blue
2. 4g sucrose
3. H2O to 10mL
4. Store at 4°C to avoid mould growing in the sucrose
B. Electrophoresis Running and gel buffer (TBE)
1. 9.29 g Tris base
2. 5.5 g Boric acid
3. 0.465 g EDTA
4. Dissolve the ingredients in 900 ml of distilled water. Adjust
pH to about 8.3 using NaOH and make up to 1 L
10.2.5 Experimental Procedure
1. Weigh agarose powder, mix it with electrophoresis buffer to the desired
concentration depending on the size of the PCR-amplified DNA fragment.
Ex. To prepare 1% gel weight 1 g agarose and add 100 ml electrophoresis
buffer (TBE). This concentration is suitable to fractionate a PCR-amplified
fragment of 0.5 to 10 Kb. (Table 9.21).
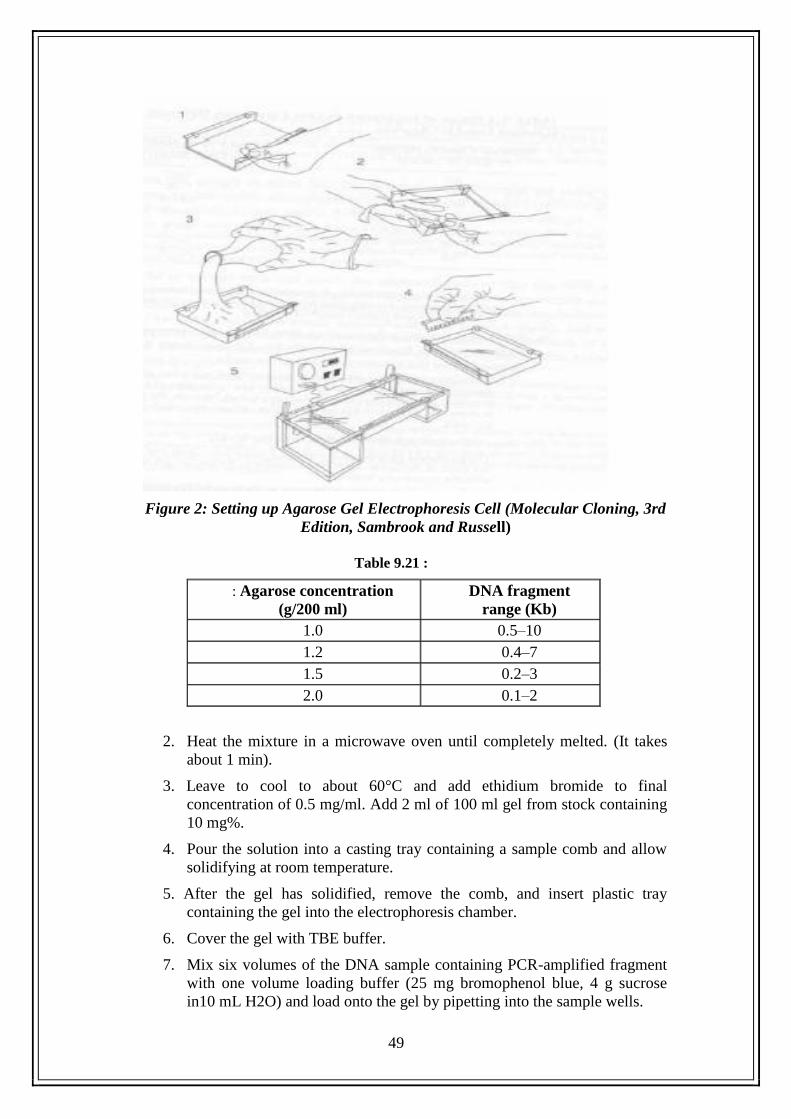
49
Figure 2: Setting up Agarose Gel Electrophoresis Cell (Molecular Cloning, 3rd
Edition, Sambrook and Russell)
Table 9.21 :
: Agarose concentration
(g/200 ml)
DNA fragment
range (Kb)
1.0 0.5–10
1.2 0.4–7
1.5 0.2–3
2.0 0.1–2
2. Heat the mixture in a microwave oven until completely melted. (It takes
about 1 min).
3. Leave to cool to about 60°C and add ethidium bromide to final
concentration of 0.5 mg/ml. Add 2 ml of 100 ml gel from stock containing
10 mg%.
4. Pour the solution into a casting tray containing a sample comb and allow
solidifying at room temperature.
5. After the gel has solidified, remove the comb, and insert plastic tray
containing the gel into the electrophoresis chamber.
6. Cover the gel with TBE buffer.
7. Mix six volumes of the DNA sample containing PCR-amplified fragment
with one volume loading buffer (25 mg bromophenol blue, 4 g sucrose
in10 mL H2O) and load onto the gel by pipetting into the sample wells.
50
8. Cover the apparatus, and connect the power supply at a voltage no more
than 5 volts per cm to the gel (the cm value is the distance between the two
electrodes, not the length of the gel). You can confirm that current is
flowing by observing bubbles coming off the electrodes. DNA will
migrate towards the positive electrode, which is usually colored red. Avoid
use of very high voltages which can cause trailing and smearing of DNA
bands in the gel, particularly with high-molecular-weight DNA.
9. Switch off the power when the dyes have migrated an appropriate distance
(about 70% of the gel length).
7. The gel image can be recorded by exposing the gel to UV transiluminator
(254–366 nm) which allow bands of DNA bound to ethidium bromide to
be visualized against a background of unbound dye.
8. UV light can damage the eyes and skin. Always wear suitable eye and face
protection when working with a UV light source.
9. UV light damages DNA. If DNA fragments are to be extracted from the
gel, use a lower intensity UV source if possible and minimize exposure of
the DNA to the UV light. Ethidium bromide is a powerful mutagen and is
very toxic. Wear gloves and take appropriate safety precautions when
handling.
10.2.6 Results
Calculate the size of the separated DNA fragment by comparing its size with
the size of known standard.
Fragments of linear DNA migrate through agarose gels with a mobility that is
inversely proportional to the log10 of their molecular weight. In other words, if you
plot the distance from the well that DNA fragments have migrated against the log10 of
either their molecular weights or number of base pairs, a roughly straight line will
appear.
10.2.7 Discussion
10.2.8 Questions
1. What is the function of sucrose in the loading buffer?
2. What is a mutagen?
10.2.9 References
http://www.vivo.colostate.edu/hbooks/genetics/biotech/gels/agardna.html

51
10.3 Separation of Plasmid and Genomic DNA in Agarose
Gel
10.3.1 Introduction
Agarose gel electrophoresis is the easiest and commonest way of separating
and analyzing DNA. Gels allow separation and identification of nucleic acids based
on charge migration. Migration of nucleic acid molecules in an electric field is
determined by size and conformation, allowing nucleic fragments of different sizes to
be separated. The purpose of the gel might be to look at the DNA, to quantify it or to
isolate a particular band.
10.3.2 Theory
Gel electrophoresis is a crucial technique for analyzing DNA. When a charged
molecule is placed in an electric field, it will migrate towards the electrode with the
opposite charge. All nucleic acids carry a net negative charge due to the presence of
phosphate in its structure. The amount of negative charge is almost the same in all
DNA molecules, since all the nucleic acids carry the same amount of negative charge
per unit size. Hence DNA will migrate towards the positive electrode (the red one)
according to the size of the molecule. Smaller molecular weight DNA will migrate
faster than the larger one. Agarose gel analysis is the most commonly used method for
analyzing DNA fragments between 0.1 and 25 kb. Low agarose concentrations are
used to separate large DNA fragments, while high agarose concentrations allow
resolution of small DNA fragments.
The size of the separated DNA can be calculated by comparing the distance it
migrated in the gel with standard molecular-weight markers as described in the
following table.
Agarose concentration
(g%)
DNA fragment range (Kb)
0.3 5–60
0.5 1–30
0.7 0.8–12
1.0 0.5–10
1.2 0.4–7
1.5 0.2–3
2.0 0.1–2
10.3.3 Objectives
1. To calculate the molecular size of DNA fragment by comparing the separated
band with known Standard Molecular weight marker.
2. Judging the quality and shape of DNA preparation.

52
10.3.4 Materials
10.3.4.1 Chemicals
1. Agarose
2. Buffers
3. Ethidium bromide
4. Standard DNA ladder
10.3.4.2 Equipment
1. Horizontal Electrophoresis apparatus
2. Power supply
3. Microwave
4. Transilluminator
5. Photoimager machin.
10.3.4.3 Plastic wares
1. Eppendorf tubes
2. Automatic pipettes.
10.3.4.4 Preparation of Solutions
A. Loading buffers
1. 25mg bromophenol blue
2. 4g sucrose
3. H2O to 10mL
4. Store at 4°C to avoid mould growing in the sucrose
B. Electrophoresis Running and gel buffer (TBE)
1. 10.9 g Tris base
2. 5.5 g Boric acid
3. 0.465g EDTA
4. Dissolve the ingredients in 900 ml of distilled water. pH to
about 8.3 using NaOH and make up to 1 L.
10.3.5 Experimental Procedure:
1. Prepare agarose gel with adequate concentration as previously shown in
experiments earlier on.
2. Mix six volumes of the genomic DNA sample with one volume loading
buffer (25 mg bromophenol blue, 4 g sucrose in 10 mL H2O) and load onto
the gel by pipetting into the sample wells.
3. Cover the apparatus, and connect the power supply at a voltage no more
than 5 volts per cm to the gel (the cm value is the distance between the two
electrodes, not the length of the gel).

53
4. Switch off the power when the dyes have migrated an appropriate distance
(about 70% of the gel length).
5. The gel image can be recorded by exposing the gel to UV transiluminator
(254–366 nm) which allow bands of DNA bound to ethidium bromide to
be visualized against a background of unbound dye.
6. Compare the migration of each DNA preparation and explain the results.
10.3.6 Results
10.3.7 Discussion
10.3.8 Questions
1. The electrophoresis apparatus creates an electrical field with positive and
negative poles at the ends of the gel. DNA molecules are negatively
charged. To which electrode pole of the electrophoresis field would you
expect DNA to migrate? (+ or -)? Explain.
2. After DNA samples are loaded into the sample wells, they are “forced” to
move through the gel matrix. What size fragments (large vs. small) would
you expect to move toward the opposite end of the gel most quickly?
Explain.
10.4 Effect of DNA Shape on DNA Separation on Agarose
Gel
10.4.1 Introduction
All nucleic acids are of very similar chemical composition and have a high
charge-to-mass ratio. The migration on agarose electrophoresis gel depends primarily
on their frictional coefficients, which are related to the length and conformation of the
nucleic acid. There are three main conformations of plasmid dsDNA: supercoiled,
circular (relaxed or nicked) and linear.
In dsDNA the two strands coil around each other once per turn of the helix
(i.e. every ten base pairs). Supercoiled dsDNA is more compact and therefore has a
lower frictional coefficient and hence it migrates faster during gel electrophoresis than
the other forms.

54
10.4.2 Theory
All nucleic acids carry a net negative charge due to the presence of phosphate
in its structure. The amount of negative charge is almost the same in all DNA
molecules, since all the nucleic acids carry the same amount of negative charge per
unit size. Hence DNA will migrate towards the positive electrode (the red one)
according to the size of the molecule which is affected by the conformational 3D
structure of the molecule. Smaller molecular sized DNA will migrate faster than the
larger one.
10.4.3 Objectives of the experiment
This experiment aims at studying the effect of DNA shape on the migration on
agarose electrophoresis gel.
10.4.4 Materials
10.4.4.1 Chemicals
1. Agarose
2. Buffers
3. Ethidium bromide
4. Standard DNA ladder
5. Supercoiled circular (relaxed or nicked). And
6. linearized plasmid.
10.4.4.2 Equipment
1. Horizontal Electrophoresis apparatus
2. Power supply
3. Microwave
4. Transilluminator, and
5. Photoimager machin.
10.4.4.3 Plastic wares
1. Eppendorff tubes
2. Automatic pipettes.
10.4.4.4 Preparation of Solutions
A. Loading buffers
25mg bromophenol blue
4g sucrose
H2O to 10mL
Store at 4°C to avoid mould growing in the sucrose
B. Electrophoresis Running and gel buffer (TBE)
10.9 g Tris base
55
5.5 g Boric acid
0.465 g EDTA
Dissolve the ingredients in 900 ml of distilled water. pH to about 8.3
using NaOH and make up to 1 L.
10.4.5 Experimental Procedure
1. Prepare agarose gel with adequate concentration as previously shown in Table
above for the separation of DNA.
2. Mix six volumes of the DNA sample containing supercoiled, circular (relaxed
or nicked) or linear with one volume loading buffer (25 mg bromophenol blue,
4 g sucrose in 10 mL H2O) and load onto the gel by pipeting into the sample
wells.
3. Cover the apparatus, and connect the power supply at a voltage no more than 5
volts per cm to the gel (the cm value is the distance between the two
electrodes, not the length of the gel).
4. Switch off the power when the dyes have migrated an appropriate distance
(about 70% of the gel length).
5. The gel image can be recorded by exposing the gel to UV transiluminator
(254–366 nm) which allow bands of DNA bound to ethidium bromide to be
visualized against a background of unbound dye.
6. Compare the migration of each DNA preparation and explain the results.
10.4.6 Results
10.4.7 Discussion
10.4.8 Questions
What would be a logical explanation as to why there is more than one band of
DNA for each of the samples?
10.4.9 References:
Ninfa AJ; Ballou DP and Benore M. Fundamental Laboratory Approaches for
Biochemistry and Biotechnology. 2nd
Ed. John Willey and Sons, INC. 2009

56
11.1 RNA Extraction
11.1.1 Introduction
The difficulty in RNA isolation is that most ribonucleases are very stable and
active enzymes that require no cofactors to function. The first step in all RNA
isolation protocols therefore involves lysing the cell in a chemical environment that
results in denaturation of ribonuclease. To avoid contamination problems, the
following precautions can be taken:
1. Solutions. Any water or salt solutions used in RNA preparation should be treated
with the chemical diethylpyrocarbonate (DEPC). This chemical inactivates
ribonucleases by covalent modification. Solutions containing Tris cannot be
effectively treated with DEPC because Tris reacts with DEPC to inactivate it.
2. Glassware and plastic. Autoclaving will not fully inactivate many RNases.
Glassware can be baked at 300oC for 4 hrs. Certain kinds of plasticware (e.g.,
some conical centrifuge tubes and pipettes) can be rinsed with chloroform to
inactivate RNase. When done carefully, this rinse is an effective treatment. Keep
in mind, however, that many plastics (e.g., gel boxes) will melt when treated with
chloroform. Plastic ware straight out of the package is generally free from
contamination and can be used as is.
3. Hands are a major source of contaminating RNase. Wear gloves.
11.1.2 Theory
Most procedures for isolating RNA from eukaryotic cells involve lysing and
denaturing cells to liberate total nucleic acids. Additional steps are then required to
remove DNA. This procedure allows rapid preparation of total cytoplasmic RNA by
using a nonionic detergent to lyse the plasma membrane, leaving the nuclei intact.
The nuclei and hence the bulk of the cellular DNA are then removed with a simple
brief centrifugation. It is fast and streamlined, designed for preparing total
cytoplasmic RNA from many cultures simultaneously for nuclease protection
analysis.
11.1.3 Objective
1. To analysis gene expression by measuring the amount of RNA.
2. To determine the structure and amount of the RNA produced from a gene, in
order to elucidate the regulatory properties of the gene.
11.1.4 Materials
11.1.4.1 Materials
A. Chemicals
1. Denaturing solution
Stock solution: Mix 293 ml water, 17.6 ml of 0.75 M sodium citrate,
pH 7.0, and 26.4 ml of 10% (w/v) N-lauroylsarcosine (Sarkosyl). Add
250 g guanidine thiocyanate and stir at 60° to 65°C to dissolve. Store
up to 3 months at room temperature.

57
Working solution: Add 0.35 ml 2-mercaptoethanol (2-ME) to 50 ml of
stock solution. Store up to 1 month at room temperature. Final
concentrations are 4 M guanidine thiocyanate, 25 mM sodium citrate,
0.5% Sarkosyl, and 0.1 M 2-ME.
2. Sodium acetate, 2 M
Add 16.42 g sodium acetate (anhydrous) to 40 ml water and 35 ml
glacial acetic acid. Adjust solution to pH 4 with glacial acetic acid and
dilute to 100 ml final with water (solution is 2 M with respect to
sodium ions). Store up to 1 year at room temperature.
3. Water-saturated phenol
Dissolve 100 g phenol crystals in water at 60° to 65°C. Aspirate the
upper water phase and store up to 1 month at 4°C. Do not use buffered
phenol in place of water-saturated phenol.
4. Diethylpyrocarbonate (DEPC) treatment of solutions
Add 0.2 ml DEPC to 100 ml of the solution to be treated. Shake
vigorously to get the DEPC into solution. Autoclave the solution to
inactivate the remaining DEPC. Many investigators keep the solutions
they use for RNA work separate to ensure that “dirty” pipets do not go
into them. CAUTION: Wear gloves and use a fume hood when using
DEPC, as it is a suspected carcinogen.
11.1.4.2 Equipment
Sorvall SS-34 rotor (or equivalent)
11.1.4.3 Glassware
1. Glass Teflon homogenizer
2. 5-ml polypropylene centrifuge tube
11.1.5 Experimental Protocol
Use deionized, distilled water in all recipes and protocol steps.
1. Add 1 ml denaturing solution per 100 mg tissue and homogenize with a
few strokes in a glass Teflon homogenizer.
2. Transfer the homogenate into a 5-ml polypropylene tube. Add 0.1 ml of
2M sodium acetate, pH 4, and mix thoroughly by inversion. Add 1 ml
water-saturated phenol, mix thoroughly, and add 0.2 ml of 49:1
chloroform/isoamyl alcohol. Mix thoroughly and incubate the
suspension 5 min at 0oC to 4
oC. Make sure that caps are tightly closed
when mixing.
3. Centrifuge 5 min at 10,000x g (9000 rpm in SS-34 rotor), 4oC. Transfer
the upper aqueous phase to a clean tube. The upper aqueous phase
contains the RNA, whereas the DNA and proteins are in the interphase
and lower organic phase.

58
4. Precipitate the RNA by adding 1 ml (1 vol.) of 100% isopropanol.
Incubate the samples 10 min at −20oC. Centrifuge 10 min at 10,000x g,
4oC, and discard supernatant
5. Dissolve the RNA pellet in 0.3 ml denaturing solution and transfer into a
1.5-ml microcentrifuge tube.
6. Precipitate the RNA with 0.3 ml (1 vol) of 100% isopropanol for 10 min
at −20oC. Centrifuge 10 min at 10,000x g, 4oC, and discard supernatant
7. Resuspend the RNA pellet in 75% ethanol, vortex, and incubate 10 min
at room temperature to dissolve residual amounts of guanidine
contaminating the pellet.
8. Centrifuge 5 min at 10,000x g, 4oC, and discard supernatant. Dry the
RNA pellet for 5 min.
9. Dissolve the RNA pellet in 100 to 200 μl DEPC-treated water
10. Quantitate RNA by diluting 5 μl in 1 ml alkaline water and reading the
A260 and A280.
11.1.6 Results
11.1.7 Discussion
Discuss the results and answer the following questions:
1. What is the importance of using guanidine thiocyanate?
2. Why RNA is extracted into one phase using phenol/chloroform while
DNA is present in another phase?
3. Is the homogenization step of any use?
4. Identify key steps in RNA isolation?
11.1.8 References
1. Ausubel FM, Brent R, Kingston RE, Moore DD, Seidman JG, Smith JA,
Struhl K (eds.) Current Protocols in Molecular Biology. John Wiley &
Sons, Inc. New York. 2003.
59
11.2 RNA Electrophoresis
11.2.1 Introduction
The integrity and size distribution of total RNA can be checked by denaturing
agarose gel electrophoresis and ethidium bromide staining. The respective ribosomal
bands should appear as sharp bands on the stained gel. 28S ribosomal RNA bands
should be present with intensity approximately twice that of the 18S rRNA band. If
the ribosomal bands in a given lane are not sharp, but appear as a smear of smaller
sized RNAs, it is likely that the RNA sample suffered major degradation during
preparation.
11.2.2 Theory
Formaldehyde agarose gels allow separation and identification of RNA based
on charge migration. Unlike DNA, RNA has a high degree of secondary structure,
making it necessary to use a denaturing gel. Formaldehyde in the gel disrupts
secondary RNA structure so that RNA molecules can be separated by their migration
under an electric field. In an electric field, nucleic acid molecules migrate towards the
anode due to negatively charged phosphates along the backbone. The migration of
denatured RNA molecules is determined by their size; however, the relationship
between the fragment size and rate of migration is nonlinear. Agarose gel analysis is
the most commonly used method for analyzing RNA species, which generally
correspond in size to the resolution range of an agarose gel. Small RNA fragments,
such as tRNAs or 5S rRNAs, can be analyzed by polyacrylamide gel electrophoresis.
11.2.3 Objective
1. The objective of this experiment is to give the practice for the students How to
run an RNA Agarose gel.
2. To find out the correct concentration of gel for the separation of RNA.
11.2.4 Materials
A. Chemicals
1. FA gel
Agarose 1.0 – 1.2 g
10x FA Gel buffer 10 ml
Add RNase-free water to 100 ml
2. FA Gel Buffer (10x)
Per Litre
20 mm mM MOPs 41.9 g
5 mM Sodium Acetate 6.8 g
0.5 M EDTA, pH 8.0 20 ml
Adjust pH to 7.0 with NaOH

60
Made in RNase free water
3. FA gel running Buffer (10x)
Per Litre
10x FA get buffer 100 ml
37% (11.2.3 M) Formaldehyde 20 ml
RNase free water 880 ml
4. RNA Loading 5x Buffer (10x))
Per Litre
Bromophenol blue 25 mg
0.5 M EDTA, pH 8.0 80 μl
37% (11.2.3 M) Formaldehyde 750 μl
Glycerol 2 ml
Formamide 3.084 ml
10x FA Gel Buffer 4 m
B. Equipments
Electrophoresis Apparatus (Bio-Rad or any suitable one)
11.2.5 Experimental Procedure
11.2.5.1 Pouring the gel
1. Prepare enough 10x FA gel buffer to pour the gel and to make
enough FA gel running buffer to fill the electrophoresis tank.
2. Mix an appropriate amount of agarose, 10x FA gel buffer, and
RNase-free water in a flask or bottle.
3. Heat the mixture in a microwave or boiling water bath, swirling the
vessel occasionally until the agarose is dissolved. Ensure that the lid
of the flask is loose to avoid buildup of pressure. Be careful not to let
the agarose solution boil over as it becomes super-heated. If the
volume of liquid reduces considerably during heating due to
evaporation, make up to the original volume with RNase-free
distilled water. This will ensure that the agarose concentration is
correct.
4. Cool the agarose to 65–70°C in a water bath. Stir or swirl
occasionally to prevent uneven cooling.
5. After cooling, add 1.8 ml of 37% (11.2.3 M) formaldehyde and 1 μl
of a 10 mg/ml ethidium bromide stock solution. Formaldehyde is
toxic. Use a fume hood to avoid inhalation. Wear gloves and take
appropriate safety precautions when handling. Make sure that the
solution has cooled sufficiently before adding formaldehyde and

61
ethidium bromide. Formaldehyde is volatile and may evaporate if
added to a solution that is too hot. Ethidium bromide in the gel
allows visualization of the RNA with UV light. Ethidium bromide is
toxic and a powerful mutagen. Wear gloves and take appropriate
safety precautions when handling. Use of nitrile gloves is
recommended as latex gloves may not provide full protection. After
use, ethidium bromide solutions should be decontaminated as
described in commonly used manuals. Stock solutions of ethidium
bromide (generally 10 mg/ml in water) should be stored at 2–8°C in
a dark bottle or a bottle wrapped in aluminum foil.
6. Pour the agarose solution onto the gel tray in a fume hood to a
thickness of 3–5 mm. Insert the comb either immediately before or
immediately after pouring. Let the gel set for at least 30 min. Ensure
that there is enough space between the bottom of the comb and the
gel tray (0.5–1.0 mm) to allow proper well formation and avoid
sample leakage. Make sure that there are no air bubbles in the gel or
trapped between the wells. Air bubbles can be carefully removed
with a Pasteur pipetts before the gel sets. Thicker gels can be used to
increase the amount of sample volume that can be loaded. Thinner
gels generally transfer better in northern blotting, but smaller sample
volumes can be used. The thickness of the comb affects the
sharpness of bands in the gel. A thinner comb gives sharper bands,
but less sample can be loaded per well.
7. Leaving the comb in the gel, place the gel in the electrophoresis tank.
Fill the tank with 1x FA gel running buffer. Add enough buffers to
cover the gel with approximately 1 mm of liquid above the surface of
the gel. If too much buffer is used, the electric current will flow
through the buffer instead of the gel.
8. Carefully remove the comb from the gel. Prior to running, let the gel
equilibrate in 1x FA gel running buffer for at least 30 min.
11.2.5.2 Running and analyzing formaldehyde agarose gels for RNA
analysis RNA loading buffer
RNA loading buffer must be added to samples before oading
them on a gel. The loading buffer serves three main purposes:
1. To denature the RNA sample prior to loading.
2. To increase the density of the samples to ensure that they
sink into the wells on loading.
3. To add color to the samples through the use of dyes,
facilitating loading and visualization on the gel while
running. A key feature of the concentrated RNA loading
buffer is that it allows a larger volume of RNA sample to be
loaded onto the gel than conventional protocols allow.
11.2.5.3 Electrophoresis buffers
RNA gels are run at a lower pH than DNA gels since RNA has a
lower pKa than DNA. Furthermore, unlike DNA, RNA is susceptible to
alkali cleavage at high pH. RNA gels should therefore be run at neutral

62
pH. MOPS (3-[N morpholino] propanesulfonic acid) is the most
commonly used buffer for RNA gels due to its high buffering capacity at
pH 7.0. Formaldehyde is included in the running buffer to keep the RNA
denatured. Formaldehyde is also added to the agarose gel. Electrophoresis
tanks should be cleaned with detergent solution (e.g., 0.5% SDS),
thoroughly rinsed with RNase-free water, and then rinsed with ethanol
(Plastics used for some electrophoresis tanks are not resistant to ethanol.
Take proper care and check the supplier’s instructions) and allowed to
dry.
11.2.5.4 Sample preparation for Electrophoresis
1. Add 1 volume of 5x RNA loading buffer to 4 volumes of RNA
sample (for example, 5 μl of loading buffer and 20 μl of RNA) and
mix. Samples should always be mixed with RNA loading buffer prior
to loading on a gel. Do not use sample volumes close to the capacity
of the wells as samples may spill over into adjacent wells during
loading. Be sure that all samples have the same buffer composition.
High salt concentrations will retard the migration of RNA molecules.
Ensure that no ethanol is present in the samples, for example, carried
over from purification procedures. Ethanol may cause samples to
float out of the wells on loading.
2. To denature RNA, incubate for 3–5 min at 65°C. Chill on ice.
11.2.5.5 Electrophoresis
1. Apply denatured samples to the wells of the gel. The gel should be
submerged in electrophoresis buffer in the electrophoresis tank prior
to loading. Prior to sample loading, remove air bubbles from the
wells by rinsing them with electrophoresis buffer. Make sure that the
entire gel is submerged in the FA gel running buffer. To load
samples, insert the pipet tip deep into the well and expel the liquid
slowly. Take care not to break the agarose with the pipet tip. Once
samples are loaded, do not move the gel tray/tank as this may cause
samples to float out of the wells. Be sure to include at least one lane
of appropriate molecular weight markers.
2. Connect the electrodes of the electrophoresis apparatus so that the
RNA will migrate towards the anode (usually red). The
electrophoresis apparatus should always be covered to protect against
electric shock. Run the gel in a fume hood to avoid exposure to
formaldehyde fumes from the gel and running buffer.
3. Turn on the power supply, and run the gel at 5–7 V/cm until the
bromophenol blue dye has migrated approximately 2/3 of the way
through the gel. Avoid use of high voltages, which can cause trailing
and smearing of RNA bands. Monitor the temperature of the buffer
periodically during the run. High temperature can cause partial
melting of the gel and distortion of the bands. If the buffer becomes
significantly heated, reduce the voltage.

63
11.2.5.6 Precautions
Ethidium bromide is toxic and a powerful mutagen. Wear gloves and
take appropriate safety precautions when handling. Use of nitrile gloves is
recommended, as latex gloves may not provide full protection. After use,
ethidium bromide solutions should be decontaminated. Stock solutions of
ethidium bromide (generally 10 mg/ml in water) should be stored at 2–8°C
in a dark bottle or a bottle wrapped in aluminum foil.
11.2.5.7 Visualization
Ethidium bromide in the gel allows visualization of the RNA with UV
light. Ethidium bromide–RNA complexes display increased fluorescence
compared to the uncomplexed dye in solution. This means that illumination
of a stained gel under UV light (254–366 nm) allows bands of RNA to be
visualized against a background of unbound dye. The gel image can be
recorded by taking a Polaroid™ photograph or using a gel documentation
system. UV light can damage the eyes and skin. Always wear suitable eye
and face protection when working with a UV light source. UV light damages
RNA. If RNA fragments are to be extracted from the gel, use a lower
intensity UV source if possible, and minimize exposure of RNA to the UV
light.
11.2.6 Results
1. Identify bands from the total RNA extract on the photograph of the
agarose formaldehyde gel.
2. Estimate the molecular weight of identified RNA bands.
11.2.7 Discussion
11.2.8 Questions
1. Why do we use formaldehyde in an RNA gel?
2. What is meant by RNA denaturation?
3. Which was easier DNA or RNA electrophoresis?, Why?
11.2.9 References:
1. Qiagen Bench Guide

64
12. DNA FINGER PRINTING
12.1 Introduction
The genome in all humans is the same and so is the gene map. However,
individual differs in one or more band pairs in the non-coding sequence at millions of
sites on the DNA and makes every person a very unique individual.
Using these sequences, every person could be identified solely by the
sequence of their base pairs. These patterns do not, however, give an individual
"fingerprint," but they are able to determine whether two DNA samples are from the
same person, related people, or non-related people. Scientists use a small number of
sequences of DNA that are known to vary among individuals a great deal, and analyze
those to get a certain probability of a match.
DNA fingerprinting requires the use of several biotechnological techniques,
and can vary among different DNA fingerprinting protocols. One way to make a DNA
fingerprint involves the use of restriction enzyme digestion, and agarose gel
electrophoresis. In order to understand DNA fingerprinting as in its entirety, it is
important to first understand each of these constitutive parts.
Restriction enzyme can be used to identify and cleave molecules of DNA at a
specific restriction sites. Because DNA from any two individuals is unique, the
digestion of every individual’s DNA will result in a unique set of restriction
fragments. These restriction fragments can be compared between individuals to
identify restriction fragment length polymorphisms (RFLPs). These RFLPs are the
basis of one type of DNA fingerprint.
12.2 Theory
Although 99.9% of human DNA sequences are the same in every person,
enough of the DNA is different to distinguish one individual from another. DNA
profiling uses repetitive ("repeat") sequences that are highly variable, called variable
number of tandem repeats (VNTR). VNTRs loci are very similar between closely
related humans, but so variable that unrelated individuals are extremely unlikely to
have the same VNTRs. When genomic DNA of certain organism is subjected to
restriction enzyme digestion and separated by agarose gel electrophoresis, we can see
different length RFLPs characteristic for that person. If we use DNA from different
individuals and cut it with the same restriction enzyme we will see different length
RFLPs. DNA fingerprinting is used in medical and forensic procedures, as well as in
paternity determinations to discern genetic relationships between individuals at the
molecular level.
12.3 Objectives
This experiment aims to explain how restriction enzymes cleave DNA (Note:
this was shown before), how electrophoresis is used to separate and visualize DNA
fragments, (Note: this was shown before), and how these techniques be combined to
obtain a DNA fingerprint. Students will understand the process of restriction enzyme
digestion and gel electrophoresis (Note: this was shown before), and how it is used to
analyze DNA. Students will understand impact of DNA technology on society.

65
12.4 Material
12.4.1 Chemicals
1. Agarose
2. Buffers, Ethedium bromide
3. Standard DNA ladder
4. Different DNA preparations from different organisms
5. Restriction enzyme (eg. Alu-I).
12.4.2 Equipment
1. Horizontal Electrophoresis apparatus
2. Power supply
3. Microwave
4. Transilluminator, and
5. Photoimager machin.
12.4.3 Plastic wares
1. Eppendorf tubes
2. Automatic pipettes.
12.4.4. Preparation of Solutions
A. Loading buffers
25mg bromophenol blue
4g sucrose
H2O to 10mL
Store at 4°C to avoid mould growing in the sucrose
B. Electrophoresis Running and gel buffer (TBE)
10.9 g Tris base
5.5 g Boric acid
0.465 g EDTA
Dissolve the ingredients in 900 ml of distilled water. pH to
about 8.3 using NaOH and make up to 1 L.
12.5 Experimental Procedure
12.5.1 Digestion of DNA Samples by Alu-I Enzyme
1. Label each eppendorff tube by giving a characteristic name.
2. Pipette 10 μl of each DNA sample from the stock tubes and transfer
to the corresponding tubes. Use a separate tip for each DNA
sample. Make sure the sample is transferred to the bottom of the
tubes.

66
3. Add the buffer and enzyme (10 μl of enzyme/buffer) into the
bottom of each tube.
4. Cap the tubes and mix the components by gently flicking the tubes
with your finger. If a microcentrifuge is available, pulse spin in the
centrifuge to collect all the liquid in the bottom of the tube.
Otherwise, tap the tube on a tabletop.
5. Incubate for 45 min at 37 °C.
6. After the incubation period, remove the tubes from the incubator
and go on to electrophoresis experiment.
12.5.2 Separation the digested DNA on Agarose electrophoresis gel
1. Prepare agarose gel with adequate concentration as previously
shown in table 1.
2. Mix six volumes of the DNA sample containing DNA with one
volume loading buffer (25 mg bromophenol blue, 4 g sucrose in10
mL H2O) and load onto the gel by pipe ting into the sample wells.
3. Cover the apparatus, and connect the power supply at a voltage no
more than 5 volts per cm to the gel (the cm value is the distance
between the two electrodes, not the length of the gel).
4. Switch off the power when the dyes have migrated an appropriate
distance (about 70% of the gel length).
5. The gel image can be recorded by exposing the gel to UV
transiluminator (254–366 nm) which allow bands of DNA bound
to ethidium bromide to be visualized against a background of
unbound dye.
6. Compare the migration of each DNA preparation and explain the
results.
12.6 Results
12.7 Discussion
67
12.8 Questions
1. Based on your analysis of the gel, what is your conclusion about the
DNA samples in the photograph (gel)?
2. Do any of the samples seem to be from the same source? If so, which
ones? Describe the evidence that supports your conclusion.
3. How many fragments were pr
4. oduced by the restriction enzyme Alu I?
5. What would be a logical explanation as to why there is more than one
band of DNA for each of the samples?
6. Which of the DNA samples have the same number of restriction sites for
the restriction endonucleases used? Write the lane numbers.
7. Which sample has the smallest DNA fragment?
12.9 References
1. Madigan M., Martinko JM, Dunlap PV and Clark DP. Brock’s Biology
of Microorganisms, 11th Edition. Benjamin Cummings. 2005
2. Tortora G J, Funke BR and Case CL. Microbiology An Introduction, 9th
3. Edition. Addison-Wesley. 2006.
4. Sambrook J, Fritsch EF and Maniatis T. Molecular Cloning: A
Laboratory Manual, 2nd Edition. Cold Spring Harbor Laboratory Press.
1989.
Recommended