Preparation and Characterization of a 5′-DeazaFAD T491V NADPH-CytochromeP450 Reductase†
Haoming Zhang,‡ Larry Gruenke,‡ A. Sami Saribas,‡ Sang-Choul Im,‡ Anna L. Shen,§ Charles B. Kasper,§ andLucy Waskell*,‡
UniVersity of Michigan and Veterans Administration Medical Center, 2215 Fuller Road, Ann Arbor, Michigan 48105, andMcArdle Laboratory for Cancer Research, UniVersity of Wisconsin, Madison, Wisconsin 53706
ReceiVed April 4, 2003
ABSTRACT: NADPH-cytochrome P450 reductase is a flavoprotein which contains both an FAD and FMNcofactor. Since the distribution of electrons is governed solely by the redox potentials of the cofactors,there are nine different ways the electrons can be distributed and hence nine possible unique forms of theprotein. More than one species of reductase will exist at a given level of oxidation except when theprotein is either totally reduced or oxidized. In an attempt to unambiguously characterize the redox propertiesof the physiologically relevant FMNH2 form of the reductase, the T491V mutant of NADPH-cytochromeP450 reductase has been reconstituted with 5′-deazaFAD which binds to the FAD-binding site of thereductase with aKd of 94 nM. The 5′-deazaFAD cofactor does not undergo oxidation or reduction underour experimental conditions. The molar ratio of FMN to 5′-deazaFAD in the reconstituted reductase was1.1. Residual FAD accounted for less than 5% of the total flavins. Addition of 2 electron equivalents tothe 5′-deazaFAD T491V reductase from dithionite generated a stoichiometric amount of the FMNhydroquinone form of the protein. The 5′-deazaFAD moiety remained oxidized under these conditionsdue to its low redox potential (-650 mV). The 2-electron-reduced 5′-deazaFAD reductase was capableof transferring only a single electron from its FMN domain to its redox partners, ferric cytochromec andcytochromeb5. Reduction of the cytochromes and oxidation of the reductase occurred simultaneously.The FMNH2 in the 5′-deazaFAD reductase autoxidizes with a first-order rate constant of 0.007 s-1.Availability of a stable NADPH-cytochrome P450 reductase capable of donating only a single electronto its redox partners provides a unique tool for investigating the electron-transfer properties of an intactreductase molecule.
NADPH-cytochrome P450 reductase from the rat is a78225 kDa flavoprotein anchored to the endoplasmic reticu-lum via a transmembraneR helix at its amino terminus. Itcontains two flavin cofactors, FAD1 and FMN, whichsequentially transfer two reducing equivalents from NADPHto cytochrome P450 (1-4). The sequence of electron transferis NADPH f FAD f FMN f cytochrome P450 (5, 6).Additional electron acceptors of the reductase are hemeoxygenase (7), cytochromeb5 (8), fatty acid elongase (9),and cytochromec (10). Ferricyanide and 2,3-dichloroin-dophenol are small molecule acceptors (11, 12). There arefour other FAD- and FMN-containing reductases which share30-40% identity with cytochrome P450 reductase; theyinclude bacterial sulfite reductase (13), nitric oxide synthasereductase (14), methionine synthase reductase (15), and novelreductase (16). Sequence analysis has shown that the amino-
terminal FMN-binding domain is homologous to bacterialflavodoxins, and the carboxyl-terminal FAD-binding domainresembles the ferredoxin-NADP+ reductase (1). The crystalstructure of rat cytochrome P450 reductase has confirmedthe structural homology with flavodoxins and the ferre-doxin-NADP+ reductase (17). An interflavin connectingregion with no sequence similarity to any known protein joinsthe flavin domains and has been postulated to orient the twoflavin cofactors for optimal electron transfer. In the crystalstructure, the isoalloxazine rings are aligned with thedimethylbenzene rings facing each other with 3.85 Å betweentheir C8 methyl groups. The flavin cofactors are, thus,appropriately positioned for rapid intramolecular electrontransfer. Molecular orbital calculations using optimizedgeometries reveal an increase in partial charges at the C8position upon reduction, consistent with a role for the methylgroups in electron transfer (18).
The distribution of electrons in the reductase is governedsolely by the redox potentials of the flavin (19). The redoxpotentials of the flavins in the rabbit cyt P450 reductase are(5, 20)
† This work was supported by National Institutes of Health Grantsto L.W. (GM35533) and C.B.K. (CA22484) and VA Merit ReviewGrant (L.W.).
* To whom correspondence should be addressed. Phone: (734) 769-7100 ext 5858. Fax: (734) 213-6985. E-mail: [email protected].
‡ University of Michigan and VA Medical Center.§ University of Wisconsin.1 Abbreviations: ATP, adenosine triphosphate; FAD, flavin adenine
dinucleotide; FMN, flavin mononucleotide; 5′-deazaFAD, 5′-deaza-riboflavin adenine dinucleotide; cyt P450 reductase, NADPH-cyto-chrome P450 reductase; cyt P450, cytochrome P450; cytb5, cytochromeb5; cyt c, cytochromec.
FMN + e f FMNH‚ E1 ) -110 mV
FMNH‚ + e f FMNH2 E2 ) -270 mV
FAD + e f FADH‚ E3 ) -290 mV
FADH‚ + e f FADH2 E4 ) -365 mV
6804 Biochemistry2003,42, 6804-6813
10.1021/bi030081m CCC: $25.00 © 2003 American Chemical SocietyPublished on Web 05/16/2003
Intraflavin electron transfer occurs with a rate constant of11-70 s-1 (21, 22). Each flavin can exist in three redox states(oxidized, 1-electron reduced, and 2-electron reduced).Therefore, nine unique species of reductase are possible. Atany given level of reduction except completely oxidized orreduced, a mixture of reductase species will be present. Forinstance, in a 3-electron-reduced reductase preparation areductase molecule may contain either 2, 3, or 4 electrons.To further complicate matters, it is also possible for the 3electrons in a reductase molecule to be distributed differentlybetween the flavin cofactors. This complexity makes itvirtually impossible to deconvolute the spectral changes andassign them to a specific electron-transfer process (19). Forexample, the first electron will largely reduce FMN to thesemiquinone (E1 ) -110 mV), but addition of the secondelectron will lead to the formation of four different speciesof the reductase which readily interconvert.
To investigate the function of the individual FAD andFMN cofactors, two different approaches have been em-ployed. In one method, either the FAD or FMN wasselectively removed to generate either the FAD- or FMN-depleted reductase (5, 6, 23, 24). The FMN cofactor with aKd of ∼10 nM is more readily removed (5, 6). In contrast,the FAD cofactor is bound tightly to the reductase with aKd of <1 nM and is difficult to remove. In the secondmethod, the separate soluble FMN- and FAD-bindingdomains have been cloned, expressed, and characterized(25-27). These studies have provided important informationabout the function and chemistry of the individual flavincofactors in the reductase. Furthermore, they have alsodemonstrated that although FMN and FAD bind to theirrespective domains in the absence of the second domain,alterations in one domain do have an impact on the structuralintegrity and activity of the remaining domain (6, 23, 24,28).
To be able to investigate the ability of the FMN domainof the reductase to donate a single electron to a proteinacceptor, it was necessary to both simplify the complexspectral changes occurring in the native reductase duringelectron transfer and to conduct experiments with a reductasemolecule that had normal activity with its redox partners.The T491V mutant of cyt P450 reductase was utilized forthis purpose. This mutant reductase was selected for ourstudies because it binds FAD 100-fold less tightly than thenative reductase but otherwise functions normally (28). Theside chain of T491 forms a hydrogen bond with thephosphate group of FAD which is lacking when valinereplaces threonine in the mutant protein. The diminishedaffinity of the T491V reductase for FAD facilitates thereplacement of FAD with 5′-deazaFAD, a low-potentialflavin analogue, which is not reduced either by NADPH orby dithionite under our experimental conditions. Character-ization of the 5′-deazaFAD T491V reductase, from hereonreferred to as 5′-deazaFAD reductase, revealed that the FMNdomain was capable of donating a single electron to twodifferent heme proteins, cytochromeb5 and cytochromec,at rates similar to those of the native reductase. Availabilityof this spectroscopically and functionally characterizedreductase will make possible further studies with its physi-ological redox partners.
MATERIALS AND METHODS
Materials. All chemicals used are of ACS grade unlessotherwise specified. FMN, FAD, sodium dithionite, and horseheart cytc were purchased from Sigma-Aldrich (St. Louis,MO). ATP was purchased from Boehringer Mannheim(Indianapolis, IN), and dilauroylphosphatidylcholine (DLPC)was from Doosan Serdary Research Laboratory (Toronto,Canada). Horse heart cytc was further purified on a 10×64 mm ion-exchange column (Bio-Scale S5, Bio-Rad,Berkeley, CA) using a Waters 650E protein purificationsystem. It is of note that impurities existing in commercialglycerol, even in spectrophotometric grade, are capable ofreducing cytc as well as cytb5 under anaerobic conditions.Therefore, the glycerol used for all of our stopped-flowstudies was distilled twice under vacuum to remove theimpurities. 5′-Deazariboflavin was a gift from Dr. VincentMassey (University of Michigan, Ann Arbor, MI), Dr.William McIntire (University of California, San Francisco,CA), and Dr. Marilyn Jorns (Hahnemann School of Medi-cine, Philadelphia, PA).
Synthesis and Purification of 5′-DeazaFAD.5′-DeazaFADwas synthesized from 5′-deazariboflavin in the presence ofATP and FAD synthetase as previously described (29). FreeFAD was removed from FAD synthetase (a gift from Dr.William McIntire, University of California, San Francisco,CA) by washing the FAD synthetase with buffer A (10 mMTris-HCl, 200 mM NaCl, 3 mM ATP, pH 7.4) at 10°C untilthe absorbance of the filtrate at 450 nm decreased to<0.005au. In a typical reaction, 1 mL ofN,N-dimethylformamidecontaining 5 mg of 5′-deazariboflavin was added to 250 mLof buffer B (10 mM potassium phosphate, 8 mM MgCl2, 2mM ATP, pH 6.7). The reaction was initiated by additionof 7 mg of FAD synthetase. The reaction mixture wasincubated at 37°C with shaking at 110 rpm. After 3 h ofincubation, another 7 mg of FAD synthetase was added tothe reaction mixture. Aliquots of the reaction mixture werewithdrawn at various times and examined by thin-layerchromatography (TLC) to determine whether the reactionwas complete. TLC was performed on a silica gel coatedpolyester film (Whatman Ltd., Hillsboro, OR). The mobilephase consisted of butanol, acetic acid, and water at a ratioof 12:3:5. Under these conditions, the rate of migration is5′-deazariboflavin> 5′-deazaFMN> 5′-deazaFAD. Theflavins were detected by their fluorescence under UV light.
Upon completion of the reaction, the reaction mixture wascentrifuged at 12000× g for 15 min to remove particulatematter. The supernatant containing the 5′-deazaFAD wasloaded onto a Sep-Pak C18 cartridge (Waters Corp.) thathad previously been washed with 3-5 volumes of 100%acetonitrile and subsequently equilibrated with distilled water.The cartridge with the adsorbed 5′-deazaFAD was thenwashed with 3 volumes of distilled water, and the 5′-deazaFAD was eluted with a solution of 10% acetonitrile:90% H2O. Pure 5′-deazaFAD was obtained by evaporatingthe solvent.
Expression and Purification of Cyt b5 and T491V Cyt P450Reductase from Escherichia coli.The detergent-solubilizedform of rabbit cytb5 was expressed and purified as previouslydescribed (30). Briefly, the expressed apo-cytb5 wasextracted from the lysedE. coli and subsequently reconsti-tuted with exogenous heme. The first step in the purification
5′-DeazaFAD T491V NADPH-Cyt P450 Reductase Biochemistry, Vol. 42, No. 22, 20036805
procedure was chromatography on a DEAE-Sepharose anion-exchange column. This was followed by size-exclusionchromatography on a Superdex 75 column. The purified cytb5 has a specific content of 50 nmol of heme/mg of protein.The concentration of cytb5 was determined spectrophoto-metrically using an extinction coefficient of∆ε409-424nm of185 mM-1 cm-1 between reduced and oxidized cytb5.
Rat wild-type and T491V cyt P450 reductase wereexpressed inE. coli and purified as previously described (31).Briefly, the bacterial membrane fraction was isolated andsolubilized with 0.1% Triton X-100. The solubilized reduc-tase was purified on a 2′,5′-ADP Sepharose affinity column.Residual detergent was removed from the cyt P450 reductaseon a hydroxyapatite column. The purified protein wassuspended in buffer C (0.1 M potassium phosphate, 15%glycerol, pH 7.4) and stored at-80 °C. The concentrationof FAD- and FMN-containing holo-cyt P450 reductase wasdetermined from its flavin content using an extinctioncoefficient of 21.4 mM-1cm-1 at 454 nm (19). Proteinconcentration was determined using a kit purchased fromPierce (no. 23240). Bovine serum albumin was used as astandard.
Preparation of 5′-DeazaFAD T491V Cyt P450 Reductase.Substitution of 5′-deazaFAD for FAD in T491V reductasewas achieved by incubating the T491V reductase in thepresence of excess 5′-deazaFAD at 20( 2 °C. In a typicalexchange reaction, the T491V reductase was suspended at∼1 µM concentration in buffer C that contained a 3-foldmolar excess of 5′-deazaFAD. FMN (∼5 µM) was alsoincluded in the suspension to prevent dissociation of FMNfrom the reductase. The solution was incubated at 20°C for30 min to allow flavin exchange to occur. Free 5′-deazaFADand FMN were removed from the reductase by centrifugingthe mixture at 6000 rpm for 30 min in an Apollo concentrator(Orbital Biosciences). The reductase was then resuspendedin buffer C. The exchange process was repeated until greaterthan 95% of the FAD molecules in the reductase had beenreplaced by 5′-deazaFAD. Typically, this occurred after threeexchange reactions but occasionally required four.
The extent of FAD to 5′-deazaFAD exchange was evalu-ated by measuring the ability of the reductase to reduce cytc in the presence of NADPH after each cycle of exchange.Only those reductase molecules that contain both FAD andFMN will be able to accept electrons from NADPH andreduce cyt c. The assay was performed as previouslydescribed in 0.27 M potassium phosphate buffer (pH 7.7) at30 °C unless otherwise specified (28). The formation offerrous cyt c was monitored at 550 nm on a Cary 300spectrophotometer. An extinction coefficient of 21.1 mM-1
cm-1 was used to determine the amount of cytc reduced.The specific activity of the reductase was determined fromthe initial rate of the reaction and expressed as micromolesof cyt c reduced per minute per milligram of reductase.
Determination of the FlaVin Content of 5′-DeazaFADT491V Cyt P450 Reductase by HPLC.The amount of FAD,FMN, and 5′-deazaFAD in the reductase samples wasmeasured using a modification of a previously describedHPLC method (32, 33). The HPLC assay was performed ona Waters HPLC system consisting of two Waters 510 pumps,a system interface module, a Waters 590 UV-visibledetector, and a PC workstation. Separation of the three flavinswas achieved on a reverse-phase C18 column (4.6× 250
mm, Lichrospher 5RP18, Varian Inc.) with a mobile phaseof 20% methanol/80% potassium phosphate buffer (5 mM,pH 6.0). A 10× 3 mm guard column (ChromGuard, VarianInc.) was placed in front of the C18 column to remove smallparticles. Elution of the flavins was monitored at both 450and 268 nm. The concentration of the standard solutions ofFAD, FMN, and 5′-deazaFAD was determined using extinc-tion coefficients ofε450nm) 11.3 mM-1 cm-1 (34), ε450nm)12.2 mM-1 cm-1 (35), andε399nm ) 11.5 mM-1 cm-1 (36),respectively. A standard curve for quantification of each ofthe three flavins was obtained by integrating the area underthe 268 nm absorbance peak of the flavin and plotting thisarea versus the amount of flavin loaded onto the column.The flavin calibration curve and reductase samples wereprepared and analyzed on the same day. Typically, aliquotsof 50-100 µL of reductase (5-10 µM) were sealed in amicrotube and heated at 95°C for 5 min in the dark to releaseflavins from the reductase. The heated samples were thenplaced on ice for 3-5 min and subsequently centrifuged for10 min to remove the denatured protein. A 10-20µL aliquotof the supernatant was loaded onto the HPLC column andeluted with 20% methanol/80% potassium phosphate buffer(5 mM, pH 6.0) at a flow rate of 0.8 mL/min.
Reduction of the Cyt P450 Reductase Preparations witha Stoichiometric Amount of Dithionite.The redox propertiesof 5′-deazaFAD reductase were examined by reducing thereductase with sodium dithionite under anaerobic conditions.Oxygen was removed from buffer solutions, glassware, andreductase samples by incubating them overnight in ananaerobic glovebox (Belle Technology, Portesham, Dorset,England). After an overnight incubation in the glovebox, theoxygen concentration in the buffer was∼0.1 µM. Thereductase sample was maintained at 4°C overnight in theglovebox to prevent inactivation. Typically, 1.5 mL of adeoxygenated solution of reductase (5-10 µM) in buffer Cwas reduced in a tonometer with a standardized solution ofdithionite at 25°C. Methyl viologen, which functions as anelectron mediator, was present at a final concentration of0.1 µM. Dithionite was added in 2µL increments using aHamilton syringe. The reduction of the reductase by analiquot of dithionite was considered complete when theabsorbance change at 450 nm stabilized, typically, after 10-15 min. The dithionite solution was standardized by deter-mining how much dithionite was required to reduce a knownamount of cytb5.
Kinetics of Electron Transfer from the Wild-Type, T491V,and 5′-Deaza T491V Reductase to Oxygen, Ferric Cyt c, andFerric Cyt b5. The kinetics of electron transfer from thevarious reductase preparations to an protein electron acceptorwere studied under anaerobic conditions using a SF61DX2stopped-flow spectrophotometer (Hi-Tech) housed in ananaerobic glovebox. To characterize the autoxidation of thedifferent reductases, the reduced protein was loaded into oneof the driving syringes while buffer C which had beenequilibrated with room air was loaded into the second drivingsyringe. The concentration of oxygen at 15°C in buffer Cis =320 µM (37). The final concentration of the reductasein the observation cell was 2.5-5 µM. The contents of thetwo syringes were rapidly mixed, and the absorbance changesoccurring during the autoxidation of the reductase wererecorded in the single wavelength mode at 450 and 585 nm.
6806 Biochemistry, Vol. 42, No. 22, 2003 Zhang et al.
Electron transfer from the mutant and wild-type reductasesto ferric cyt c was characterized under pseudo-first-orderconditions. The final concentration of the 4-electron-reducedwild-type and T491V reductase in the observation cuvettewas∼2.5µM whereas the 2-electron-reduced 5′-deazaFADreductase was present at∼5 µM. The four final concentra-tions of ferric cytc were 7.5, 15, 30, and 50µM, respectively.Reduction of cytc was followed at 550 nm (∆ε ) 21.1 mM-1
cm-1) (38). At this wavelength the reductase also exhibits asmall increase in absorbance due to formation of thesemiquinone (∆ε550 ) 2.5 mM-1 cm-1). Oxidation of thereductase was monitored at 431 nm, which is an isosbesticpoint for cytc. Kinetic traces at 550 and 431 nm were fittedwith two exponential functions, and two apparent rateconstants (k1
app, k2app) were obtained. A plot ofkapp vs
concentration of cytc yields the second-order rate constant.Electron transfer from 5′-deazaFAD reductase to ferric cyt
b5 under anaerobic conditions was also characterized usingstopped-flow spectrophotometry. Reduction of cytb5 wasmonitored at 420 nm (∆ε ) 80 mM-1 cm-1) where thespectral changes from 5′-deazaFAD reductase are negligible(∆ε ) 0.6 mM-1 cm-1) (see Figure 3). Oxidation of thereductase was monitored at 567 nm (∆ε ) 2.5 mM-1 cm-1),which is an isosbestic point for cytb5 (39). Rate constantsand amplitudes were obtained by fitting the kinetic traceswith multiple exponential functions using KinetAsyst 2software (Hi-Tech).
RESULTS AND DISCUSSION
Determination of the Dissociation Constant, Kd, between5′-DeazaFAD and T491V Cyt P450 Reductase.Preliminaryexperiments indicated that the FAD-depleted T491V reduc-tase was unstable and became inactive shortly after FADwas removed. Other investigators have made similar obser-vations and noted that although the individual domains arecompetent in binding their respective FMN and FADcofactors, alterations in one domain do impact the integrityof the second domain (6, 24, 28). It was, therefore, necessaryto reconstitute the protein with a flavin analogue that wouldmaintain the structural integrity of the reductase, yet be redoxinactive under our experimental conditions. 5′-DeazaFADwas selected because it is structurally similar to FAD,differing only at position 5 where the nitrogen of FAD hasbeen replaced by a carbon which is inert in redox reactionscompared to nitrogen. It is known that the N5 nitrogen ofFAD receives the hydride ion from NADPH. As a result ofthis substitution, 5′-deazaFAD is 3-4 orders of magnitudeless reactive with NADPH. In addition, the 5′-deazaFADsemiquinone is also destabilized both in the protein and freein solution where the potential between the oxidized andsemiquinone flavin is-650 mV. Thus, 5′-deazaFAD shouldmaintain the structural integrity of the FAD domain but notundergo electron-transfer reactions under our experimentalconditions.
To minimize the amount of the scarce 5′-deazaFADrequired for preparation of 5′-deazaFAD reductase, theKd
between 5′-deazaFAD and T491V reductase was determined.This information was then used to devise an efficient methodof exchanging FAD for 5′-deazaFAD. TheKd between 5′-deazaFAD and T491V reductase was determined by moni-toring the activity of T491V reductase in the presence of
various molar ratios of free 5′-deazaFAD and FAD. When5′-deazaFAD displaces FAD and binds to the T491Vreductase, the reductase is unable to accept a hydride ionfrom NADPH. It will, therefore, not be able to reduce cytcwhich receives an electron from the FMNH2 of the reductase.Table 1 shows that the activity of the T491V reductaseprogressively decreases when it is incubated in the presenceof 10 µM FAD and increasing concentrations (0, 10, and 20µM) of 5′-deazaFAD. This decrease in activity is attributedto the substitution of 5′-deazaFAD for FAD.
At equilibrium, the following two equations define thedissociation constant between the reductase and each of theflavins:
where PR is the free reductase without FAD or 5′-deazaFAD,5′-deazaFAD-PR and FAD-PR are the complexes betweenreductase and either 5′-deazaFAD or FAD, respectively, and5′-deazaFAD and FAD are the unbound free flavins. Therelative dissociation constantKd
R is given by
In the presence of both FAD and 5′-deazaFAD the ratio of[FAD-PR]/[5′-deazaFAD-PR] is proportional toν/(ν0 - ν),where ν0 is the activity of the FAD-containing T491Vreductase in the absence of 5′-deazaFAD andν is the activityof the T491V reductase in the presence of both FAD and5′-deazaFAD. The relative dissociation constant can befurther simplified to eq 4 by substitutingν andν0 - ν intoeq 3:
The activity of the T491V reductase was measured in thepresence of varying concentrations of FAD and 5′-dea-zaFAD. Since the added free FAD and 5′-deazaFAD werepresent at∼1000-fold excess relative to the reductase, theconcentration of the free flavins was considered to be theadded concentration. By substituting the values for theactivity of the reductase in the presence of varying ratios of
Table 1: Cytc Reductase Activity of T491V Reductase in thePresence of Excess Free FAD and 5′-DeazaFAD
FAD:5′-deazaFADν (nmol of cytcreduced/min)a Kd
R b
1:0 35.91:1 15.7 0.781:2 10.5 0.78
a The assay was performed as described in Materials and Methodswith the following modifications. The reaction was performed at 30°C in 0.3 M potassium phosphate buffer (pH 7.7), 10µM FAD, andeither 0, 10, or 20µM 5′-deazaFAD. The reaction was initiated byaddition of NADPH to a final concentration of 0.3 mM.b Relativedissociation constant (see text for details).
Kd5′-deaza)
[PR][5′-deazaFAD]
[5′-deazaFAD-PR](1)
KdFAD )
[PR][FAD]
[FAD-PR](2)
KdR )
Kd5′-deazaFAD
KdFAD
)[FAD-PR][5′-deazaFAD]
[FAD][5 ′-deazaFAD-PR](3)
KdR )
[5′-deazaFAD]ν[FAD](ν0 - ν)
(4)
5′-DeazaFAD T491V NADPH-Cyt P450 Reductase Biochemistry, Vol. 42, No. 22, 20036807
high concentrations of the added flavins into eq 4, a relativedissociation of 0.78 was calculated (Table 1). TheKm of FADfor the T491V reductase is 0.12µM, and it has been assumedin these experiments that theKm and Kd are similar (28).Substituting these values into eq 3 indicates that theKd
between 5′-deazaFAD and T491V reductase is 94 nM at 30°C. The relativeKd
R for 5′-deazaFAD and FAD is 0.78,which indicates that the two flavins bind with similar affinityto the FAD domain of T491V reductase. The almost identicalaffinity of FAD and 5-deazaFAD for the reductase providedthe theoretical basis for preparing the 5′-deazaFAD reductase.
Preparation of 5′-DeazaFAD T491V Reductase. The 5′-deazaFAD reductase was prepared by incubating the T491Vreductase with a 3-fold molar excess of 5′-deazaFAD. Atequilibrium, the reductase should contain 25% FAD and 75%5′-deazaFAD. Following incubation of the reductase withthe 5′-deazaFAD, the unbound FAD and 5′-deazaFAD wereremoved from the reductase. The reductase now containinga mixture of 25% FAD and 75% 5′-deazaFAD was incubateda second time with 5′-deazaFAD to continue replacing FADwith 5′-deazaFAD. Repetition of this process three to fourtimes resulted in a reductase molecule in which the 5′-deazaFAD replaced the FAD by>95% (see later section).This 5′-deazaFAD T491V reductase was shown to be activein reducing cytc by subsequently replacing the 5′-deazaFADwith FAD and measuring the ability of the “back-exchanged”reductase to reduce cytc in the presence of NADPH.Approximately 64-75% of the original T491V reductaseactivity could be recovered by replacing the 5′-deazaFADwith FAD. Treatment of the FAD-containing T491V reduc-tase in a parallel manner resulted in a 16% loss in activity.The temperature at which the flavins are exchanged is critical.At 30-35 °C, the flavin exchange occurred rapidly but thereductase was inactivated. However, between 4 and 10°C,the reductase was stable but the substitution of one flavinfor another was too slow. As a compromise, the flavinexchange was conducted at 20-22 °C for 30 min.
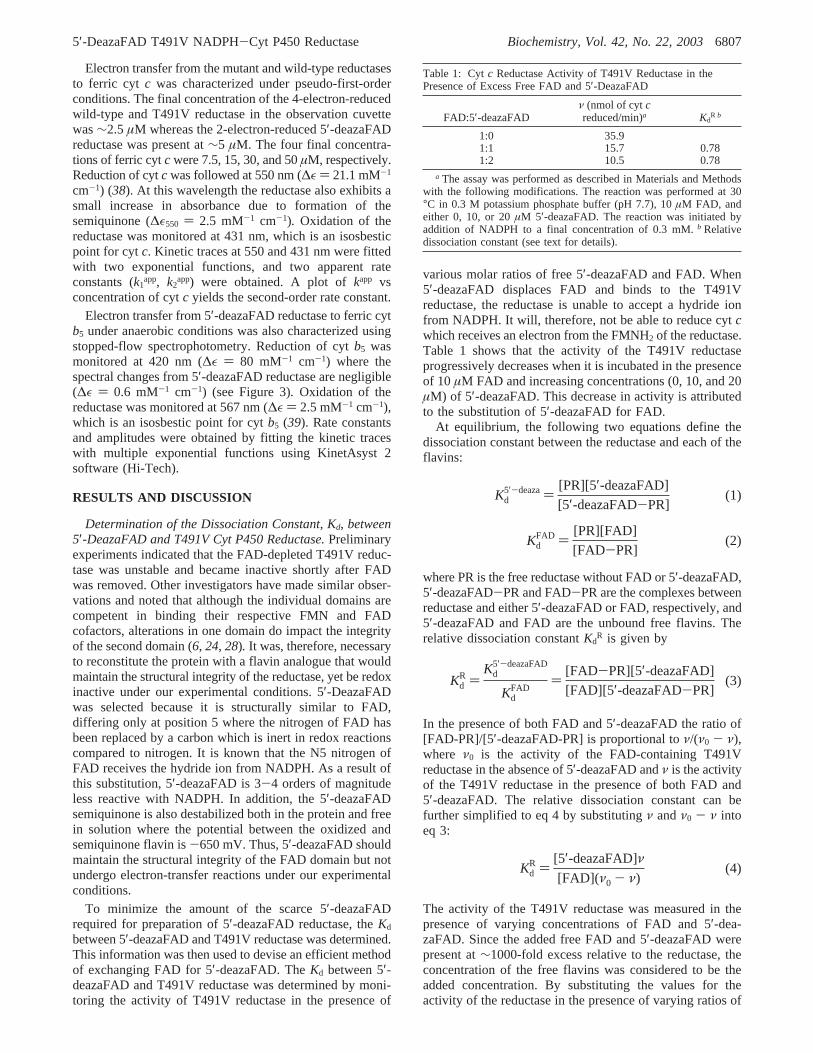
Determination of the FlaVin Content of 5′-DeazaFADT491V Cyt P450 Reductase.An unambiguous interpretationof experiments with the 5′-deazaFAD reductase requires thatthe FAD in the reductase is replaced by 5′-deazaFAD. Theflavin content of the 5′-deazaFAD T491V reductase wasdetermined using an HPLC assay capable of resolving thethree possible flavins, i.e., FMN, 5′-deazaFAD, and FAD.The UV-visible spectra of the free oxidized FAD, FMN,and 5′-deazaFAD are shown in Figure 1. Free FAD and FMNhave absorption maxima at 440 and 369 nm in the visiblespectrum and at 263 nm in the UV. The absorption maximaof free 5′-deazaFAD are blue shifted by approximately 40nm to 400 and 336 nm in the visible region while theabsorption maximum in the UV spectrum is blue shifted to255 nm. The spectrum of 5-deazaFAD in Figure 1 is identical
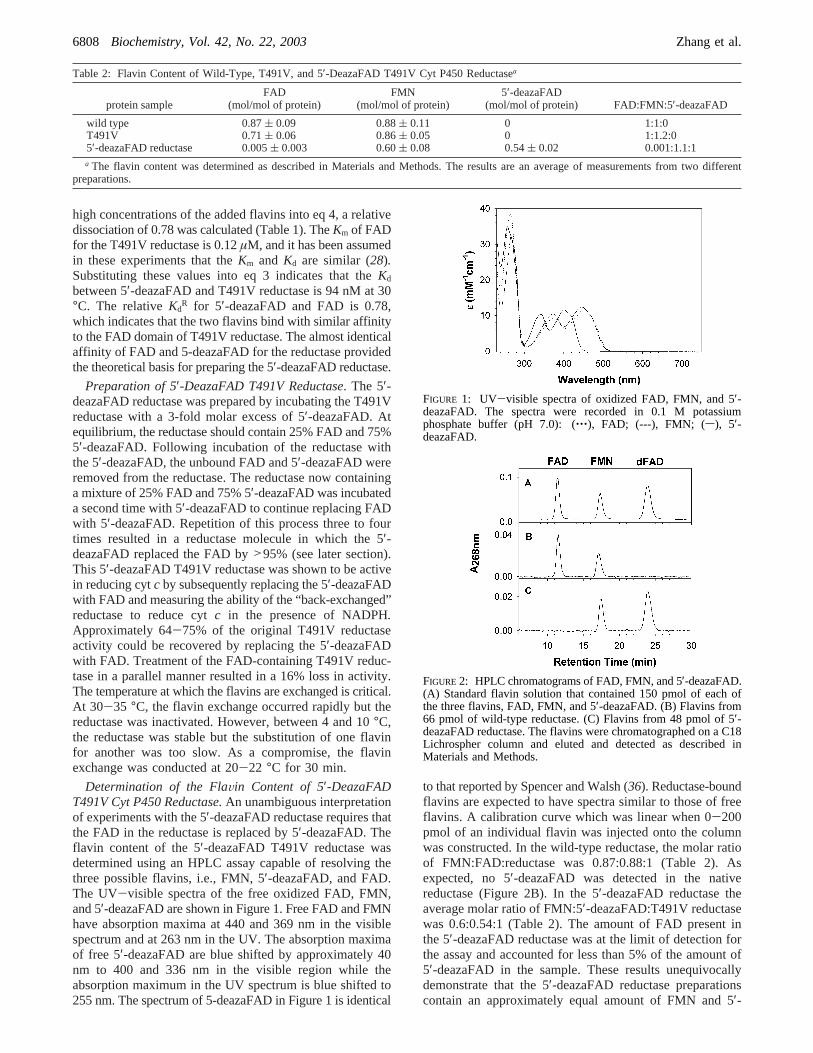
to that reported by Spencer and Walsh (36). Reductase-boundflavins are expected to have spectra similar to those of freeflavins. A calibration curve which was linear when 0-200pmol of an individual flavin was injected onto the columnwas constructed. In the wild-type reductase, the molar ratioof FMN:FAD:reductase was 0.87:0.88:1 (Table 2). Asexpected, no 5′-deazaFAD was detected in the nativereductase (Figure 2B). In the 5′-deazaFAD reductase theaverage molar ratio of FMN:5′-deazaFAD:T491V reductasewas 0.6:0.54:1 (Table 2). The amount of FAD present inthe 5′-deazaFAD reductase was at the limit of detection forthe assay and accounted for less than 5% of the amount of5′-deazaFAD in the sample. These results unequivocallydemonstrate that the 5′-deazaFAD reductase preparationscontain an approximately equal amount of FMN and 5′-
Table 2: Flavin Content of Wild-Type, T491V, and 5′-DeazaFAD T491V Cyt P450 Reductasea
protein sampleFAD
(mol/mol of protein)FMN
(mol/mol of protein)5′-deazaFAD
(mol/mol of protein) FAD:FMN:5′-deazaFAD
wild type 0.87( 0.09 0.88( 0.11 0 1:1:0T491V 0.71( 0.06 0.86( 0.05 0 1:1.2:05′-deazaFAD reductase 0.005( 0.003 0.60( 0.08 0.54( 0.02 0.001:1.1:1a The flavin content was determined as described in Materials and Methods. The results are an average of measurements from two different
preparations.
FIGURE 1: UV-visible spectra of oxidized FAD, FMN, and 5′-deazaFAD. The spectra were recorded in 0.1 M potassiumphosphate buffer (pH 7.0): (‚‚‚), FAD; (---), FMN; (s), 5′-deazaFAD.
FIGURE 2: HPLC chromatograms of FAD, FMN, and 5′-deazaFAD.(A) Standard flavin solution that contained 150 pmol of each ofthe three flavins, FAD, FMN, and 5′-deazaFAD. (B) Flavins from66 pmol of wild-type reductase. (C) Flavins from 48 pmol of 5′-deazaFAD reductase. The flavins were chromatographed on a C18Lichrospher column and eluted and detected as described inMaterials and Methods.
6808 Biochemistry, Vol. 42, No. 22, 2003 Zhang et al.
deazaFAD with a negligible amount of residual FAD (Table2).
Effect of Supplemental FAD and FMN on the ActiVity ofT491V and 5′-DeazaFAD T491V Cytochrome P450 Reduc-tase.To ensure that all available flavin binding sites on thereductase were occupied, the activity of the FAD-containingwild-type and 5′deazaFAD T491V reductase preparationswas measured in the presence of increasing concentrationsof FAD and FMN. As expected, addition of FAD to the 5′-deazaFAD T491V reductase stimulated its activity by=1000-fold; in contrast, addition of a 2000-fold excess ofFMN to the maximally FAD stimulated T491V reductasedid not result in any further increase in activity (Table 3).This observation indicates that the low specific flavin contentof our reductase preparation cannot be attributed to unoc-cupied but otherwise competent FMN binding sites. If thelow specific flavin content of our reductase were due to arandom distribution of FMN and FAD in different reductasemolecules, addition of an excess of FMN to a T491Vreductase preparation saturated with FAD would double theactivity. Clearly, this did not occur. It has been ourexperience that for unknown reasons the specific flavincontent of the reductase depends on the particular enzymepreparation. Either the preparation has impurities or inactivereductase incapable of binding exogenous flavins is presentor both. Since there is only a single band on the SDS-PAGE,it is likely that the flavin content of the 5′-deazaFAD T491Vreductase used in the experiments reported here is lowbecause of inactive enzyme which, in turn, is secondary toan extensive enzyme preparation procedure and the instabilityof the reductase in the absence of bound FAD. Despite thevariable specific content of the enzyme preparations, theenzymatic activity correlates with the amount of FMN inthe reductase preparation and cannot be significantly in-creased with additional FMN. As will be shown later thenon-flavin-containing protein does not influence the kineticsof electron transfer.
Table 3 also illustrates the effect of addition of FAD andFMN to T491V reductase. As predicted from theKd (0.12µM) of FAD for the T491V reductase and the finalconcentration of reductase (10 nM) in the cytc assay, amajority of the FAD will dissociate from the reductase whenit is diluted into the cytc assay reaction mixture. Thus FADin the reaction mixture enhances the activity of the T491Vreductase by ensuring the enzyme binds its full complementof the cofactor (28). FMN did not stimulate the activity ofthe FAD-saturated T491V reductase, indicating that allcompetent FMN binding sites were occupied. The activityof the wild-type reductase which had a specific flavin contentsimilar to the T491V enzyme was not stimulated by additionof either flavin (Table 3). Using Dyna Fit software, theKd
of FAD for the T491V and 5′-deazaFAD T491V preparationswas determined to be 0.084( 0.012µM and 0.08( 0.01µM, respectively, at 15°C (40).
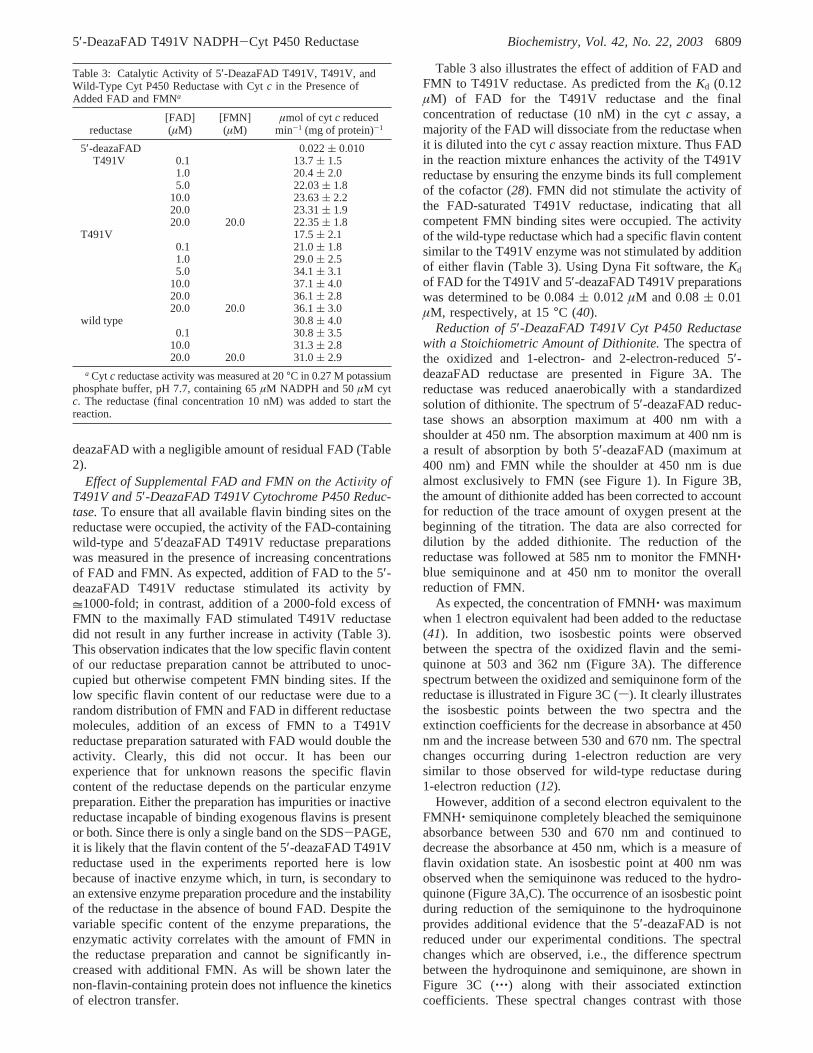
Reduction of 5′-DeazaFAD T491V Cyt P450 Reductasewith a Stoichiometric Amount of Dithionite.The spectra ofthe oxidized and 1-electron- and 2-electron-reduced 5′-deazaFAD reductase are presented in Figure 3A. Thereductase was reduced anaerobically with a standardizedsolution of dithionite. The spectrum of 5′-deazaFAD reduc-tase shows an absorption maximum at 400 nm with ashoulder at 450 nm. The absorption maximum at 400 nm isa result of absorption by both 5′-deazaFAD (maximum at400 nm) and FMN while the shoulder at 450 nm is duealmost exclusively to FMN (see Figure 1). In Figure 3B,the amount of dithionite added has been corrected to accountfor reduction of the trace amount of oxygen present at thebeginning of the titration. The data are also corrected fordilution by the added dithionite. The reduction of thereductase was followed at 585 nm to monitor the FMNH‚blue semiquinone and at 450 nm to monitor the overallreduction of FMN.
As expected, the concentration of FMNH‚ was maximumwhen 1 electron equivalent had been added to the reductase(41). In addition, two isosbestic points were observedbetween the spectra of the oxidized flavin and the semi-quinone at 503 and 362 nm (Figure 3A). The differencespectrum between the oxidized and semiquinone form of thereductase is illustrated in Figure 3C (s). It clearly illustratesthe isosbestic points between the two spectra and theextinction coefficients for the decrease in absorbance at 450nm and the increase between 530 and 670 nm. The spectralchanges occurring during 1-electron reduction are verysimilar to those observed for wild-type reductase during1-electron reduction (12).
However, addition of a second electron equivalent to theFMNH‚ semiquinone completely bleached the semiquinoneabsorbance between 530 and 670 nm and continued todecrease the absorbance at 450 nm, which is a measure offlavin oxidation state. An isosbestic point at 400 nm wasobserved when the semiquinone was reduced to the hydro-quinone (Figure 3A,C). The occurrence of an isosbestic pointduring reduction of the semiquinone to the hydroquinoneprovides additional evidence that the 5′-deazaFAD is notreduced under our experimental conditions. The spectralchanges which are observed, i.e., the difference spectrumbetween the hydroquinone and semiquinone, are shown inFigure 3C (‚‚‚) along with their associated extinctioncoefficients. These spectral changes contrast with those
Table 3: Catalytic Activity of 5′-DeazaFAD T491V, T491V, andWild-Type Cyt P450 Reductase with Cytc in the Presence ofAdded FAD and FMNa
reductase[FAD](µM)
[FMN](µM)
µmol of cytc reducedmin-1 (mg of protein)-1
5′-deazaFAD 0.022( 0.010T491V 0.1 13.7( 1.5
1.0 20.4( 2.05.0 22.03( 1.8
10.0 23.63( 2.220.0 23.31( 1.920.0 20.0 22.35( 1.8
T491V 17.5( 2.10.1 21.0( 1.81.0 29.0( 2.55.0 34.1( 3.1
10.0 37.1( 4.020.0 36.1( 2.820.0 20.0 36.1( 3.0
wild type 30.8( 4.00.1 30.8( 3.5
10.0 31.3( 2.820.0 20.0 31.0( 2.9
a Cyt c reductase activity was measured at 20°C in 0.27 M potassiumphosphate buffer, pH 7.7, containing 65µM NADPH and 50µM cytc. The reductase (final concentration 10 nM) was added to start thereaction.
5′-DeazaFAD T491V NADPH-Cyt P450 Reductase Biochemistry, Vol. 42, No. 22, 20036809
observed in the wild-type FAD-containing reductase whereaddition of the second electron generates approximately equalamounts of both FMNH2 and FADH‚ semiquinone, whichcontinues to absorb at 585 nm. The absorbance at 585 nmdoes not decrease until the total amount of the FADH‚ andFMNH‚ semiquinones begins to decrease as the fully reducedFMNH2 is formed after approximately 2 reducing equivalentshas been added (12). That the 5′-deazaFAD is not beingreduced by addition of the second electron can also beconfirmed by noting that the absorbance at 396 nm (maxi-mum of oxidized 5′-deazaFAD) does not decrease duringthe second electron addition. When the expected spectrumof free FMNH2 is subtracted from the spectrum of the2-electron-reduced 5′-deazaFAD reductase, a spectrum notsignificantly different from that of free 5′-deazaFAD isobserved (Figures 1 and 3A). This further supports the
conclusion that the 5′-deazaFAD has remained oxidizedwhile the FMN has been completely reduced.
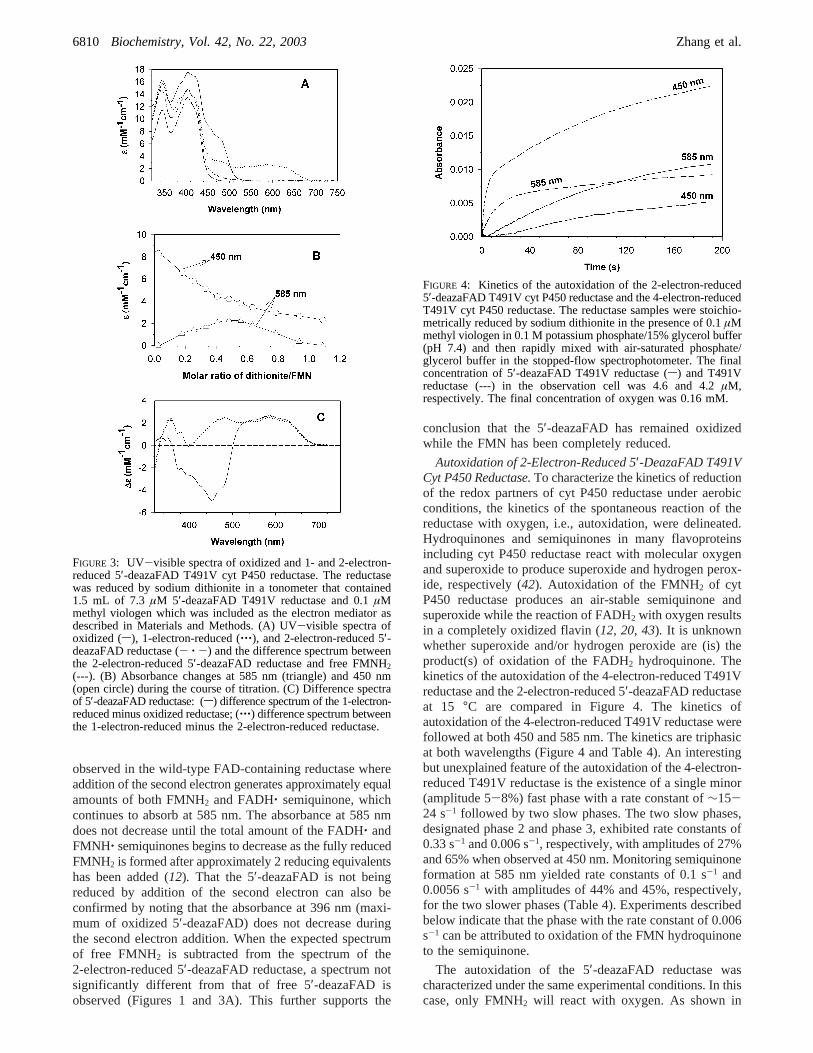
Autoxidation of 2-Electron-Reduced 5′-DeazaFAD T491VCyt P450 Reductase.To characterize the kinetics of reductionof the redox partners of cyt P450 reductase under aerobicconditions, the kinetics of the spontaneous reaction of thereductase with oxygen, i.e., autoxidation, were delineated.Hydroquinones and semiquinones in many flavoproteinsincluding cyt P450 reductase react with molecular oxygenand superoxide to produce superoxide and hydrogen perox-ide, respectively (42). Autoxidation of the FMNH2 of cytP450 reductase produces an air-stable semiquinone andsuperoxide while the reaction of FADH2 with oxygen resultsin a completely oxidized flavin (12, 20, 43). It is unknownwhether superoxide and/or hydrogen peroxide are (is) theproduct(s) of oxidation of the FADH2 hydroquinone. Thekinetics of the autoxidation of the 4-electron-reduced T491Vreductase and the 2-electron-reduced 5′-deazaFAD reductaseat 15 °C are compared in Figure 4. The kinetics ofautoxidation of the 4-electron-reduced T491V reductase werefollowed at both 450 and 585 nm. The kinetics are triphasicat both wavelengths (Figure 4 and Table 4). An interestingbut unexplained feature of the autoxidation of the 4-electron-reduced T491V reductase is the existence of a single minor(amplitude 5-8%) fast phase with a rate constant of∼15-24 s-1 followed by two slow phases. The two slow phases,designated phase 2 and phase 3, exhibited rate constants of0.33 s-1 and 0.006 s-1, respectively, with amplitudes of 27%and 65% when observed at 450 nm. Monitoring semiquinoneformation at 585 nm yielded rate constants of 0.1 s-1 and0.0056 s-1 with amplitudes of 44% and 45%, respectively,for the two slower phases (Table 4). Experiments describedbelow indicate that the phase with the rate constant of 0.006s-1 can be attributed to oxidation of the FMN hydroquinoneto the semiquinone.
The autoxidation of the 5′-deazaFAD reductase wascharacterized under the same experimental conditions. In thiscase, only FMNH2 will react with oxygen. As shown in
FIGURE 3: UV-visible spectra of oxidized and 1- and 2-electron-reduced 5′-deazaFAD T491V cyt P450 reductase. The reductasewas reduced by sodium dithionite in a tonometer that contained1.5 mL of 7.3 µM 5′-deazaFAD T491V reductase and 0.1µMmethyl viologen which was included as the electron mediator asdescribed in Materials and Methods. (A) UV-visible spectra ofoxidized (s), 1-electron-reduced (‚‚‚), and 2-electron-reduced 5′-deazaFAD reductase (- ‚ -) and the difference spectrum betweenthe 2-electron-reduced 5′-deazaFAD reductase and free FMNH2(---). (B) Absorbance changes at 585 nm (triangle) and 450 nm(open circle) during the course of titration. (C) Difference spectraof 5′-deazaFAD reductase: (s) difference spectrum of the 1-electron-reduced minus oxidized reductase; (‚‚‚) difference spectrum betweenthe 1-electron-reduced minus the 2-electron-reduced reductase.
FIGURE 4: Kinetics of the autoxidation of the 2-electron-reduced5′-deazaFAD T491V cyt P450 reductase and the 4-electron-reducedT491V cyt P450 reductase. The reductase samples were stoichio-metrically reduced by sodium dithionite in the presence of 0.1µMmethyl viologen in 0.1 M potassium phosphate/15% glycerol buffer(pH 7.4) and then rapidly mixed with air-saturated phosphate/glycerol buffer in the stopped-flow spectrophotometer. The finalconcentration of 5′-deazaFAD T491V reductase (s) and T491Vreductase (---) in the observation cell was 4.6 and 4.2µM,respectively. The final concentration of oxygen was 0.16 mM.
6810 Biochemistry, Vol. 42, No. 22, 2003 Zhang et al.
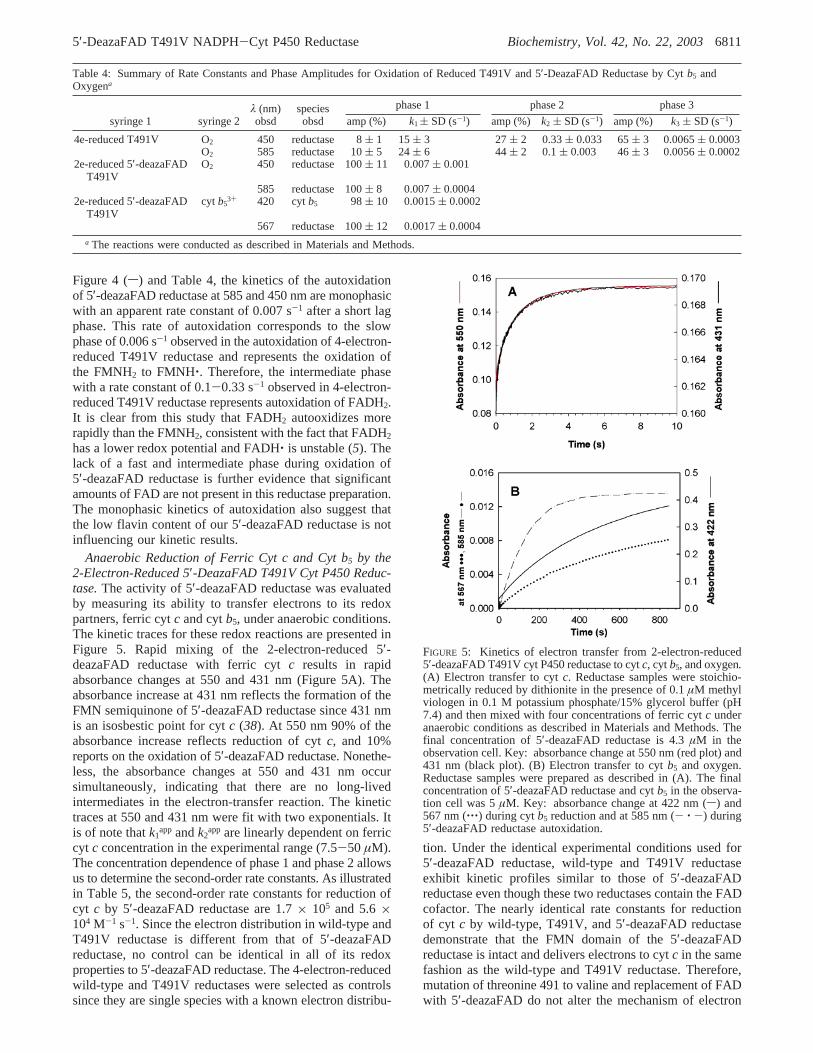
Figure 4 (s) and Table 4, the kinetics of the autoxidationof 5′-deazaFAD reductase at 585 and 450 nm are monophasicwith an apparent rate constant of 0.007 s-1 after a short lagphase. This rate of autoxidation corresponds to the slowphase of 0.006 s-1 observed in the autoxidation of 4-electron-reduced T491V reductase and represents the oxidation ofthe FMNH2 to FMNH‚. Therefore, the intermediate phasewith a rate constant of 0.1-0.33 s-1 observed in 4-electron-reduced T491V reductase represents autoxidation of FADH2.It is clear from this study that FADH2 autooxidizes morerapidly than the FMNH2, consistent with the fact that FADH2has a lower redox potential and FADH‚ is unstable (5). Thelack of a fast and intermediate phase during oxidation of5′-deazaFAD reductase is further evidence that significantamounts of FAD are not present in this reductase preparation.The monophasic kinetics of autoxidation also suggest thatthe low flavin content of our 5′-deazaFAD reductase is notinfluencing our kinetic results.
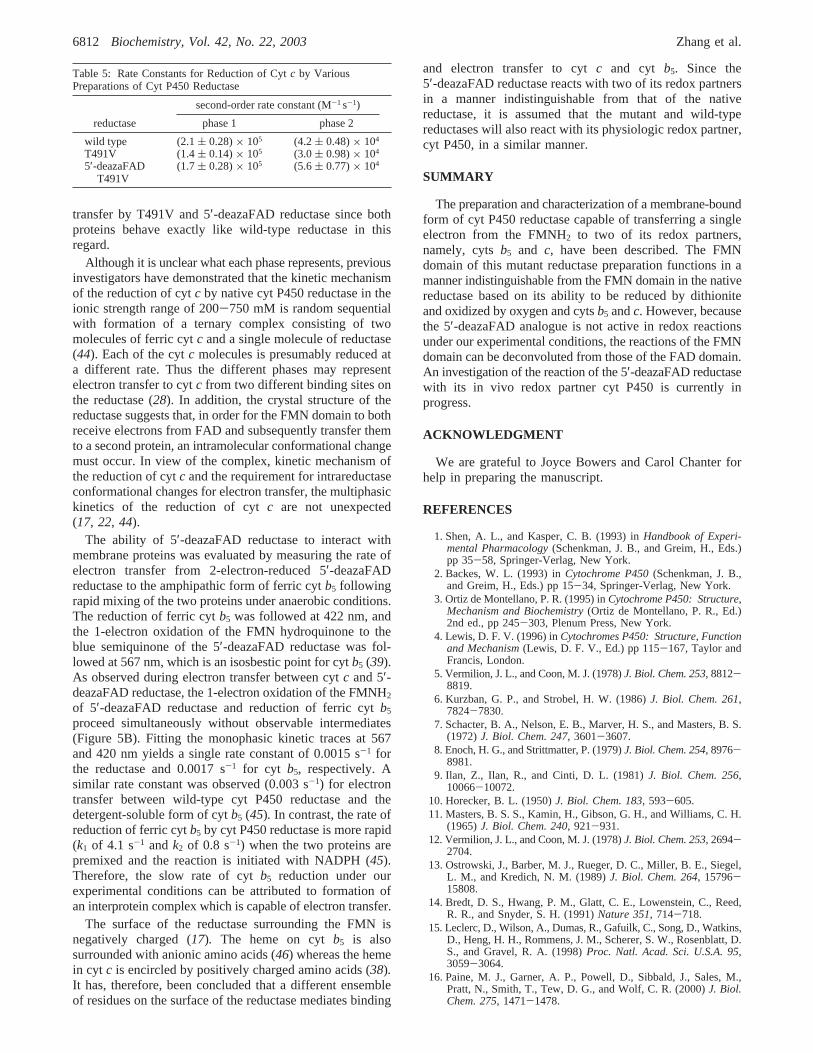
Anaerobic Reduction of Ferric Cyt c and Cyt b5 by the2-Electron-Reduced 5′-DeazaFAD T491V Cyt P450 Reduc-tase.The activity of 5′-deazaFAD reductase was evaluatedby measuring its ability to transfer electrons to its redoxpartners, ferric cytc and cytb5, under anaerobic conditions.The kinetic traces for these redox reactions are presented inFigure 5. Rapid mixing of the 2-electron-reduced 5′-deazaFAD reductase with ferric cytc results in rapidabsorbance changes at 550 and 431 nm (Figure 5A). Theabsorbance increase at 431 nm reflects the formation of theFMN semiquinone of 5′-deazaFAD reductase since 431 nmis an isosbestic point for cytc (38). At 550 nm 90% of theabsorbance increase reflects reduction of cytc, and 10%reports on the oxidation of 5′-deazaFAD reductase. Nonethe-less, the absorbance changes at 550 and 431 nm occursimultaneously, indicating that there are no long-livedintermediates in the electron-transfer reaction. The kinetictraces at 550 and 431 nm were fit with two exponentials. Itis of note thatk1
app andk2app are linearly dependent on ferric
cyt c concentration in the experimental range (7.5-50 µM).The concentration dependence of phase 1 and phase 2 allowsus to determine the second-order rate constants. As illustratedin Table 5, the second-order rate constants for reduction ofcyt c by 5′-deazaFAD reductase are 1.7× 10⁵ and 5.6×10⁴ M-1 s-1. Since the electron distribution in wild-type andT491V reductase is different from that of 5′-deazaFADreductase, no control can be identical in all of its redoxproperties to 5′-deazaFAD reductase. The 4-electron-reducedwild-type and T491V reductases were selected as controlssince they are single species with a known electron distribu-
tion. Under the identical experimental conditions used for5′-deazaFAD reductase, wild-type and T491V reductaseexhibit kinetic profiles similar to those of 5′-deazaFADreductase even though these two reductases contain the FADcofactor. The nearly identical rate constants for reductionof cyt c by wild-type, T491V, and 5′-deazaFAD reductasedemonstrate that the FMN domain of the 5′-deazaFADreductase is intact and delivers electrons to cytc in the samefashion as the wild-type and T491V reductase. Therefore,mutation of threonine 491 to valine and replacement of FADwith 5′-deazaFAD do not alter the mechanism of electron
Table 4: Summary of Rate Constants and Phase Amplitudes for Oxidation of Reduced T491V and 5′-DeazaFAD Reductase by Cytb5 andOxygena
phase 1 phase 2 phase 3
syringe 1 syringe 2λ (nm)obsd
speciesobsd amp (%) k1 ( SD (s-1) amp (%) k2 ( SD (s-1) amp (%) k3 ( SD (s-1)
4e-reduced T491V O2 450 reductase 8( 1 15( 3 27( 2 0.33( 0.033 65( 3 0.0065( 0.0003O2 585 reductase 10( 5 24( 6 44( 2 0.1( 0.003 46( 3 0.0056( 0.0002
2e-reduced 5′-deazaFADT491V
O2 450 reductase 100( 11 0.007( 0.001
585 reductase 100( 8 0.007( 0.00042e-reduced 5′-deazaFAD
T491Vcyt b5
3+ 420 cytb5 98 ( 10 0.0015( 0.0002
567 reductase 100( 12 0.0017( 0.0004a The reactions were conducted as described in Materials and Methods.
FIGURE 5: Kinetics of electron transfer from 2-electron-reduced5′-deazaFAD T491V cyt P450 reductase to cytc, cytb5, and oxygen.(A) Electron transfer to cytc. Reductase samples were stoichio-metrically reduced by dithionite in the presence of 0.1µM methylviologen in 0.1 M potassium phosphate/15% glycerol buffer (pH7.4) and then mixed with four concentrations of ferric cytc underanaerobic conditions as described in Materials and Methods. Thefinal concentration of 5′-deazaFAD reductase is 4.3µM in theobservation cell. Key: absorbance change at 550 nm (red plot) and431 nm (black plot). (B) Electron transfer to cytb5 and oxygen.Reductase samples were prepared as described in (A). The finalconcentration of 5′-deazaFAD reductase and cytb5 in the observa-tion cell was 5µM. Key: absorbance change at 422 nm (s) and567 nm (‚‚‚) during cytb5 reduction and at 585 nm (- ‚ -) during5′-deazaFAD reductase autoxidation.
5′-DeazaFAD T491V NADPH-Cyt P450 Reductase Biochemistry, Vol. 42, No. 22, 20036811
transfer by T491V and 5′-deazaFAD reductase since bothproteins behave exactly like wild-type reductase in thisregard.
Although it is unclear what each phase represents, previousinvestigators have demonstrated that the kinetic mechanismof the reduction of cytc by native cyt P450 reductase in theionic strength range of 200-750 mM is random sequentialwith formation of a ternary complex consisting of twomolecules of ferric cytc and a single molecule of reductase(44). Each of the cytc molecules is presumably reduced ata different rate. Thus the different phases may representelectron transfer to cytc from two different binding sites onthe reductase (28). In addition, the crystal structure of thereductase suggests that, in order for the FMN domain to bothreceive electrons from FAD and subsequently transfer themto a second protein, an intramolecular conformational changemust occur. In view of the complex, kinetic mechanism ofthe reduction of cytc and the requirement for intrareductaseconformational changes for electron transfer, the multiphasickinetics of the reduction of cytc are not unexpected(17, 22, 44).
The ability of 5′-deazaFAD reductase to interact withmembrane proteins was evaluated by measuring the rate ofelectron transfer from 2-electron-reduced 5′-deazaFADreductase to the amphipathic form of ferric cytb5 followingrapid mixing of the two proteins under anaerobic conditions.The reduction of ferric cytb5 was followed at 422 nm, andthe 1-electron oxidation of the FMN hydroquinone to theblue semiquinone of the 5′-deazaFAD reductase was fol-lowed at 567 nm, which is an isosbestic point for cytb5 (39).As observed during electron transfer between cytc and 5′-deazaFAD reductase, the 1-electron oxidation of the FMNH2
of 5′-deazaFAD reductase and reduction of ferric cytb5
proceed simultaneously without observable intermediates(Figure 5B). Fitting the monophasic kinetic traces at 567and 420 nm yields a single rate constant of 0.0015 s-1 forthe reductase and 0.0017 s-1 for cyt b5, respectively. Asimilar rate constant was observed (0.003 s-1) for electrontransfer between wild-type cyt P450 reductase and thedetergent-soluble form of cytb5 (45). In contrast, the rate ofreduction of ferric cytb5 by cyt P450 reductase is more rapid(k1 of 4.1 s-1 andk2 of 0.8 s-1) when the two proteins arepremixed and the reaction is initiated with NADPH (45).Therefore, the slow rate of cytb5 reduction under ourexperimental conditions can be attributed to formation ofan interprotein complex which is capable of electron transfer.
The surface of the reductase surrounding the FMN isnegatively charged (17). The heme on cytb5 is alsosurrounded with anionic amino acids (46) whereas the hemein cyt c is encircled by positively charged amino acids (38).It has, therefore, been concluded that a different ensembleof residues on the surface of the reductase mediates binding
and electron transfer to cytc and cyt b5. Since the5′-deazaFAD reductase reacts with two of its redox partnersin a manner indistinguishable from that of the nativereductase, it is assumed that the mutant and wild-typereductases will also react with its physiologic redox partner,cyt P450, in a similar manner.
SUMMARY
The preparation and characterization of a membrane-boundform of cyt P450 reductase capable of transferring a singleelectron from the FMNH2 to two of its redox partners,namely, cytsb5 and c, have been described. The FMNdomain of this mutant reductase preparation functions in amanner indistinguishable from the FMN domain in the nativereductase based on its ability to be reduced by dithioniteand oxidized by oxygen and cytsb5 andc. However, becausethe 5′-deazaFAD analogue is not active in redox reactionsunder our experimental conditions, the reactions of the FMNdomain can be deconvoluted from those of the FAD domain.An investigation of the reaction of the 5′-deazaFAD reductasewith its in vivo redox partner cyt P450 is currently inprogress.
ACKNOWLEDGMENT
We are grateful to Joyce Bowers and Carol Chanter forhelp in preparing the manuscript.
REFERENCES
1. Shen, A. L., and Kasper, C. B. (1993) inHandbook of Experi-mental Pharmacology(Schenkman, J. B., and Greim, H., Eds.)pp 35-58, Springer-Verlag, New York.
2. Backes, W. L. (1993) inCytochrome P450(Schenkman, J. B.,and Greim, H., Eds.) pp 15-34, Springer-Verlag, New York.
3. Ortiz de Montellano, P. R. (1995) inCytochrome P450: Structure,Mechanism and Biochemistry(Ortiz de Montellano, P. R., Ed.)2nd ed., pp 245-303, Plenum Press, New York.
4. Lewis, D. F. V. (1996) inCytochromes P450: Structure, Functionand Mechanism(Lewis, D. F. V., Ed.) pp 115-167, Taylor andFrancis, London.
5. Vermilion, J. L., and Coon, M. J. (1978)J. Biol. Chem. 253, 8812-8819.
6. Kurzban, G. P., and Strobel, H. W. (1986)J. Biol. Chem. 261,7824-7830.
7. Schacter, B. A., Nelson, E. B., Marver, H. S., and Masters, B. S.(1972)J. Biol. Chem. 247, 3601-3607.
8. Enoch, H. G., and Strittmatter, P. (1979)J. Biol. Chem. 254, 8976-8981.
9. Ilan, Z., Ilan, R., and Cinti, D. L. (1981)J. Biol. Chem. 256,10066-10072.
10. Horecker, B. L. (1950)J. Biol. Chem. 183, 593-605.11. Masters, B. S. S., Kamin, H., Gibson, G. H., and Williams, C. H.
(1965)J. Biol. Chem. 240, 921-931.12. Vermilion, J. L., and Coon, M. J. (1978)J. Biol. Chem. 253, 2694-
2704.13. Ostrowski, J., Barber, M. J., Rueger, D. C., Miller, B. E., Siegel,
L. M., and Kredich, N. M. (1989)J. Biol. Chem. 264, 15796-15808.
14. Bredt, D. S., Hwang, P. M., Glatt, C. E., Lowenstein, C., Reed,R. R., and Snyder, S. H. (1991)Nature 351, 714-718.
15. Leclerc, D., Wilson, A., Dumas, R., Gafuilk, C., Song, D., Watkins,D., Heng, H. H., Rommens, J. M., Scherer, S. W., Rosenblatt, D.S., and Gravel, R. A. (1998)Proc. Natl. Acad. Sci. U.S.A. 95,3059-3064.
16. Paine, M. J., Garner, A. P., Powell, D., Sibbald, J., Sales, M.,Pratt, N., Smith, T., Tew, D. G., and Wolf, C. R. (2000)J. Biol.Chem. 275, 1471-1478.
Table 5: Rate Constants for Reduction of Cytc by VariousPreparations of Cyt P450 Reductase
second-order rate constant (M-1 s-1)
reductase phase 1 phase 2
wild type (2.1( 0.28)× 105 (4.2( 0.48)× 104
T491V (1.4( 0.14)× 105 (3.0( 0.98)× 104
5′-deazaFADT491V
(1.7( 0.28)× 105 (5.6( 0.77)× 104
6812 Biochemistry, Vol. 42, No. 22, 2003 Zhang et al.
17. Wang, M., Roberts, D. L., Paschke, R., Shea, T. M., Masters, B.S. S., and Kim, J. J. (1997)Proc. Natl. Acad. Sci. U.S.A. 94,8411-8416.
18. Hall, L. H., Bowers, M. L., and Durfor, C. N. (1987)Biochemistry26, 7401-7409.
19. Oprian, D. D., and Coon, M. J. (1982)J. Biol. Chem. 257, 8935-8944.
20. Iyanagi, T., and Mason, H. S. (1973)Biochemistry 12, 2297-2308.
21. Bhattacharyya, A. K., Lipka, J. J., Waskell, L., and Tollin, G.(1991)Biochemistry 30, 759-765.
22. Gutierrez, A., Paine, M., Wolf, C. R., Scrutton, N. S., and Roberts,G. C. K. (2002)Biochemistry 41, 4626-4637.
23. Kurzban, G. P., Howarth, J., Palmer, G., and Strobel, H. W. (1990)J. Biol. Chem. 265, 12272-12279.
24. Narayanasami, R., Horowitz, P. M., and Masters, B. S. S. (1995)Arch. Biochem. Biophys. 316, 267-274.
25. Hodgson, A. V., and Strobel, H. W. (1996)Arch. Biochem.Biophys. 325, 99-106.
26. Smith, G. C. M., Tew, D. G., and Wolf, C. R. (1994)Proc. Natl.Acad. Sci. U.S.A. 91, 8710-8714.
27. Gutierrez, A., Lian, L.-Y., Wolf, C. R., Scrutton, N. S., andRoberts, G. C. K. (2001)Biochemistry 40, 1964-1975.
28. Shen, A. L., and Kasper, C. B. (2000)J. Biol. Chem. 275, 41087-41091.
29. Efimov, I., Kuusk, V., Zhang, X. P., and McIntire, W. S. (1998)Biochemistry 37, 9716-9723.
30. Mulrooney, S. B., and Waskell, L. (2000)Protein Expression Purif.19, 173-178.
31. Shen, A. L., Porter, T. D., Wilson, T. E., and Kasper, C. B. (1989)J. Biol. Chem. 264, 7584-7589.
32. Klatt, P., Schmidt, K., Werner, E. R., and Mayer, B. (1996)Methods Enzymol. 268, 358-365.
33. Light, D. R., Walsh, C., and Marletta, M. A. (1980)Anal. Biochem.109, 87-93.
34. Beinert, H. (1960) inThe Enzymes(Boyer, P. D., Lardy, H., andMyrback, K., Eds.) Vol. 2, pp 339-416, Academic Press, NewYork.
35. Whitby, L. G. (1953)Biochem. J. 54, 437-442.36. Spencer, R., and Walsh, C. (1976)Biochemistry 15, 1043-1053.37. Linde, D. R. (1998)Handbook of Chemistry and Physics, 83rd
ed., Chapter 8, p 87, CRC Press, Boca Raton, FL.38. Gelder, B. F. V., and Slater, E. C. (1962)Biochim. Biophys. Acta
58, 593-595.39. Spatz, L., and Strittmatter, P. (1971)Proc. Natl. Acad. Sci. U.S.A.
68, 1042-1046.40. Kuzmic, P. (1996)Anal. Biochem. 237, 260-273.41. Muller, F., Brustlein, M., Hemmerich, P., Massey, V., and Walker,
W. H. (1972)Eur. J. Biochem. 25, 573-578.42. Massey, V. (1994)J. Biol. Chem. 269, 22459-22462.43. Yasukochi, Y., Peterson, J. A., and Masters, B. S. S. (1979)J.
Biol. Chem. 254, 7097-7104.44. Sem, D. S., and Kasper, C. B. (1995)Biochemistry 34, 12768-
12774.45. Wu, F. F., Vergeres, G., and Waskell, L. (1994)Arch. Biochem.
Biophys. 308, 380-386.46. Durley, R. C. E., and Mathews, F. S. (1996)Acta Crystallogr.
D52, 65-76.
BI030081M
5′-DeazaFAD T491V NADPH-Cyt P450 Reductase Biochemistry, Vol. 42, No. 22, 20036813
Recommended