Presented by
Gregory B. Teague, Ph.D.Matthew Johnsen, Ph.D.
Joseph RogersBonnie Schell, M.A.
(See additional credits at end)
Research on Consumer-Operated Service
Programs:
Effectiveness Findings and Policy Implications of a Large Multi-Site
Study Findings from the SAMHSA/CMHS
Consumer-Operated Service Program Multisite Research Initiative
2
- 1 -
Consumer-Operated Services Multisite
Research Initiative: Overview
3
Consumer-Operated Services: An Invocation
"Who then can so softly bind up the
wound of another as he who has felt
the same wound himself?”
– Thomas Jefferson
4
Consumer-Operated Services: Context
• Peer-delivered services for persons with serious mental illness have grown in number and diversity in recent years
• There is growing recognition of their value (cf. IOM Quality Chasm and New Freedom Commission reports)
• There is preliminary but limited evidence of their effectiveness in improving symptoms, promoting larger social networks, and enhancing quality of life
5
Context (cont’d.)
• However, evidence has been limited to
– uncontrolled studies, – demonstrations of feasibility, – & preliminary findings.
• Weak evidence-base has hindered – peer-run program credibility, – resource stability & sustainability, – & opportunities for integration into the
continuum of community care.
6
COSP Multisite Research Initiative: Design Overview
• Research question:– To what extent are consumer-operated
programs effective as an adjunct to traditional mental health services in improving the outcomes of adults with serious mental illness?
• Experimental design: – Random assignment to one of two conditions
– Traditional MH Services (TMHS) or TMHS+COSP
• Parallel cost study
• Consumer involvement at all levels
7
COS Criteria for COSP-MRI
• “Administratively controlled and operated by consumers…planned, delivered, and evaluated by consumers themselves”
• In full operation for at least 2 years
• Does not include all types of peer-run and self-help services
8
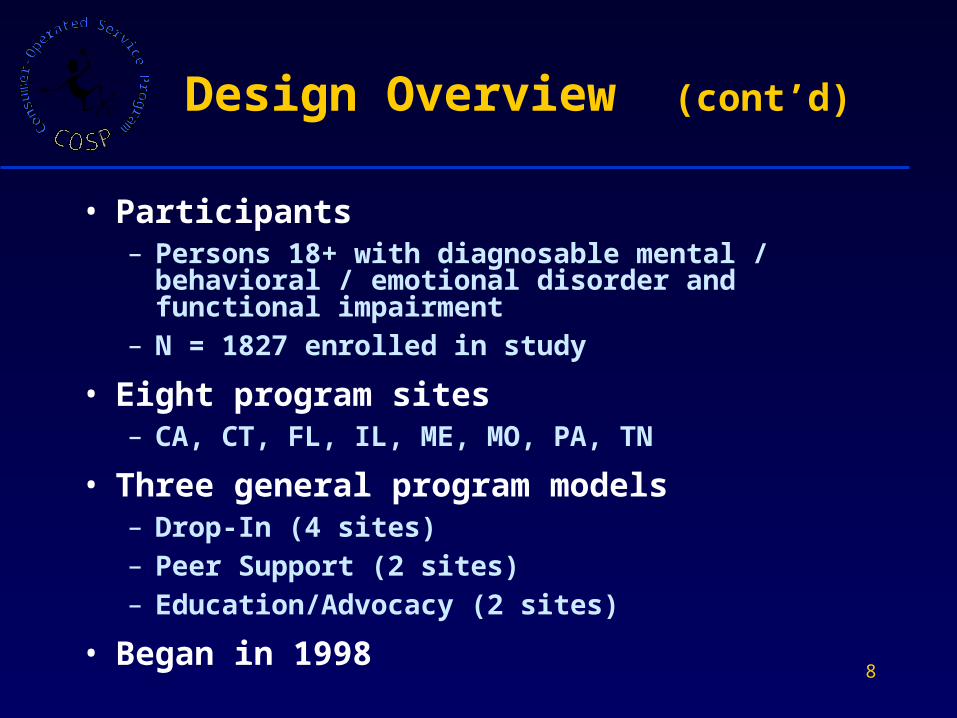
Design Overview (cont’d)
• Participants– Persons 18+ with diagnosable mental /
behavioral / emotional disorder and functional impairment
– N = 1827 enrolled in study
• Eight program sites– CA, CT, FL, IL, ME, MO, PA, TN
• Three general program models– Drop-In (4 sites)– Peer Support (2 sites)– Education/Advocacy (2 sites)
• Began in 1998
9
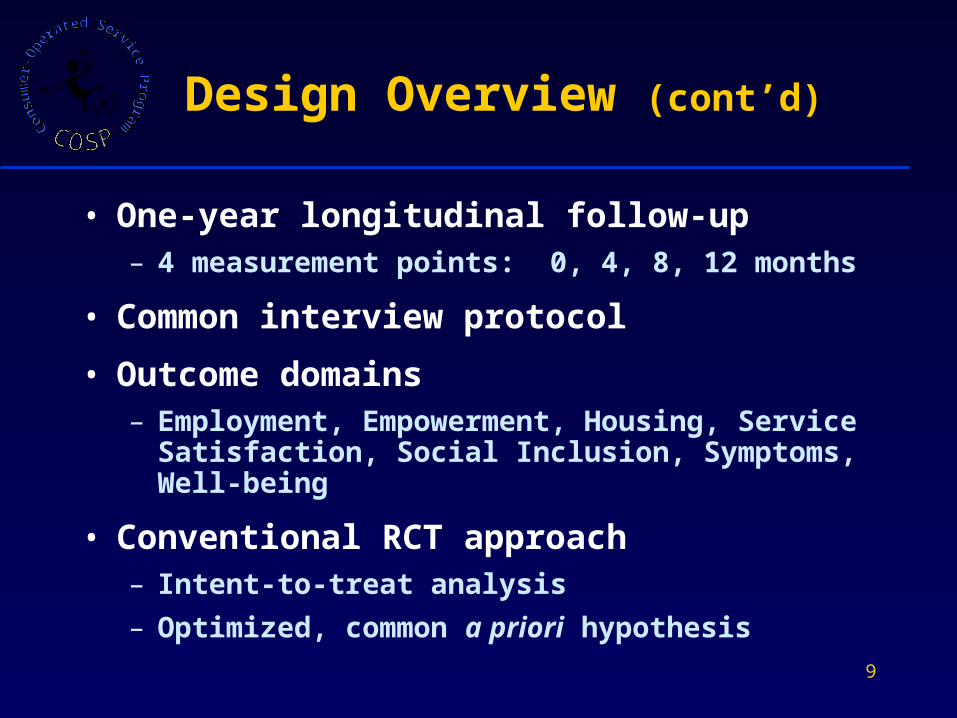
Design Overview (cont’d)
• One-year longitudinal follow-up– 4 measurement points: 0, 4, 8, 12 months
• Common interview protocol
• Outcome domains– Employment, Empowerment, Housing,
Service Satisfaction, Social Inclusion, Symptoms, Well-being
• Conventional RCT approach– Intent-to-treat analysis
– Optimized, common a priori hypothesis
10
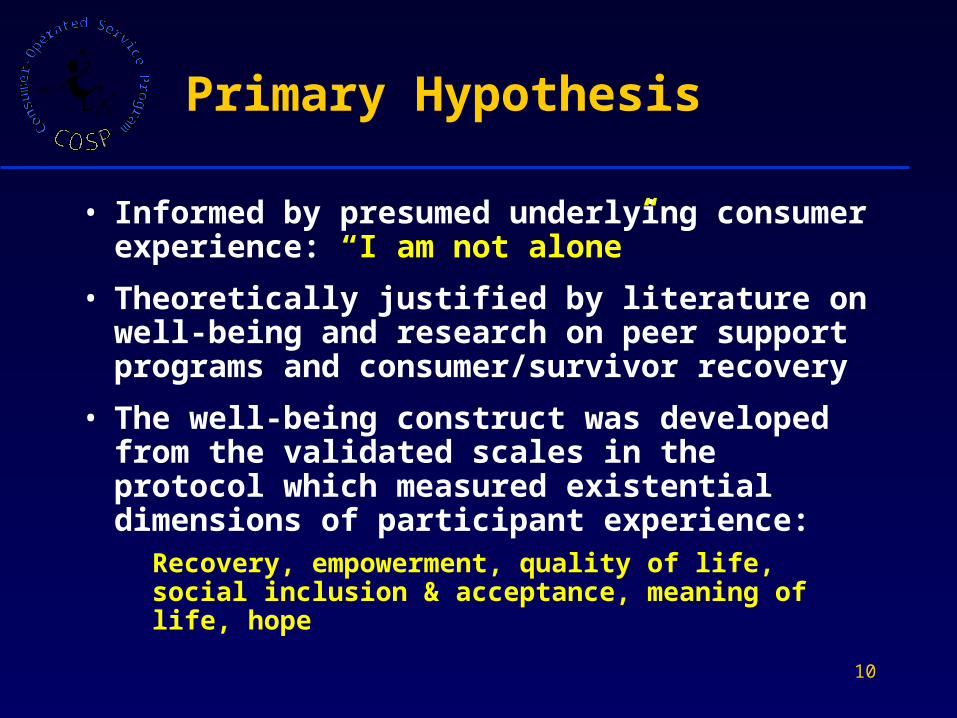
Primary Hypothesis
• Informed by presumed underlying consumer experience: “I am not alone”
• Theoretically justified by literature on well-being and research on peer support programs and consumer/survivor recovery
• The well-being construct was developed from the validated scales in the protocol which measured existential dimensions of participant experience:
Recovery, empowerment, quality of life, social inclusion & acceptance, meaning of life, hope
11
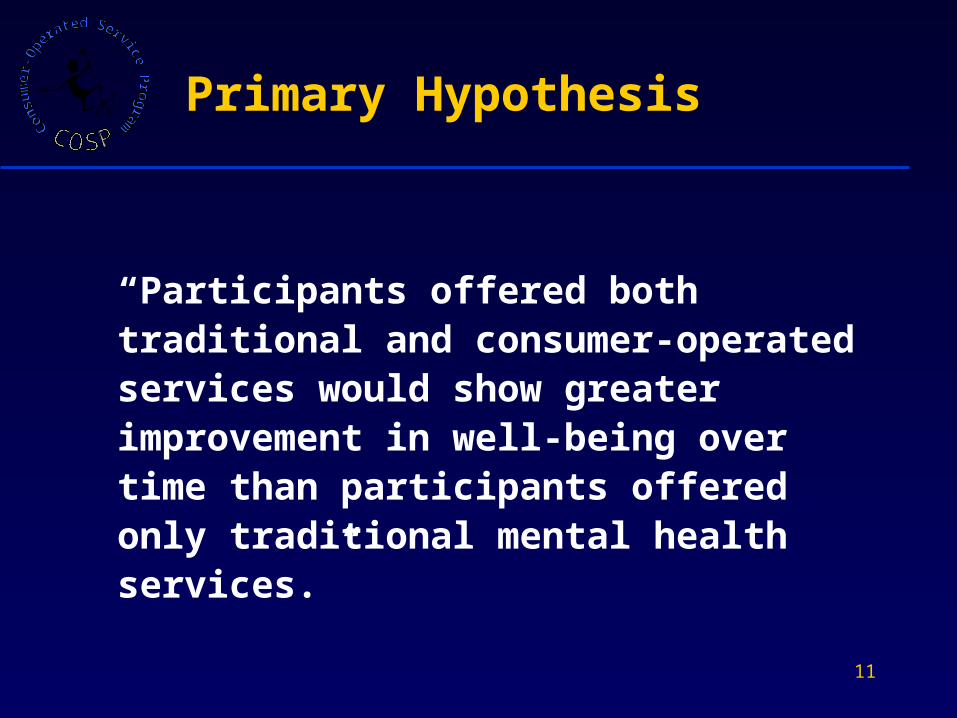
Primary Hypothesis
“Participants offered both traditional and consumer-operated services would show greater improvement in well-being over time than participants offered only traditional mental health services.”
12
- 2 -
Program/Fidelity Measure:
The “Consumer Operated Services Program – Fidelity Assessment Common Ingredients
Tool”
(COSP-FACIT)
http://www.umassmed.edu/entities/cmhsr/uploads/FACIT.pdf
13
Initial COSP Measurement Context
• Common measurement at participant level
• Potentially important aspects of intervention not measured in common protocol
• COS not operationalized; no existing measures
• Diversity among programs
• Contrast between experimental and control conditions not specified
14
Development of the FACIT
• Involvement of COS directors and staff as well as researchers at all stages
• Identification and definition of common ingredients of consumer-operated services– Involvement of the Consumer Advisory
Panel
• Identification/selection of feasible indicators
• Specification of performance anchors (typically 4-5) for each indicator
15
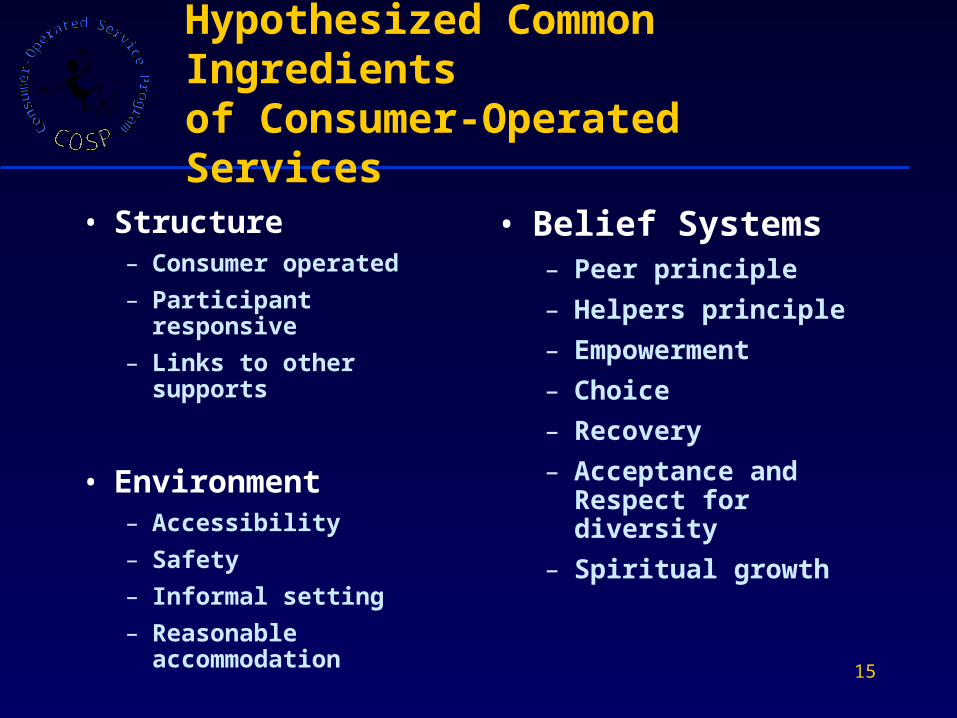
Hypothesized Common Ingredients of Consumer-Operated Services
• Structure– Consumer operated
– Participant responsive
– Links to other supports
• Environment– Accessibility
– Safety
– Informal setting
– Reasonable accommodation
• Belief Systems– Peer principle
– Helpers principle
– Empowerment
– Choice
– Recovery
– Acceptance and Respect for diversity
– Spiritual growth
16
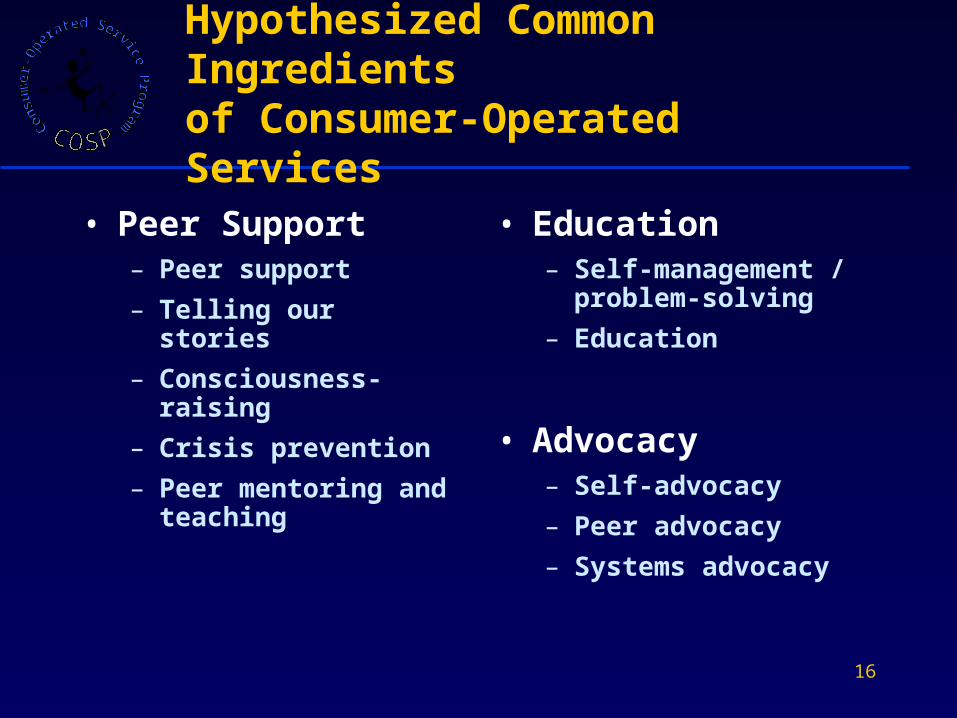
Hypothesized Common Ingredients of Consumer-Operated Services
• Peer Support– Peer support
– Telling our stories
– Consciousness-raising
– Crisis prevention
– Peer mentoring and teaching
• Education– Self-management /
problem-solving
– Education
• Advocacy– Self-advocacy
– Peer advocacy
– Systems advocacy
17
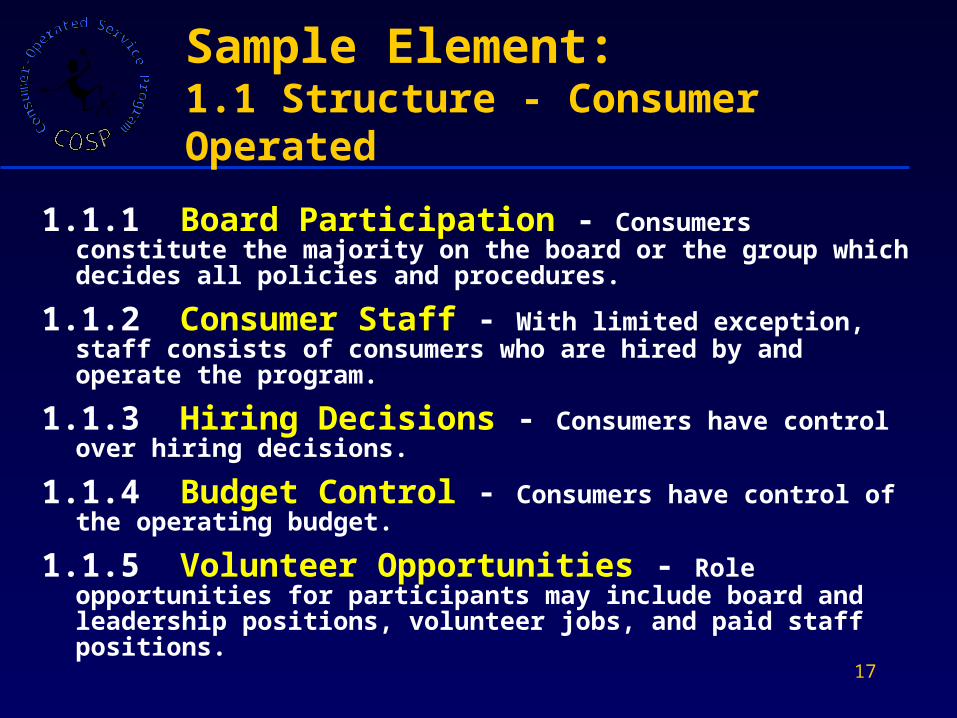
Sample Element: 1.1 Structure - Consumer Operated
1.1.1 Board Participation - Consumers constitute the majority on the board or the group which decides all policies and procedures.
1.1.2 Consumer Staff - With limited exception, staff consists of consumers who are hired by and operate the program.
1.1.3 Hiring Decisions - Consumers have control over hiring decisions.
1.1.4 Budget Control - Consumers have control of the operating budget.
1.1.5 Volunteer Opportunities - Role opportunities for participants may include board and leadership positions, volunteer jobs, and paid staff positions.
18
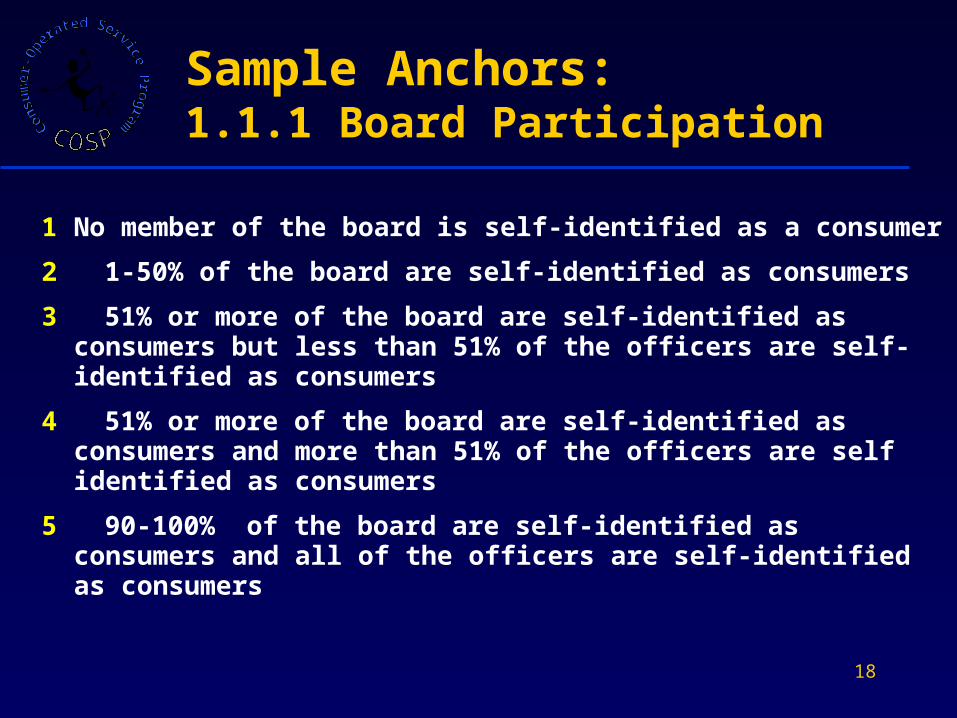
Sample Anchors:1.1.1 Board Participation
1 No member of the board is self-identified as a consumer
2 1-50% of the board are self-identified as consumers
3 51% or more of the board are self-identified as consumers but less than 51% of the officers are self-identified as consumers
4 51% or more of the board are self-identified as consumers and more than 51% of the officers are self identified as consumers
5 90-100% of the board are self-identified as consumers and all of the officers are self-identified as consumers
19
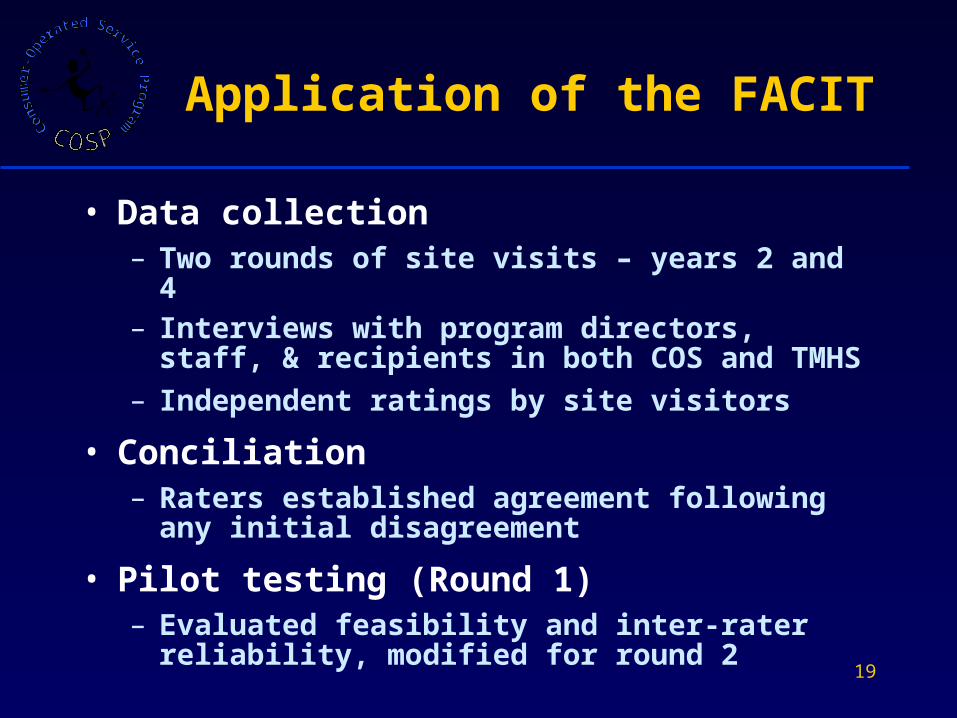
Application of the FACIT
• Data collection– Two rounds of site visits – years 2 and 4– Interviews with program directors, staff, &
recipients in both COS and TMHS
– Independent ratings by site visitors
• Conciliation– Raters established agreement following
any initial disagreement
• Pilot testing (Round 1)– Evaluated feasibility and inter-rater
reliability, modified for round 2
20
FACIT: Psychometric Analysis
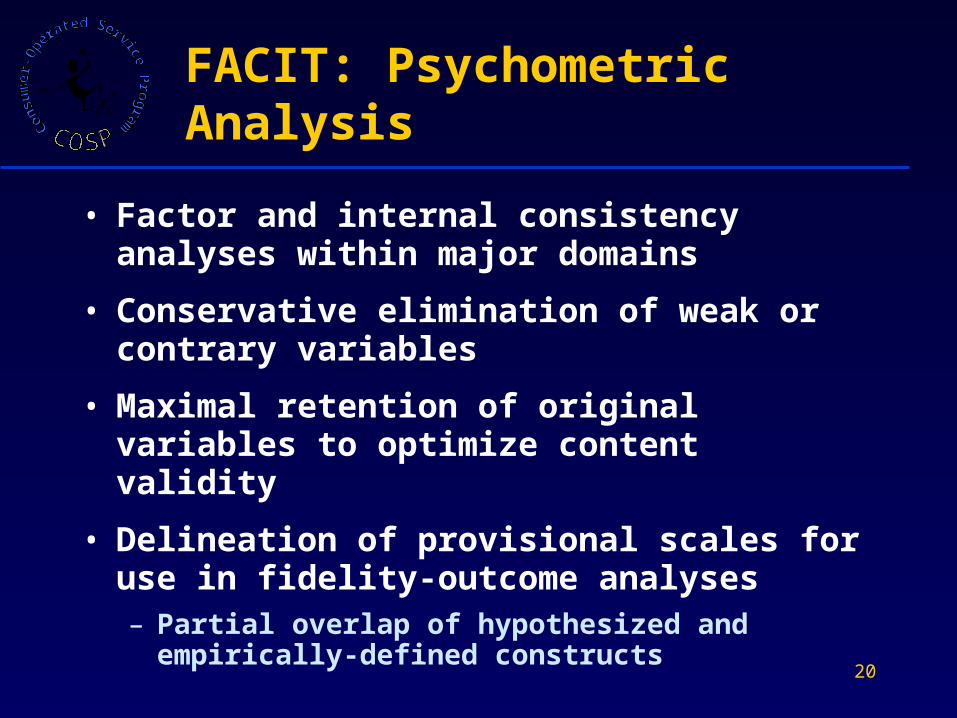
• Factor and internal consistency analyses within major domains
• Conservative elimination of weak or contrary variables
• Maximal retention of original variables to optimize content validity
• Delineation of provisional scales for use in fidelity-outcome analyses– Partial overlap of hypothesized and
empirically-defined constructs
21
FACIT Research Questions
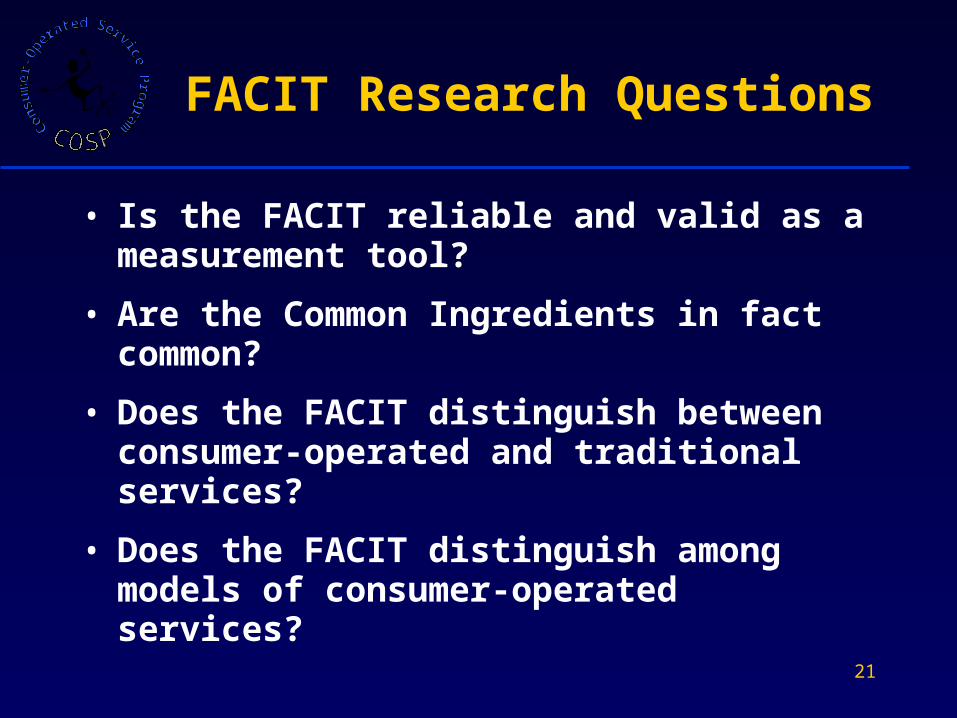
• Is the FACIT reliable and valid as a measurement tool?
• Are the Common Ingredients in fact common?
• Does the FACIT distinguish between consumer-operated and traditional services?
• Does the FACIT distinguish among models of consumer-operated services?
22
FACIT: Inter-Rater Reliability
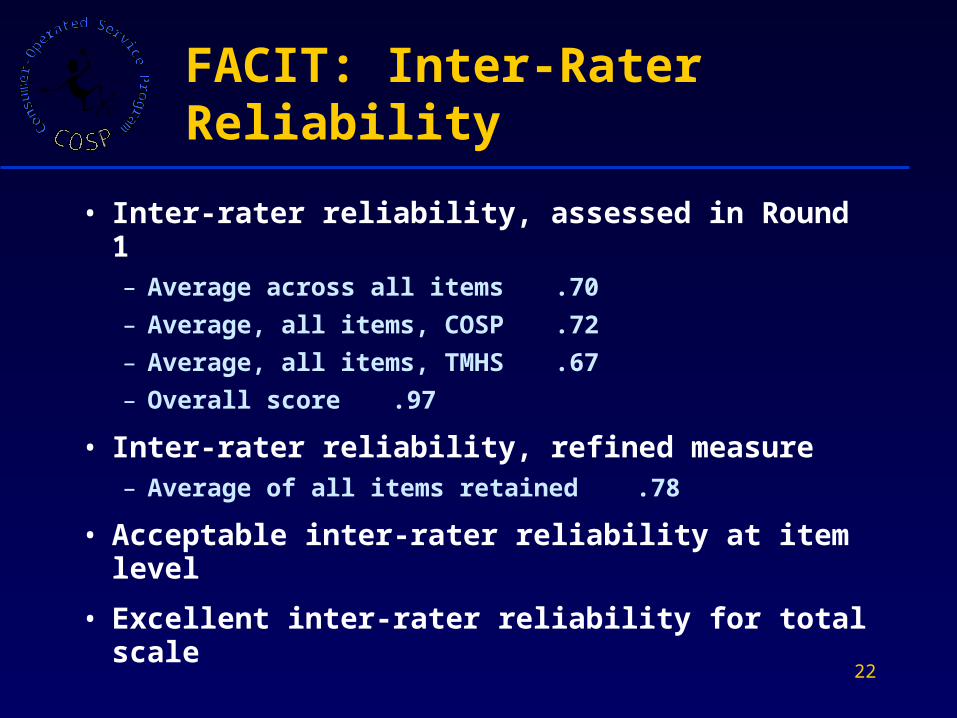
• Inter-rater reliability, assessed in Round 1– Average across all items .70
– Average, all items, COSP .72
– Average, all items, TMHS .67
– Overall score .97
• Inter-rater reliability, refined measure– Average of all items retained .78
• Acceptable inter-rater reliability at item level
• Excellent inter-rater reliability for total scale
23
FACIT Subscales:Internal Consistency (1) (N = 16)
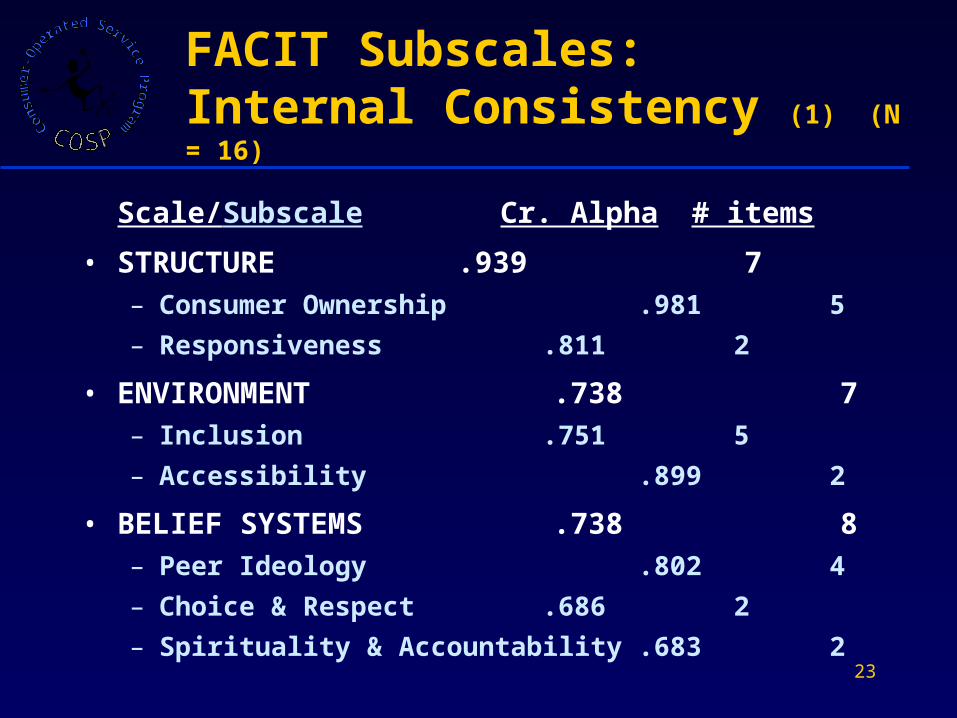
Scale/Subscale Cr. Alpha # items
• STRUCTURE .939 7– Consumer Ownership .981 5
– Responsiveness .811 2
• ENVIRONMENT .738 7– Inclusion .751 5
– Accessibility .899 2
• BELIEF SYSTEMS .738 8– Peer Ideology .802 4
– Choice & Respect .686 2
– Spirituality & Accountability .683 2
24
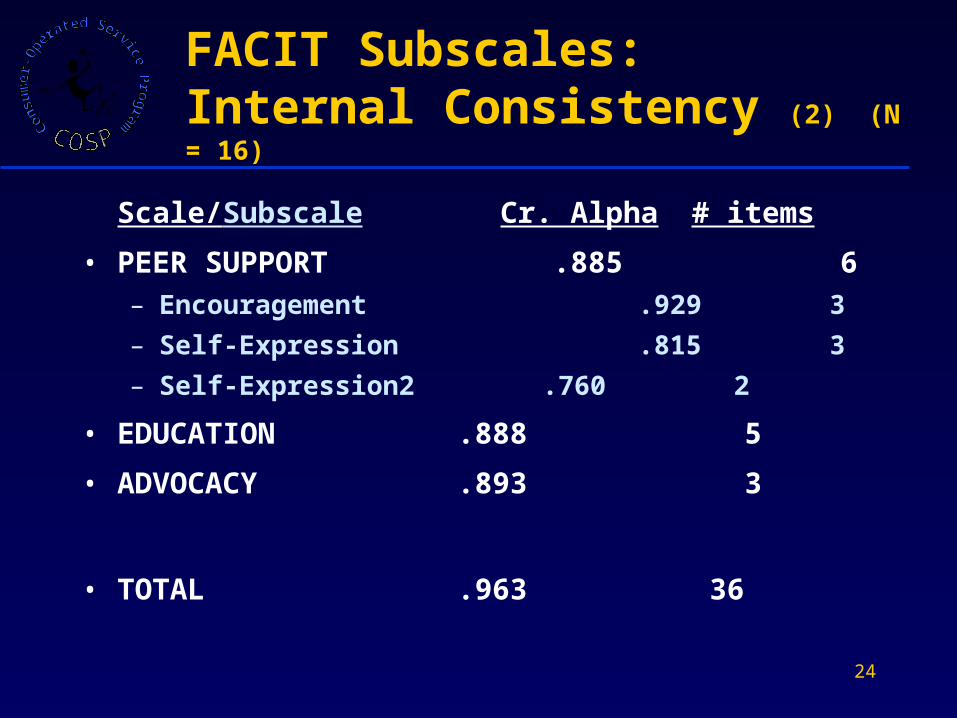
FACIT Subscales:Internal Consistency (2) (N = 16)
Scale/Subscale Cr. Alpha # items
• PEER SUPPORT .885 6– Encouragement .929 3
– Self-Expression .815 3
– Self-Expression2 .760 2
• EDUCATION .888 5
• ADVOCACY .893 3
• TOTAL .963 36
25
8879 81 77
61
22
44
5549
3323
61
0102030405060708090
100
Structure Environment BeliefSystems
Peer Support Education Advocacy
%
COSPTMHS
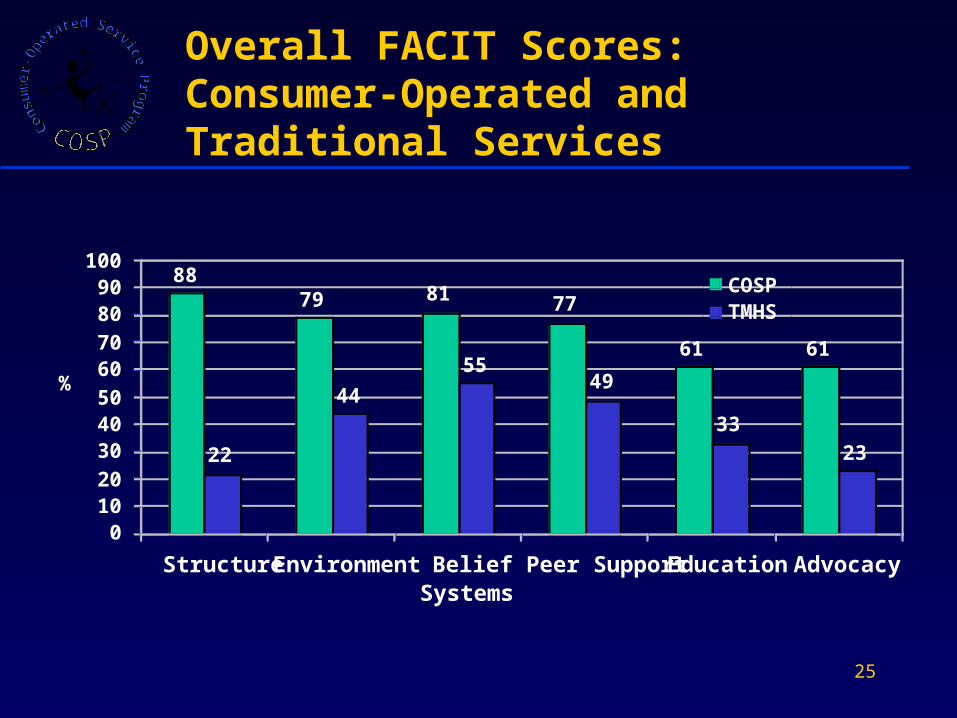
Overall FACIT Scores: Consumer-Operated and Traditional Services

26
• Generally high performance on most dimensions– COS organizations received 75% of all
possible points
– COS organizations received 82% of possible points on four consumer-defined organizational process scales (Factor 1 of 2-factor solution: 52% out of total 80% explained)
• Some variability across subscales and sites
• Room to increase – no problem with ceiling effects
Presence of Common Ingredients in COSP
27
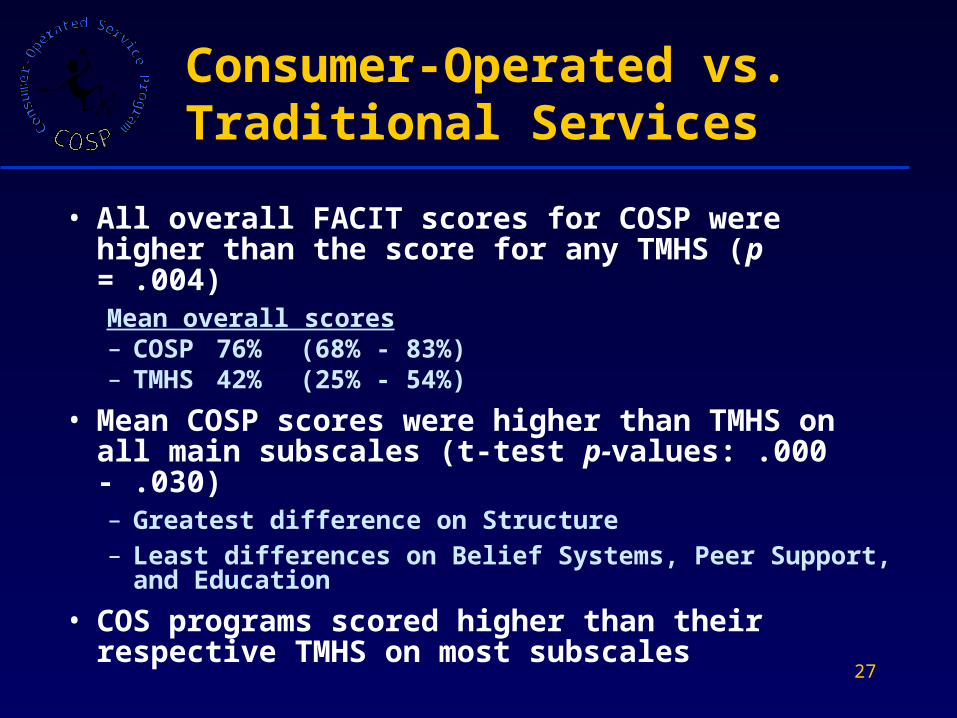
• All overall FACIT scores for COSP were higher than the score for any TMHS (p = .004)Mean overall scores– COSP 76% (68% - 83%)– TMHS42% (25% - 54%)
• Mean COSP scores were higher than TMHS on all main subscales (t-test p-values: .000 - .030)– Greatest difference on Structure– Least differences on Belief Systems, Peer
Support, and Education
• COS programs scored higher than their respective TMHS on most subscales
Consumer-Operated vs. Traditional Services
28
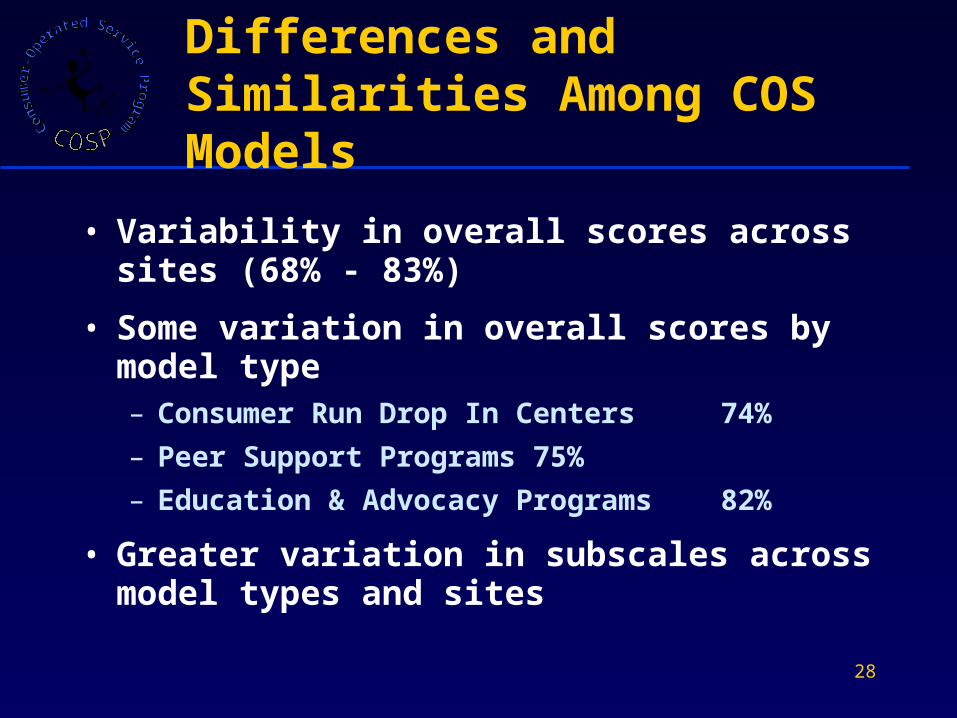
• Variability in overall scores across sites (68% - 83%)
• Some variation in overall scores by model type– Consumer Run Drop In Centers 74%
– Peer Support Programs 75%
– Education & Advocacy Programs 82%
• Greater variation in subscales across model types and sites
Differences and Similarities Among COS Models
29
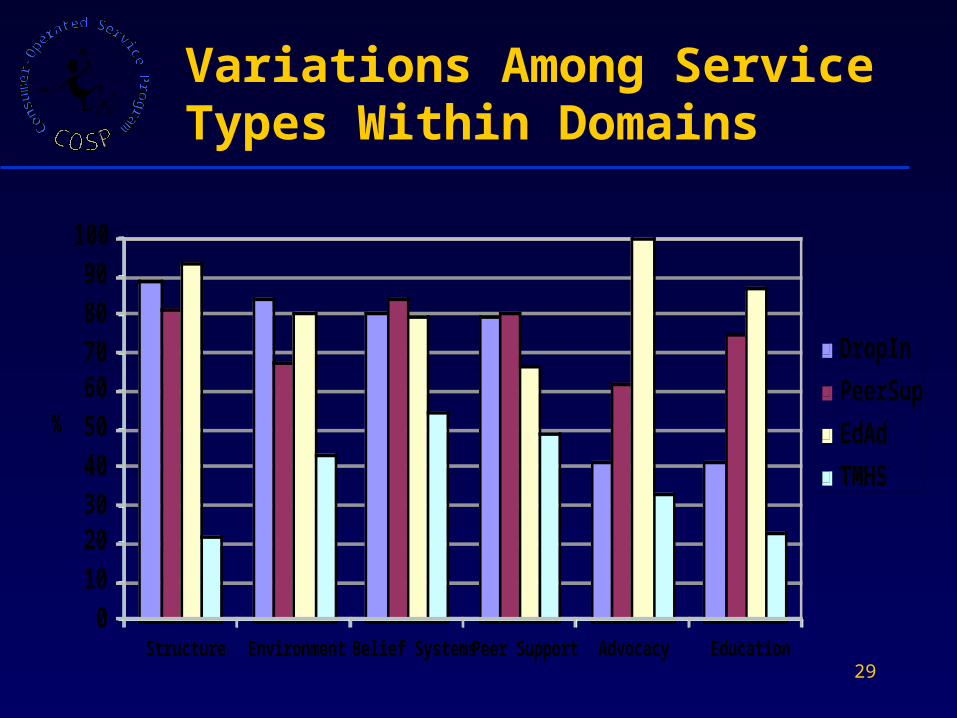
Variations Among Service Types Within Domains
0102030405060708090
100
Structure Environment Belief Systems Peer Support Advocacy Education
%
DropIn
PeerSup
EdAd
TMHS
30
• All models show high ratings on Belief Systems
• Education and Advocacy programs appear higher on Education and Advocacy domains
• Programs that more explicitly include peer support components appear higher on Peer Support
• More formally structured programs appear higher on Structure and Environment
Differences and Similarities Among COS Models
31
FACIT: Conclusions
• The FACIT measures salient features of a wide range of consumer-operated service models
• The models included in the COSP study were consistent with general specifications for the common ingredients and were significantly more so than control programs
• Generalizability is not yet known, but there is positive evidence for acceptability, feasibility, reliability, validity, sensitivity of the FACIT
• Are there indications that these common ingredients also active ingredients?
32
- 3 -
COSP-MRI Outcome Measurement
& Findings
33
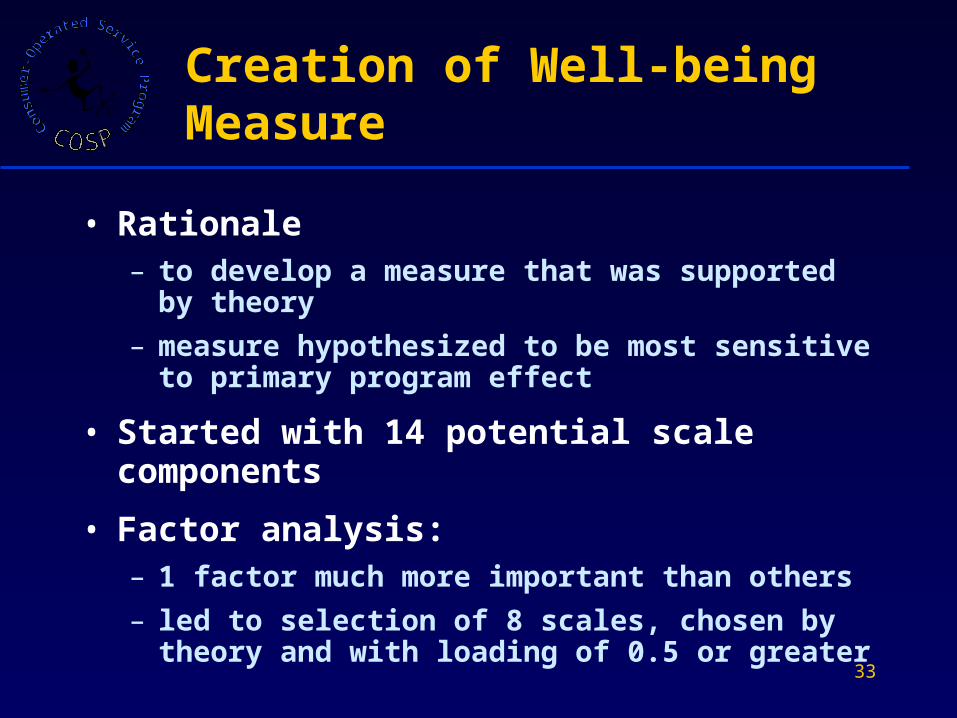
Creation of Well-being Measure
• Rationale– to develop a measure that was supported
by theory
– measure hypothesized to be most sensitive to primary program effect
• Started with 14 potential scale components
• Factor analysis:– 1 factor much more important than others
– led to selection of 8 scales, chosen by theory and with loading of 0.5 or greater
34
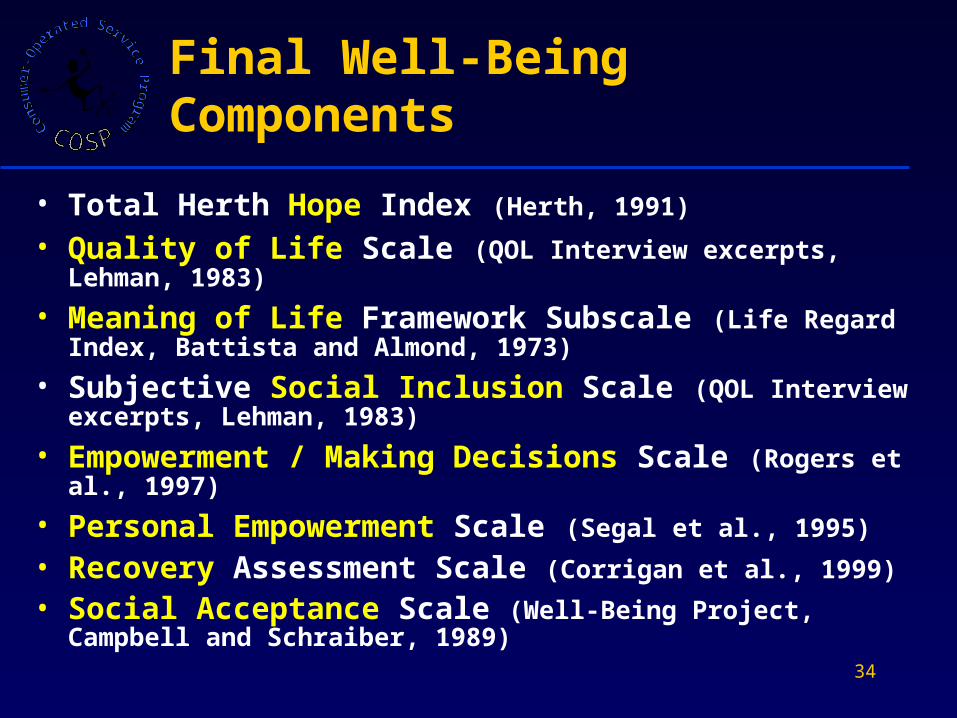
Final Well-Being Components
• Total Herth Hope Index (Herth, 1991)
• Quality of Life Scale (QOL Interview excerpts, Lehman, 1983)
• Meaning of Life Framework Subscale (Life Regard Index, Battista and Almond, 1973)
• Subjective Social Inclusion Scale (QOL Interview excerpts, Lehman, 1983)
• Empowerment / Making Decisions Scale (Rogers et al., 1997)
• Personal Empowerment Scale (Segal et al., 1995)
• Recovery Assessment Scale (Corrigan et al., 1999)
• Social Acceptance Scale (Well-Being Project, Campbell and Schraiber, 1989)
35
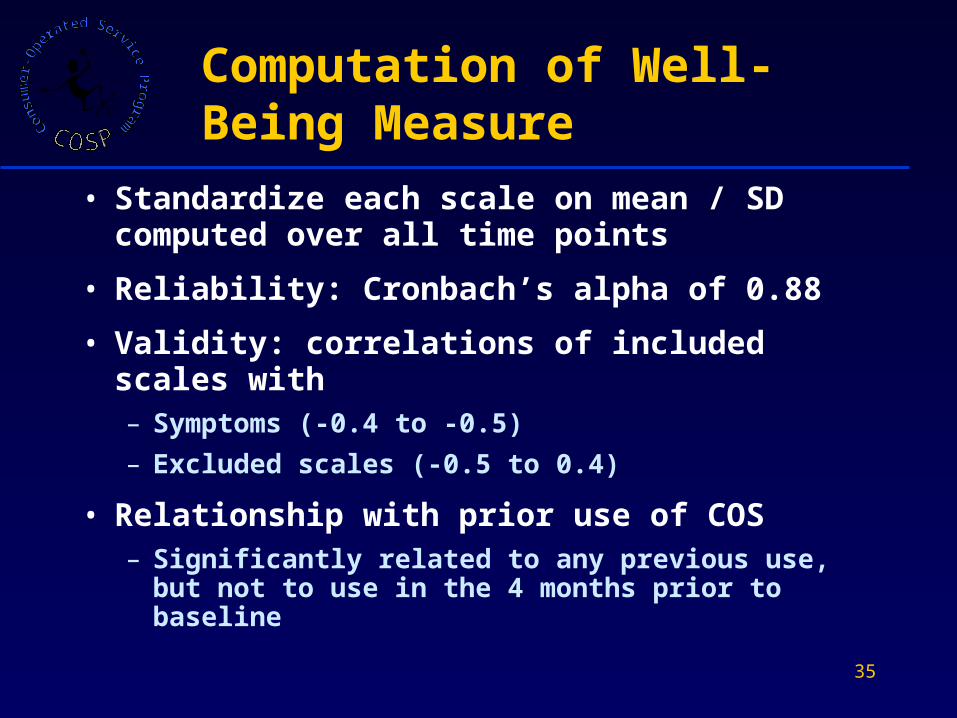
Computation of Well-Being Measure
• Standardize each scale on mean / SD computed over all time points
• Reliability: Cronbach’s alpha of 0.88
• Validity: correlations of included scales with– Symptoms (-0.4 to -0.5)
– Excluded scales (-0.5 to 0.4)
• Relationship with prior use of COS– Significantly related to any previous use, but
not to use in the 4 months prior to baseline
36
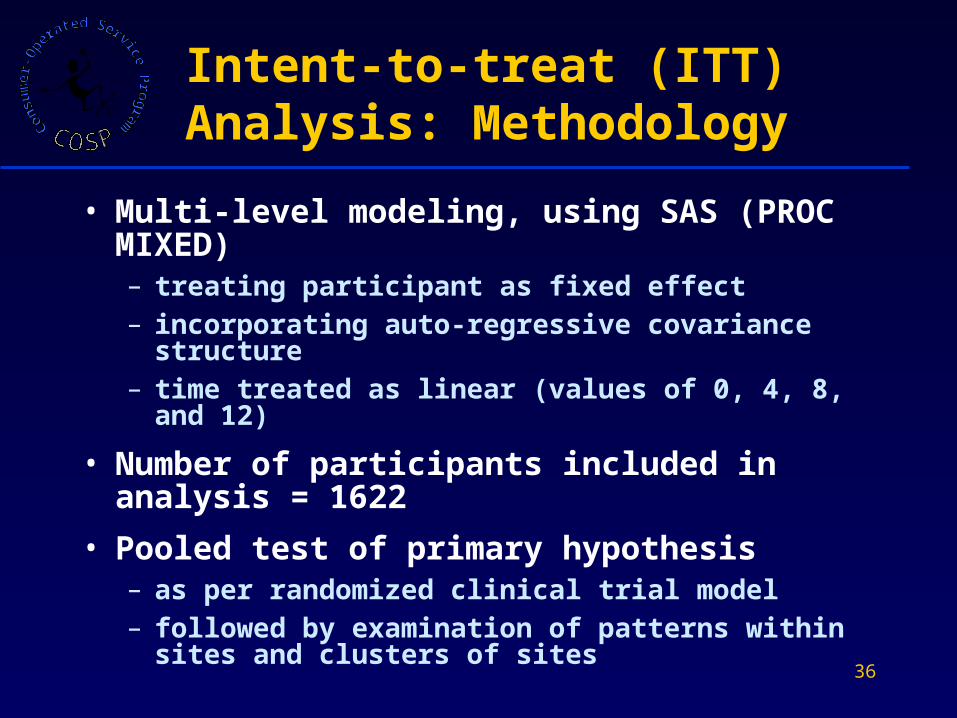
Intent-to-treat (ITT) Analysis: Methodology
• Multi-level modeling, using SAS (PROC MIXED)– treating participant as fixed effect– incorporating auto-regressive covariance
structure– time treated as linear (values of 0, 4, 8, and
12)
• Number of participants included in analysis = 1622
• Pooled test of primary hypothesis– as per randomized clinical trial model– followed by examination of patterns within
sites and clusters of sites
37
ITT Analysis: Primary Hypothesis
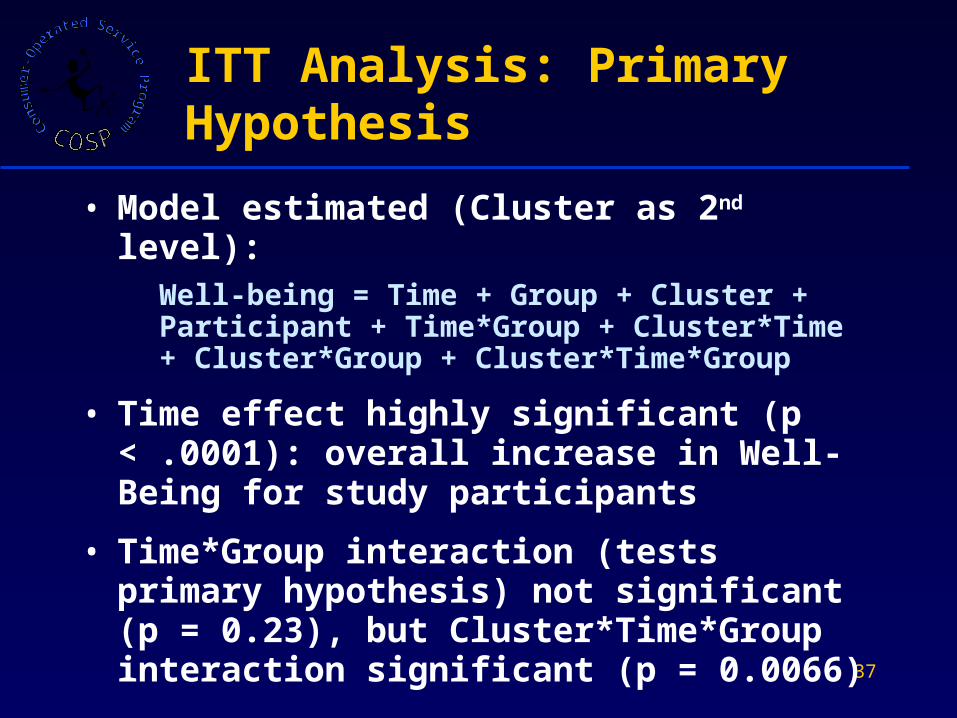
• Model estimated (Cluster as 2nd level):Well-being = Time + Group + Cluster + Participant + Time*Group + Cluster*Time + Cluster*Group + Cluster*Time*Group
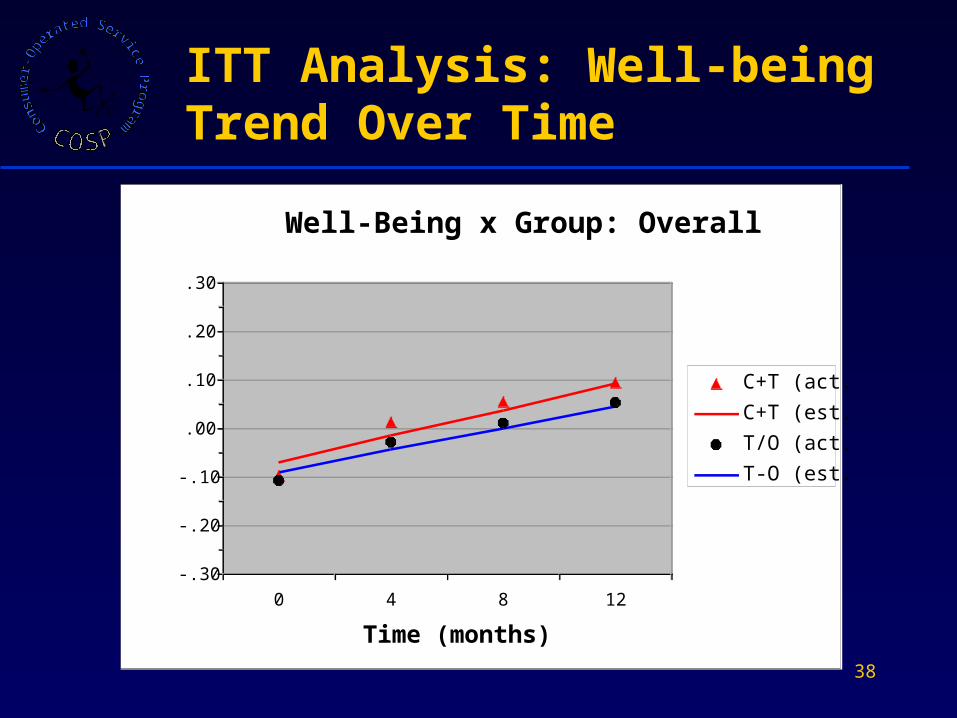
• Time effect highly significant (p < .0001): overall increase in Well-Being for study participants
• Time*Group interaction (tests primary hypothesis) not significant (p = 0.23), but Cluster*Time*Group interaction significant (p = 0.0066)
38
ITT Analysis: Well-being Trend Over Time
Well-Being x Group: Overall
-.30
-.20
-.10
.00
.10
.20
.30
0 4 8 12
Time (months)
Mean Z-scores
C+T (act.)
C+T (est.)
T/O (act.)
T-O (est.)
39
ITT Analysis: Findings by Cluster
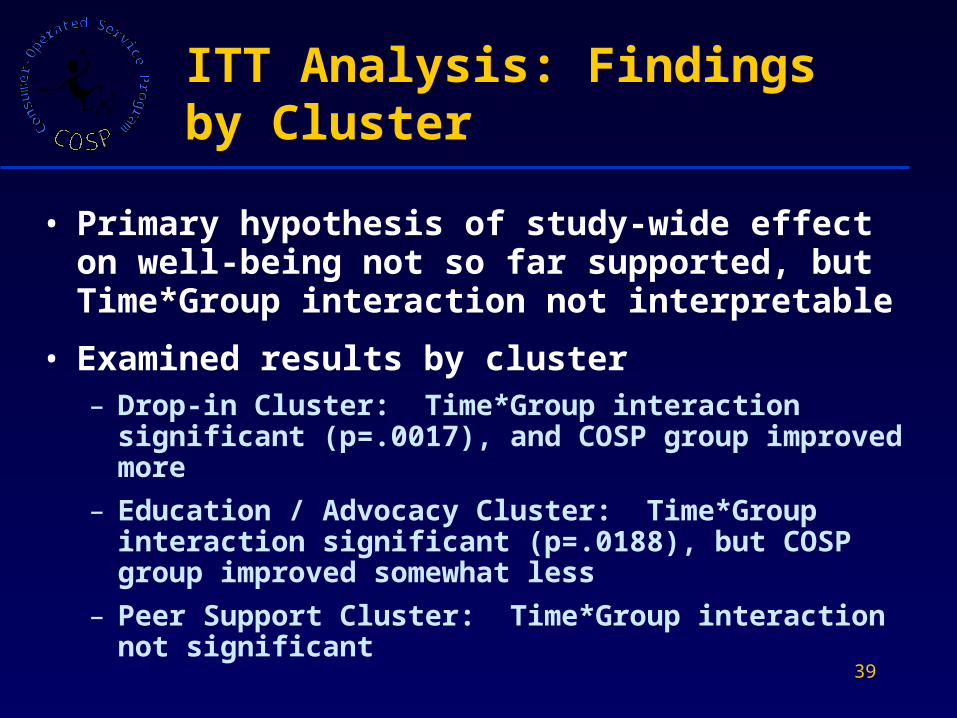
• Primary hypothesis of study-wide effect on well-being not so far supported, but Time*Group interaction not interpretable
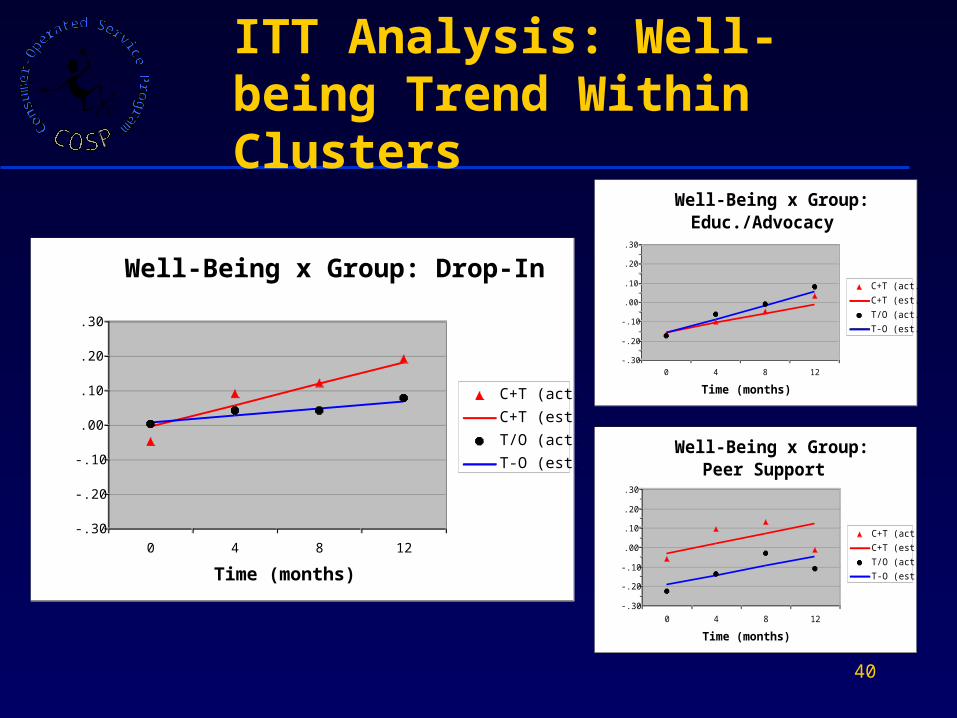
• Examined results by cluster– Drop-in Cluster: Time*Group interaction
significant (p=.0017), and COSP group improved more
– Education / Advocacy Cluster: Time*Group interaction significant (p=.0188), but COSP group improved somewhat less
– Peer Support Cluster: Time*Group interaction not significant
40
ITT Analysis: Well-being Trend Within Clusters
Well-Being x Group: Drop-In
-.30
-.20
-.10
.00
.10
.20
.30
0 4 8 12
Time (months)
Mean Z-scores
C+T (act.)
C+T (est.)
T/O (act.)
T-O (est.)
Well-Being x Group: Educ./Advocacy
-.30
-.20
-.10
.00
.10
.20
.30
0 4 8 12
Time (months)
Mean Z-scores
C+T (act.)
C+T (est.)
T/O (act.)
T-O (est.)
Well-Being x Group: Peer Support
-.30
-.20
-.10
.00
.10
.20
.30
0 4 8 12
Time (months)
Mean Z-scores
C+T (act.)
C+T (est.)
T/O (act.)
T-O (est.)
41
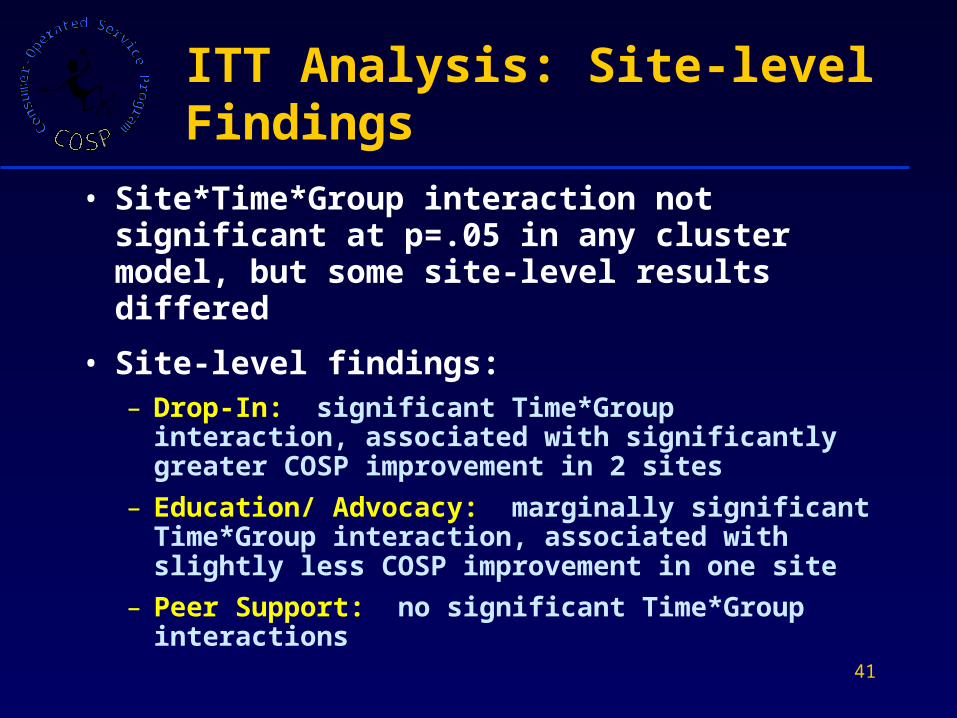
ITT Analysis: Site-level Findings
• Site*Time*Group interaction not significant at p=.05 in any cluster model, but some site-level results differed
• Site-level findings:– Drop-In: significant Time*Group interaction,
associated with significantly greater COSP improvement in 2 sites
– Education/ Advocacy: marginally significant Time*Group interaction, associated with slightly less COSP improvement in one site
– Peer Support: no significant Time*Group interactions
42
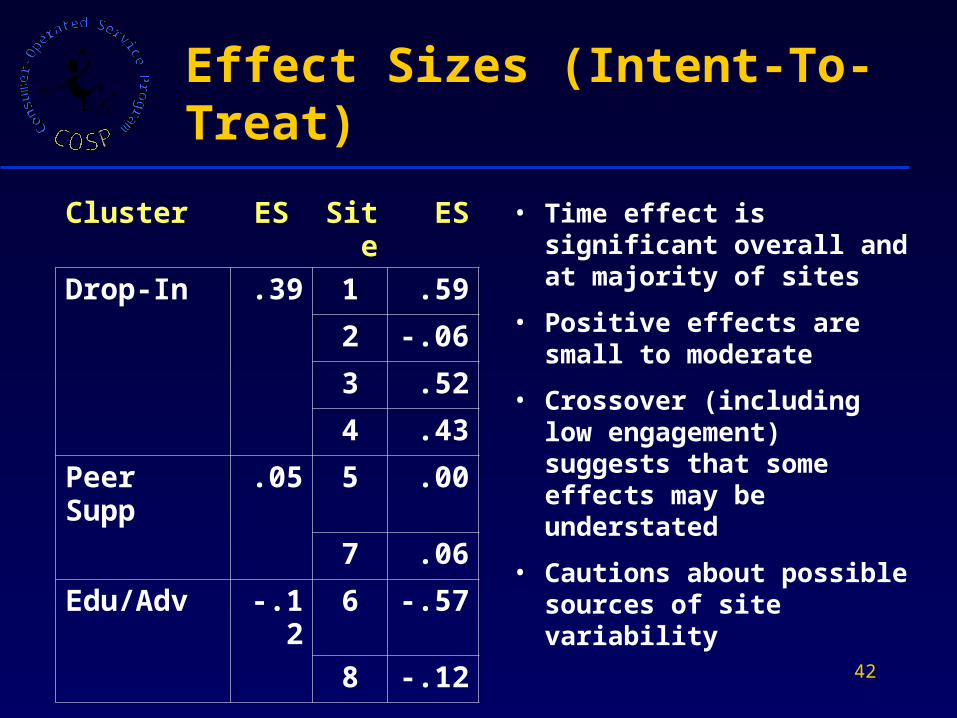
Effect Sizes (Intent-To-Treat)
• Time effect is significant overall and at majority of sites
• Positive effects are small to moderate
• Crossover (including low engagement) suggests that some effects may be understated
• Cautions about possible sources of site variability
Cluster ES Site
ES
Drop-In .39 1 .59
2 -.06
3 .52
4 .43
Peer Supp
.05 5 .00
7 .06
Edu/Adv -.12 6 -.57
8 -.12
43
As-Treated Analyses: Approach
• As-treated (AT) analyses must address potential for selection effects
• Significant crossover confirms likelihood of selection effects in this study
• Use of propensity scores to improve equivalence of comparison groups
• Engagement / utilization examined as presence-absence and by amount
• Power reduced at site level, but findings examined at site level for verification of pattern found at overall level
44
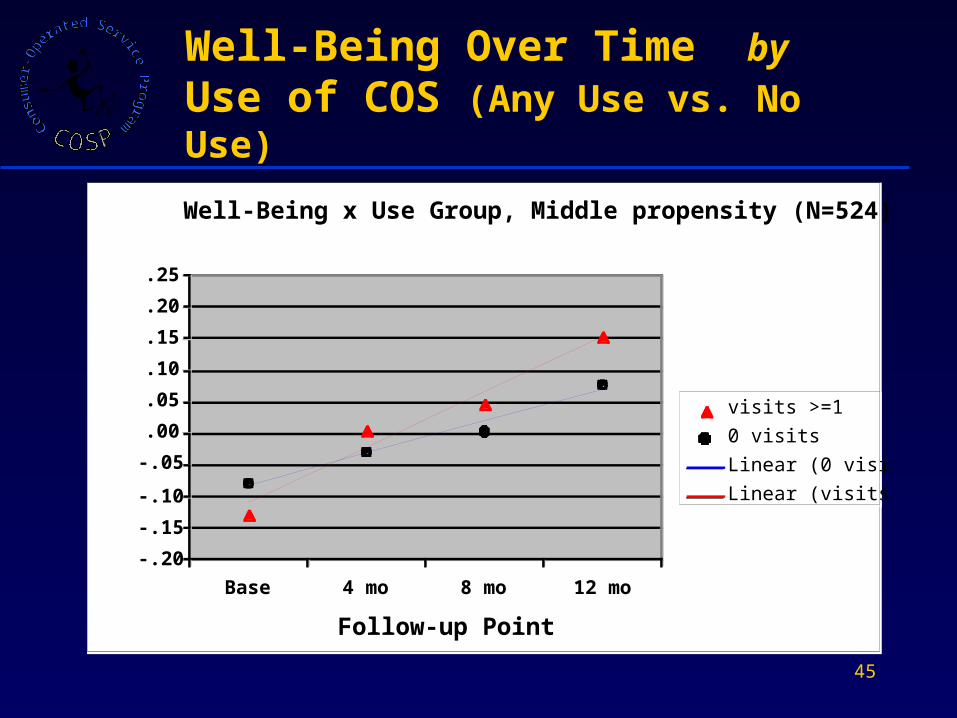
As-Treated Analyses: Findings
• Analyses using middle “propensity” group– Participants who were not likely predisposed
either for or against use of COS
• Examined overall effect of minimal engagement (any use vs. no use)
• Significant Time*Group interaction, p = .042
• Greater increase in Well-Being among those who used COS, effect size = .302
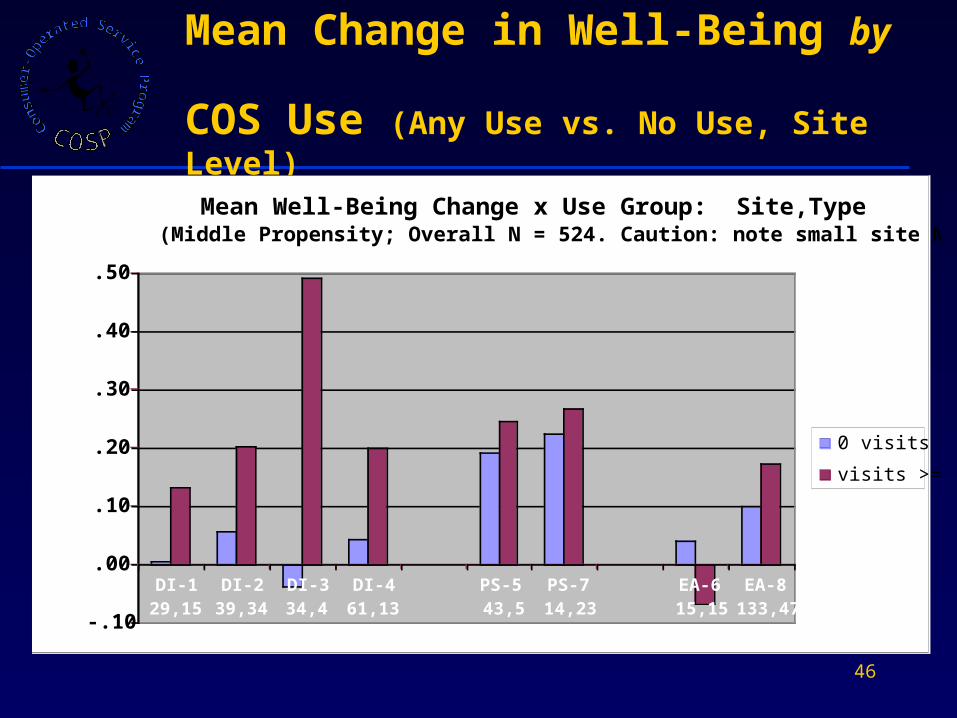
• Pattern generally observed across sites , with varying strength
45
Well-Being Over Time by Use of COS (Any Use vs. No Use)
Well-Being x Use Group, Middle propensity (N=524)
-.20
-.15
-.10
-.05
.00
.05
.10
.15
.20
.25
Base 4 mo 8 mo 12 mo
Follow-up Point
Well-Being
visits >=1
0 visits
Linear (0 visits)
Linear (visits >=1)
46
Mean Change in Well-Being by
COS Use (Any Use vs. No Use, Site Level)
Mean Well-Being Change x Use Group: Site,Type(Middle Propensity; Overall N = 524. Caution: note small site Ns)
-.10
.00
.10
.20
.30
.40
.50
DI-129,15
DI-239,34
DI-334,4
DI-461,13
PS-543,5
PS-714,23
EA-615,15
EA-8133,47
Mean Well-Being Change
0 visits
visits >=1
47
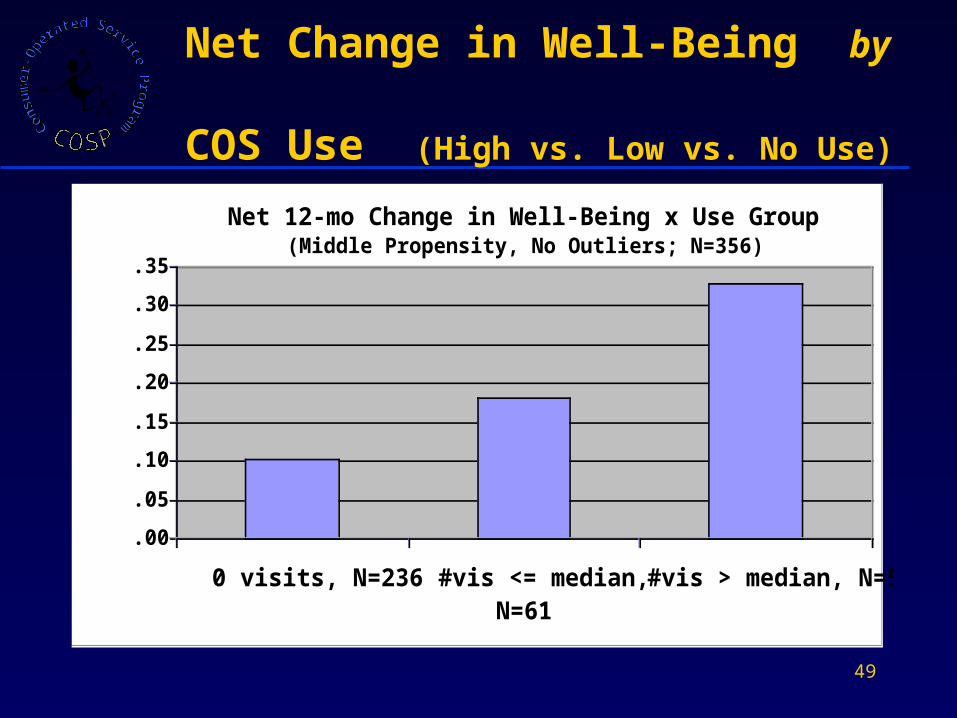
As-Treated Analyses: Findings (cont’d.)
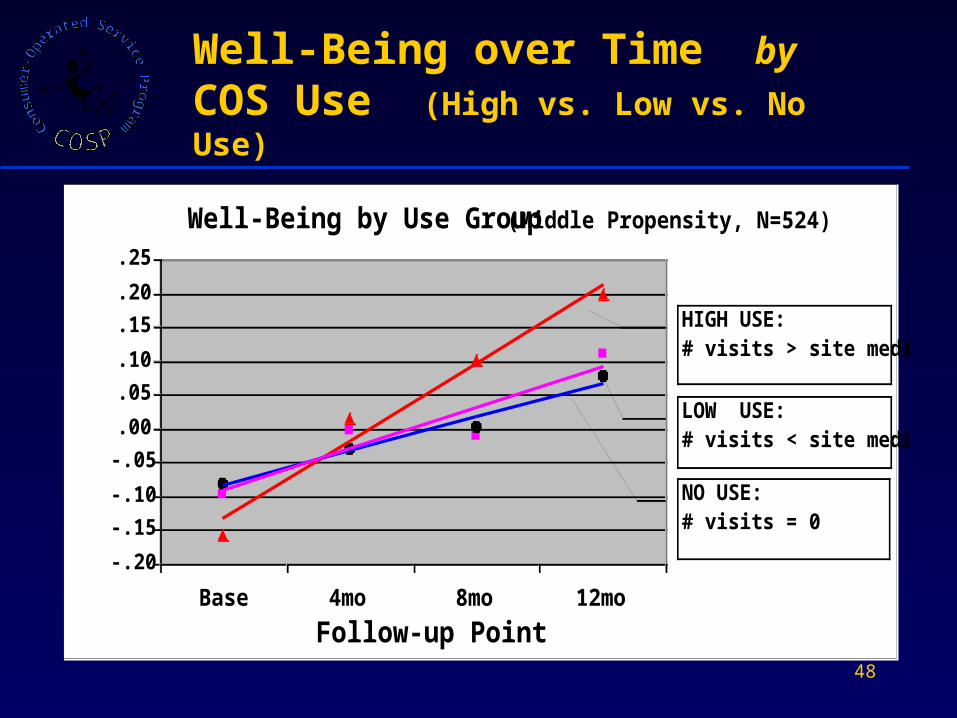
• Examined overall effect of level of use (High use vs. Low use vs. No use)
• Significant group effect, p = .017
• Greatest increase in Well-Being among those who used COS more
• Pattern generally observed across sites, with varying strength
48
Well-Being by Use Group (Middle Propensity, N=524)
-.20
-.15
-.10
-.05
.00
.05
.10
.15
.20
.25
Base 4mo 8mo 12mo
Follow-up Point
Well-Being
HIGH USE:# visits > site median
NO USE:# visits = 0
LOW USE:# visits < site median
Well-Being over Time by COS Use (High vs. Low vs. No Use)
49
Net Change in Well-Being by COS Use (High vs. Low vs. No Use)
Net 12-mo Change in Well-Being x Use Group (Middle Propensity, No Outliers; N=356)
.00
.05
.10
.15
.20
.25
.30
.35
0 visits, N=236 #vis <= median,N=61
#vis > median, N=59
Change in Well-Being
50
Further Investigations
• Pending analyses– Other outcomes
– Participant characteristics
• Current additional analyses using fidelity data– Impact of program elements on
intervention effect (experimental framework)
– Relationship of program elements to program effects (observational framework)
– Sensitivity testing for spurious revelation or obscuration
**
*
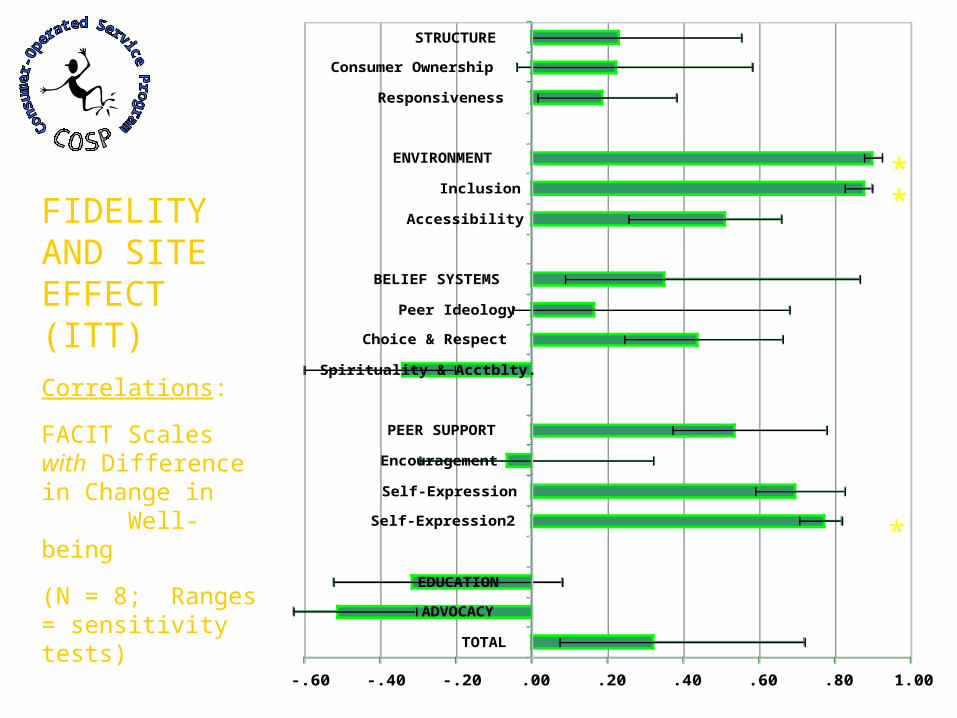
-.60 -.40 -.20 .00 .20 .40 .60 .80 1.00
TOTAL
ADVOCACY
EDUCATION
Self-Expression2
Self-Expression
Encouragement
PEER SUPPORT
Spirituality & Acctblty.
Choice & Respect
Peer Ideology
BELIEF SYSTEMS
Accessibility
Inclusion
ENVIRONMENT
Responsiveness
Consumer Ownership
STRUCTURE
FIDELITY AND SITE EFFECT (ITT)Correlations:
FACIT Scales with Difference in Change in Well-being
(N = 8; Ranges = sensitivity tests)
* p < .05
52
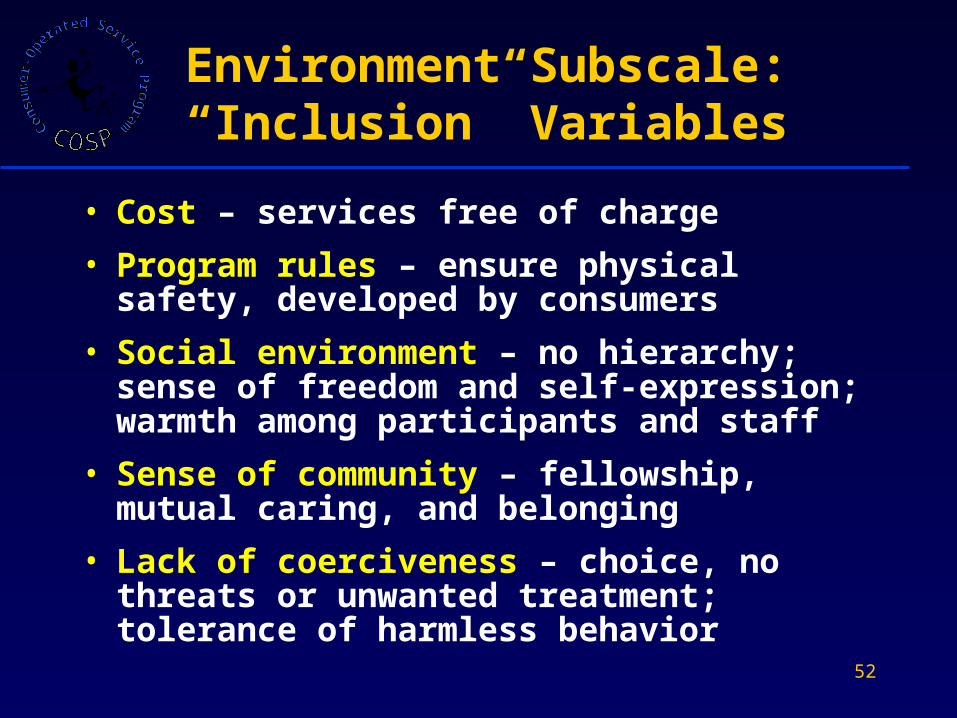
Environment Subscale:“Inclusion” Variables
• Cost – services free of charge
• Program rules – ensure physical safety, developed by consumers
• Social environment – no hierarchy; sense of freedom and self-expression; warmth among participants and staff
• Sense of community – fellowship, mutual caring, and belonging
• Lack of coerciveness – choice, no threats or unwanted treatment; tolerance of harmless behavior
53
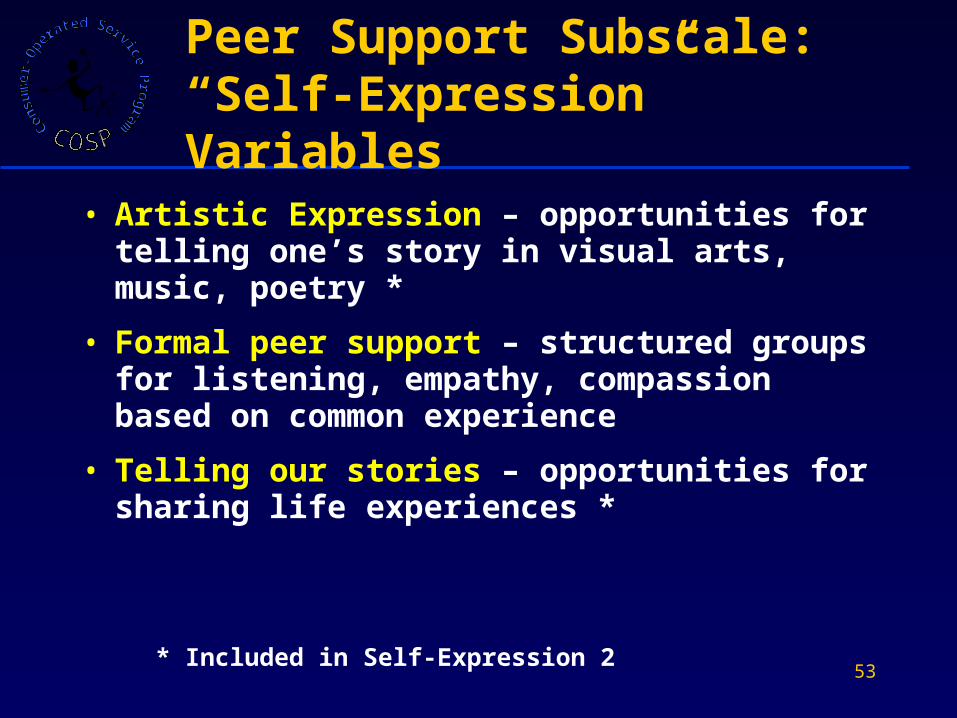
Peer Support Subscale:“Self-Expression” Variables
• Artistic Expression – opportunities for telling one’s story in visual arts, music, poetry *
• Formal peer support – structured groups for listening, empathy, compassion based on common experience
• Telling our stories – opportunities for sharing life experiences *
* Included in Self-Expression 2
-.60 -.40 -.20 .00 .20 .40 .60 .80 1.00
TOTAL
ADVOCACY
EDUCATION
Self-Expression2
Self-Expression
Encouragement
PEER SUPPORT
Spirituality & Acctblty.
Choice & Respect
Peer Ideology
BELIEF SYSTEMS
Accessibility
Inclusion
ENVIRONMENT
Responsiveness
Consumer Ownership
STRUCTURE
*
**
*
*
*
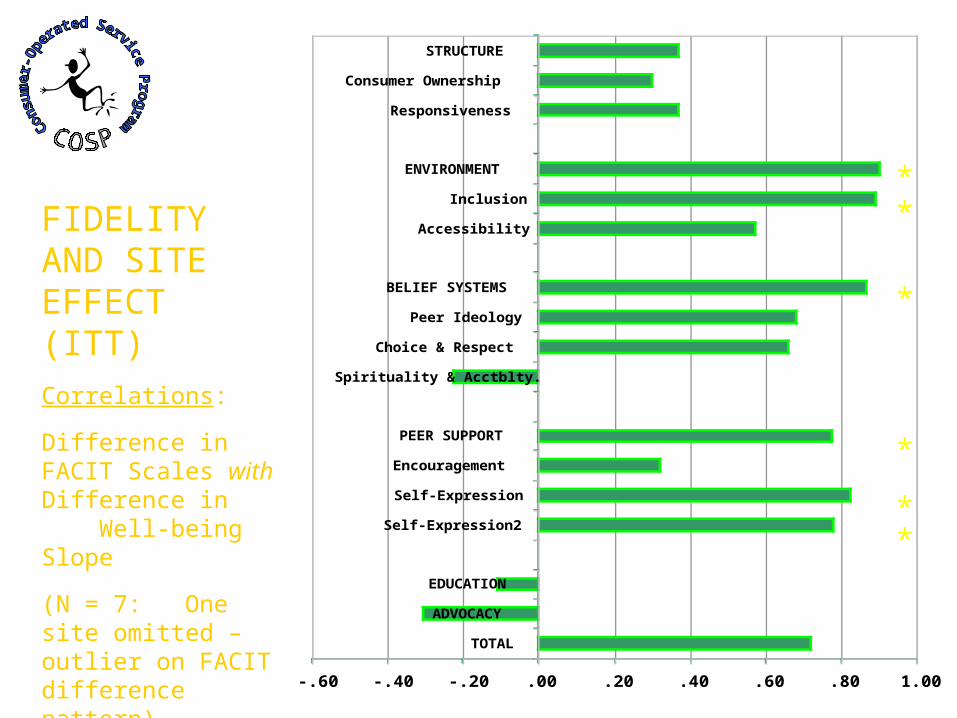
FIDELITY AND SITE EFFECT (ITT)Correlations:
Difference in FACIT Scales with Difference in Well-being Slope
(N = 7: One site omitted – outlier on FACIT difference pattern)
* p < .05
-.60 -.40 -.20 .00 .20 .40 .60 .80 1.00
TOTAL
ADVOCACY
EDUCATION
Self-Expression2
Self-Expression
Encouragement
PEER SUPPORT
Spirituality & Acctblty.
Choice & Respect
Peer Ideology
BELIEF SYSTEMS
Accessibility
Inclusion
ENVIRONMENT
Responsiveness
Consumer Ownership
STRUCTURE
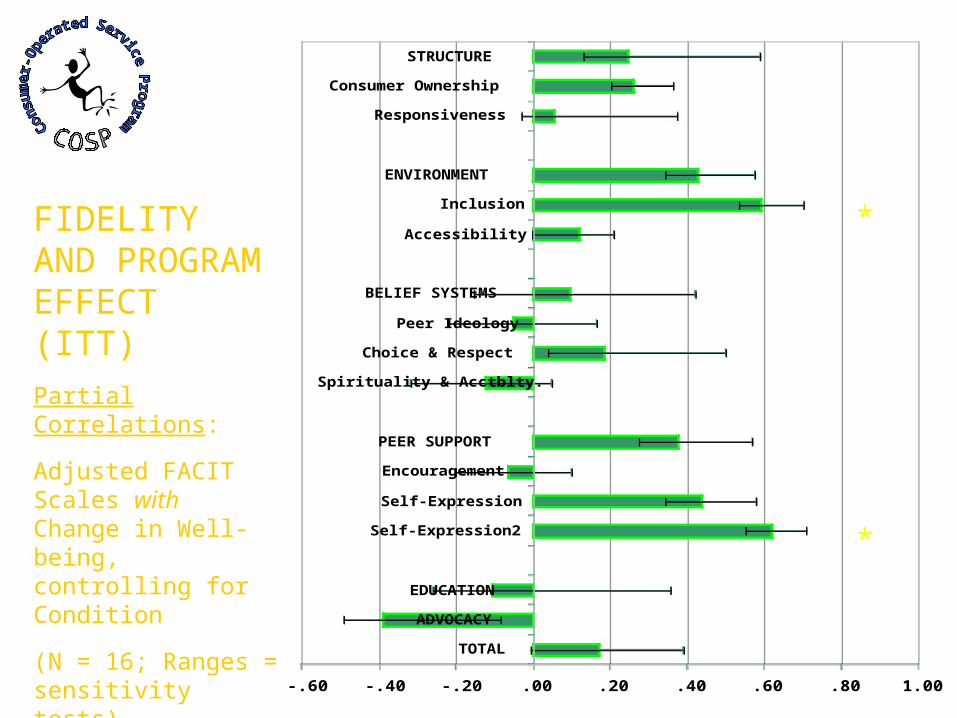
FIDELITY AND PROGRAM EFFECT (ITT)Partial Correlations:
Adjusted FACIT Scales with Change in Well-being, controlling for Condition
(N = 16; Ranges = sensitivity tests)
* p < .05
*
*
-.60 -.40 -.20 .00 .20 .40 .60 .80 1.00
TOTAL
ADVOCACY
EDUCATION
Self-Expression2
Self-Expression
Encouragement
PEER SUPPORT
Spirituality & Acctblty.
Choice & Respect
Peer Ideology
BELIEF SYSTEMS
Accessibility
Inclusion
ENVIRONMENT
Responsiveness
Consumer Ownership
STRUCTURE
*
*
*
*
*
*
*
***
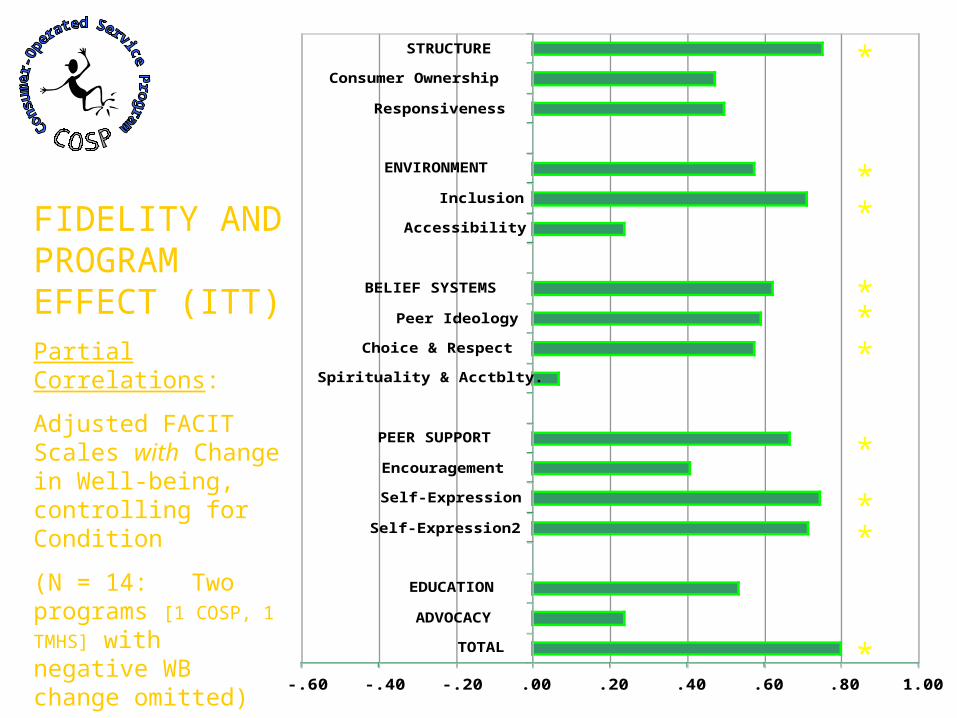
FIDELITY AND PROGRAM EFFECT (ITT)Partial Correlations:
Adjusted FACIT Scales with Change in Well-being, controlling for Condition
(N = 14: Two programs [1 COSP, 1
TMHS] with negative WB change omitted)
* p < .05
57
Effectiveness Findings:Summary
• Crossover: low engagement in COS programs
• Significant time effect: overall increase in well-being among study participants
• Significant small effect of COS intervention in a subset of sites (ITT)
• More general positive effect when actual participation is taken into account (AT); greater use associated with greater increase in well-being
• Strong relationship between increase in well-being and recovery-oriented program features
• Findings not limited to one program model
58
- 4 -
Summary & Conclusions
59
Summary & Conclusions: Study Context
• Consumer-driven health care – underlying rationale for the COSP study– History of advocacy, theory, and critique; cf. IOM
Quality Chasm and New Freedom Commission reports
– Needed: expansion of the evidence base
• Challenging design– Variable, loosely specified interventions– RCT vs. volunteer culture: experimental
intervention as adjunct; “cold calls” in many sites– Substantial crossover within modestly powered
study
• Innovative structure and process– Integration of multiple perspectives– Impact of COSP-MRI on individual COS sites
60
Impact on Service Sites
• Infusion of resources
• Some change in service population
• Data collection– Services
– Costs
• Attention to fidelity
• Identity as programs– Internal
– External
61
Summary & Conclusions: Study Limitations
• Sample of sites– Generalizability not established– Small N, especially within cluster
• Novel measures– Primary outcome variable (synthetic Well-
being)– Intervention/fidelity measure (FACIT)
• Theoretical context– Findings are embedded in recovery theory– Relationship to other outcome domains to
be determined
• Analysis still under way…
62
Summary & Conclusions: Methodological Contributions
• Fidelity & model measurement – New instrument for consumer-operated
services and critical service features
– Importance of measuring interventions for understanding outcome results
• Multisite studies– Natural variation can reveal phenomena
that might be less visible within more uniform site samples
63
Summary & Conclusions: Substantive Findings
• Evidence base for COS as discrete programs – Adding COS to traditional services adds
incrementally to well-being
• Evidence base for recovery theory– Program features specified for and found in
COS are related to increases in well-being independent of setting
• COSP as a business– Variability in unit cost: data & study impact
– Efficiency and management practices matter
64
Summary & Conclusions: Policy Implications
• Stronger basis for commitment to recovery–oriented services– Particular consumer-supported program
features contribute to recovery and are effective within various settings
• Further support for bringing COS into the mental health service fold– COS should be recognized and included as
such within the service continuum
– COS should have appropriate fiscal and organizational support
65
Contributors to Presentation
Steven Banks
Crystal R. Blyler
Jean Campbell
Sally Clay
Carolyn Lichtenstein
Betsy McDonel Herr
Mark Salzer
Vijaya Sampath
Joseph Sonnefeld
Kristin Zempolich
66
COSP-MRI Investigators & Scientific Contributors*
Steven Banks
Crystal R. Blyler
Jean Campbell
Patrick W. Corrigan
Dianne C. Côté
Nancy Erwin
Susan Essock
Matthew Johnsen
Betsy McDonel Herr
* Partial list
Carolyn Lichtenstein
Jeffrey G. Noel
Ruth O. Ralph
E. Sally Rogers
Joseph Rogers
Mark S. Salzer
L. Joseph Sonnefeld
Tom Summerfelt
Gregory B. Teague
Brian Yates
67
Consumer Advisory Panel
Jean Campbell, Sally Clay, Dianne Cote, Zahira Duvall, Janine Elkanich, Nancy Erwin, Louetta Hix, Lorraine Keck, Kathryn Kidder, Barbara Lee, Terrance Means, Helen Minth, Carol Mussey, Joanne O'Connor, Jean Risman, Joseph Rogers, Yvette Sangster, Bonnie Schell, James Scott, Florence Schroeter, Paula Stockdale, Greg Warren, Michael E. Weiss, Jeanie Whitecraft
68
Common Ingredients Subcommittee
Crystal Blyler, Jean Campbell, Sally Clay, Patrick Corrigan, Dianne Cote, Sita Diehl, Zahira Duvall, Janine Elkanich, Susan Essock, Steve Fischer, Betsy McDonel Herr, Louetta Hix, Karen Hirsch, Matthew Johnsen, Anika Keens-Douglas, David Lambert, Sara Lickey, Brian McCorkle, Carol Mussey, Joanne O’Connor, Dena Plemmons, Ruth Ralph, Magda Randolph, Jean Risman, Yvette Sangster, Carole Silverman, Joe Sonnefeld, Tom Summerfelt, Sharon Togut, Greg Teague, Eileen Zeller
Recommended