Copyright © Wei Qiao
Prognostic Health Monitoring for Wind Turbines
Wei Qiao, Ph.D.Director, Power and Energy Systems Laboratory
Associate Professor, Department of ECEUniversity of Nebraska–Lincoln
Lincoln, NE 68588-0511 USATel: +1 (402) 472-9619
E-mail: [email protected]: http://pesl.unl.edu
October 15, 2015
Power & Energy Systems LaboratoryCopyright © Wei Qiao
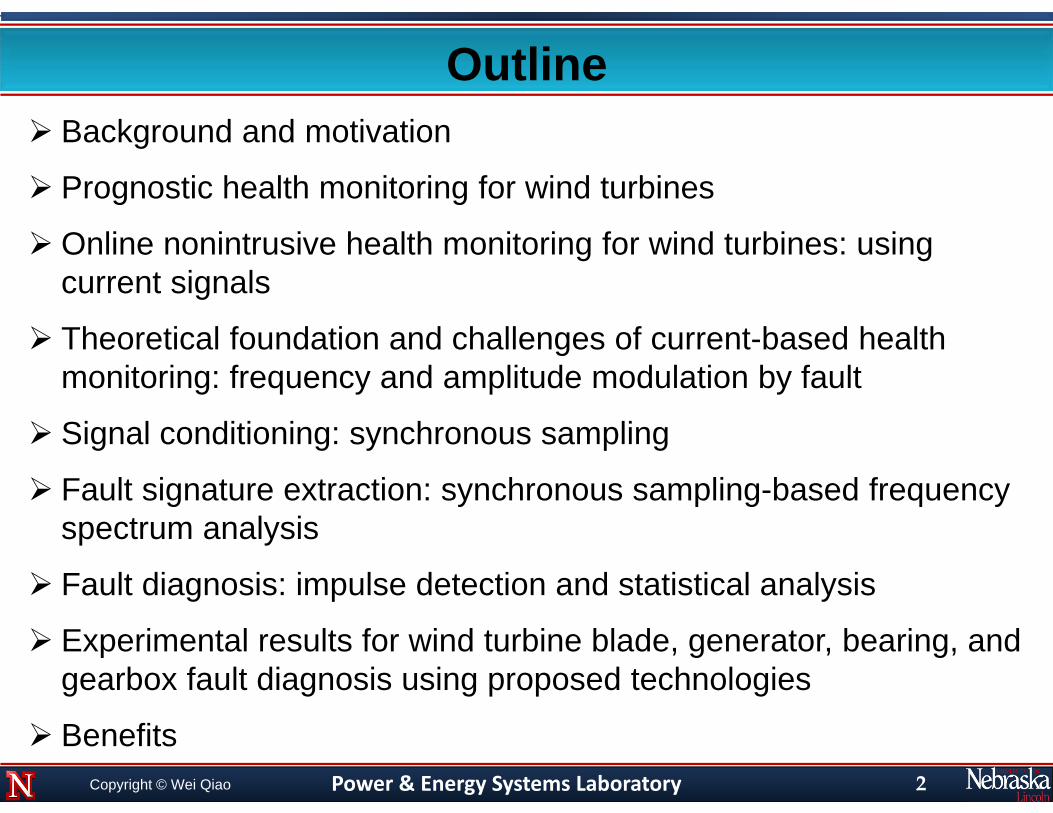
Outline Background and motivation
Prognostic health monitoring for wind turbines
Online nonintrusive health monitoring for wind turbines: using current signals
Theoretical foundation and challenges of current-based health monitoring: frequency and amplitude modulation by fault
Signal conditioning: synchronous sampling
Fault signature extraction: synchronous sampling-based frequency spectrum analysis
Fault diagnosis: impulse detection and statistical analysis
Experimental results for wind turbine blade, generator, bearing, and gearbox fault diagnosis using proposed technologies
Benefits2
Power & Energy Systems LaboratoryCopyright © Wei Qiao
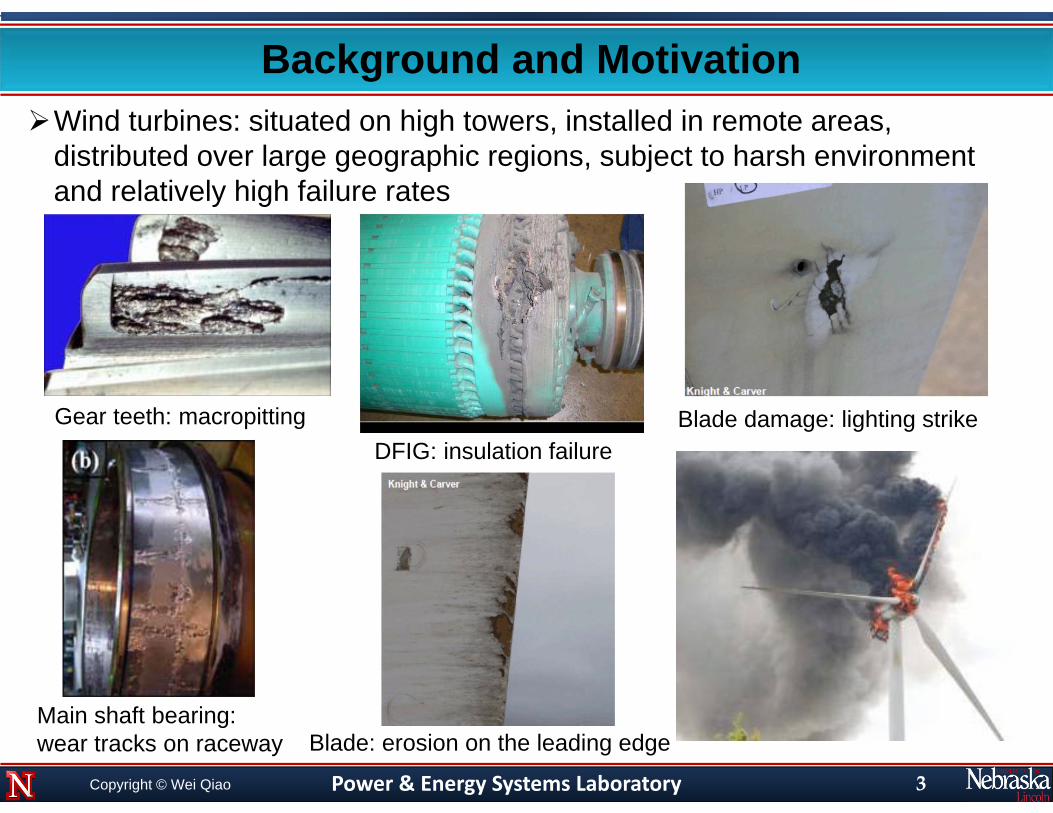
Background and MotivationWind turbines: situated on high towers, installed in remote areas,
distributed over large geographic regions, subject to harsh environment and relatively high failure rates
3
Gear teeth: macropitting
Main shaft bearing: wear tracks on raceway
DFIG: insulation failure
Blade: erosion on the leading edge
Blade damage: lighting strike
Power & Energy Systems LaboratoryCopyright © Wei Qiao
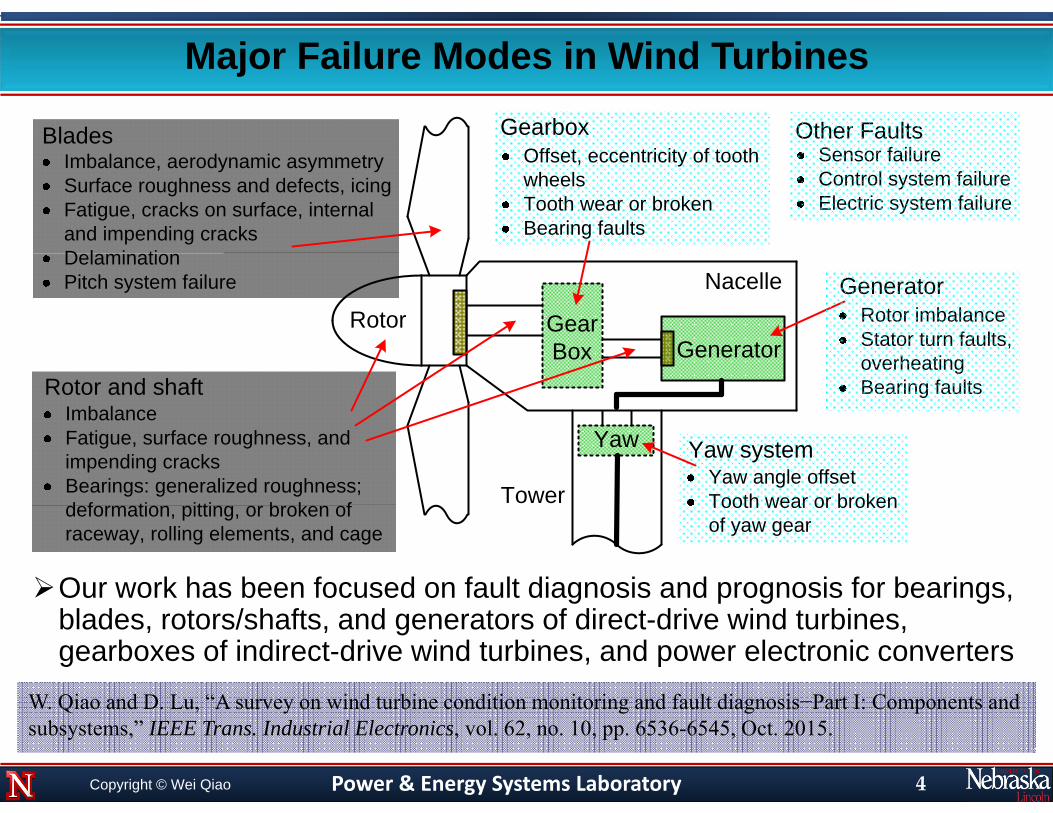
Major Failure Modes in Wind Turbines
4
Our work has been focused on fault diagnosis and prognosis for bearings, blades, rotors/shafts, and generators of direct-drive wind turbines, gearboxes of indirect-drive wind turbines, and power electronic converters
W. Qiao and D. Lu, “A survey on wind turbine condition monitoring and fault diagnosis−Part I: Components and subsystems,” IEEE Trans. Industrial Electronics, vol. 62, no. 10, pp. 6536-6545, Oct. 2015.
9090 GearBox Generator
Yaw
Tower
RotorNacelle
BladesImbalance, aerodynamic asymmetrySurface roughness and defects, icingFatigue, cracks on surface, internal and impending cracksDelaminationPitch system failure
ImbalanceFatigue, surface roughness, and impending cracksBearings: generalized roughness; deformation, pitting, or broken of raceway, rolling elements, and cage
Rotor and shaft
Offset, eccentricity of tooth wheelsTooth wear or brokenBearing faults
Gearbox
Yaw angle offsetTooth wear or broken of yaw gear
Yaw system
Rotor imbalanceStator turn faults, overheatingBearing faults
Generator
Sensor failureControl system failureElectric system failure
Other Faults
Power & Energy Systems LaboratoryCopyright © Wei Qiao
Background and Motivation (2)High O&M costs: 10-15% for onshore and 20-35% for offshore
Online condition monitoring, diagnostics and prognostics Improve wind turbine reliability, capacity factor and lifetimeReduce wind turbine downtime and O&M costs
Most existing technologies: require additional sensors and data acquisition devices to implementSensors are mounted on the surface or buried in the body of wind turbine
components, difficult to access during wind turbine operation The use of additional sensors and equipment increases the costs and hardware
complexity of the wind turbine systemsSensors and devices are inevitably subject to failure, causing additional
problems with system reliability and additional O&M costs
It is desired to develop nonintrusive, low-cost, reliable technologies to fully exploit the benefits of online condition monitoring, fault diagnosis and prognosis for wind turbines
5
W. Qiao and D. Lu, “A survey on wind turbine condition monitoring and fault diagnosis−Part II: Signals and signal processing methods,” IEEE Trans. Industrial Electronics, vol. 62, no. 10, pp. 6546-6557, Oct. 2015.
Power & Energy Systems LaboratoryCopyright © Wei Qiao
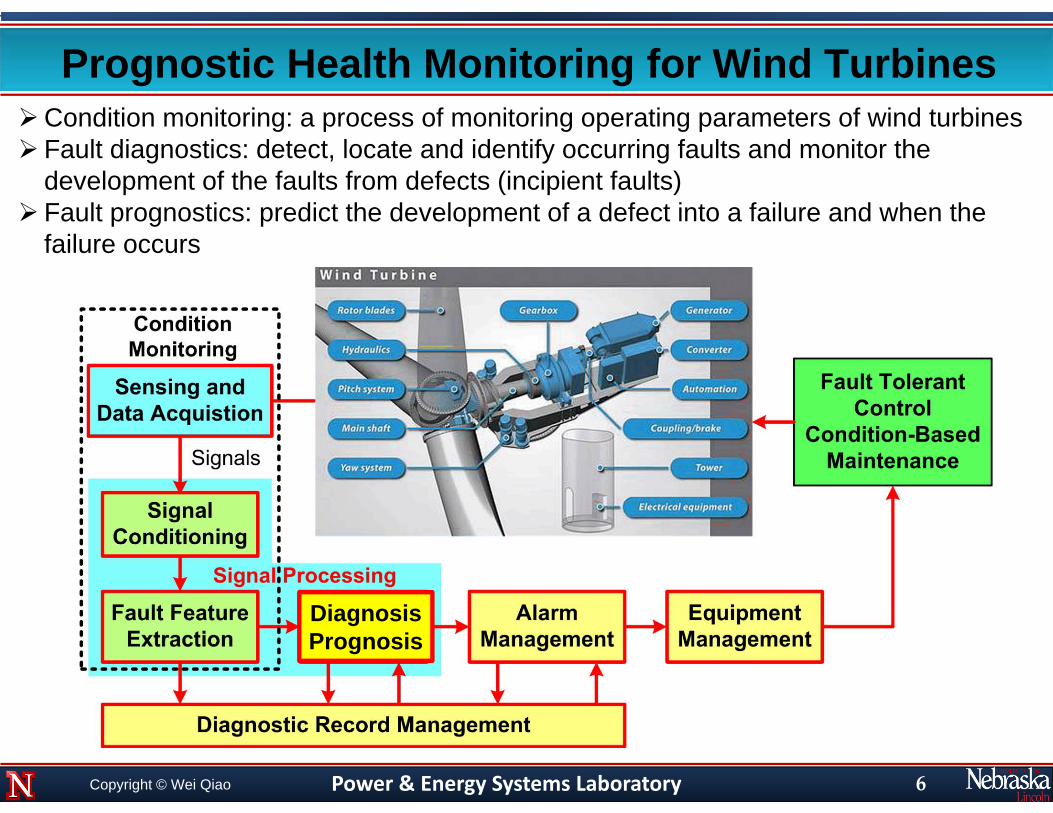
Prognostic Health Monitoring for Wind Turbines
6
Condition monitoring: a process of monitoring operating parameters of wind turbines Fault diagnostics: detect, locate and identify occurring faults and monitor the
development of the faults from defects (incipient faults) Fault prognostics: predict the development of a defect into a failure and when the
failure occurs
DiagnosisPrognosis
Power & Energy Systems LaboratoryCopyright © Wei Qiao
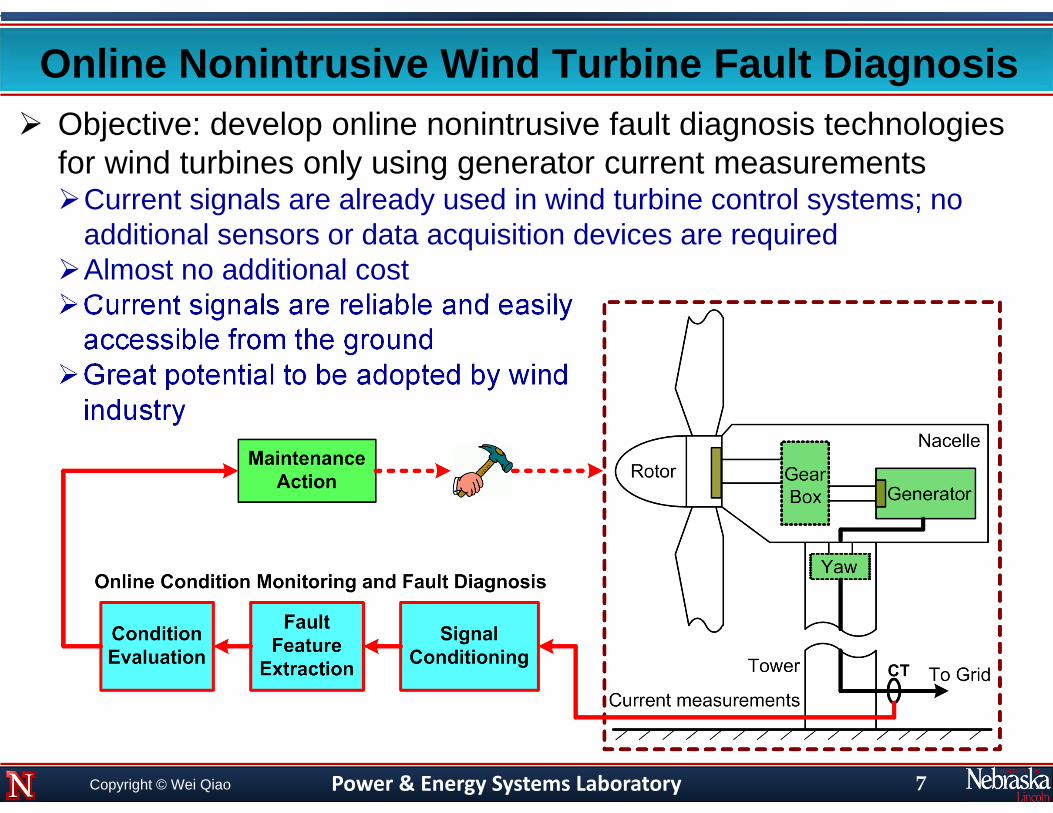
Online Nonintrusive Wind Turbine Fault Diagnosis Objective: develop online nonintrusive fault diagnosis technologies
for wind turbines only using generator current measurementsCurrent signals are already used in wind turbine control systems; no
additional sensors or data acquisition devices are requiredAlmost no additional costCurrent signals are reliable and easily
accessible from the groundGreat potential to be adopted by wind
industry
7
Power & Energy Systems LaboratoryCopyright © Wei Qiao
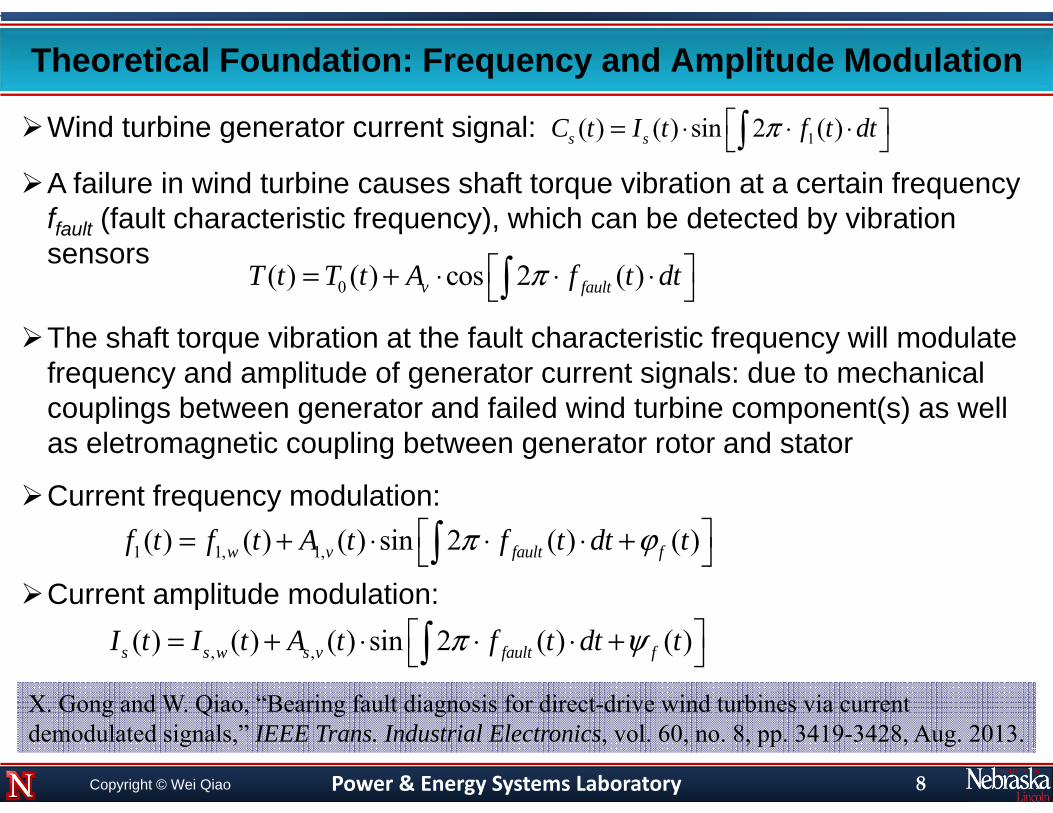
Theoretical Foundation: Frequency and Amplitude Modulation
Wind turbine generator current signal:
A failure in wind turbine causes shaft torque vibration at a certain frequency ffault (fault characteristic frequency), which can be detected by vibration sensors
The shaft torque vibration at the fault characteristic frequency will modulate frequency and amplitude of generator current signals: due to mechanical couplings between generator and failed wind turbine component(s) as well as eletromagnetic coupling between generator rotor and stator
Current frequency modulation:
Current amplitude modulation:
8
0( ) ( ) cos 2 ( )v faultT t T t A f t dtπ = + ⋅ ⋅ ⋅
1( ) ( ) sin 2 ( )s sC t I t f t dtπ = ⋅ ⋅ ⋅
1 1, 1,( ) ( ) ( ) sin 2 ( ) ( )w v fault ff t f t A t f t dt tπ ϕ = + ⋅ ⋅ ⋅ +
, ,( ) ( ) ( ) sin 2 ( ) ( )s s w s v fault fI t I t A t f t dt tπ ψ = + ⋅ ⋅ ⋅ + X. Gong and W. Qiao, “Bearing fault diagnosis for direct-drive wind turbines via current demodulated signals,” IEEE Trans. Industrial Electronics, vol. 60, no. 8, pp. 3419-3428, Aug. 2013.
Power & Energy Systems LaboratoryCopyright © Wei Qiao
Challenges in Current-Based Fault Diagnosis A single fault characteristic frequency in vibration becomes multiple
fault characteristic frequencies in current due to frequency and amplitude modulationsExcitations at fault characteristic frequencies in current could be
masked by subbands of the dominant components that are irrelevant to fault in the frequency spectrum of current
Low signal-to-noise ratio (SNR): the total energy of excitations related to a fault will be dispersed into multiple fault characteristic frequencies
Fault characteristic frequencies: nonstationary challenging to extract fault featuresDepending on shaft rotating frequency (i.e., 1P frequency)Wind turbines: variable speed operation nonstationary fault
characteristic frequencies cannot be effectively extracted by using standard spectrum analysis
Fault diagnosis is expected to be automatic for online applications: need effective online fault detectors
9
Power & Energy Systems LaboratoryCopyright © Wei Qiao
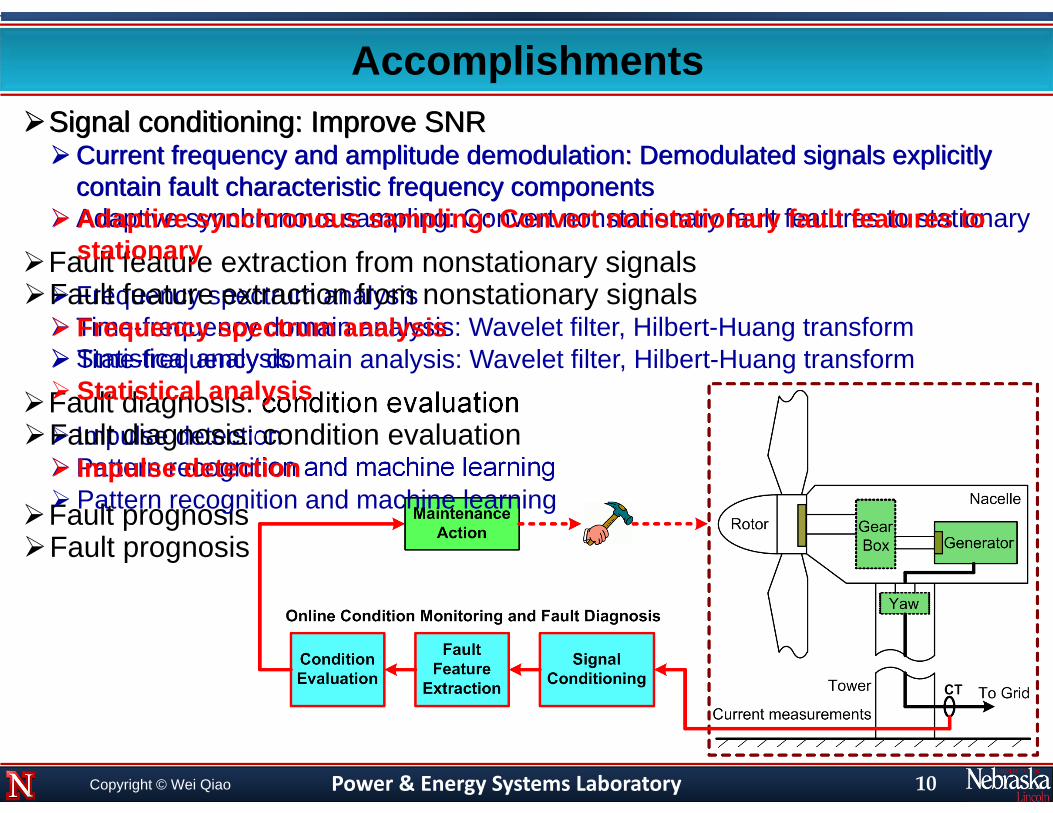
AccomplishmentsSignal conditioning: Improve SNRCurrent frequency and amplitude demodulation: Demodulated signals explicitly
contain fault characteristic frequency componentsAdaptive synchronous sampling: Convert nonstationary fault features to stationary
Fault feature extraction from nonstationary signals Frequency spectrum analysis Time-frequency domain analysis: Wavelet filter, Hilbert-Huang transform Statistical analysis
Fault diagnosis: condition evaluation Impulse detectionPattern recognition and machine learning
Fault prognosis
10
Signal conditioning: Improve SNRCurrent frequency and amplitude demodulation: Demodulated signals explicitly
contain fault characteristic frequency componentsAdaptive synchronous sampling: Convert nonstationary fault features to
stationaryFault feature extraction from nonstationary signals Frequency spectrum analysis Time-frequency domain analysis: Wavelet filter, Hilbert-Huang transform Statistical analysis
Fault diagnosis: condition evaluation Impulse detectionPattern recognition and machine learning
Fault prognosis
Power & Energy Systems LaboratoryCopyright © Wei Qiao
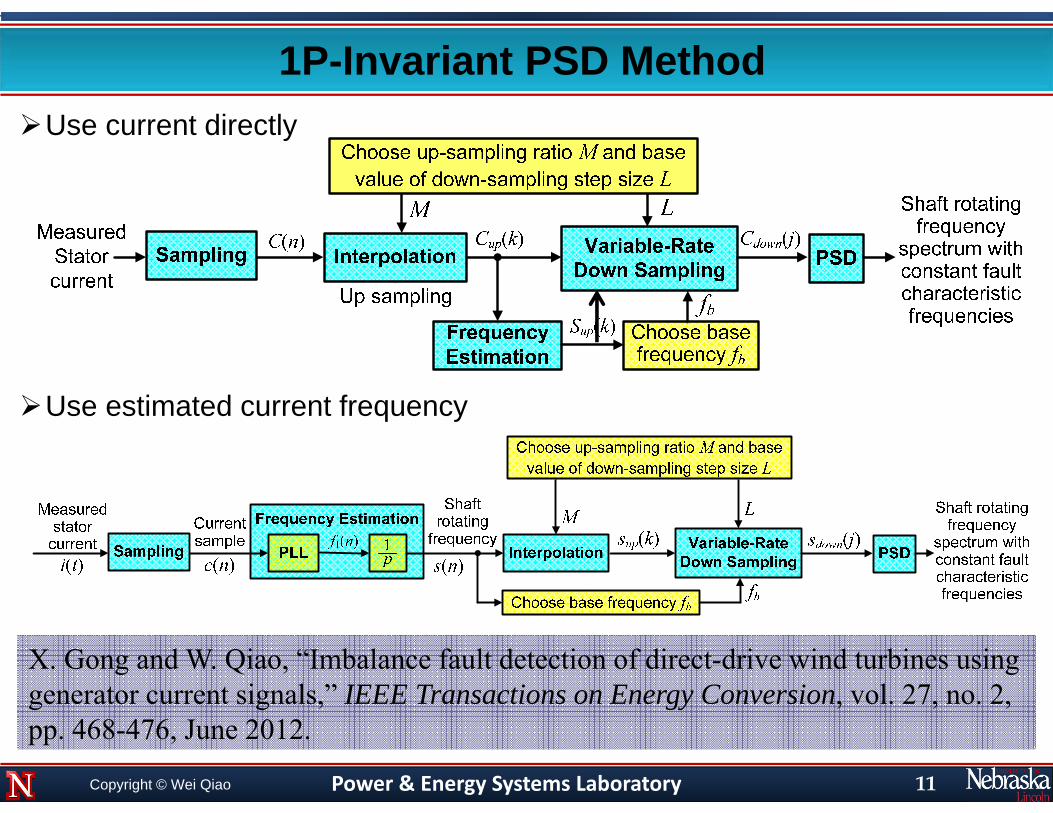
1P-Invariant PSD MethodUse current directly
Use estimated current frequency
X. Gong and W. Qiao, “Imbalance fault detection of direct-drive wind turbines using generator current signals,” IEEE Transactions on Energy Conversion, vol. 27, no. 2, pp. 468-476, June 2012.
11
Power & Energy Systems LaboratoryCopyright © Wei Qiao
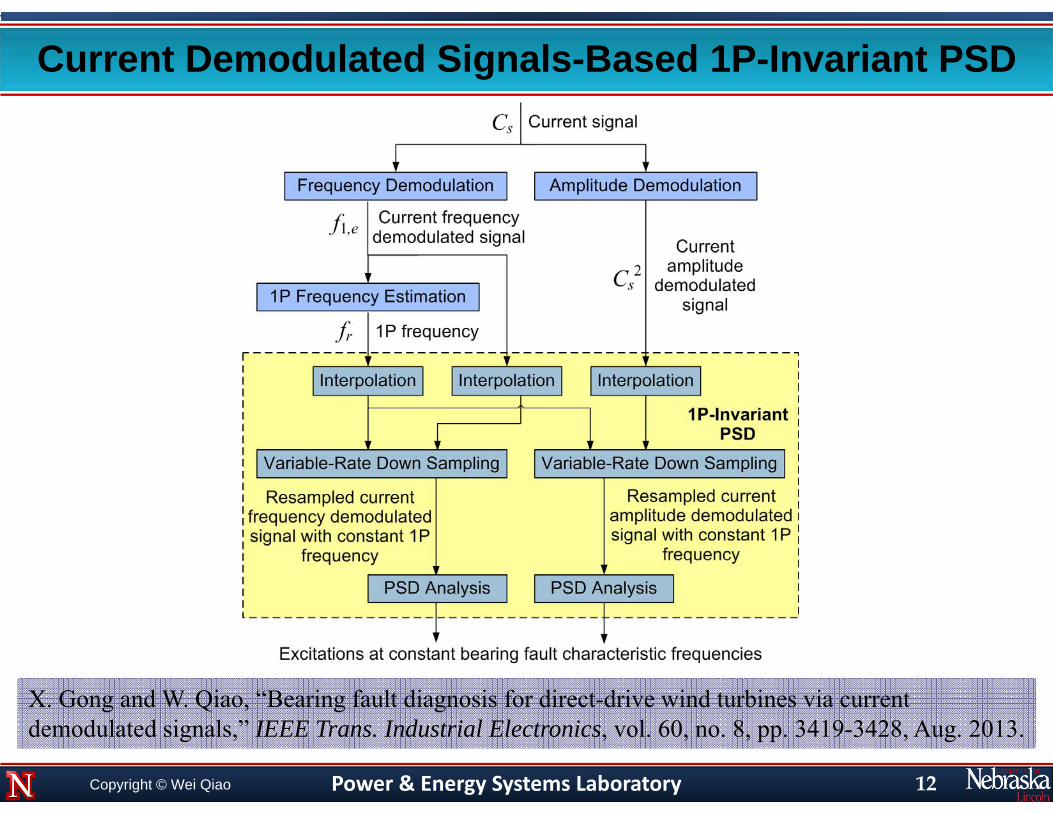
Current Demodulated Signals-Based 1P-Invariant PSD
X. Gong and W. Qiao, “Bearing fault diagnosis for direct-drive wind turbines via current demodulated signals,” IEEE Trans. Industrial Electronics, vol. 60, no. 8, pp. 3419-3428, Aug. 2013.
12
Power & Energy Systems Laboratory
Adaptive Synchronous Sampling
13
t
Phase (Degree)
Amplitude
0
0
60
180
300
t
S1 S2 S3 S4 S5
240
120
S1 S2 S3 S4 S5
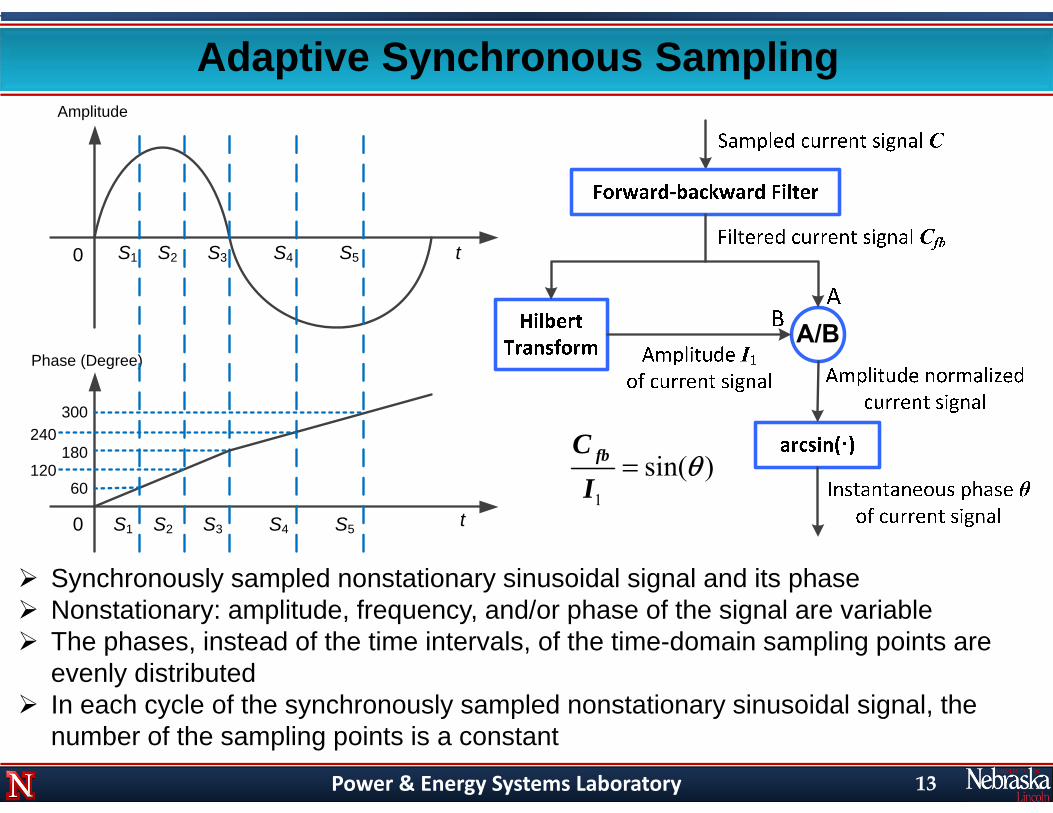
Synchronously sampled nonstationary sinusoidal signal and its phase Nonstationary: amplitude, frequency, and/or phase of the signal are variable The phases, instead of the time intervals, of the time-domain sampling points are
evenly distributed In each cycle of the synchronously sampled nonstationary sinusoidal signal, the
number of the sampling points is a constant
1
sin( )fbCI
= θ
Power & Energy Systems Laboratory
Adaptive Synchronous Sampling (2)
14
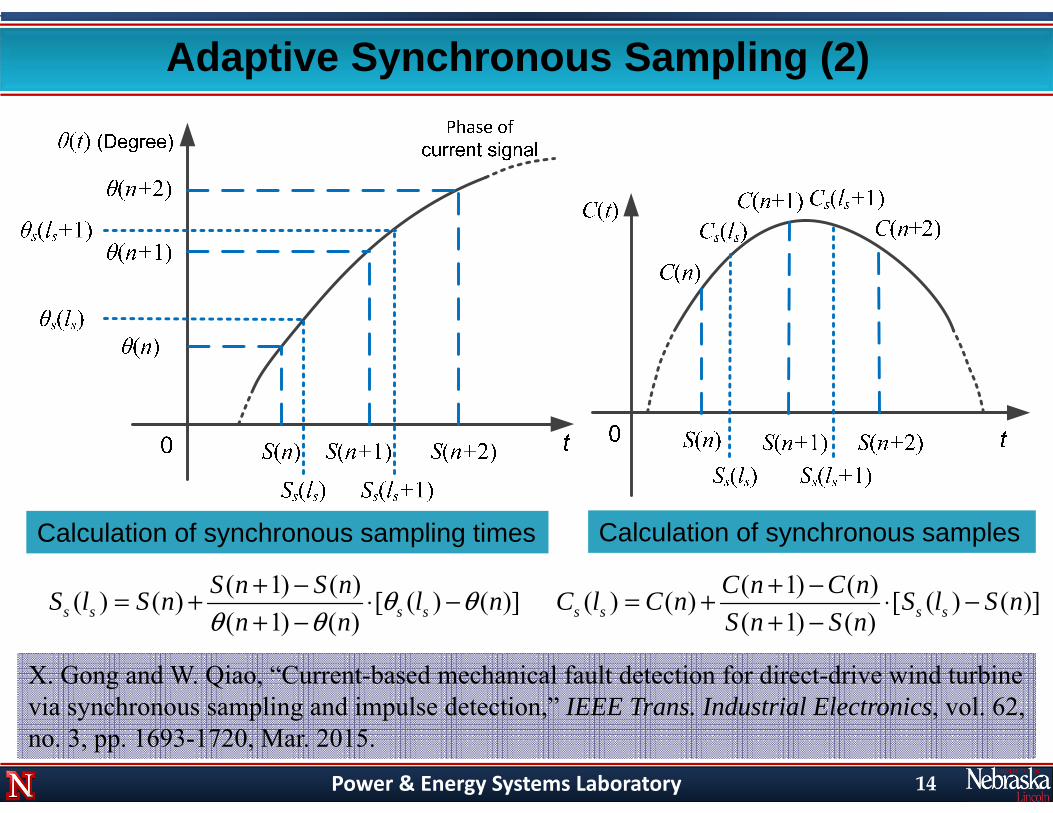
Calculation of synchronous sampling times Calculation of synchronous samples
( 1) ( )( ) ( ) [ ( ) ( )]( 1) ( )s s s s
S n S nS l S n l nn n
θ θθ θ
+ −= + ⋅ −+ −
( 1) ( )( ) ( ) [ ( ) ( )]( 1) ( )s s s s
C n C nC l C n S l S nS n S n
+ −= + ⋅ −+ −
X. Gong and W. Qiao, “Current-based mechanical fault detection for direct-drive wind turbine via synchronous sampling and impulse detection,” IEEE Trans. Industrial Electronics, vol. 62, no. 3, pp. 1693-1720, Mar. 2015.
Power & Energy Systems LaboratoryCopyright © Wei Qiao
Fault Diagnosis: Impulse Detection
15
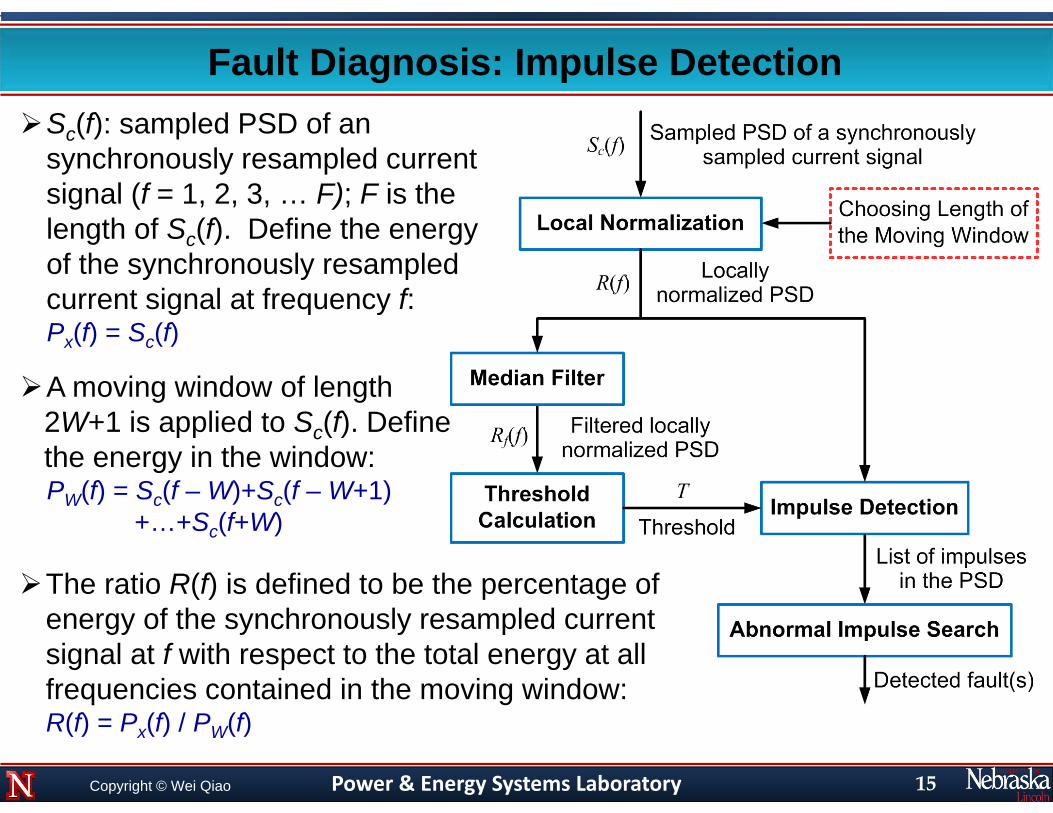
The ratio R(f) is defined to be the percentage of energy of the synchronously resampled current signal at f with respect to the total energy at all frequencies contained in the moving window:R(f) = Px(f) / PW(f)
Sc(f): sampled PSD of an synchronously resampled current signal (f = 1, 2, 3, … F); F is the length of Sc(f). Define the energy of the synchronously resampled current signal at frequency f:Px(f) = Sc(f)
A moving window of length2W+1 is applied to Sc(f). Define the energy in the window:PW(f) = Sc(f – W)+Sc(f – W+1)
+…+Sc(f+W)
Power & Energy Systems LaboratoryCopyright © Wei Qiao
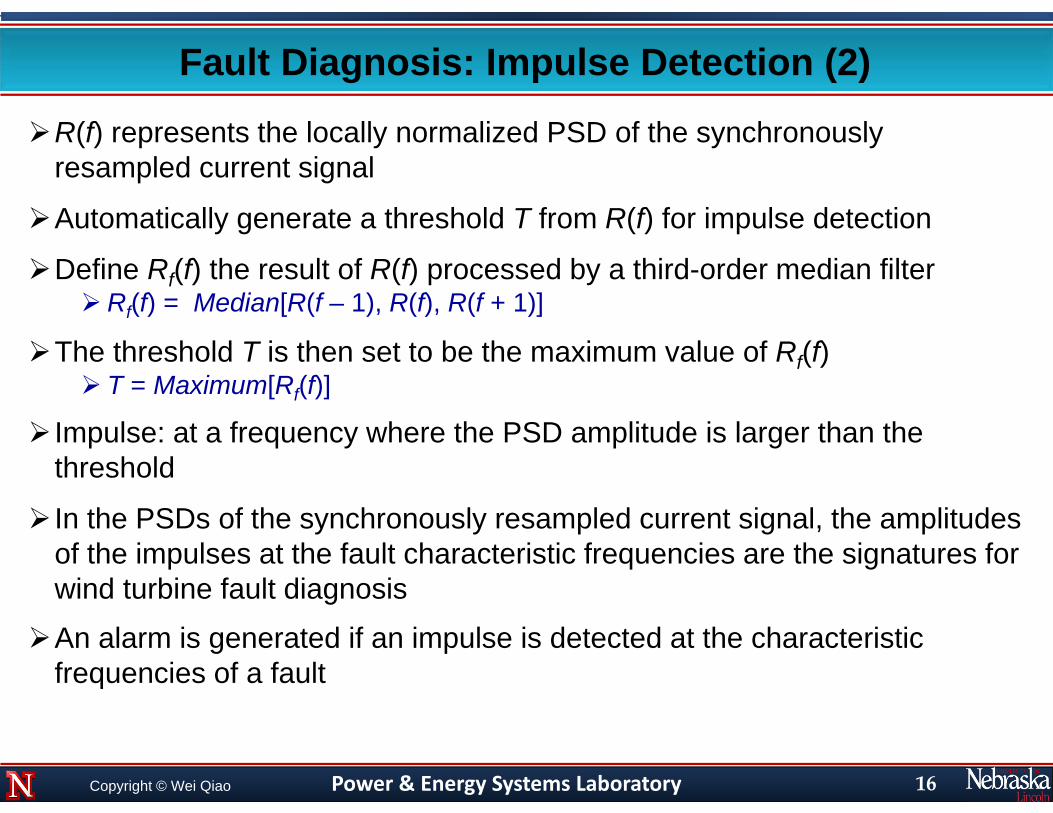
R(f) represents the locally normalized PSD of the synchronously resampled current signal
Automatically generate a threshold T from R(f) for impulse detection
Define Rf(f) the result of R(f) processed by a third-order median filterRf(f) = Median[R(f – 1), R(f), R(f + 1)]
The threshold T is then set to be the maximum value of Rf(f) T = Maximum[Rf(f)]
Impulse: at a frequency where the PSD amplitude is larger than the threshold
In the PSDs of the synchronously resampled current signal, the amplitudes of the impulses at the fault characteristic frequencies are the signatures for wind turbine fault diagnosis
An alarm is generated if an impulse is detected at the characteristic frequencies of a fault
Fault Diagnosis: Impulse Detection (2)
16
Power & Energy Systems LaboratoryCopyright © Wei Qiao
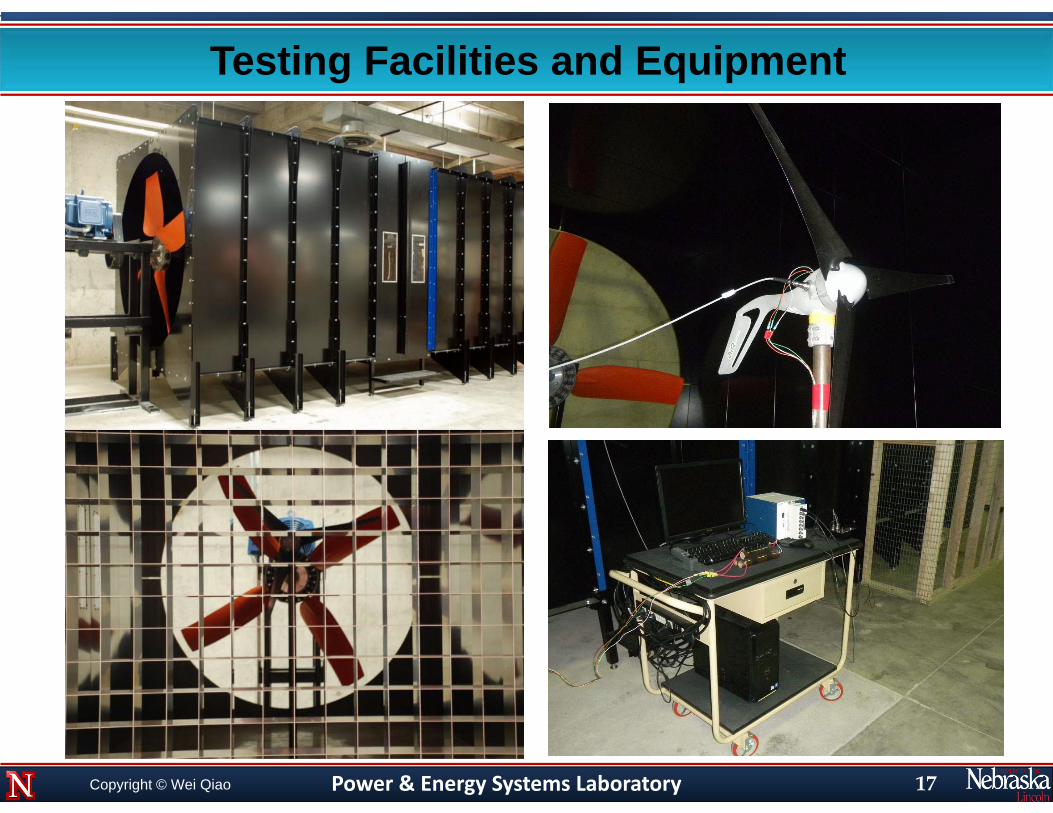
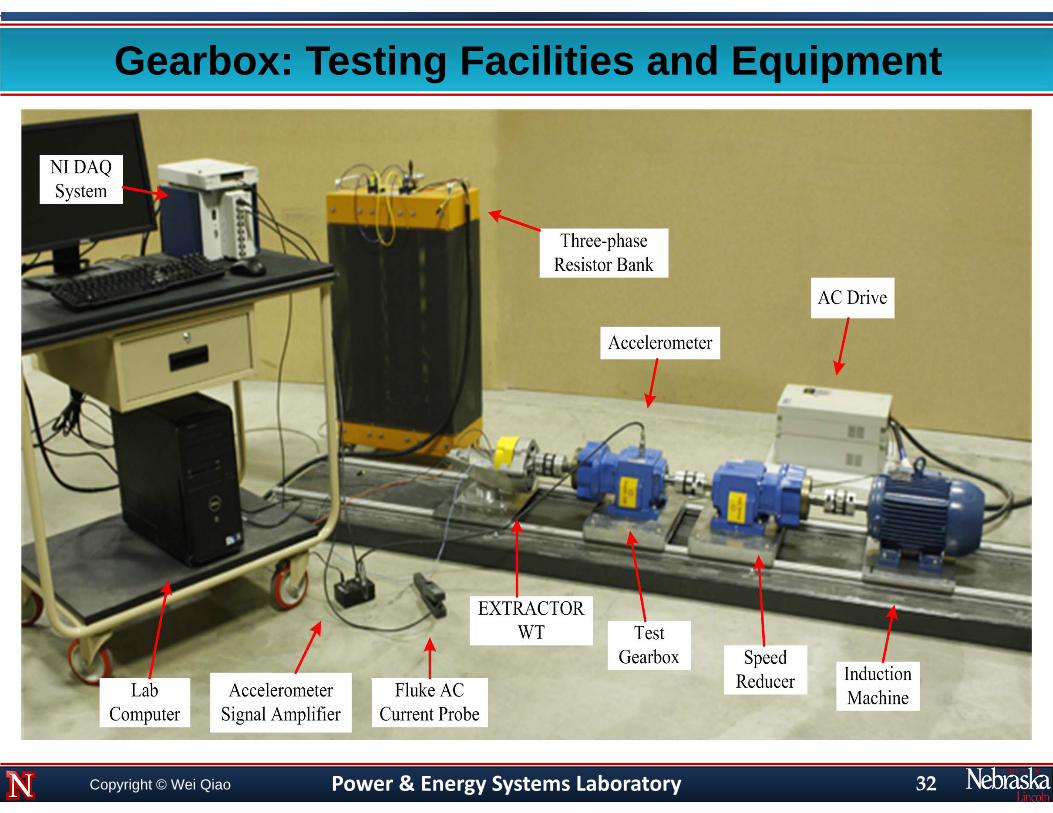
Testing Facilities and Equipment
17
Power & Energy Systems LaboratoryCopyright © Wei Qiao
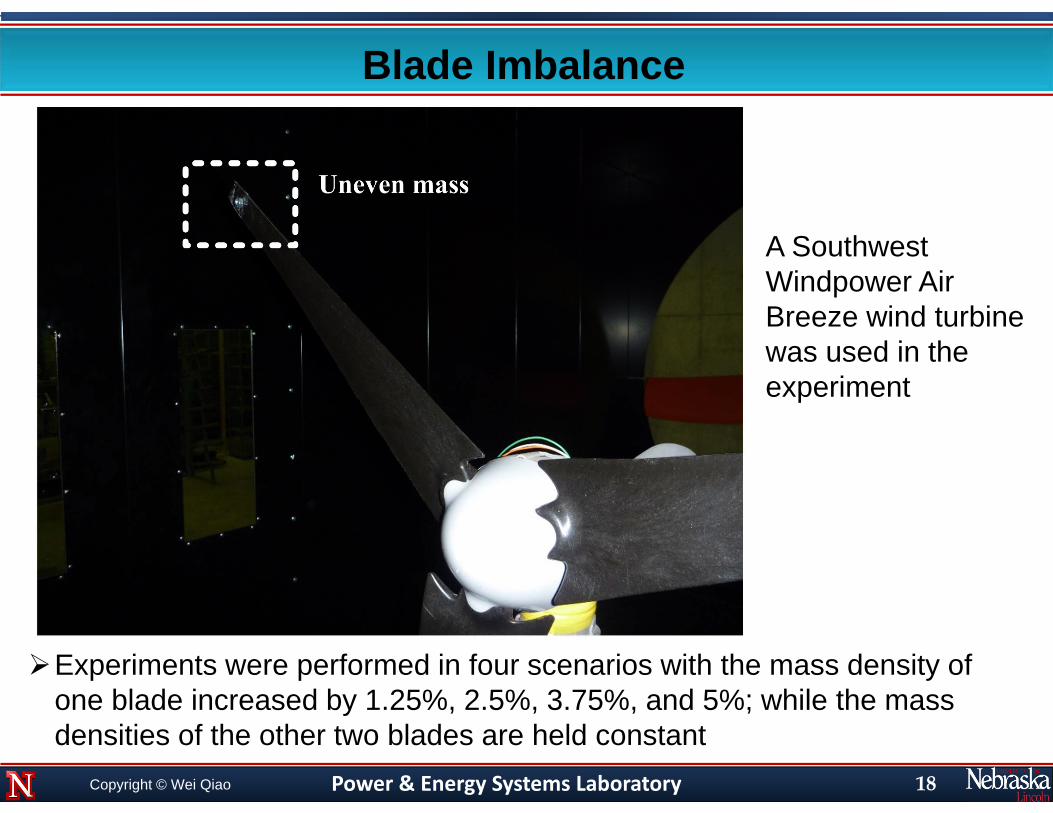
Blade Imbalance
Experiments were performed in four scenarios with the mass density of one blade increased by 1.25%, 2.5%, 3.75%, and 5%; while the mass densities of the other two blades are held constant
A Southwest Windpower Air Breeze wind turbine was used in the experiment
18
Power & Energy Systems LaboratoryCopyright © Wei Qiao
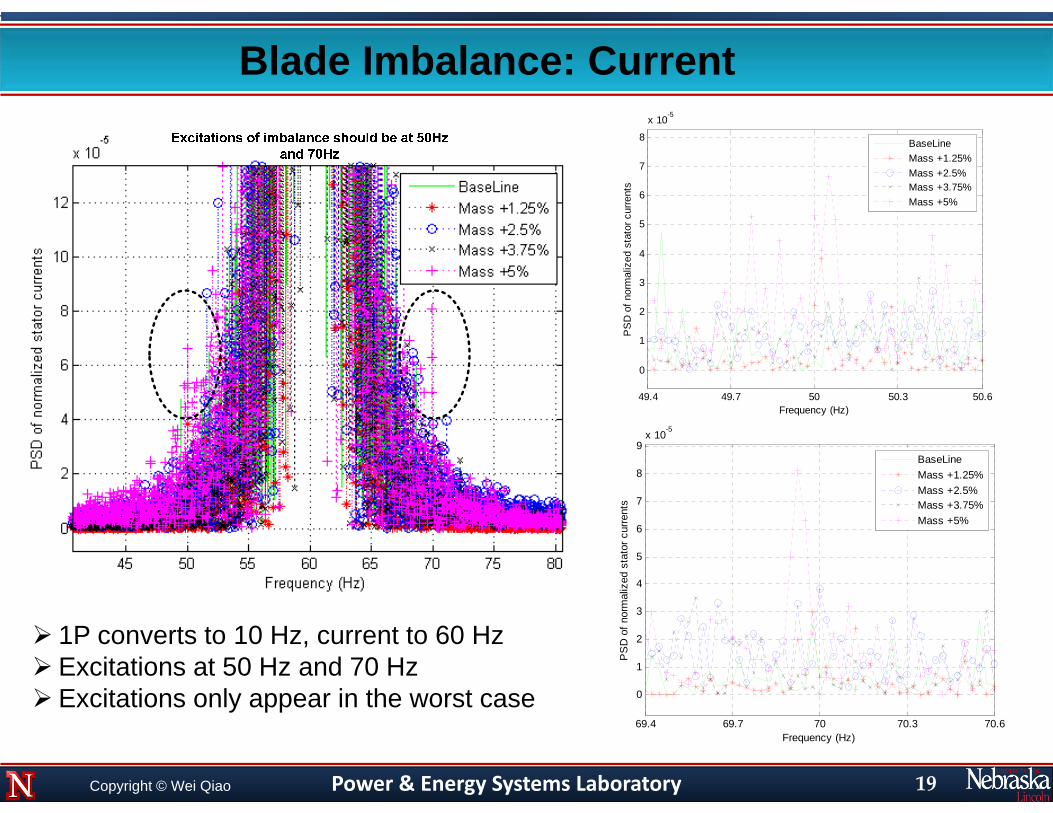
Blade Imbalance: Current
49.4 49.7 50 50.3 50.6
0
1
2
3
4
5
6
7
8
x 10-5
Frequency (Hz)
PS
D o
f nor
mal
ized
sta
tor c
urre
nts
BaseLineMass +1.25%Mass +2.5%Mass +3.75%Mass +5%
69.4 69.7 70 70.3 70.6
0
1
2
3
4
5
6
7
8
9x 10⁻⁵
Frequency (Hz)
PS
D o
f nor
mal
ized
sta
tor c
urre
nts
BaseLineMass +1.25%Mass +2.5%Mass +3.75%Mass +5%
1P converts to 10 Hz, current to 60 Hz Excitations at 50 Hz and 70 Hz Excitations only appear in the worst case
19
Power & Energy Systems LaboratoryCopyright © Wei Qiao
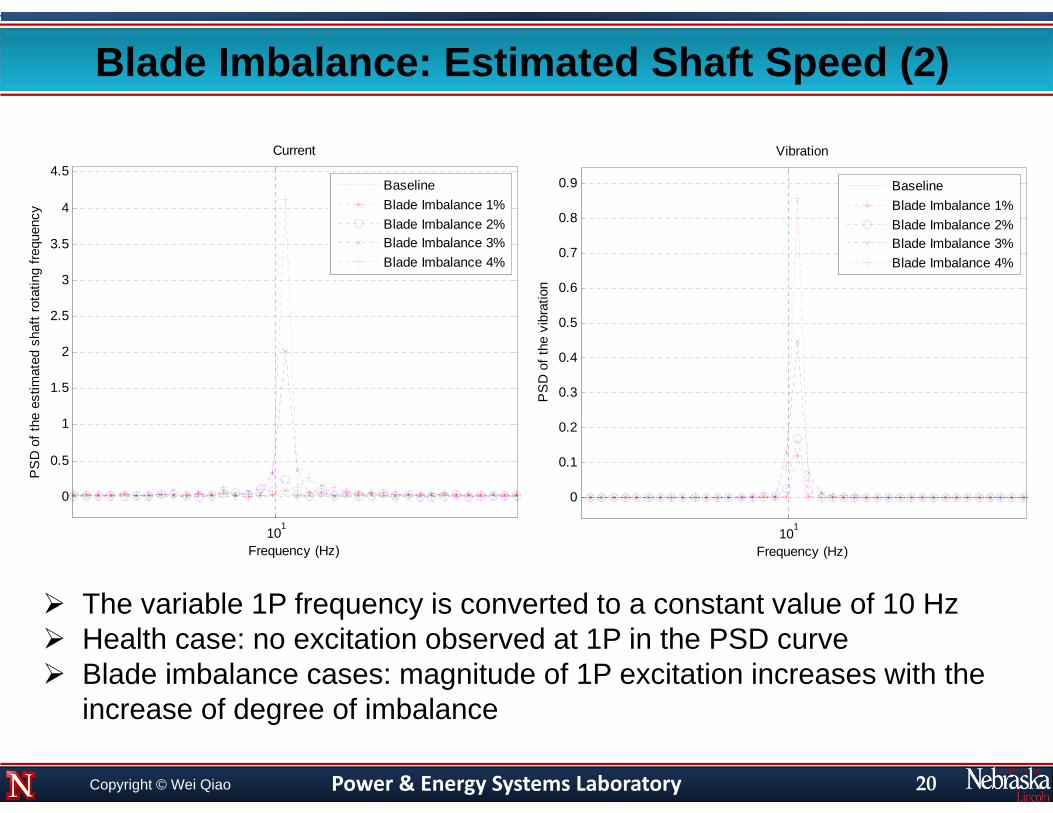
Blade Imbalance: Estimated Shaft Speed (2)
The variable 1P frequency is converted to a constant value of 10 Hz Health case: no excitation observed at 1P in the PSD curve Blade imbalance cases: magnitude of 1P excitation increases with the
increase of degree of imbalance
101
0
0.5
1
1.5
2
2.5
3
3.5
4
4.5Current
Frequency (Hz)
PS
D o
f the
est
imat
ed s
haft
rota
ting
frequ
ency
BaselineBlade Imbalance 1%Blade Imbalance 2%Blade Imbalance 3%Blade Imbalance 4%
101
0
0.1
0.2
0.3
0.4
0.5
0.6
0.7
0.8
0.9
Vibration
Frequency (Hz)P
SD
of t
he v
ibra
tion
BaselineBlade Imbalance 1%Blade Imbalance 2%Blade Imbalance 3%Blade Imbalance 4%
20
Power & Energy Systems LaboratoryCopyright © Wei Qiao
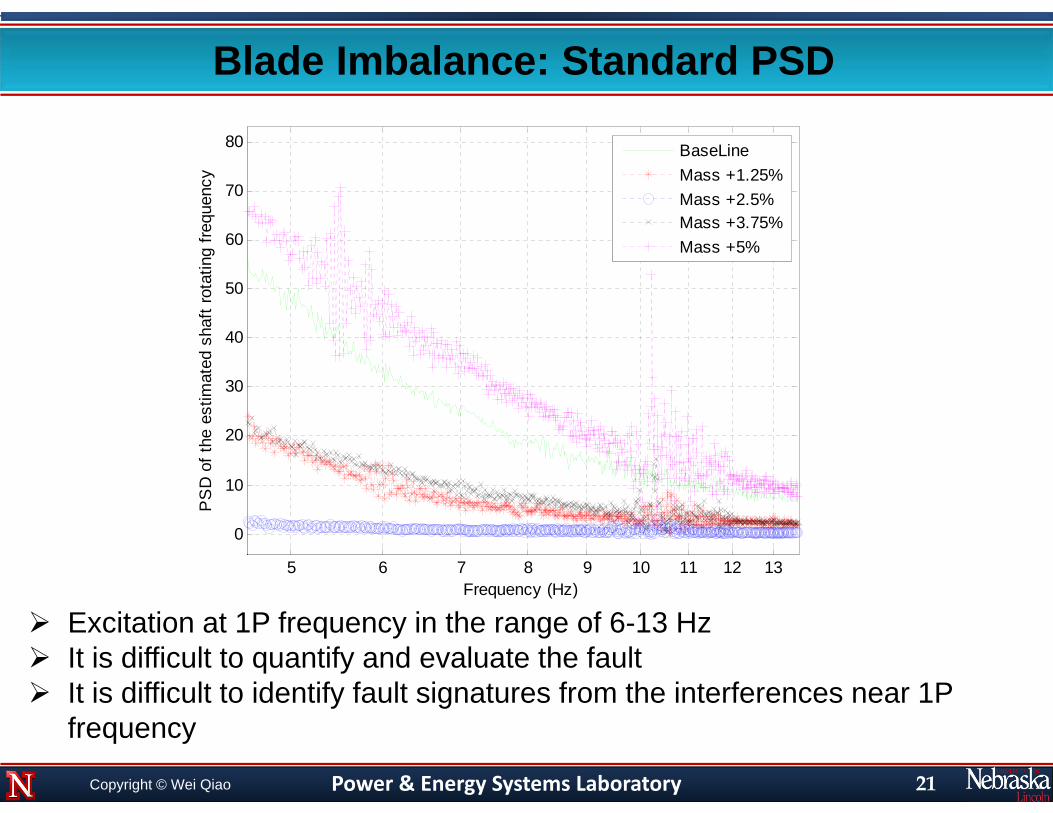
Blade Imbalance: Standard PSD
Excitation at 1P frequency in the range of 6-13 Hz It is difficult to quantify and evaluate the fault It is difficult to identify fault signatures from the interferences near 1P
frequency
5 6 7 8 9 10 11 12 13
0
10
20
30
40
50
60
70
80
Frequency (Hz)
PS
D o
f the
est
imat
ed s
haft
rota
ting
frequ
ency
BaseLineMass +1.25%Mass +2.5%Mass +3.75%Mass +5%
21
Power & Energy Systems LaboratoryCopyright © Wei Qiao
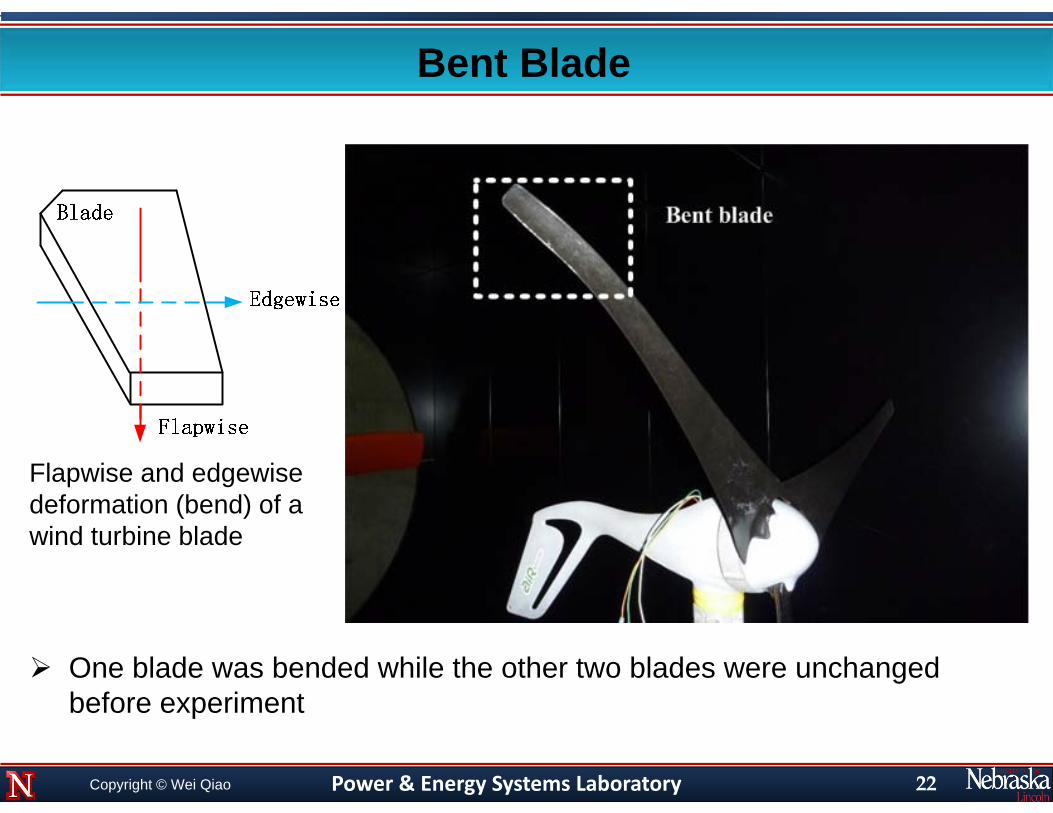
Bent Blade
One blade was bended while the other two blades were unchanged before experiment
Flapwise and edgewise deformation (bend) of a wind turbine blade
22
Power & Energy Systems LaboratoryCopyright © Wei Qiao
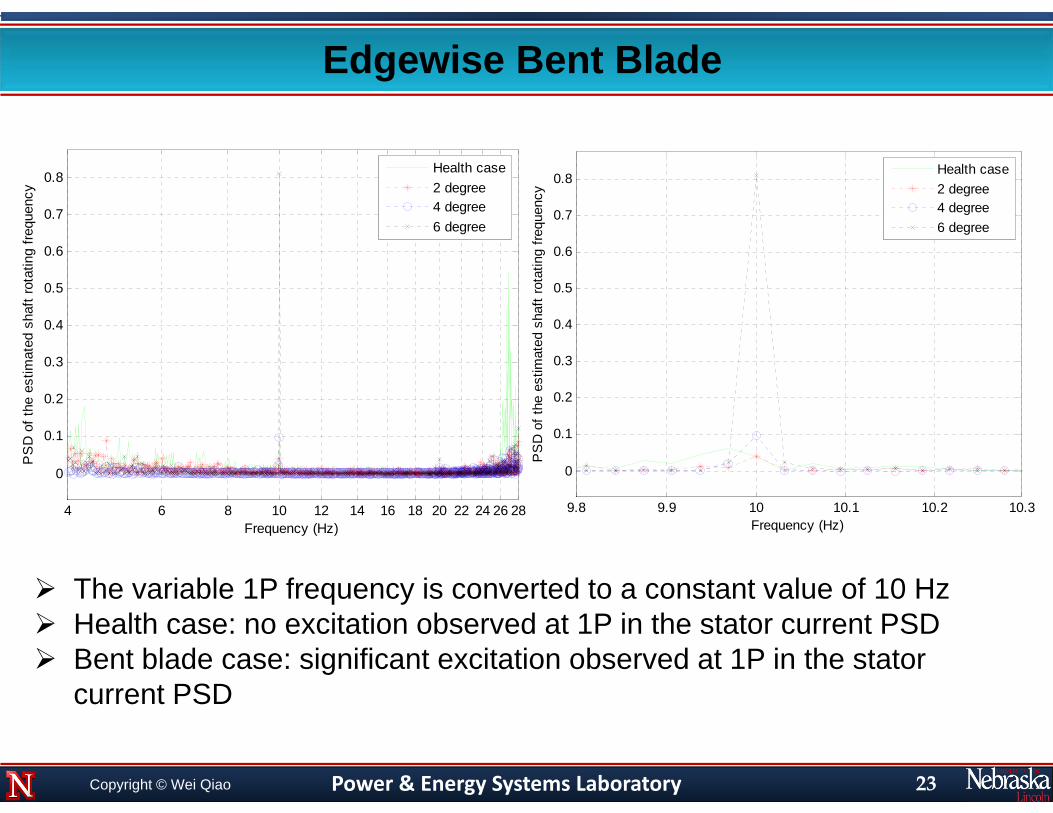
Edgewise Bent Blade
The variable 1P frequency is converted to a constant value of 10 Hz Health case: no excitation observed at 1P in the stator current PSD Bent blade case: significant excitation observed at 1P in the stator
current PSD
4 6 8 10 12 14 16 18 20 22 24 26 28
0
0.1
0.2
0.3
0.4
0.5
0.6
0.7
0.8
Frequency (Hz)
PS
D o
f the
est
imat
ed s
haft
rota
ting
frequ
ency
Health case2 degree4 degree6 degree
9.8 9.9 10 10.1 10.2 10.3
0
0.1
0.2
0.3
0.4
0.5
0.6
0.7
0.8
Frequency (Hz)P
SD
of t
he e
stim
ated
sha
ft ro
tatin
g fre
quen
cy
Health case2 degree4 degree6 degree
23
Power & Energy Systems LaboratoryCopyright © Wei Qiao
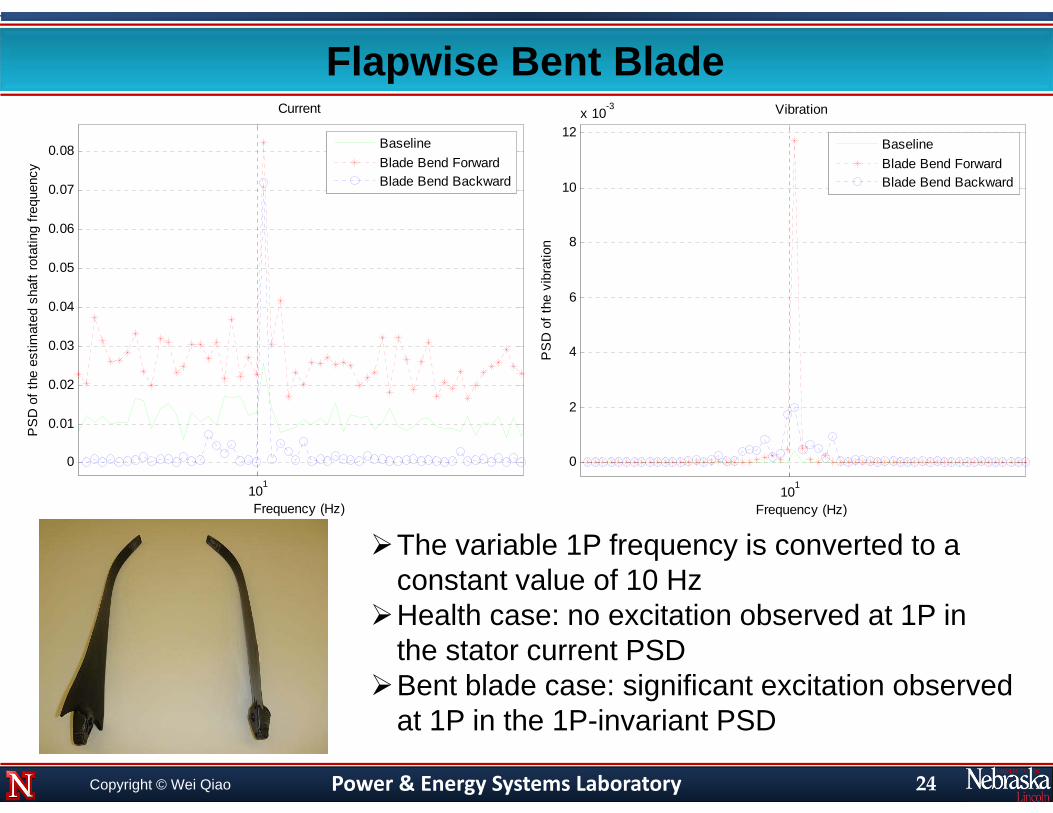
Flapwise Bent Blade
The variable 1P frequency is converted to a constant value of 10 Hz
Health case: no excitation observed at 1P in the stator current PSD
Bent blade case: significant excitation observed at 1P in the 1P-invariant PSD
101
0
0.01
0.02
0.03
0.04
0.05
0.06
0.07
0.08
Current
Frequency (Hz)
PS
D o
f the
est
imat
ed s
haft
rota
ting
frequ
ency
BaselineBlade Bend ForwardBlade Bend Backward
101
0
2
4
6
8
10
12x 10-3 Vibration
Frequency (Hz)
PS
D o
f the
vib
ratio
n
BaselineBlade Bend ForwardBlade Bend Backward
24
Power & Energy Systems LaboratoryCopyright © Wei Qiao
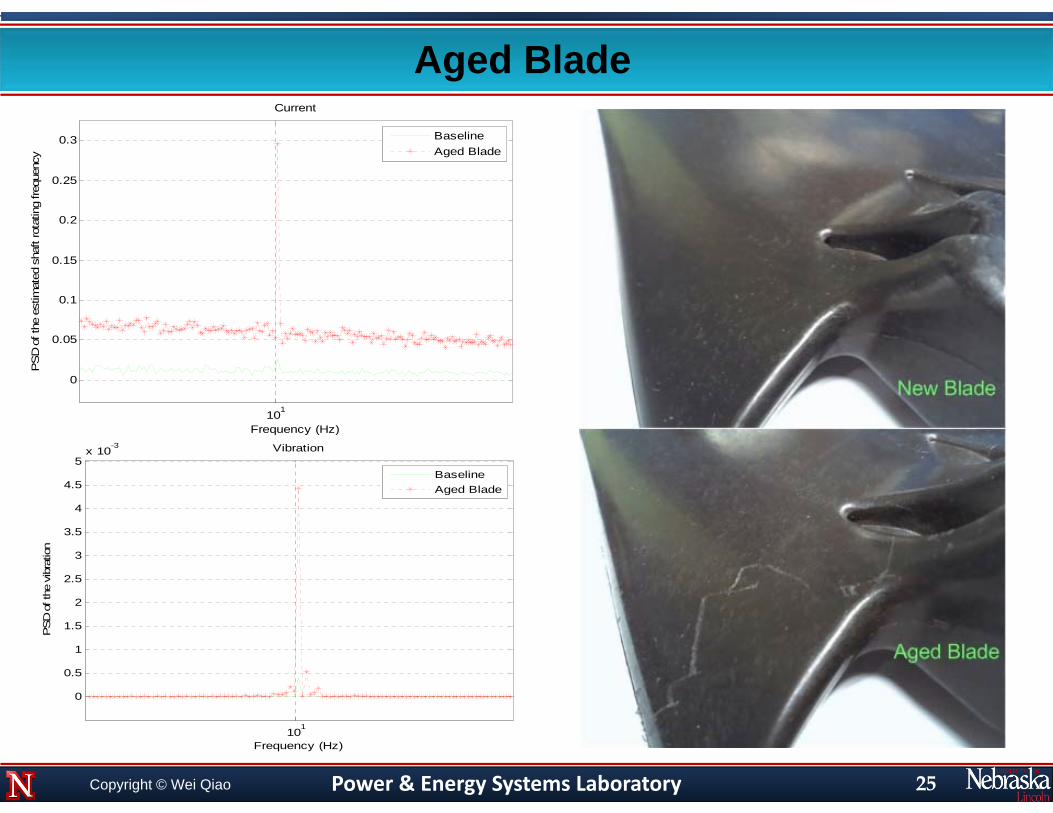
Aged Blade
101
0
0.05
0.1
0.15
0.2
0.25
0.3
Current
Frequency (Hz)
PS
D o
f the
est
imat
ed s
haft
rota
ting
frequ
ency
BaselineAged Blade
101
0
0.5
1
1.5
2
2.5
3
3.5
4
4.5
5x 10
-3 Vibration
Frequency (Hz)
PSD o
f the
vib
ratio
n
BaselineAged Blade
25
Power & Energy Systems LaboratoryCopyright © Wei Qiao
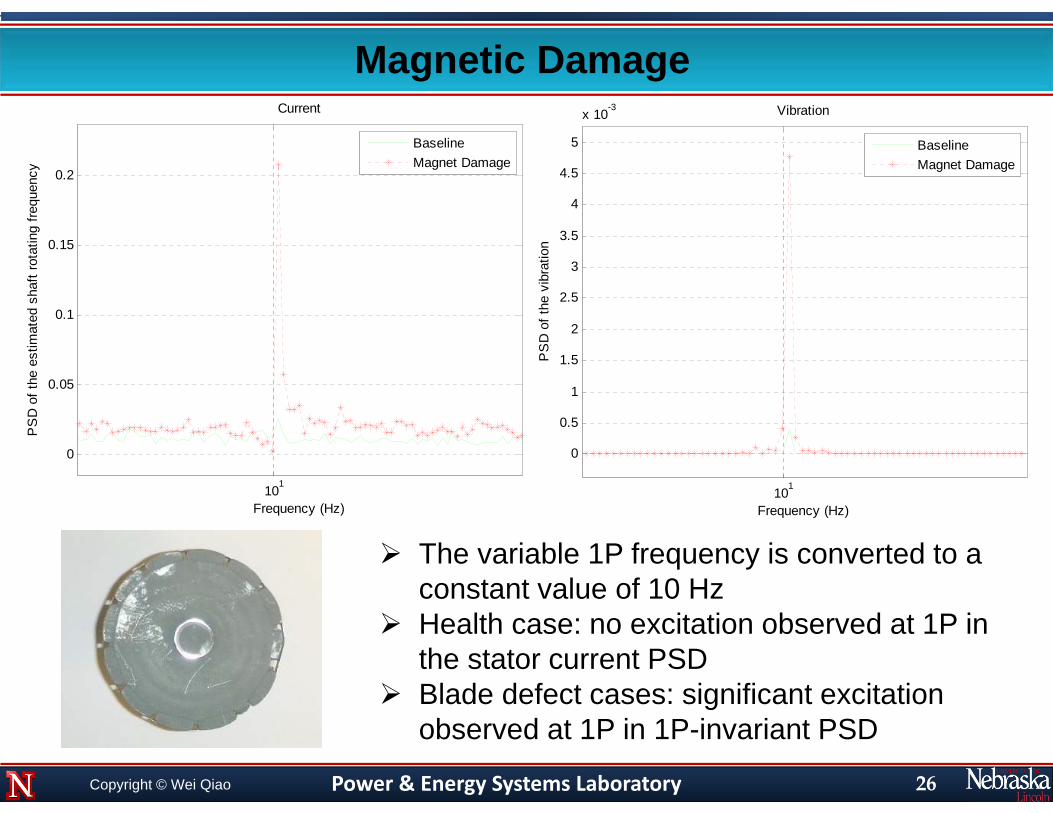
Magnetic Damage
The variable 1P frequency is converted to a constant value of 10 Hz
Health case: no excitation observed at 1P in the stator current PSD
Blade defect cases: significant excitation observed at 1P in 1P-invariant PSD
101
0
0.05
0.1
0.15
0.2
Current
Frequency (Hz)
PS
D o
f the
est
imat
ed s
haft
rota
ting
frequ
ency
BaselineMagnet Damage
101
0
0.5
1
1.5
2
2.5
3
3.5
4
4.5
5
x 10-3 Vibration
Frequency (Hz)
PS
D o
f the
vib
ratio
n
BaselineMagnet Damage
26
Power & Energy Systems LaboratoryCopyright © Wei Qiao
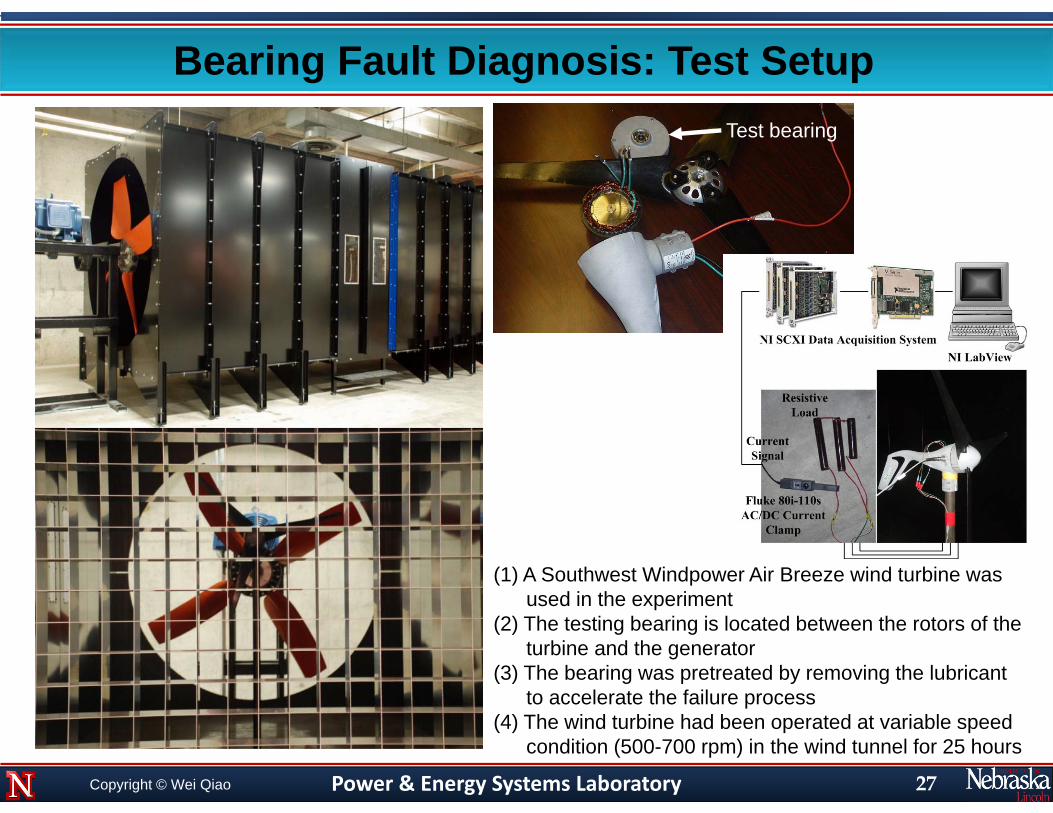
(1) A Southwest Windpower Air Breeze wind turbine was used in the experiment
(2) The testing bearing is located between the rotors of the turbine and the generator
(3) The bearing was pretreated by removing the lubricant to accelerate the failure process
(4) The wind turbine had been operated at variable speed condition (500-700 rpm) in the wind tunnel for 25 hours
Test bearing
Bearing Fault Diagnosis: Test Setup
27
Power & Energy Systems LaboratoryCopyright © Wei Qiao
Broken cage
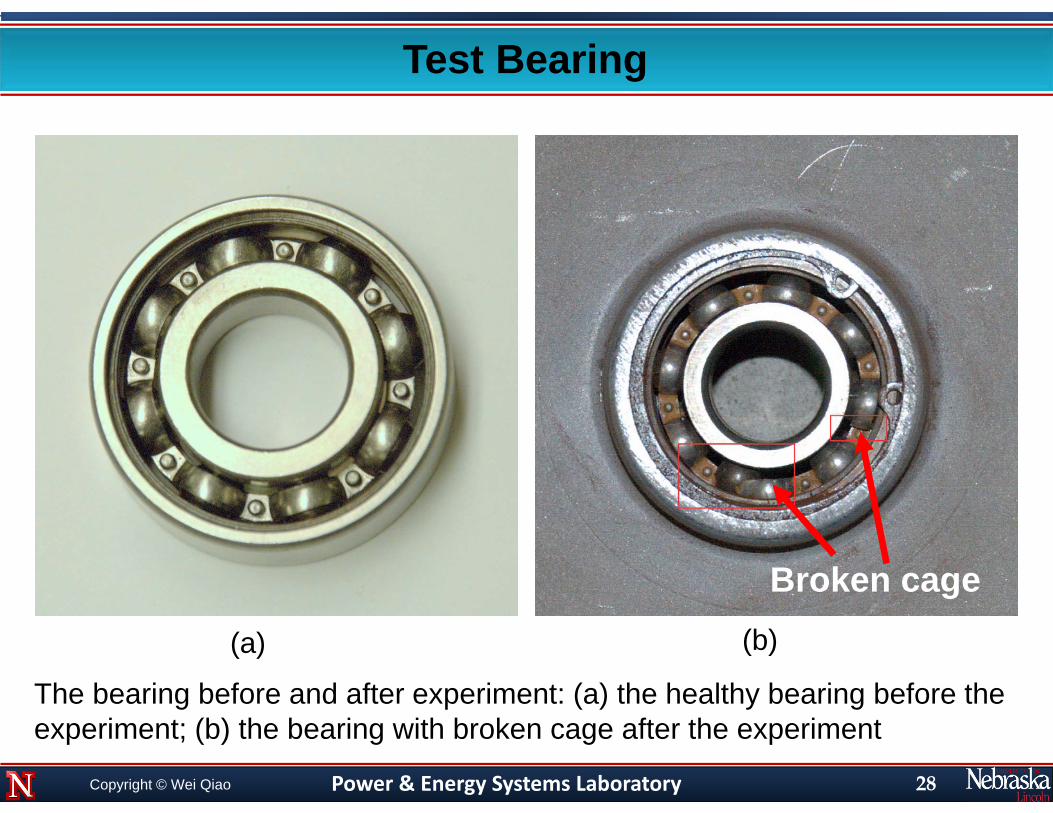
The bearing before and after experiment: (a) the healthy bearing before the experiment; (b) the bearing with broken cage after the experiment
(a) (b)
Test Bearing
28
Power & Energy Systems LaboratoryCopyright © Wei Qiao
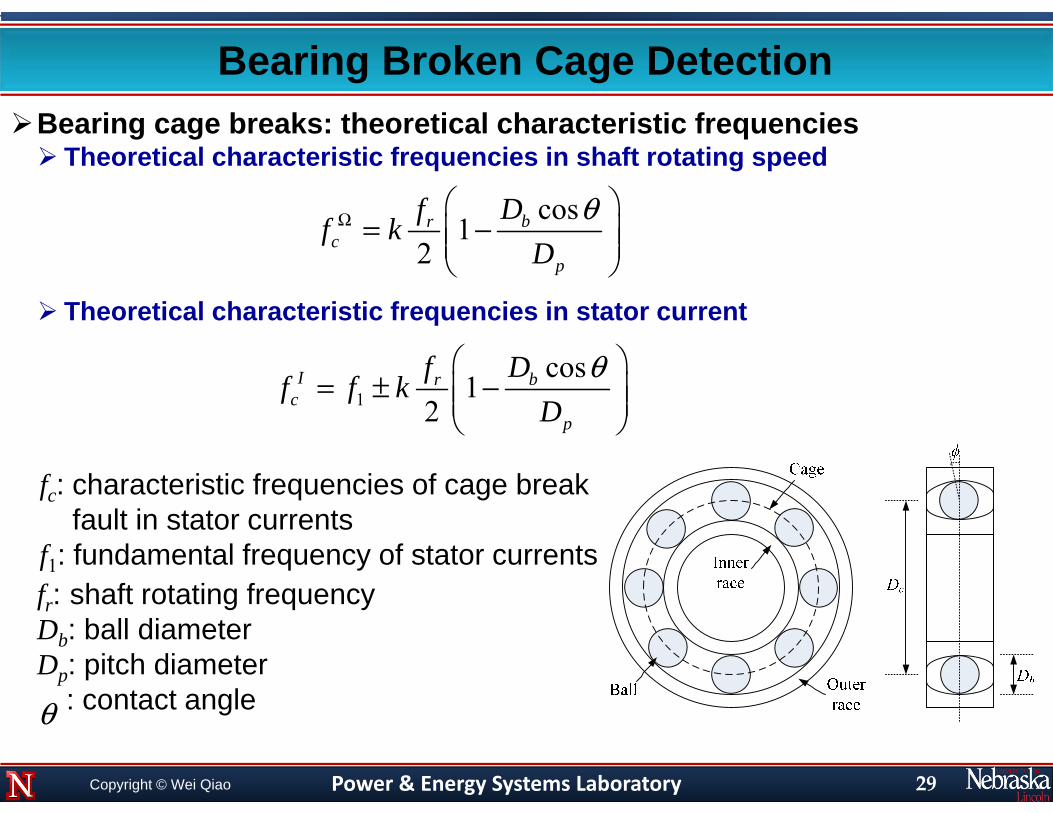
Bearing Broken Cage DetectionBearing cage breaks: theoretical characteristic frequencies Theoretical characteristic frequencies in shaft rotating speed
Theoretical characteristic frequencies in stator current
cos1
2br
cp
Dff k
DθΩ
= −
fc: characteristic frequencies of cage break fault in stator currents
f1: fundamental frequency of stator currents
θ
fr: shaft rotating frequencyDb: ball diameterDp: pitch diameter
: contact angle
1cos
12
I brc
p
Dff f k
Dθ
= ± −
29
Power & Energy Systems LaboratoryCopyright © Wei Qiao
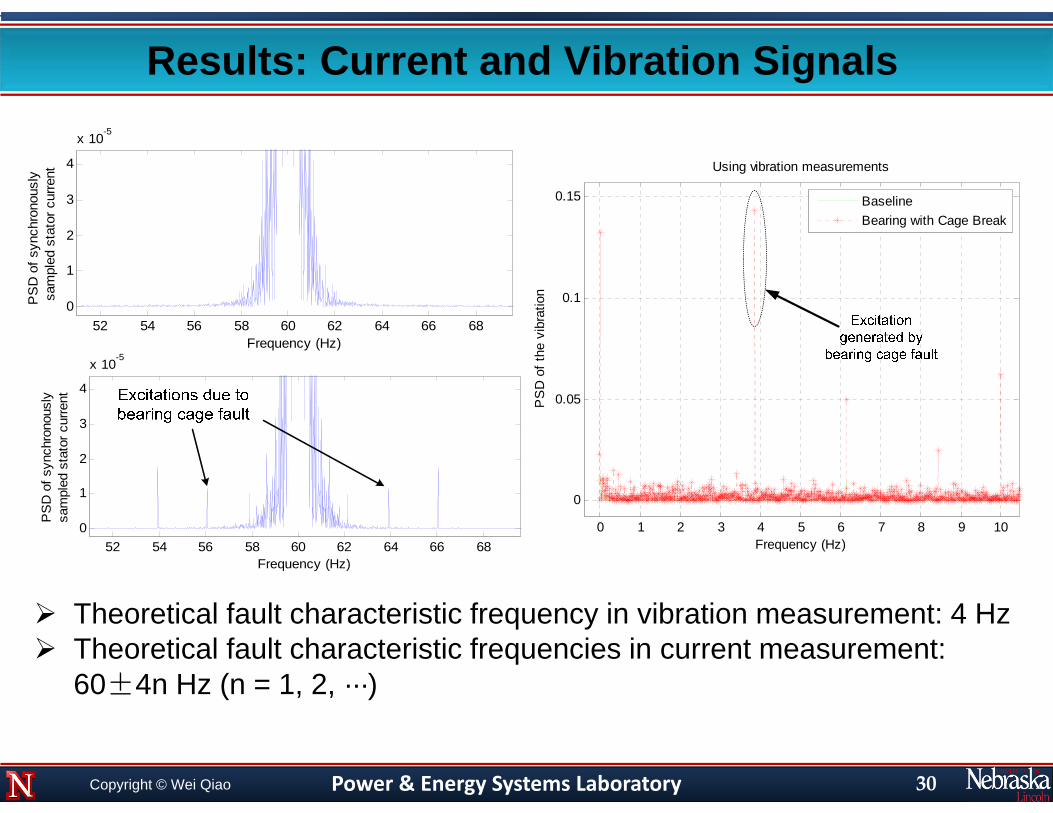
Results: Current and Vibration Signals
Theoretical fault characteristic frequency in vibration measurement: 4 Hz Theoretical fault characteristic frequencies in current measurement:
60±4n Hz (n = 1, 2, ···)
0 1 2 3 4 5 6 7 8 9 10
0
0.05
0.1
0.15
Using vibration measurements
Frequency (Hz)P
SD
of t
he v
ibra
tion
BaselineBearing with Cage Break
30
52 54 56 58 60 62 64 66 680
1
2
3
4
x 10-5
Frequency (Hz)
PS
D o
f syn
chro
nous
ly
sam
pled
sta
tor c
urre
nt
52 54 56 58 60 62 64 66 680
1
2
3
4
x 10-5
Frequency (Hz)
PS
D o
f syn
chro
nous
lysa
mpl
ed s
tato
r cur
rent
Power & Energy Systems LaboratoryCopyright © Wei Qiao
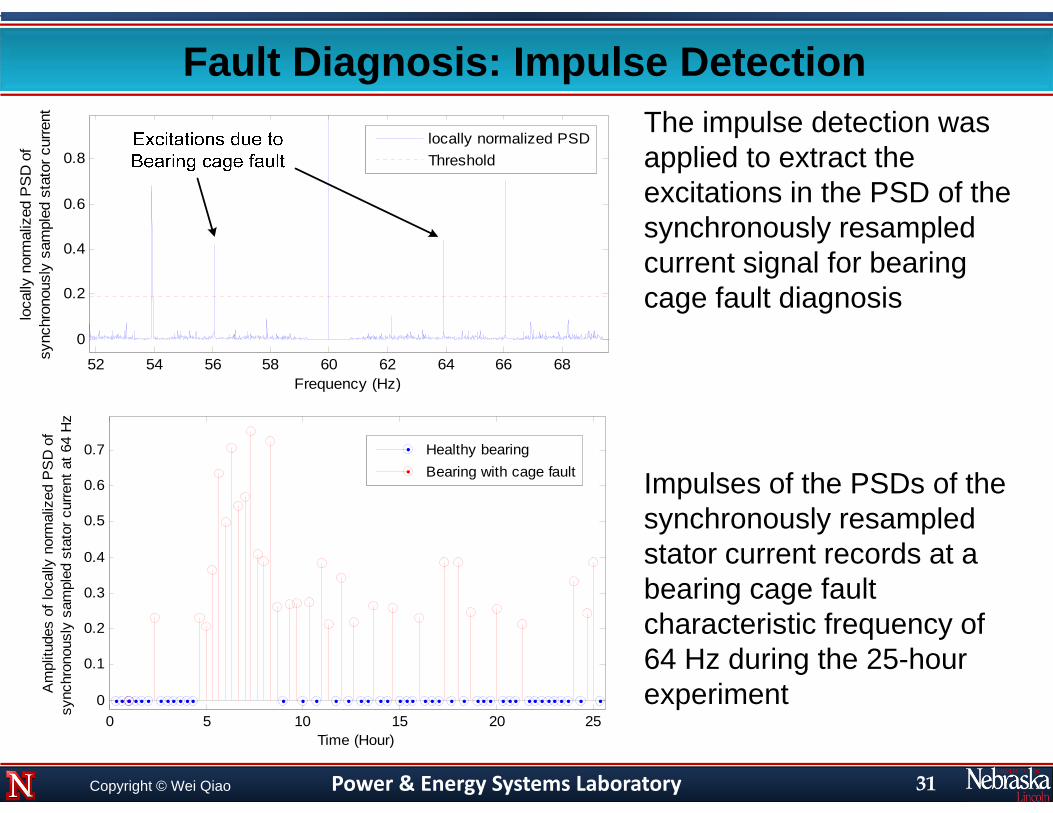
Fault Diagnosis: Impulse DetectionThe impulse detection was applied to extract the excitations in the PSD of the synchronously resampled current signal for bearing cage fault diagnosis
31
52 54 56 58 60 62 64 66 68
0
0.2
0.4
0.6
0.8
Frequency (Hz)
loca
lly n
orm
aliz
ed P
SD
of
sync
hron
ousl
y sa
mpl
ed s
tato
r cur
rent
locally normalized PSDThreshold
0 5 10 15 20 250
0.1
0.2
0.3
0.4
0.5
0.6
0.7
Time (Hour)
Am
plitu
des
of lo
cally
nor
mal
ized
PS
D o
fsy
nchr
onou
sly
sam
pled
sta
tor c
urre
nt a
t 64
Hz
Healthy bearingBearing with cage fault Impulses of the PSDs of the
synchronously resampled stator current records at a bearing cage fault characteristic frequency of 64 Hz during the 25-hour experiment
Power & Energy Systems LaboratoryCopyright © Wei Qiao
Gearbox: Testing Facilities and Equipment
32
Power & Energy Systems Laboratory
28 30 32 34 36 38 40 420
0.5
1
1.5
2
2.5
3x 10
-3
Frequency (Hz)
Pow
er o
f the
sta
tor c
urre
nt
fs-f3
fs-f1 fs+f1fs+f3
fs-f2
fs fs+f2
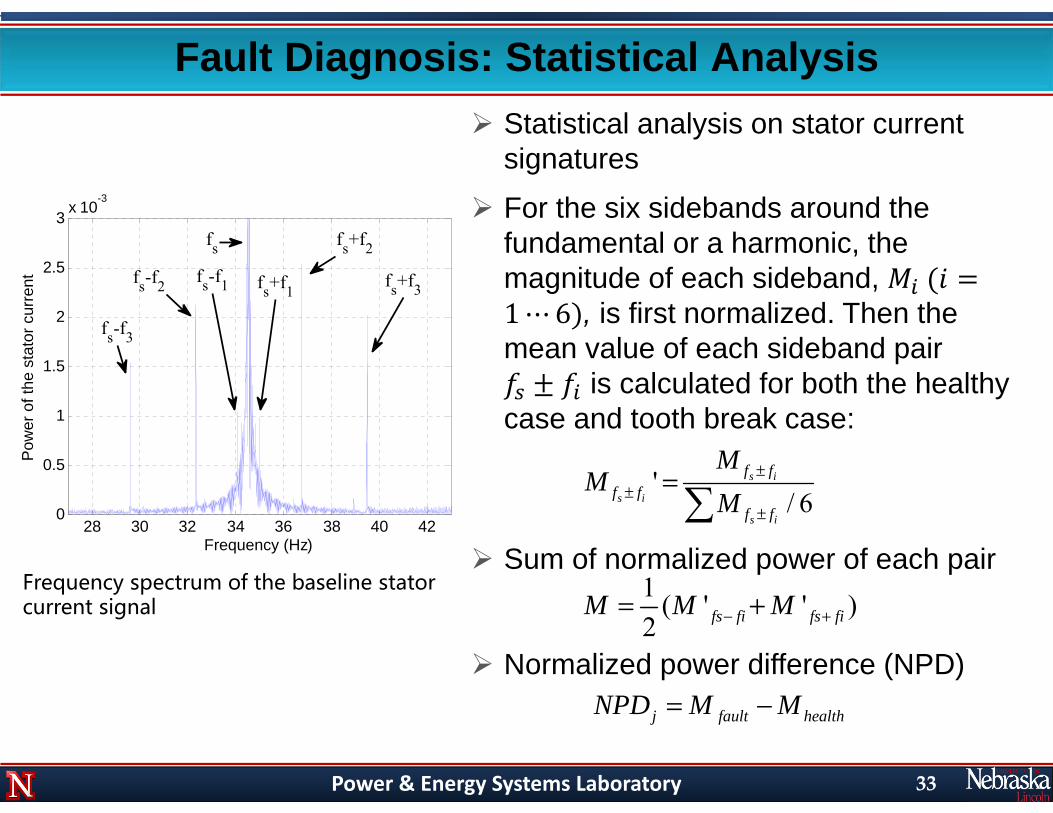
Fault Diagnosis: Statistical Analysis Statistical analysis on stator current
signatures
For the six sidebands around the fundamental or a harmonic, the magnitude of each sideband, 1⋯6 , is first normalized. Then the mean value of each sideband pair
is calculated for both the healthy case and tooth break case:
Sum of normalized power of each pair
Normalized power difference (NPD)
1 ( ' ' )2 fs fi fs fiM M M− += +
j fault healthNPD M M= −
Frequency spectrum of the baseline stator current signal
'/ 6
s i
s i
s i
f ff f
f f
MM
M±
±±
=
33
Power & Energy Systems Laboratory
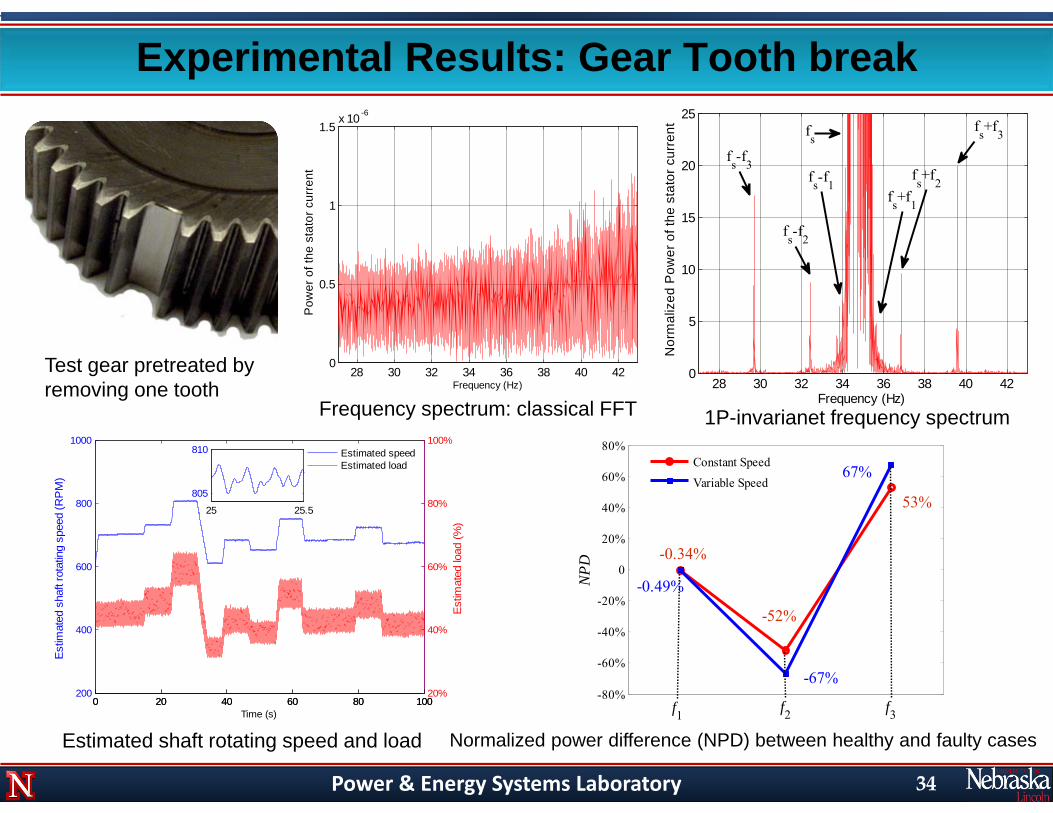
Frequency spectrum: classical FFT
Estimated shaft rotating speed and load
Experimental Results: Gear Tooth break
28 30 32 34 36 38 40 420
0.5
1
1.5x 10 -6
Frequency (Hz)
Pow
er o
f the
sta
tor c
urre
nt
28 30 32 34 36 38 40 420
5
10
15
20
25
Frequency (Hz)
Nor
mal
ized
Pow
er o
f the
sta
tor c
urre
nt
fs-f3
fs-f2
fs-f1fs+f2
fs+f3fs
fs+f1
1P-invarianet frequency spectrum
Normalized power difference (NPD) between healthy and faulty cases
0 20 40 60 80 100200
400
600
800
1000
Estim
ated
sha
ft ro
tatin
g sp
eed
(RP
M)
Time (s)
0 20 40 60 80 10020%
40%
60%
80%
100%
Estim
ated
load
(%)
Estimated speedEstimated load
25 25.5
805
810
-80%
-60%
-40%
-20%
0
20%
40%
60%
80%
NPD
Constant Speed
Variable Speed
f3f2
-52%
53%
-0.34%
-67%
67%
f1
-0.49%
Test gear pretreated by removing one tooth
34
Power & Energy Systems Laboratory
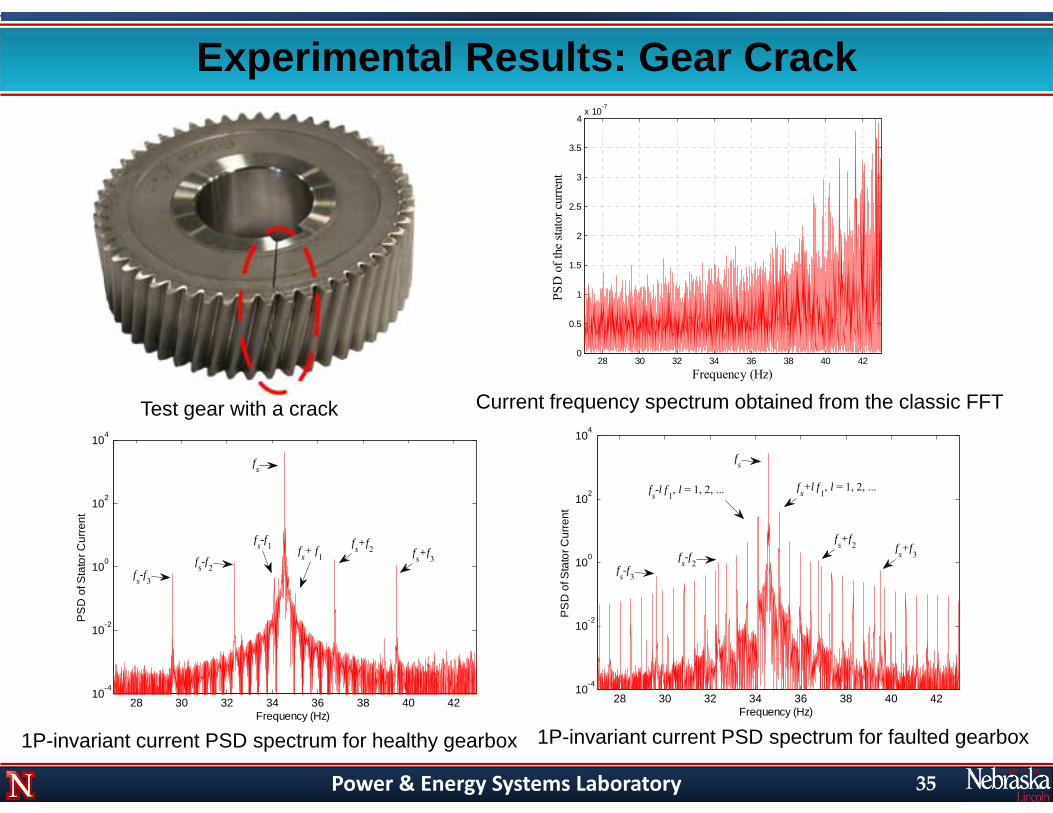
Test gear with a crack
1P-invariant current PSD spectrum for healthy gearbox
Experimental Results: Gear Crack
Current frequency spectrum obtained from the classic FFT
1P-invariant current PSD spectrum for faulted gearbox
28 30 32 34 36 38 40 420
0.5
1
1.5
2
2.5
3
3.5
4x 10⁻⁷
Frequency (Hz)
PSD
of t
he st
ator
cur
rent
28 30 32 34 36 38 40 4210-4
10-2
100
102
104
Frequency (Hz)
PS
D o
f Sta
tor C
urre
nt
fs
fs-f2fs-f3
fs-f1 fs+ f1
fs+f2 fs+f
3
28 30 32 34 36 38 40 4210-4
10-2
100
102
104
Frequency (Hz)
PS
D o
f Sta
tor C
urre
nt
fs-l f
1, l = 1, 2, ...
fs
fs+l f
1, l = 1, 2, ...
fs-f
3
fs-f
2
fs+f
2 fs+f
3
35
Power & Energy Systems LaboratoryCopyright © Wei Qiao
Benefits Proposed methods are nonintrusive: only using generator current
measurements, which are already being used in wind turbine control and protection systems
Proposed methods can be easily integrated into existing wind turbine condition monitoring, control and protection systems
Condition monitoring and fault diagnosis can be implemented remotely from the wind turbines being monitored
Proposed methods provide an alternative to sensor-based condition monitoring and fault diagnosis : reduce cost, size and hardware complexity
Proposed methods can be combined with sensor-based methodsWhen there are problems with sensors, the proposed methods will ensure proper CM for the wind turbine: improve mechanical robustness and reliability
Proposed methods offer an effective means to achieve condition-based smart maintenance for wind turbines
36
Power & Energy Systems LaboratoryCopyright © Wei Qiao
Acknowledgement
37
This work was supported in part by the U.S.Department of Energy, National Science Foundation,Nebraska Public Power District through NebraskaCenter for Energy Sciences Research, and GE GlobalResearch.

Power & Energy Systems LaboratoryCopyright © Wei Qiao 38
Thank you!
Recommended