Q3 2012 ResultsInvestor Conference Call
October 30, 2012 / Marijn Dekkers, CEO
DisclaimerThis presentation may contain forward-looking statements based on currentassumptions and forecasts made by Bayer Group or subgroup management.
Various known and unknown risks, uncertainties and other factors could lead tomaterial differences between the actual future results, financial situation,development or performance of the company and the estimates given here.These factors include those discussed in Bayer’s public reports which areavailable on the Bayer website at www.bayer.com.
The company assumes no liability whatsoever to update these forward-lookingstatements or to conform them to future events or developments.
• Investor Handout • Q3 2012Page 2
• Investor Handout • Q3 2012Page 3
3rd Quarter 2012 –On Track for a Successful 2012
Upward trend at HealthCare and CropScience continued
Reported earnings impacted by high special charges
Innovation pipeline with significant progress
Further strategic progress with the acquisitions of Schiff, Teva’sUS Animal Health business and AgraQuest
Financial Outlook 2012 reiterated: Core EPS expected to increase by about 10%
• Investor Handout • Q3 2012Page 4
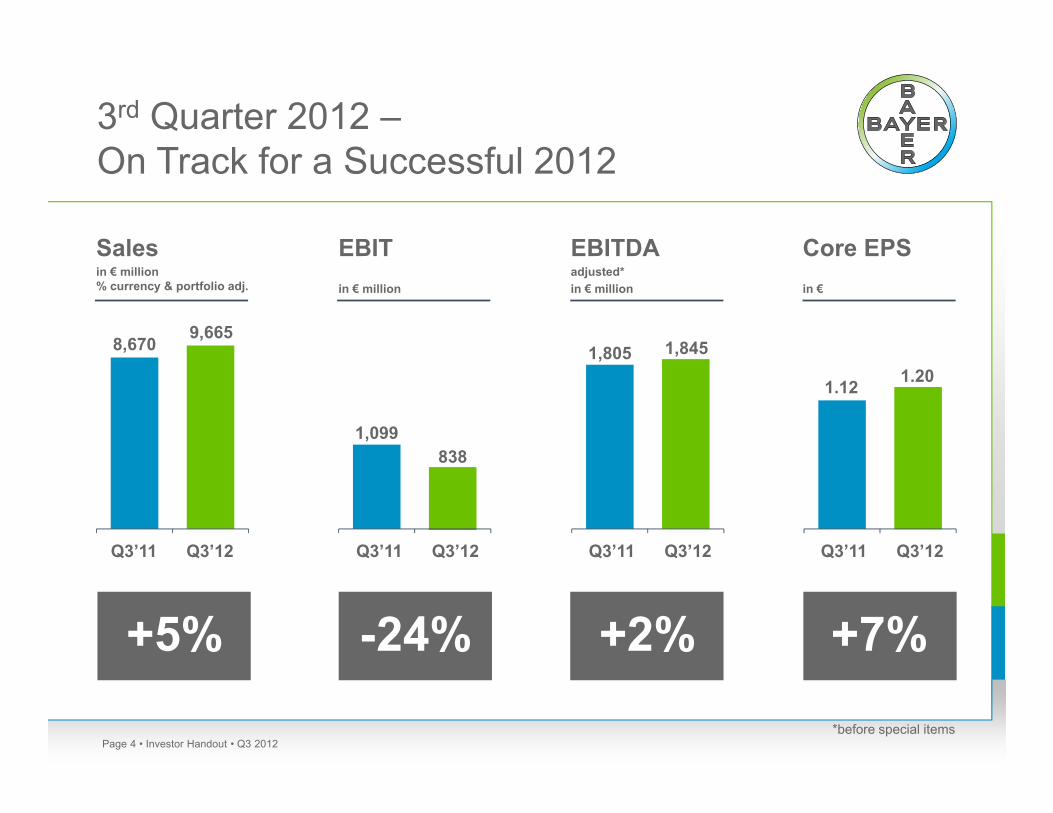
EBITin € million
-24%
8381,099
Salesin € million% currency & portfolio adj.
+5%
9,6658,670
EBITDAadjusted*in € million
+2%
1,8451,805
Core EPSin €
+7%
1.201.12
*before special items
Q3’12Q3’11 Q3’12Q3’11 Q3’12Q3’11 Q3’12Q3’11
3rd Quarter 2012 –On Track for a Successful 2012
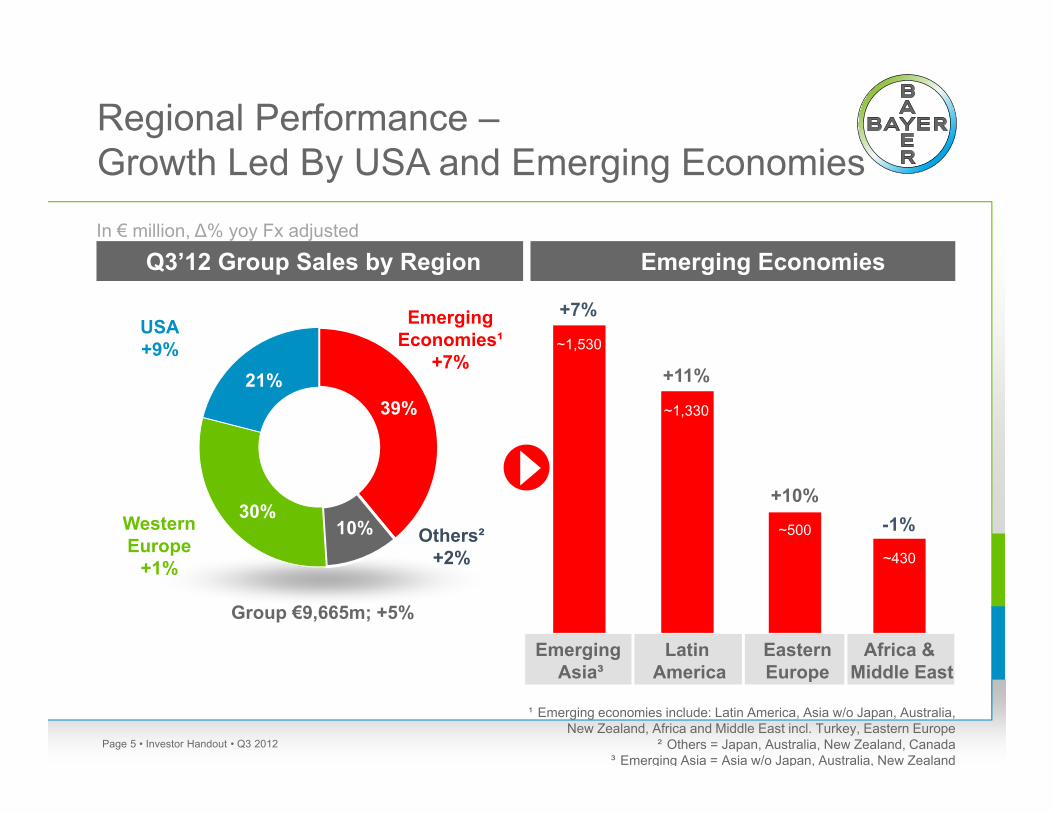
Regional Performance –Growth Led By USA and Emerging Economies
• Investor Handout • Q3 2012Page 5
Western Europe
+1%
~1,330
~1,530
+11%
~430
-1%~500
+10%
¹ Emerging economies include: Latin America, Asia w/o Japan, Australia,New Zealand, Africa and Middle East incl. Turkey, Eastern Europe
² Others = Japan, Australia, New Zealand, Canada³ Emerging Asia = Asia w/o Japan, Australia, New Zealand
Q3’12 Group Sales by Region Emerging EconomiesIn € million, ∆% yoy Fx adjusted
Group €9,665m; +5%
Emerging Asia³
LatinAmerica
EasternEurope
Africa & Middle East
EmergingEconomies¹
+7%
Others²+2%
USA+9%
39%
30%
21%
10%
+7%
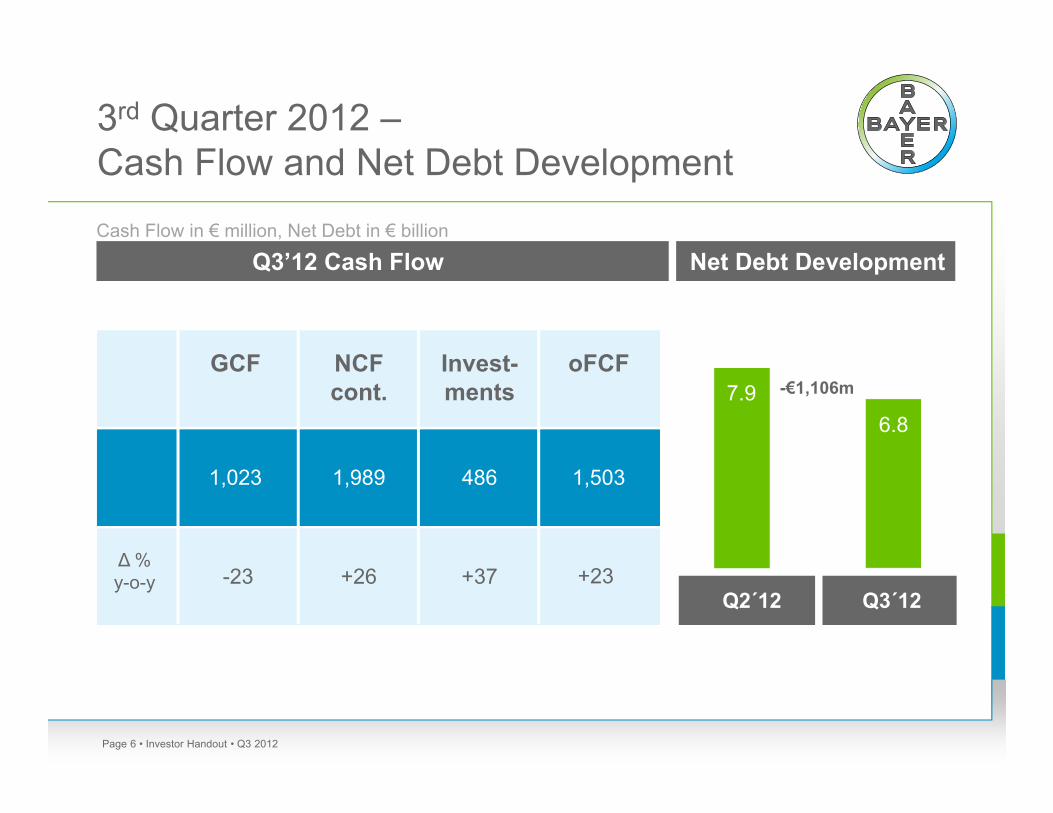
3rd Quarter 2012 –Cash Flow and Net Debt Development
• Investor Handout • Q3 2012Page 6
-€1,106m
6.8
GCF oFCF
1,023
Invest-ments
486 1,503
∆ %y-o-y -23 +23
NCFcont.
1,989
+26 +37Q2´12 Q3´12
7.9
Q3’12 Cash Flow Net Debt DevelopmentCash Flow in € million, Net Debt in € billion
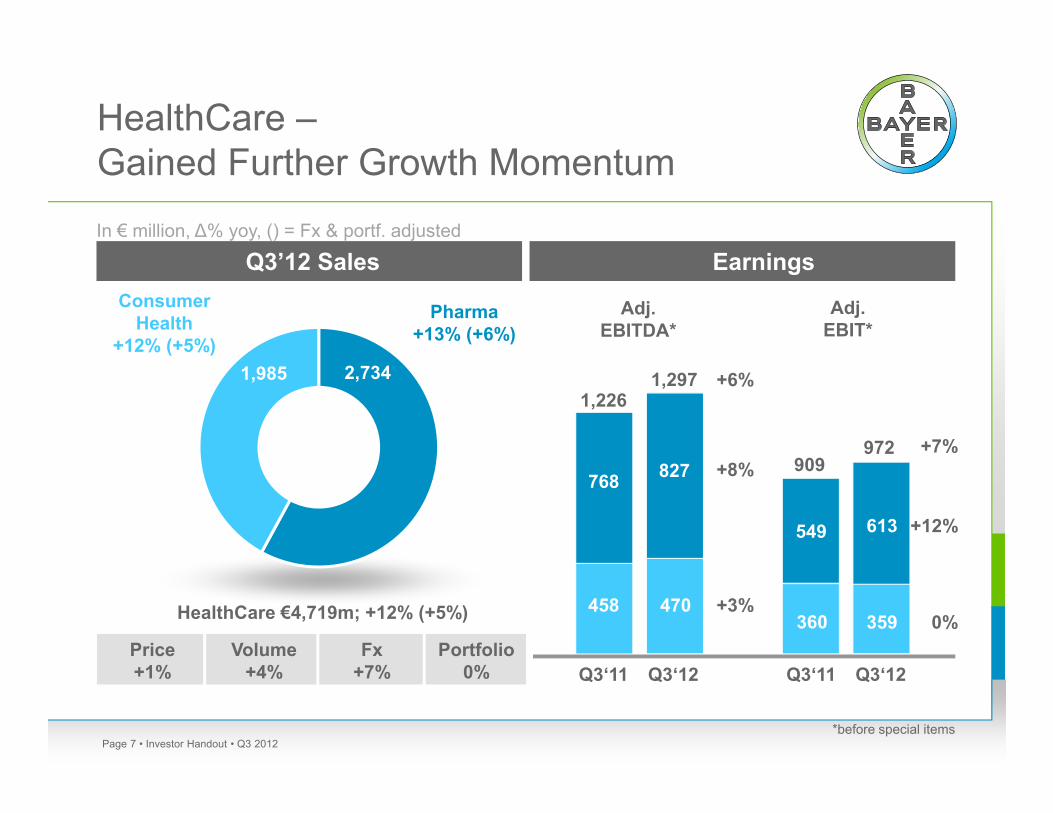
HealthCare –Gained Further Growth Momentum
• Investor Handout • Q3 2012Page 7*before special items
Q3’12 Sales Earnings
Pharma+13% (+6%)
ConsumerHealth
+12% (+5%)36%
HealthCare €4,719m; +12% (+5%)
2,7341,985
Price+1%
Volume+4%
Fx+7%
Portfolio0%
In € million, ∆% yoy, () = Fx & portf. adjusted
Q3‘11 Q3‘12 Q3‘11 Q3‘12
768 827
458 470
+8%
+3%
1,2261,297 +6%
360 0%
909972 +7%
549
359
Adj.EBITDA*
Adj.EBIT*
613 +12%
• Investor Handout • Q3 2012Page 8
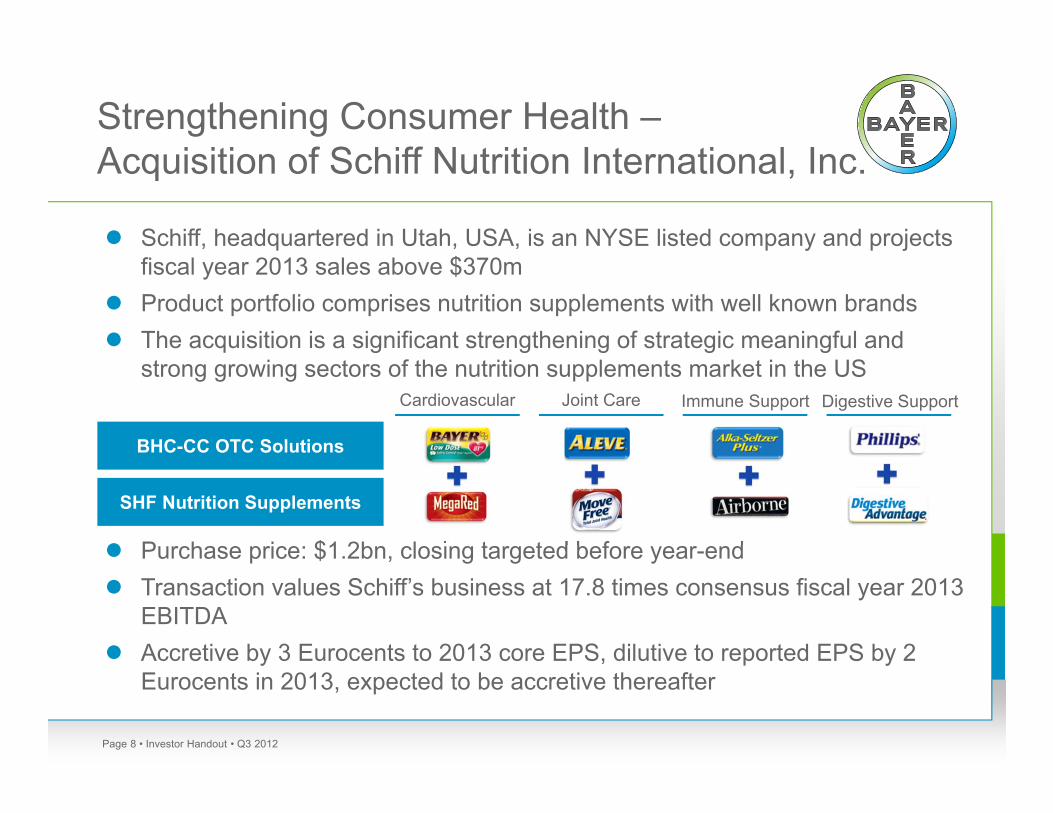
Strengthening Consumer Health –Acquisition of Schiff Nutrition International, Inc.
Schiff, headquartered in Utah, USA, is an NYSE listed company and projects fiscal year 2013 sales above $370m
Product portfolio comprises nutrition supplements with well known brands The acquisition is a significant strengthening of strategic meaningful and
strong growing sectors of the nutrition supplements market in the US
Purchase price: $1.2bn, closing targeted before year-end Transaction values Schiff’s business at 17.8 times consensus fiscal year 2013
EBITDA Accretive by 3 Eurocents to 2013 core EPS, dilutive to reported EPS by 2
Eurocents in 2013, expected to be accretive thereafter
BHC-CC OTC Solutions
SHF Nutrition Supplements
Cardiovascular Joint Care Immune Support Digestive Support
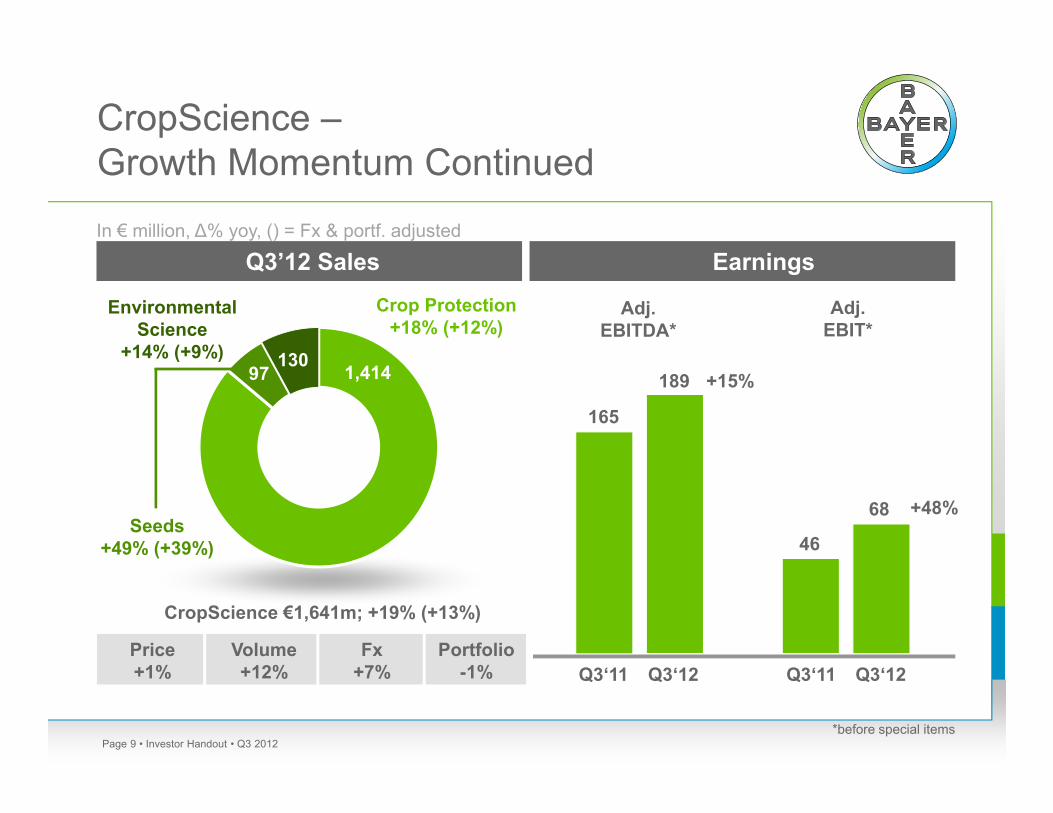
CropScience –Growth Momentum Continued
• Investor Handout • Q3 2012Page 9
Crop Protection+18% (+12%)
EnvironmentalScience
+14% (+9%)
*before special items
Seeds+49% (+39%)
Q3’12 Sales Earnings In € million, ∆% yoy, () = Fx & portf. adjusted
CropScience €1,641m; +19% (+13%)
Price+1%
Volume+12%
Fx+7%
Portfolio-1%
1,414
Q3‘11 Q3‘12 Q3‘11 Q3‘12
165
189 +15%
46
68 +48%
Adj.EBITDA*
Adj.EBIT*
13097
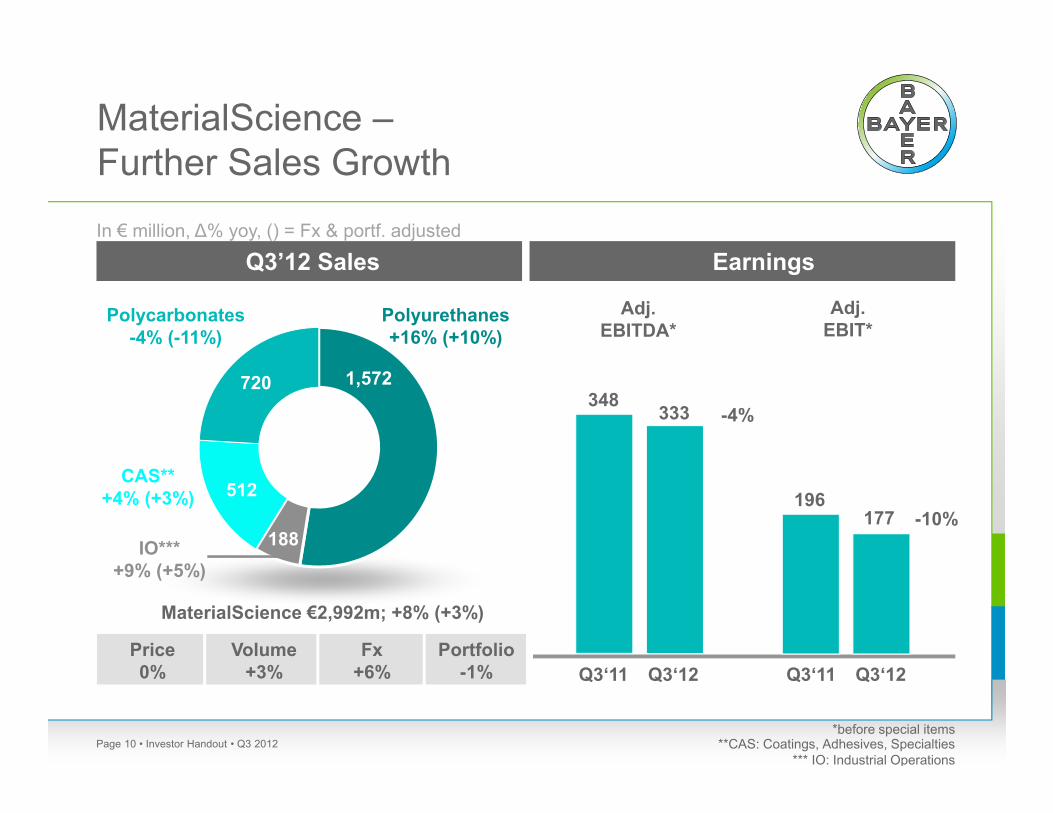
MaterialScience –Further Sales Growth
• Investor Handout • Q3 2012Page 10 **CAS: Coatings, Adhesives, Specialties*** IO: Industrial Operations
Polyurethanes+16% (+10%)
Polycarbonates-4% (-11%)
CAS**+4% (+3%)
Q3’12 Sales Earnings In € million, ∆% yoy, () = Fx & portf. adjusted
*before special items
MaterialScience €2,992m; +8% (+3%)
Price0%
Volume+3%
Fx+6%
Portfolio-1%
1,572720
IO***+9% (+5%)
Q3‘11 Q3‘12 Q3‘11 Q3‘12
Adj.EBITDA*
Adj.EBIT*
348333 -4%
196177 -10%
512
188
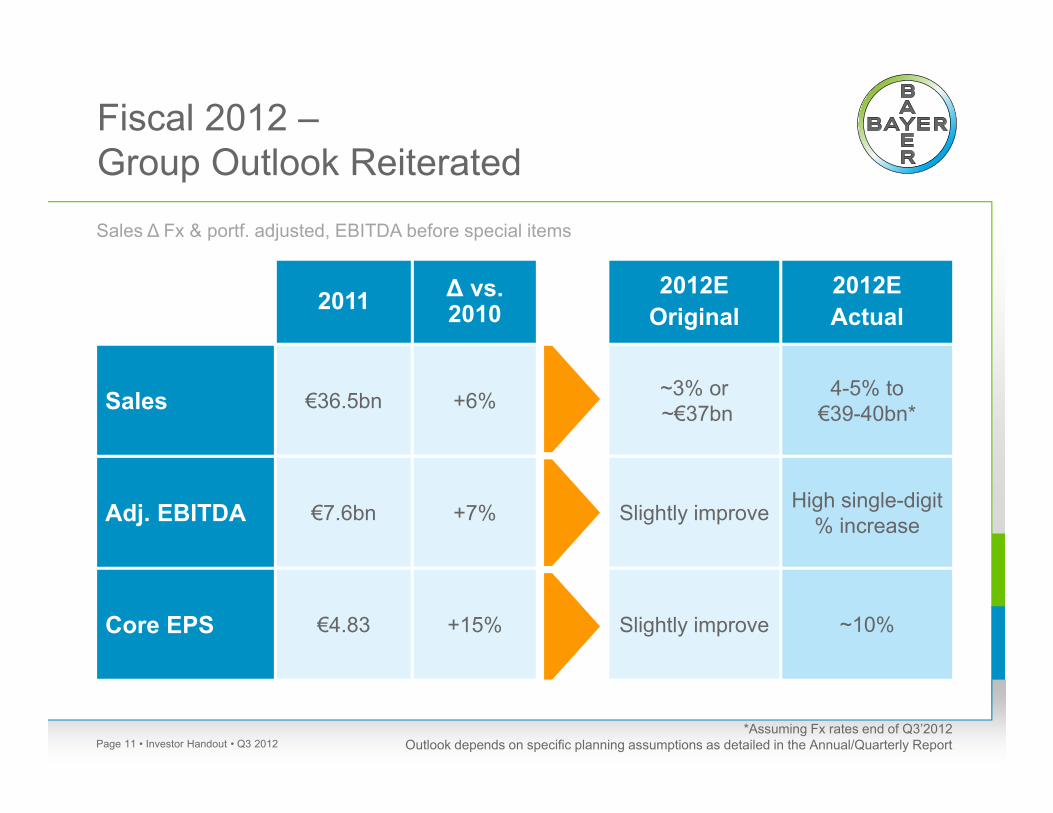
Fiscal 2012 –Group Outlook Reiterated
• Investor Handout • Q3 2012Page 11
2011 ∆ vs. 2010
2012EOriginal
2012EActual
Sales €36.5bn +6% ~3% or~€37bn
4-5% to €39-40bn*
Adj. EBITDA €7.6bn +7% Slightly improve High single-digit % increase
Core EPS €4.83 +15% Slightly improve ~10%
*Assuming Fx rates end of Q3’2012Outlook depends on specific planning assumptions as detailed in the Annual/Quarterly Report
Sales ∆ Fx & portf. adjusted, EBITDA before special items
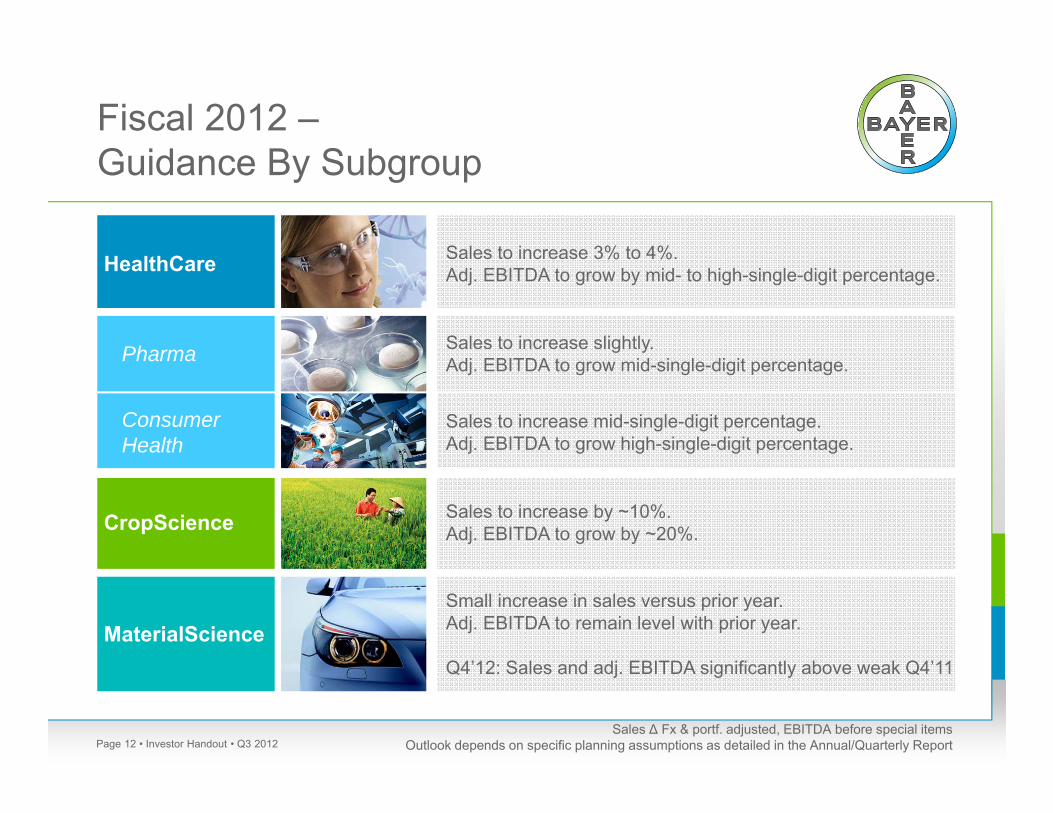
Fiscal 2012 –Guidance By Subgroup
• Investor Handout • Q3 2012Page 12
HealthCare Sales to increase 3% to 4%.Adj. EBITDA to grow by mid- to high-single-digit percentage.
Pharma Sales to increase slightly.Adj. EBITDA to grow mid-single-digit percentage.
Consumer Health
Sales to increase mid-single-digit percentage.Adj. EBITDA to grow high-single-digit percentage.
CropScience Sales to increase by ~10%.Adj. EBITDA to grow by ~20%.
MaterialScienceSmall increase in sales versus prior year.Adj. EBITDA to remain level with prior year.
Q4’12: Sales and adj. EBITDA significantly above weak Q4’11
Sales ∆ Fx & portf. adjusted, EBITDA before special itemsOutlook depends on specific planning assumptions as detailed in the Annual/Quarterly Report

Q3 2012 ResultsInvestor Conference Call
October 30, 2012 / Marijn Dekkers, CEO
Recommended