HAL Id: hal-00871348https://hal.archives-ouvertes.fr/hal-00871348
Submitted on 9 Oct 2013
HAL is a multi-disciplinary open accessarchive for the deposit and dissemination of sci-entific research documents, whether they are pub-lished or not. The documents may come fromteaching and research institutions in France orabroad, or from public or private research centers.
L’archive ouverte pluridisciplinaire HAL, estdestinée au dépôt et à la diffusion de documentsscientifiques de niveau recherche, publiés ou non,émanant des établissements d’enseignement et derecherche français ou étrangers, des laboratoirespublics ou privés.
Quantitative and Qualitative Assessment of QoE forMultimedia Services in Wireless Environment
Khalil Ur Rehman Laghari, Imran Khan, Noel Crespi
To cite this version:Khalil Ur Rehman Laghari, Imran Khan, Noel Crespi. Quantitative and Qualitative Assessment ofQoE for Multimedia Services in Wireless Environment. 4th ACM Workshop on Mobile Video inconjunction with ACM Multimedia Systems Conference 2012, Feb 2012, New York, United States.pp.7-12, 2012, <10.1145/2151677.2151680>. <hal-00871348>
Quantitative and Qualitative Assessment of QoE for
Multimedia Services in Wireless Environment
Khalil ur Rehman Laghari, Imran Khan, Noel Crespi Institut Telecom, Telecom SudParis, 9 Rue Charles Fourier, 91011
Evry France
khalil.laghari, imran.khan, noel.crespi {@it-sudparis.eu}
ABSTRACT
Quality of Experience (QoE) is emerging as the holy grail of human-centric multimedia services. QoE is a multi-disciplinary field based on social psychology, cognitive science, economics and engineering science, focused on understanding overall human quality of experience requirements. QoE has been viewed as the pivotal set of metrics in determining the success or failure of any product or service. In real time environment, QoE is influenced by multiple service factors such as application and network level QoS parameters, content, and business aspects. We emulate wireless environment and analyze the combined impact of the network and application level QoS parameters and content characteristics over user perceived quality for video streaming service. We use Rough Set Theory (RST) for quantitative assessment and simple CCA frame work for qualitative assessment of user data in order to understand the influence of multiple multimedia service parameters over QoE.
Categories and Subject Descriptors
H.4.3; H.1.2; H.3.4
General Terms
Performance, Experimentation, Human Factors, Theory
Keywords
QoE; QoS; Video Streaming; Rough Set Theory; Qualitative assessment; Content; Wireless ; User experience;
1. INTRODUCTION Due to the ever increasing demand for the multimedia applications, video streaming has become a prominent way to exchange media. It is being widely used for video conferencing, video on demand, telemedicine and e-learning etc. QoE provides an assessment of human expectations, feelings, perceptions, cognition and acceptance with respect to a particular product, service or application [1]. There is burgeoning need to understand
human hedonic and aesthetic quality requirements, and for this purpose, the term Quality of Experience (QoE) is coined.
A user’s quality of experience of a service can evoke a wide range of emotions and perceptions. These emotions and perceptions impact the user’s attitude towards the quality, content, advertised products, and price, etc. The video streaming based services are strongly perceptual experience and users are known to make aesthetic judgments of these instantly. For multimedia service providers, it is important to understand the various video quality aspects which impact user’s quality of experience. Video quality is jointly affected by various network-dependent, application-specific, content-based, business and context oriented factors. For instance, packet loss, packet reorder and delay are the major network-dependent factors, while video codec, frame rate, video coding bit rate, are the major application-specific factors while content type, content characteristics (e.g., slow and fast moving video content) are the main content-based factors, affecting video quality and in turn affecting overall quality of experience. Business factors (such as advertisement, price and billing) may also influence customer’s intentions and behavior, for instance a customer using a paid Video on Demand service (VoD) may have higher quality requirements than a customer using a free VoD service. And all these influencing factors are grouped together as service parameters as shown in Figure 1.
In wireless environment, the quality of service (QoS) poses challenges to the design of the wireless networks because of the dynamics of the wireless channels. Any set of quality parameters could vary and emerge together; therefore, in our current work, we study and investigate the total effect of QoS issues (e.g., packet loss, packet reorder, and video bit rate) over the user QoE. To investigate these aspects, we conducted subjective study based on ITU-T recommendations [4], along with qualitative assessment methodology. We repeat these experiments with different content types (e.g., football and container video) to investigate the influence of content types and characteristics on user perception for video quality. A high level QoE model is presented in Figure 1, which shows the closed loop mechanism of QoE formation. For instance user is using some video streaming service, as video is a perceptual experience for humans; it develops emotions, and perceptions. For gathering those emotions, perceptions or user feelings, we employ both quantitative and qualitative QoE assessment techniques. The novelty of our work is studying the overall impact of QoS parameters and content characteristics over QoE using both quantitative and qualitative assessment methodologies.
Permission to make digital or hard copies of all or part of this work for
personal or classroom use is granted without fee provided that copies are
not made or distributed for profit or commercial advantage and that copies bear this notice and the full citation on the first page. To copy
otherwise, or republish, to post on servers or to redistribute to lists,
requires prior specific permission and/or a fee. MoVid’12, February 24, 2012, Chapel Hill, North Carolina, USA.
Copyright 2012 ACM 978-1-4503-1166-3/12/02...$10.00.
7
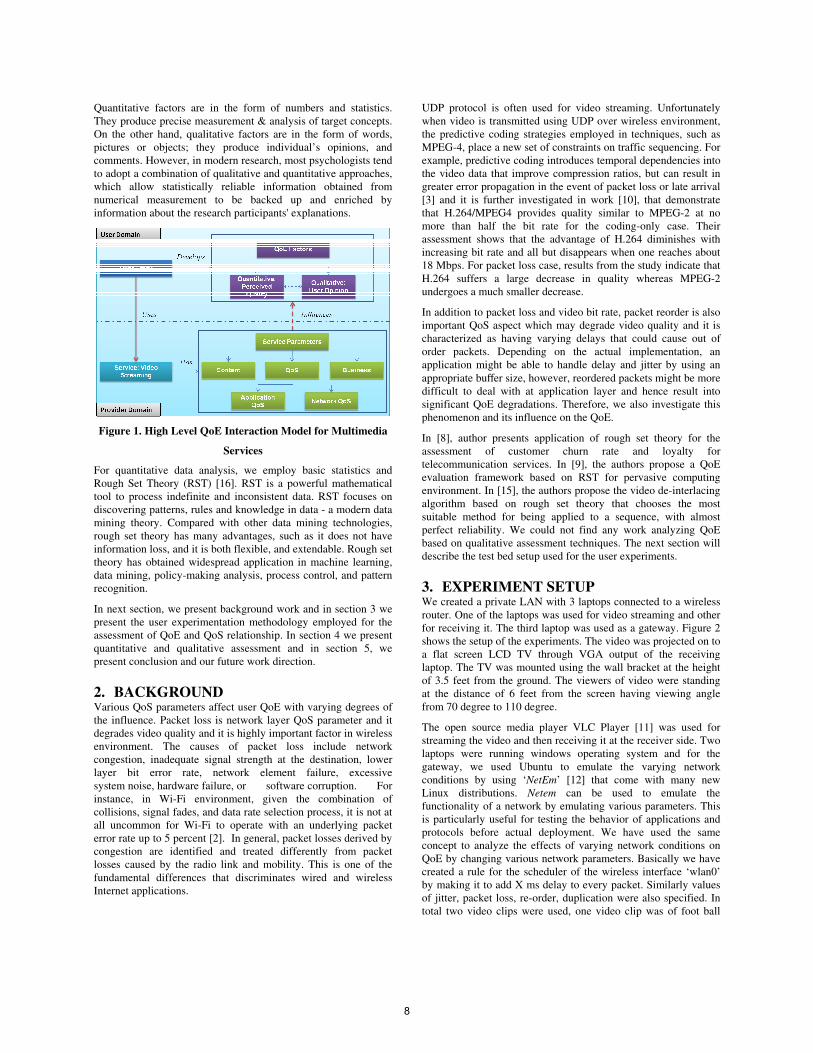
Quantitative factors are in the form of numbers and statistics. They produce precise measurement & analysis of target concepts. On the other hand, qualitative factors are in the form of words, pictures or objects; they produce individual’s opinions, and comments. However, in modern research, most psychologists tend to adopt a combination of qualitative and quantitative approaches, which allow statistically reliable information obtained from numerical measurement to be backed up and enriched by information about the research participants' explanations.
Figure 1. High Level QoE Interaction Model for Multimedia
Services
For quantitative data analysis, we employ basic statistics and Rough Set Theory (RST) [16]. RST is a powerful mathematical tool to process indefinite and inconsistent data. RST focuses on discovering patterns, rules and knowledge in data - a modern data mining theory. Compared with other data mining technologies, rough set theory has many advantages, such as it does not have information loss, and it is both flexible, and extendable. Rough set theory has obtained widespread application in machine learning, data mining, policy-making analysis, process control, and pattern recognition.
In next section, we present background work and in section 3 we present the user experimentation methodology employed for the assessment of QoE and QoS relationship. In section 4 we present quantitative and qualitative assessment and in section 5, we present conclusion and our future work direction.
2. BACKGROUND Various QoS parameters affect user QoE with varying degrees of the influence. Packet loss is network layer QoS parameter and it degrades video quality and it is highly important factor in wireless environment. The causes of packet loss include network congestion, inadequate signal strength at the destination, lower layer bit error rate, network element failure, excessive system noise, hardware failure, or software corruption. For instance, in Wi-Fi environment, given the combination of collisions, signal fades, and data rate selection process, it is not at all uncommon for Wi-Fi to operate with an underlying packet error rate up to 5 percent [2]. In general, packet losses derived by congestion are identified and treated differently from packet losses caused by the radio link and mobility. This is one of the fundamental differences that discriminates wired and wireless Internet applications.
UDP protocol is often used for video streaming. Unfortunately when video is transmitted using UDP over wireless environment, the predictive coding strategies employed in techniques, such as MPEG-4, place a new set of constraints on traffic sequencing. For example, predictive coding introduces temporal dependencies into the video data that improve compression ratios, but can result in greater error propagation in the event of packet loss or late arrival [3] and it is further investigated in work [10], that demonstrate that H.264/MPEG4 provides quality similar to MPEG-2 at no more than half the bit rate for the coding-only case. Their assessment shows that the advantage of H.264 diminishes with increasing bit rate and all but disappears when one reaches about 18 Mbps. For packet loss case, results from the study indicate that H.264 suffers a large decrease in quality whereas MPEG-2 undergoes a much smaller decrease.
In addition to packet loss and video bit rate, packet reorder is also important QoS aspect which may degrade video quality and it is characterized as having varying delays that could cause out of order packets. Depending on the actual implementation, an application might be able to handle delay and jitter by using an
appropriate bu er size, however, reordered packets might be more difficult to deal with at application layer and hence result into significant QoE degradations. Therefore, we also investigate this phenomenon and its influence on the QoE.
In [8], author presents application of rough set theory for the assessment of customer churn rate and loyalty for telecommunication services. In [9], the authors propose a QoE evaluation framework based on RST for pervasive computing environment. In [15], the authors propose the video de-interlacing algorithm based on rough set theory that chooses the most suitable method for being applied to a sequence, with almost perfect reliability. We could not find any work analyzing QoE based on qualitative assessment techniques. The next section will describe the test bed setup used for the user experiments.
3. EXPERIMENT SETUP We created a private LAN with 3 laptops connected to a wireless router. One of the laptops was used for video streaming and other for receiving it. The third laptop was used as a gateway. Figure 2 shows the setup of the experiments. The video was projected on to a flat screen LCD TV through VGA output of the receiving laptop. The TV was mounted using the wall bracket at the height of 3.5 feet from the ground. The viewers of video were standing at the distance of 6 feet from the screen having viewing angle from 70 degree to 110 degree.
The open source media player VLC Player [11] was used for streaming the video and then receiving it at the receiver side. Two laptops were running windows operating system and for the gateway, we used Ubuntu to emulate the varying network conditions by using ‘NetEm’ [12] that come with many new Linux distributions. Netem can be used to emulate the functionality of a network by emulating various parameters. This is particularly useful for testing the behavior of applications and protocols before actual deployment. We have used the same concept to analyze the effects of varying network conditions on QoE by changing various network parameters. Basically we have created a rule for the scheduler of the wireless interface ‘wlan0’ by making it to add X ms delay to every packet. Similarly values of jitter, packet loss, re-order, duplication were also specified. In total two video clips were used, one video clip was of foot ball
8
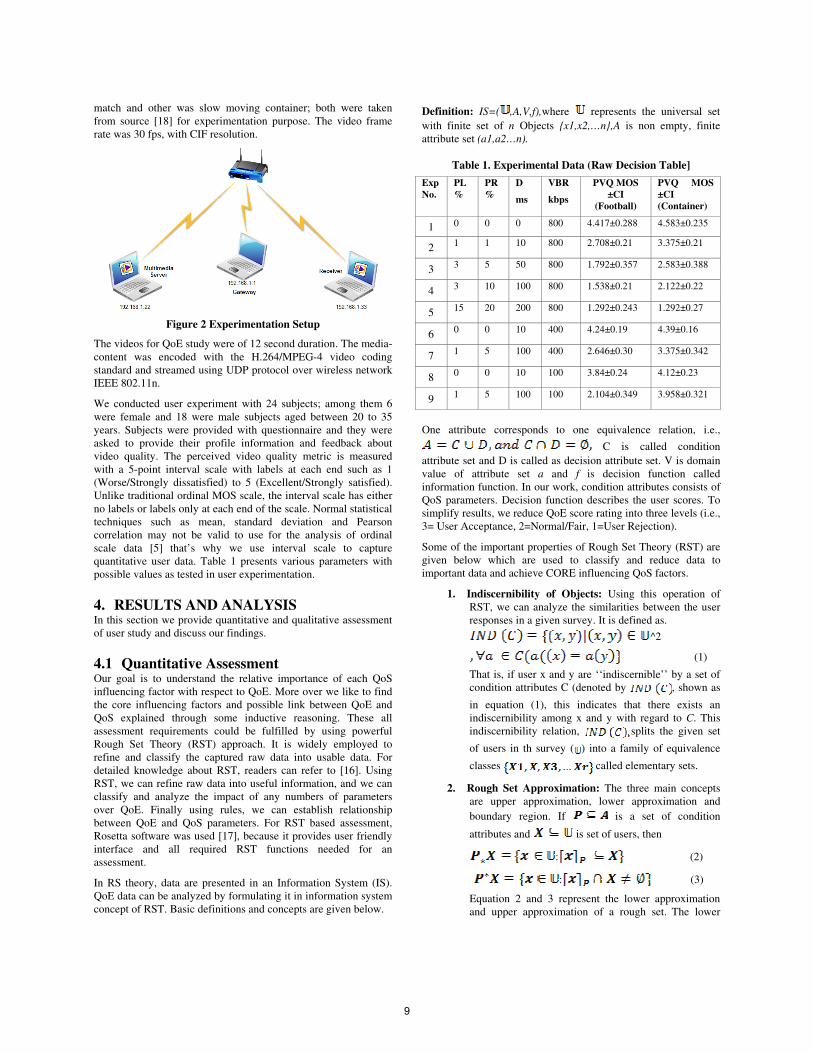
match and other was slow moving container; both were taken from source [18] for experimentation purpose. The video frame rate was 30 fps, with CIF resolution.
Figure 2 Experimentation Setup
The videos for QoE study were of 12 second duration. The media-content was encoded with the H.264/MPEG-4 video coding standard and streamed using UDP protocol over wireless network IEEE 802.11n.
We conducted user experiment with 24 subjects; among them 6 were female and 18 were male subjects aged between 20 to 35 years. Subjects were provided with questionnaire and they were asked to provide their profile information and feedback about video quality. The perceived video quality metric is measured with a 5-point interval scale with labels at each end such as 1 (Worse/Strongly dissatisfied) to 5 (Excellent/Strongly satisfied). Unlike traditional ordinal MOS scale, the interval scale has either no labels or labels only at each end of the scale. Normal statistical techniques such as mean, standard deviation and Pearson correlation may not be valid to use for the analysis of ordinal scale data [5] that’s why we use interval scale to capture quantitative user data. Table 1 presents various parameters with possible values as tested in user experimentation.
4. RESULTS AND ANALYSIS In this section we provide quantitative and qualitative assessment of user study and discuss our findings.
4.1 Quantitative Assessment Our goal is to understand the relative importance of each QoS influencing factor with respect to QoE. More over we like to find the core influencing factors and possible link between QoE and QoS explained through some inductive reasoning. These all assessment requirements could be fulfilled by using powerful Rough Set Theory (RST) approach. It is widely employed to refine and classify the captured raw data into usable data. For detailed knowledge about RST, readers can refer to [16]. Using RST, we can refine raw data into useful information, and we can classify and analyze the impact of any numbers of parameters over QoE. Finally using rules, we can establish relationship between QoE and QoS parameters. For RST based assessment, Rosetta software was used [17], because it provides user friendly interface and all required RST functions needed for an assessment.
In RS theory, data are presented in an Information System (IS). QoE data can be analyzed by formulating it in information system concept of RST. Basic definitions and concepts are given below.
Definition: IS=( ,A,V,f),where represents the universal set
with finite set of n Objects {x1,x2,…n},A is non empty, finite attribute set (a1,a2…n).
Table 1. Experimental Data (Raw Decision Table]
Exp
No.
PL
%
PR
%
D
ms
VBR
kbps
PVQ MOS
±CI
(Football)
PVQ MOS
±CI
(Container)
1 0 0 0 800 4.417±0.288 4.583±0.235
2 1 1 10 800 2.708±0.21 3.375±0.21
3 3 5 50 800 1.792±0.357 2.583±0.388
4 3 10 100 800 1.538±0.21 2.122±0.22
5 15 20 200 800 1.292±0.243 1.292±0.27
6 0 0 10 400 4.24±0.19 4.39±0.16
7 1 5 100 400 2.646±0.30 3.375±0.342
8 0 0 10 100 3.84±0.24 4.12±0.23
9 1 5 100 100 2.104±0.349 3.958±0.321
One attribute corresponds to one equivalence relation, i.e.,
C is called condition
attribute set and D is called as decision attribute set. V is domain value of attribute set a and f is decision function called information function. In our work, condition attributes consists of QoS parameters. Decision function describes the user scores. To simplify results, we reduce QoE score rating into three levels (i.e., 3= User Acceptance, 2=Normal/Fair, 1=User Rejection).
Some of the important properties of Rough Set Theory (RST) are given below which are used to classify and reduce data to important data and achieve CORE influencing QoS factors.
1. Indiscernibility of Objects: Using this operation of RST, we can analyze the similarities between the user responses in a given survey. It is defined as.
^2
(1)
That is, if user x and y are ‘‘indiscernible’’ by a set of condition attributes C (denoted by , shown as
in equation (1), this indicates that there exists an indiscernibility among x and y with regard to C. This indiscernibility relation, splits the given set
of users in th survey ( ) into a family of equivalence
classes called elementary sets.
2. Rough Set Approximation: The three main concepts are upper approximation, lower approximation and
boundary region. If is a set of condition
attributes and is set of users, then
: (2)
: (3)
Equation 2 and 3 represent the lower approximation and upper approximation of a rough set. The lower
9
approximation is a complete set of objects that can be positively (i.e., unambiguously) classified as belonging to target set X. The upper approximation is the complete set of objects that are possibly members of the target set X. The boundary region is given by set
difference between and it consists of
those objects that can neither be ruled in nor ruled out as members of the target set X.
3. Attribute Reduction and CORE: RST helps to reduce the huge list of attributes to only effective ones which truly matters. CORE is the set of indispensably important factors. If Service Providers will not be able to support “CORE” factors, then it will definitely result in a poor customer experience.
4. Decision Table and Rules: Helps to understand the reason of user’s acceptability/unacceptability based on influencing (condition) attributes. The decision table and probabilistic analysis describe the set of rules about user experience factors. With every decision rule two conditional probabilities, called the accuracy (i.e.,
certainty) and the coverage coe cient, are associated.
The accuracy coe cient expresses the conditional probability that an object belongs to the decision class specified by the decision rule, given it satisfies
conditions of the rule. The coverage coe cient gives the conditional probability of reasons for a given decision [8]. We calculate support, accuracy and coverage of condition attributes from [8] corresponding to decision rules.
Support of the Rule:
(4)
Accuracy of the Rule:
, (5)
where
Coverage factor of the decision Rule:
(6)
where
4.1.1 Evaluation
First step is to discretize data using naïve algorithm. Then using step 1, 2 and 3, we classify and reduce attribute set. Afterwards, the decision rules are generated based on Johnson’s greedy algorithm [19] using Rosetta software. The equations 4, 5, and 6 calculate strength, accuracy and coverage factor of every rule.
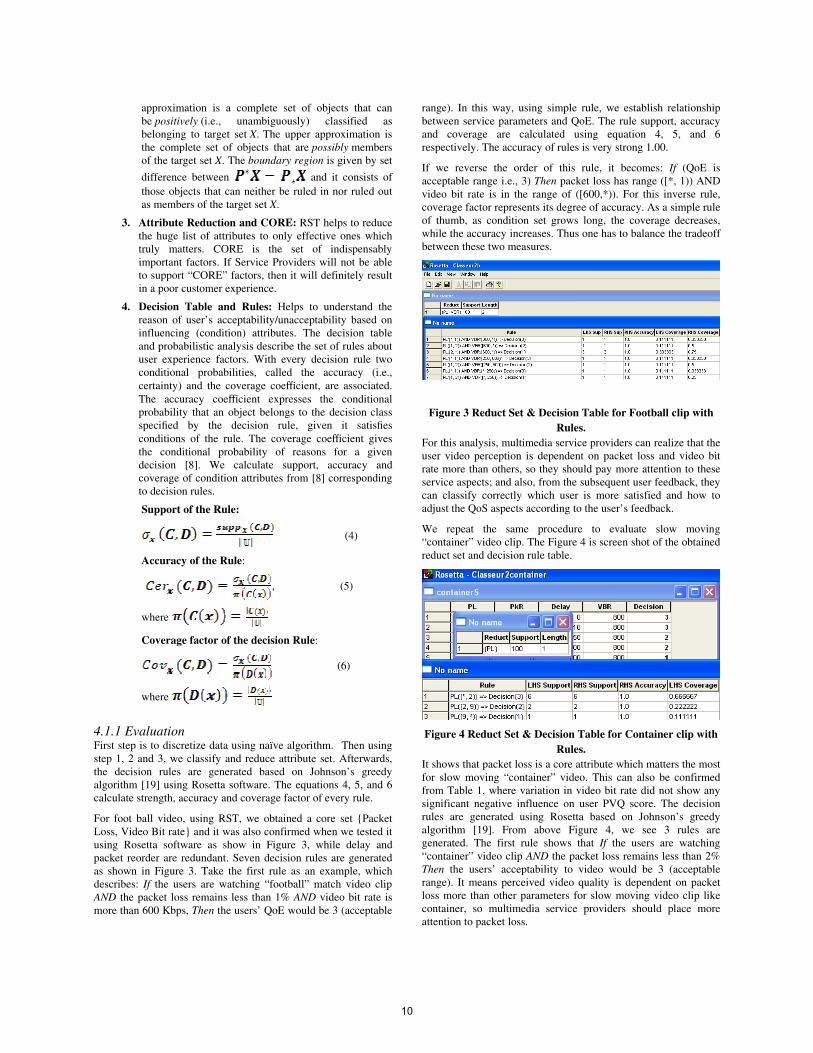
For foot ball video, using RST, we obtained a core set {Packet Loss, Video Bit rate} and it was also confirmed when we tested it using Rosetta software as show in Figure 3, while delay and packet reorder are redundant. Seven decision rules are generated as shown in Figure 3. Take the first rule as an example, which describes: If the users are watching “football” match video clip AND the packet loss remains less than 1% AND video bit rate is more than 600 Kbps, Then the users’ QoE would be 3 (acceptable
range). In this way, using simple rule, we establish relationship between service parameters and QoE. The rule support, accuracy and coverage are calculated using equation 4, 5, and 6 respectively. The accuracy of rules is very strong 1.00.
If we reverse the order of this rule, it becomes: If (QoE is acceptable range i.e., 3) Then packet loss has range ([*, 1)) AND video bit rate is in the range of ([600,*)). For this inverse rule, coverage factor represents its degree of accuracy. As a simple rule of thumb, as condition set grows long, the coverage decreases, while the accuracy increases. Thus one has to balance the tradeoff between these two measures.
Figure 3 Reduct Set & Decision Table for Football clip with
Rules.
For this analysis, multimedia service providers can realize that the user video perception is dependent on packet loss and video bit rate more than others, so they should pay more attention to these service aspects; and also, from the subsequent user feedback, they can classify correctly which user is more satisfied and how to adjust the QoS aspects according to the user’s feedback.
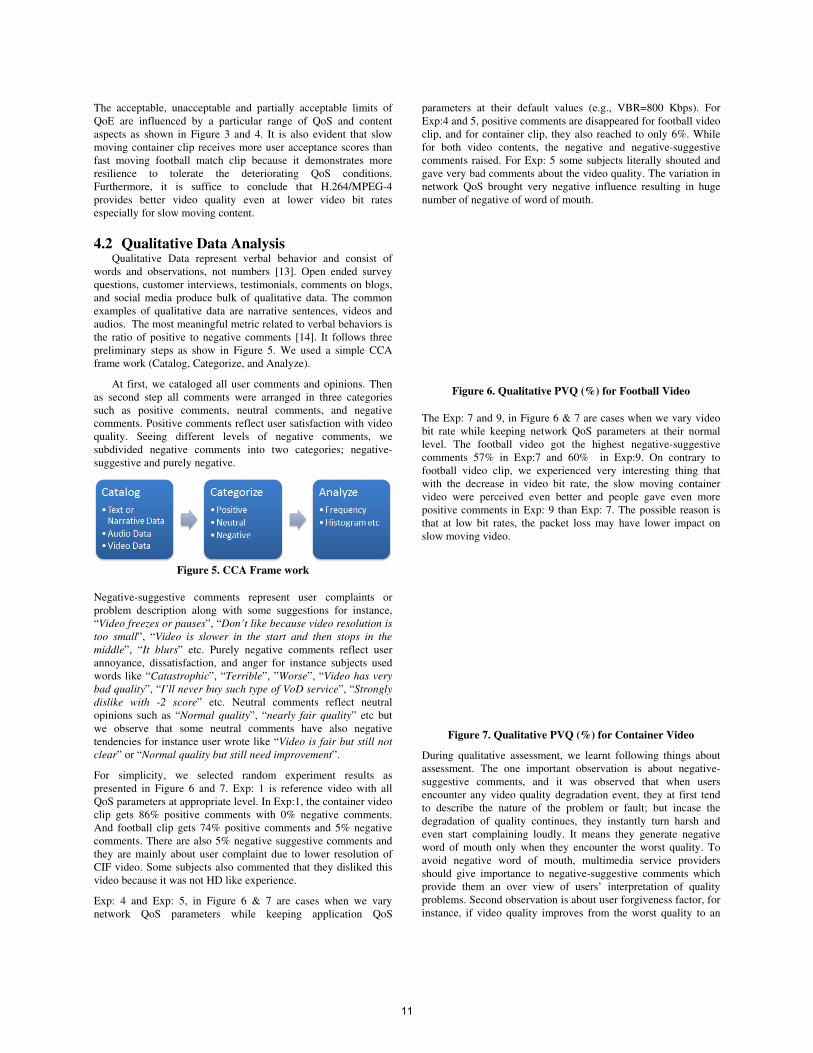
We repeat the same procedure to evaluate slow moving “container” video clip. The Figure 4 is screen shot of the obtained reduct set and decision rule table.
Figure 4 Reduct Set & Decision Table for Container clip with
Rules.
It shows that packet loss is a core attribute which matters the most for slow moving “container” video. This can also be confirmed from Table 1, where variation in video bit rate did not show any significant negative influence on user PVQ score. The decision rules are generated using Rosetta based on Johnson’s greedy algorithm [19]. From above Figure 4, we see 3 rules are generated. The first rule shows that If the users are watching “container” video clip AND the packet loss remains less than 2% Then the users’ acceptability to video would be 3 (acceptable range). It means perceived video quality is dependent on packet loss more than other parameters for slow moving video clip like container, so multimedia service providers should place more attention to packet loss.
10
The acceptable, unacceptable and partially acceptable limits of QoE are influenced by a particular range of QoS and content aspects as shown in Figure 3 and 4. It is also evident that slow moving container clip receives more user acceptance scores than fast moving football match clip because it demonstrates more resilience to tolerate the deteriorating QoS conditions. Furthermore, it is suffice to conclude that H.264/MPEG-4 provides better video quality even at lower video bit rates especially for slow moving content.
4.2 Qualitative Data Analysis Qualitative Data represent verbal behavior and consist of
words and observations, not numbers [13]. Open ended survey questions, customer interviews, testimonials, comments on blogs, and social media produce bulk of qualitative data. The common examples of qualitative data are narrative sentences, videos and audios. The most meaningful metric related to verbal behaviors is the ratio of positive to negative comments [14]. It follows three preliminary steps as show in Figure 5. We used a simple CCA frame work (Catalog, Categorize, and Analyze).
At first, we cataloged all user comments and opinions. Then as second step all comments were arranged in three categories such as positive comments, neutral comments, and negative comments. Positive comments reflect user satisfaction with video quality. Seeing different levels of negative comments, we subdivided negative comments into two categories; negative-suggestive and purely negative.
Figure 5. CCA Frame work
Negative-suggestive comments represent user complaints or problem description along with some suggestions for instance, “Video freezes or pauses”, “Don’t like because video resolution is
too small”, “Video is slower in the start and then stops in the
middle”, “It blurs” etc. Purely negative comments reflect user annoyance, dissatisfaction, and anger for instance subjects used words like “Catastrophic”, “Terrible”, ”Worse”, “Video has very
bad quality”, “I’ll never buy such type of VoD service”, “Strongly
dislike with -2 score” etc. Neutral comments reflect neutral opinions such as “Normal quality”, “nearly fair quality” etc but we observe that some neutral comments have also negative tendencies for instance user wrote like “Video is fair but still not
clear” or “Normal quality but still need improvement”.
For simplicity, we selected random experiment results as presented in Figure 6 and 7. Exp: 1 is reference video with all QoS parameters at appropriate level. In Exp:1, the container video clip gets 86% positive comments with 0% negative comments. And football clip gets 74% positive comments and 5% negative comments. There are also 5% negative suggestive comments and they are mainly about user complaint due to lower resolution of CIF video. Some subjects also commented that they disliked this video because it was not HD like experience.
Exp: 4 and Exp: 5, in Figure 6 & 7 are cases when we vary network QoS parameters while keeping application QoS
parameters at their default values (e.g., VBR=800 Kbps). For Exp:4 and 5, positive comments are disappeared for football video clip, and for container clip, they also reached to only 6%. While for both video contents, the negative and negative-suggestive comments raised. For Exp: 5 some subjects literally shouted and gave very bad comments about the video quality. The variation in network QoS brought very negative influence resulting in huge number of negative of word of mouth.
Figure 6. Qualitative PVQ (%) for Football Video
The Exp: 7 and 9, in Figure 6 & 7 are cases when we vary video bit rate while keeping network QoS parameters at their normal level. The football video got the highest negative-suggestive comments 57% in Exp:7 and 60% in Exp:9. On contrary to football video clip, we experienced very interesting thing that with the decrease in video bit rate, the slow moving container video were perceived even better and people gave even more positive comments in Exp: 9 than Exp: 7. The possible reason is that at low bit rates, the packet loss may have lower impact on slow moving video.
Figure 7. Qualitative PVQ (%) for Container Video
During qualitative assessment, we learnt following things about assessment. The one important observation is about negative-suggestive comments, and it was observed that when users encounter any video quality degradation event, they at first tend to describe the nature of the problem or fault; but incase the degradation of quality continues, they instantly turn harsh and even start complaining loudly. It means they generate negative word of mouth only when they encounter the worst quality. To avoid negative word of mouth, multimedia service providers should give importance to negative-suggestive comments which provide them an over view of users’ interpretation of quality problems. Second observation is about user forgiveness factor, for instance, if video quality improves from the worst quality to an
11
average quality, users turn very positive and give generous comments. It means users may forget and forgive the bad experience instantly if worst quality span is shorter. We also learnt that users may have pre-occupied biases or past experiences about video quality, as some users were not ready to accept video quality lesser than HD video or with CIF resolution. Therefore to neutralize it, the pre-test user training session is very important.
5. CONCLUSION & FUTURE WORK In real environment, multiple QoS parameters may work interdependently and they jointly cause degradation in quality and hence poor user experience. In this paper we presented the results of subjective user study to evaluate the combined effect of QoS parameters and content characteristics over QoE. For quantitative assessment, we use Rough Set Theory. With this assessment, we learnt that the different types of content require different level of QoS support. Furthermore QoS parameters at network layer and application layer have also different level of impact over QoE. For fast moving football match clip, the core set of parameter consists of packet loss and video bit rate and while for slow moving container clip, the main influencing factor is packet loss only. Though results may look quite intuitive in the presence of four QoS parameters to decide which one is vital, but in real environment as the number of influencing factors increase (including business parameters, all QoS parameters, contextual parameters etc), then understanding the interdependence among them gets more complex and even it turns hard to find actual core attribute set. However using RST, any set of raw data can be turned into usable date and important core attributes could be found easily with considerable accuracy.
Qualitative assessment builds on user opinions and comments. The assessment of user comments based on CCA framework shows that slow moving container clip got more positive comments and less negative comment than fast moving video clip. Furthermore variation in network QoS parameters causes the generation of abundant number of negative comments for both video clips, while variation in video bit rate has not that severe trend. The slow moving container video clip generates significant number of positive comments and only few negative comments, but the fast moving football clip got more negative comments and lesser positive comments than slow moving container clip. It is obvious from results that the overall trend in qualitative comments matches with quantitative data assessment.
The work described in this paper is in progress and we are currently working on the development of an efficient QoE framework which will be used to monitor and analyze the QoE and other influencing factors for multimedia services.
6. REFERENCES [1] ur Rehman Laghari, K.; Crespi, N.; Molina, B.; Palau, C.E.; ,
"QoE Aware Service Delivery in Distributed Environment," Advanced Information Networking and
Applications (WAINA), 2011 IEEE Workshops of
International Conference on , vol., no., pp.837-842, 22-25 March 2011.
[2] Cisco White Paper “Optimizing Enterprise Video Over Wireless Lan”. 2010 Cisco Systems, Inc.
[3] Arthur, C.M. Girma, D. Harle, D. Lehane, A. “The effects of packet reordering in a wireless multimedia
environment”, Wireless Communication Systems, 2004, 1st
International Symposium on Issue Date: 20-22 Sept. 2004
[4] ITU-T Recommendation P.910, “Subjective video quality assessment methods for multimedia applications,” International Telecommunication Union, Geneva, Switzerland, 2008.
[5] Brooks, P.; Hestnes, B.; , "User measures of quality of experience: why being objective and quantitative is important," Network, IEEE , vol.24, no.2, pp.8-13, March-April 2010.
[6] Kandaraj Piamrat, Cesar Viho, Adlen Ksentini and Jean-Marie Bonnin “Quality of Experience Measurements for Video Streaming over Wireless Networks”. Sixth International Conference on Information Technology: New Generations 2009.
[7] Shu Tao, John Apostolopoulos, Roch Guérin, “Real-Time Monitoring of Video Quality in IP Network”, IEEE/ACM
TRANSACTIONS ON NETWORKING, VOL. 16, NO. 5, OCTOBER 2008
[8] Zdzisław Pawla, “Rough set theory and its applications”, Journal of Telecommunications and Information Technology 2001.
[9] Liu Li-yuan; Zhou Wen-an; Song Jun-de; , "The Research of Quality of Experience Evaluation Method in Pervasive Computing Environment," Pervasive Computing and
Applications, 2006 1st International Symposium on , vol., no., pp.178-182, 3-5 Aug. 2006
[10] Margaret H. Pinson, Stephen Wolf, and Gregory Cermak HDTV Subjective Quality of H.264 vs. MPEG-2, with and without Packet Loss. Broadcasting, IEEE Transactions on Issue Date : March 2010 Vol.56 , Issue:1
[11] VLC player website:http://www.videolan.org/vlc/
[12] Netem, accessed on 14th October 2011. DOI=http://www.linuxfoundation.org/collaborate/workgroups/networking/netem
[13] Ellen Taylor-Powell, Marcus Renner “Analyzing Qualitative Data”, 2003.University of Winsonsin. DOI=http://learningstore.uwex.edu/assets/pdfs/g3658-12.pdf
[14] Tom Tullis and Bill Albert,“Measuring the user experience”. MK Publishers Copy right 2008 by Elsevier Inc.
[15] G. Jeon, R. Falcón, and J. Jeong, “Rough set approach to video deinterlacing systems,” Studies in Fuzziness and Soft Computing-Granular Computing: At the Junction of Rough Sets and Fuzzy Sets, vol. 224, pp. 131-147, 2008.
[16] Pawlak, Z., Grzymala–Busse, J.W., Slowiriski, R., Ziarko, W.: Rough Sets. Comm. of the ACM. vol.38 (11). pp. 88—95 (1995)
[17] ROSETTA- A rough set took kit. DOI= http://www.lcb.uu.se/tools/rosetta/
[18] Test Videos.DOI=http://media.xiph.org/video/derf/
[19] D. S. Johnson. Approximation algorithms for combinatorial problems. Journal of Computer and System Sciences, 9:256–278,1974.
12
Recommended