REPORT
Noise Measurements Baseline Report WesPac Tilbury Marine Jetty Project
Submitted to:
WesPac Midstream-Vancouver LLC
Submitted by:
Golder Associates Ltd. Suite 200 - 2920 Virtual Way, Vancouver, British Columbia, V5M 0C4, Canada
+1 604 296 4200
1314220049-136-R-Rev0
13 August 2018
13 August 2018 1314220049-136-R-Rev0
i
Distribution List electronic copy: WesPac Midstream-Vancouver LLC
13 August 2018 1314220049-136-R-Rev0
ii
Table of Contents
1.0 INTRODUCTION ............................................................................................................................................. 1
2.0 NOISE MONITORING APPROACH ............................................................................................................... 1
2.1 Noise Monitoring Area and Receptors ................................................................................................. 1
2.2 Noise Monitoring Methodology ............................................................................................................ 4
2.3 Data Analysis Approach ....................................................................................................................... 4
2.3.1 Broadband Noise Analysis Approach ............................................................................................. 5
2.3.2 Low Frequency Noise Analysis Approach ...................................................................................... 5
3.0 RESULTS ........................................................................................................................................................ 6
3.1 Monitoring Site R1 ................................................................................................................................ 6
3.1.1 Broadband Noise ............................................................................................................................ 6
3.1.2 Low Frequency Noise ................................................................................................................... 10
3.2 Monitoring Site R2 .............................................................................................................................. 10
3.2.1 Broadband Noise .......................................................................................................................... 10
3.2.2 Low Frequency Noise ..................................................................................................................... 2
3.3 Monitoring Site R3 ................................................................................................................................ 2
3.3.1 Broadband Noise ............................................................................................................................ 2
3.3.2 Low Frequency Noise ..................................................................................................................... 6
3.4 Monitoring Site R4 ................................................................................................................................ 6
3.4.1 Broadband Noise ............................................................................................................................ 6
3.4.2 Low Frequency Noise ................................................................................................................... 16
4.0 SUMMARY .................................................................................................................................................... 16
5.0 CLOSURE ..................................................................................................................................................... 17
6.0 REFERENCES .............................................................................................................................................. 18
13 August 2018 1314220049-136-R-Rev0
iii
TABLES
Table 1: Location of Noise Monitoring Sites ............................................................................................................. 2
Table 2: Filtered Hourly Noise Levels at Monitoring Site R1 .................................................................................... 9
Table 3: Table 3: Low Frequency Analysis for the Monitoring Site R1 .................................................................. 10
Table 4: Filtered Hourly Noise Levels at Monitoring Site R2 .................................................................................... 1
Table 5: Low Frequency Analysis for the Monitoring Site R2................................................................................... 2
Table 6: Filtered Hourly Noise Levels at Monitoring Site R3 .................................................................................... 4
Table 7: Low Frequency Analysis for the Monitoring Site R3................................................................................... 6
Table 8: Filtered Hourly Noise Levels at Monitoring Site R4 .................................................................................... 8
Table 9: Low Frequency Analysis for the Monitoring Site R4................................................................................. 16
Table 10: Daytime and Nighttime Noise Levels at WesPac Monitoring Sites ........................................................ 16
FIGURES
Figure 1: Location of Baseline Noise Receptors ...................................................................................................... 3
Figure 2: One-minute Noise Data Recorded at Monitoring Site R1 ......................................................................... 8
Figure 3: One-minute Noise Data Recorded at Monitoring Site R2 ....................................................................... 12
Figure 4: One-minute Noise Data Recorded at Monitoring Site R3 ......................................................................... 4
Figure 5: One-minute Noise Data Recorded at Monitoring Site R4 ......................................................................... 8
APPENDICES
APPENDIX A Calibration Data
APPENDIX B Weather Data

13 August 2018 1314220049-136-R-Rev0
1
1.0 INTRODUCTION WesPac Midstream–Vancouver LLC (WesPac) retained Golder Associated Ltd. (Golder) to conduct
environmental noise monitoring within the area of the proposed WesPac Tilbury Marine Jetty Project (Project)
located on Tilbury Island in Delta, British Columbia. The baseline noise survey was conducted to collect data that
will be used in the assessment of potential Project effects related to noise.
This report presents the methods and results of baseline noise monitoring collected at three monitoring sites
from September 28 to October 5, 2015 and one monitoring site from February 1 to 2, 2016.
2.0 NOISE MONITORING APPROACH In the province of British Columbia the assessment of noise emissions from oil and gas processing facilities falls
under jurisdiction of the BC Oil and Gas Commission (OGC) and is guided by the BC Oil and Gas Commission’s
British Columbia Noise Control Best Practices Guideline (OGC Guideline) (British Columbia Oil and Gas
Commission, 2009). The OGC Guideline does not provide detailed description of baseline noise measurement
methodology. However, the underlining principle of the OGC guideline is analogous to the Alberta Energy
Regulator’s Directive 038: Noise Control (Directive 038) (Alberta Energy and Utilities Board, 2007).
Directive 038 provides a detailed description of methodology used during baseline field measurements and data
analysis. Therefore, to establish baseline levels relevant for the Project, the baseline noise measurement
program and subsequent data analysis were conducted based on the approach outlined in Directive 038.
Directive 038 specifies that noise baseline measurements should be assessed at the most impacted residences
located within the 1.5 km from the Project boundary. In the absence of seasonally or permanently occupied
dwellings located within the 1.5 km from the Project boundary, the noise levels are to be measured or assessed
along a boundary located at the distance of the 1.5 km from the Project boundary. Based on analysis of available
information, four locations were selected to conduct the baseline noise monitoring.
2.1 Noise Monitoring Area and Receptors The future site of the Project, on Tilbury Island, is already exposed to various industrial developments. The
existing baseline noise levels are influenced by noise emissions from nearby construction, vehicular, railway,
shipping, and airplane traffic.
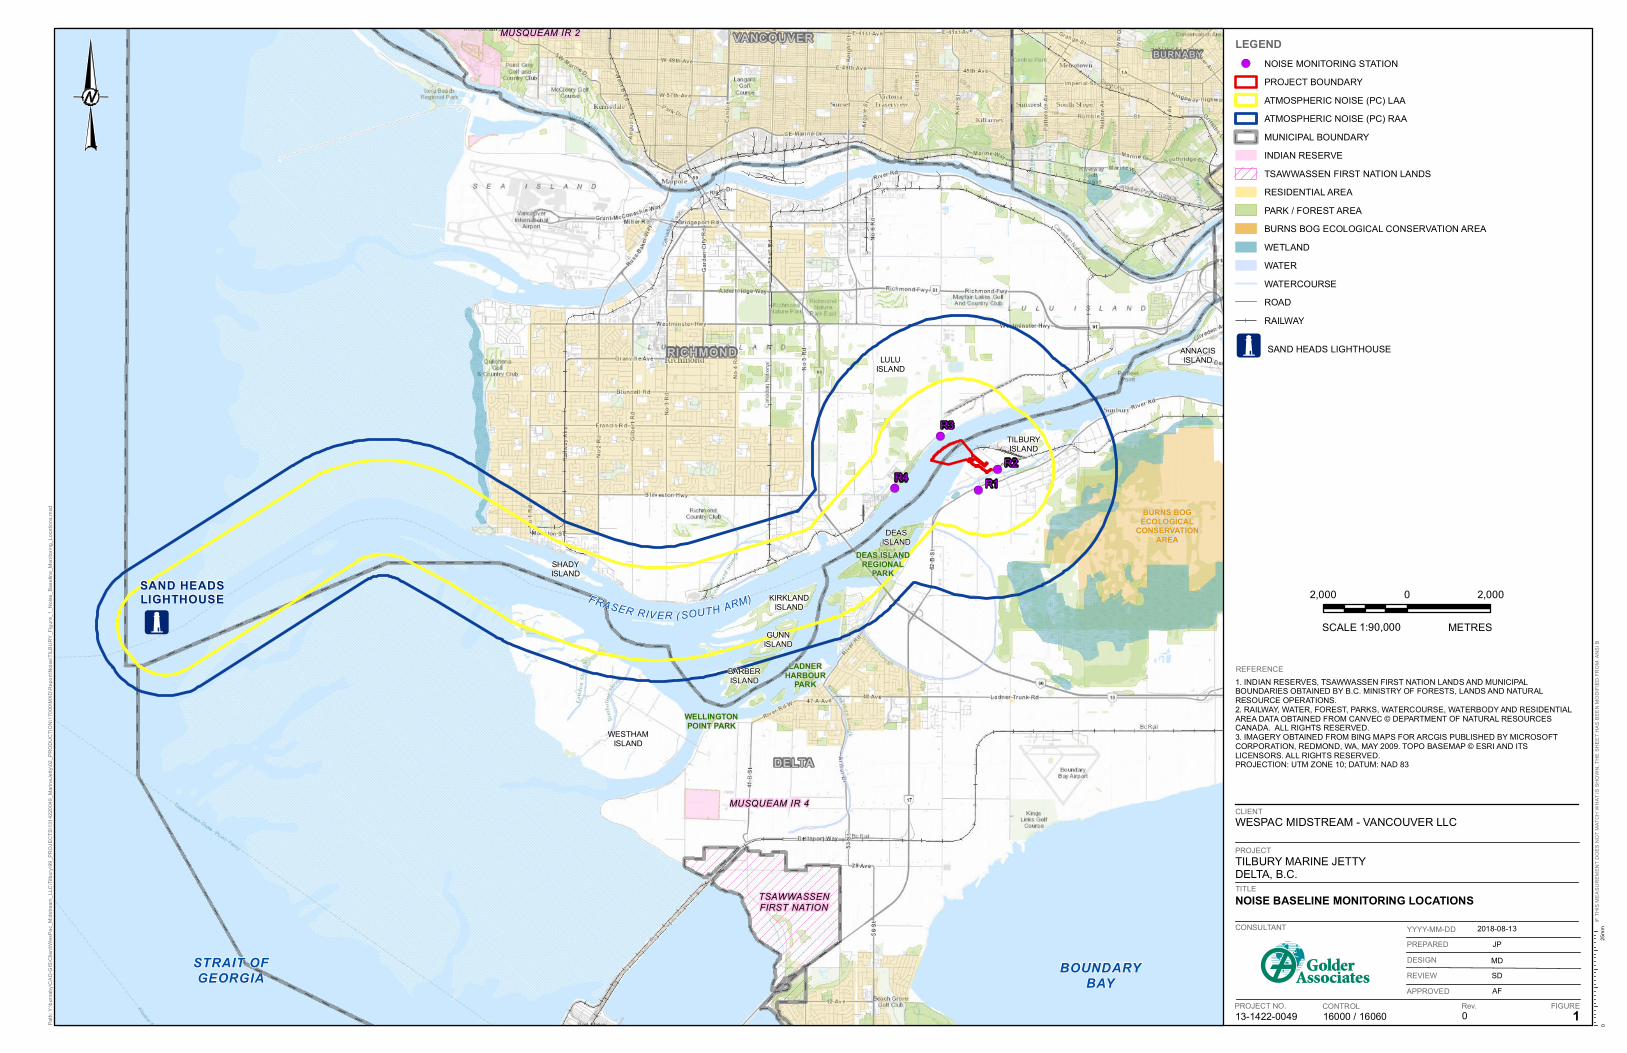
The Local Assessment Area (LAA) for the assessment of noise from the Project extends out 1.5 km in all
directions from the Project boundary and 1 km from the proposed shipping route (Figure 1). This definition of the
noise LAA is consistent with the OGC Guideline. The Regional Assessment Area (RAA) for the assessment of
noise extends out 3 km in all directions from the Project boundary and 1.5 km from the proposed shipping route
(Figure 1). The OGC Guideline and Directive 038 lack instructions for defining noise RAA. In the absence of
regulatory guidance, the noise RAA for the Project has been selected to include the entire area over which direct
or cumulative effects from the Project could potentially be observed. Beyond the RAA, noise from the Project is
expected to be attenuated to such a level that it cannot be discerned from the ambient noise that is already in an
area.

13 August 2018 1314220049-136-R-Rev0
2
To characterize potential impacts of the Project, the baseline noise level was measured at four monitoring sites
representing noise sensitive receptors within the noise LAA. The distance between the Project Site and baseline
receptors varied between 150 m and 1300 m. Descriptions of the receptors and their locations are presented in
Table 1 and on Figure 1.
Table 1: Location of Noise Monitoring Sites
Noise
Monitoring
Site
Monitoring Site Description Universal Transverse Mercator
Location
(Zone 10, NAD 83)
Easting [m] Northing [m]
R1 Residence located 440 m south of the Project boundary. 497485 5442408
R2 Animal shelter located across from Tilbury Road from the
Project site, approximately 150 m southeast of the
Project boundary.
497936 5442905
R3 Site representing First Nations village of Tl’uqtinus,
located 300 m north of the Project boundary.
496572 5443700
R4 Residence located 1300 m southwest of the Project
boundary and within 300 m of the proposed shipping
route.
495486 5442455
!o
FRASER RIV ER ( SOUTH ARM)
MUSQUEAM IR 4
STRAIT OFGEORGIA
SAND HEADSLIGHTHOUSE
DELTA
RICHMOND
VANCOUVER
DEAS ISLANDREGIONAL
PARK
LADNERHARBOUR
PARK
WELLINGTONPOINT PARK
LULUISLAND
TILBURYISLAND
WESTHAMISLAND
SHADYISLAND
KIRKLANDISLAND
BARBERISLAND
GUNNISLAND
DEASISLAND
ANNACISISLAND
TSAWWASSENFIRST NATION
BOUNDARYBAY
MUSQUEAM IR 2
BURNS BOGECOLOGICAL
CONSERVATIONAREA
BURNABY
!(
!(
!(
!(R1
R2
R3
R4
CLIENT
LEGEND!( NOISE MONITORING STATION
PROJECT BOUNDARYATMOSPHERIC NOISE (PC) LAAATMOSPHERIC NOISE (PC) RAAMUNICIPAL BOUNDARYINDIAN RESERVETSAWWASSEN FIRST NATION LANDSRESIDENTIAL AREAPARK / FOREST AREABURNS BOG ECOLOGICAL CONSERVATION AREAWETLANDWATERWATERCOURSEROADRAILWAY
!o SAND HEADS LIGHTHOUSE
REFERENCE
PROJECT
TITLE
Path:
Y:\bu
rnaby
\CAD
-GIS
\Clie
nt\W
esPa
c_Mi
dstre
am_L
LC\Ti
lbury\
99_P
ROJE
CTS\
1314
2200
49_M
arine
Jetty
\02_P
RODU
CTIO
N\17
000\M
XD\R
eport
\Nois
e\TILB
URY_
Figure
_1_N
oise_
Base
line_
Monit
oring
_Loc
ation
s.mxd
IF TH
IS M
EASU
REME
NT D
OES
NOT M
ATCH
WHA
T IS
SHOW
N, TH
E SH
EET H
AS B
EEN
MODI
FIED
FROM
: ANS
I B
CONSULTANT
PROJECT NO. CONTROL Rev. FIGURE
YYYY-MM-DDPREPAREDDESIGNREVIEWAPPROVED
25mm
0
2,000 0 2,000
1:90,000 METRESSCALE
AFSDMDJP
2018-08-13
1016000 / 1606013-1422-0049
NOISE BASELINE MONITORING LOCATIONS
TILBURY MARINE JETTYDELTA, B.C.
1. INDIAN RESERVES, TSAWWASSEN FIRST NATION LANDS AND MUNICIPALBOUNDARIES OBTAINED BY B.C. MINISTRY OF FORESTS, LANDS AND NATURALRESOURCE OPERATIONS.2. RAILWAY, WATER, FOREST, PARKS, WATERCOURSE, WATERBODY AND RESIDENTIALAREA DATA OBTAINED FROM CANVEC © DEPARTMENT OF NATURAL RESOURCESCANADA. ALL RIGHTS RESERVED.3. IMAGERY OBTAINED FROM BING MAPS FOR ARCGIS PUBLISHED BY MICROSOFTCORPORATION, REDMOND, WA, MAY 2009. TOPO BASEMAP © ESRI AND ITSLICENSORS. ALL RIGHTS RESERVED.PROJECTION: UTM ZONE 10; DATUM: NAD 83
WESPAC MIDSTREAM - VANCOUVER LLC
13 August 2018 1314220049-136-R-Rev0
4
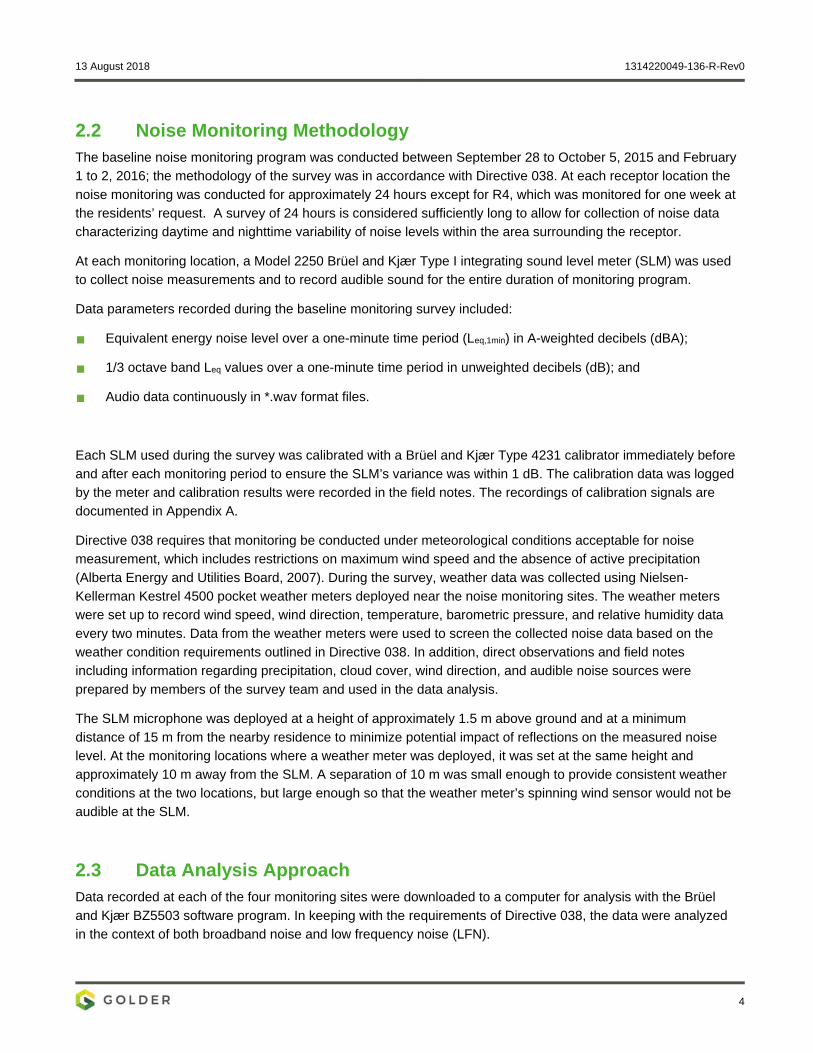
2.2 Noise Monitoring Methodology The baseline noise monitoring program was conducted between September 28 to October 5, 2015 and February
1 to 2, 2016; the methodology of the survey was in accordance with Directive 038. At each receptor location the
noise monitoring was conducted for approximately 24 hours except for R4, which was monitored for one week at
the residents’ request. A survey of 24 hours is considered sufficiently long to allow for collection of noise data
characterizing daytime and nighttime variability of noise levels within the area surrounding the receptor.
At each monitoring location, a Model 2250 Brüel and Kjær Type I integrating sound level meter (SLM) was used
to collect noise measurements and to record audible sound for the entire duration of monitoring program.
Data parameters recorded during the baseline monitoring survey included:
Equivalent energy noise level over a one-minute time period (Leq,1min) in A-weighted decibels (dBA);
1/3 octave band Leq values over a one-minute time period in unweighted decibels (dB); and
Audio data continuously in *.wav format files.
Each SLM used during the survey was calibrated with a Brüel and Kjær Type 4231 calibrator immediately before
and after each monitoring period to ensure the SLM’s variance was within 1 dB. The calibration data was logged
by the meter and calibration results were recorded in the field notes. The recordings of calibration signals are
documented in Appendix A.
Directive 038 requires that monitoring be conducted under meteorological conditions acceptable for noise
measurement, which includes restrictions on maximum wind speed and the absence of active precipitation
(Alberta Energy and Utilities Board, 2007). During the survey, weather data was collected using Nielsen-
Kellerman Kestrel 4500 pocket weather meters deployed near the noise monitoring sites. The weather meters
were set up to record wind speed, wind direction, temperature, barometric pressure, and relative humidity data
every two minutes. Data from the weather meters were used to screen the collected noise data based on the
weather condition requirements outlined in Directive 038. In addition, direct observations and field notes
including information regarding precipitation, cloud cover, wind direction, and audible noise sources were
prepared by members of the survey team and used in the data analysis.
The SLM microphone was deployed at a height of approximately 1.5 m above ground and at a minimum
distance of 15 m from the nearby residence to minimize potential impact of reflections on the measured noise
level. At the monitoring locations where a weather meter was deployed, it was set at the same height and
approximately 10 m away from the SLM. A separation of 10 m was small enough to provide consistent weather
conditions at the two locations, but large enough so that the weather meter’s spinning wind sensor would not be
audible at the SLM.
2.3 Data Analysis Approach Data recorded at each of the four monitoring sites were downloaded to a computer for analysis with the Brüel
and Kjær BZ5503 software program. In keeping with the requirements of Directive 038, the data were analyzed
in the context of both broadband noise and low frequency noise (LFN).

13 August 2018 1314220049-136-R-Rev0
5
2.3.1 Broadband Noise Analysis Approach
Directive 038 requires noise data be collected under appropriate weather conditions including the absence of
precipitation, no snow, water, or ice ground cover, and wind speeds below specific thresholds. The survey was
conducted during the summer and therefore the ground surface was not covered by either snow or ice. Following
the guidance of Directive 038, a maximum wind speed of 15 km/h (4.17 m/s) was used as the acceptable limit for
further analysis. Data collected when wind speed was less than 15 km/h was considered valid, while data
collected when wind speed was greater than 15 km/h was not. The 15 km/h limit allowed for the removal of
periods of high wind resulting in potential increased noise levels due to wind induced noise.
Furthermore, any noise data containing recordings of anomalous or abnormal noise sources not representative
of the existing acoustical environment was removed as invalid. Anomalous or abnormal noise sources identified
and subsequently removed included:
Localized technician activities;
People and dogs near the monitoring site;
Idling truck engines; and
Noise generating equipment, such as dirt bikes, trucks, and gardening tools, very close to the monitoring site.
During the analysis of the data, specific anomalous noise events were identified mainly by listening to the sound
recordings. Other indicators used to identify sources of noise were time of day and field observations. Hourly
noise levels (Leq,1hr) were calculated for each hour of monitoring based on the valid one-minute data. The valid
hourly data was used to calculate daytime equivalent energy noise levels (Leq,day) and nighttime equivalent
energy noise levels (Leq,night) for each location – daytime being defined as the time period between 7:00 am and
10:00 pm, and nighttime as the time period between 10:00 pm and 7:00 am, in accordance with Directive 038
(Alberta Energy and Utilities Board, 2007).
A noise monitoring survey is considered to be acceptable under Directive 038 if there are a minimum of 180 valid
minutes during the daytime period and 180 valid minutes during the nighttime period.
2.3.2 Low Frequency Noise Analysis Approach
At each monitoring site, the presence or absence of an LFN issue was assessed using the 1/3 octave band
noise levels corresponding to all the valid one-minute data samples. The 1/3 octave band spectra corresponding
to each valid minute were energy averaged to obtain a 1/3 octave band spectrum for the daytime period and a
1/3 octave band spectrum for the nighttime period.
Directive 038 specifies two criteria that must be used to identify a LFN issue:
Comparison of the dBA and dBC levels; and
Presence of a distinct tonal component below 250 Hz.

13 August 2018 1314220049-136-R-Rev0
6
To obtain dBA and dBC levels, A-weights and C-weights were separately applied to the daytime and nighttime
1/3 octave band spectra. The dBA results were then subtracted from the dBC results for comparison to the LFN
criteria outlined in Directive 038. In accordance with the Directive 038 tone criteria, the daytime and nighttime 1/3
octave band spectra were used to check for the presence of a tone below 250 Hz.
3.0 RESULTS This section presents the results obtained during baseline noise monitoring at receptor sites associated with the
Project.
3.1 Monitoring Site R1 This section presents the results obtained for monitoring site R1.
3.1.1 Broadband Noise
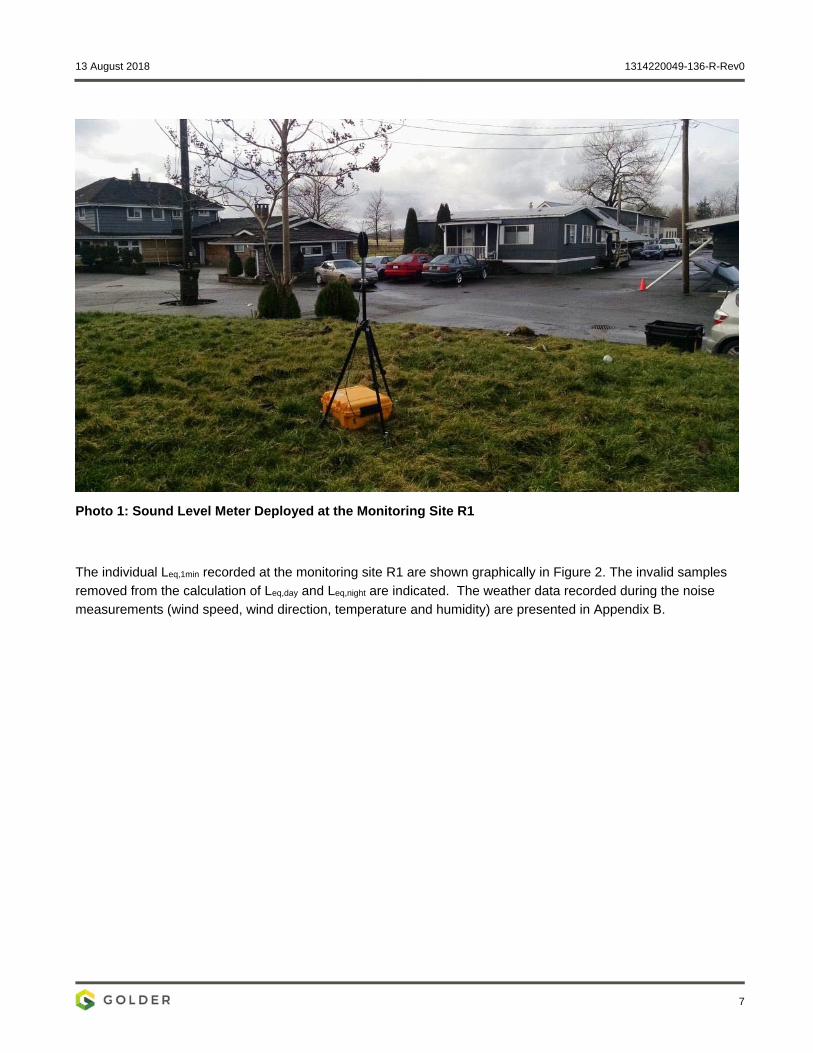
The monitoring site R1 was located 440 m south of the Project boundary, approximately 75 m south of River
Road. The ground surface within the area surrounding the SLM was covered by grass.
The noise level at the monitoring site R1 was predominantly influenced by vehicle traffic on nearby River Road.
In addition, the noise level was intermittently affected by airplane traffic.
Invalid noise events removed from the monitored data included technician activities, trucks near the SLM
microphone, and a dog barking near the SLM microphone. The sound monitoring equipment deployed at the
monitoring site R1 is shown in Photo 1.
13 August 2018 1314220049-136-R-Rev0
7
Photo 1: Sound Level Meter Deployed at the Monitoring Site R1
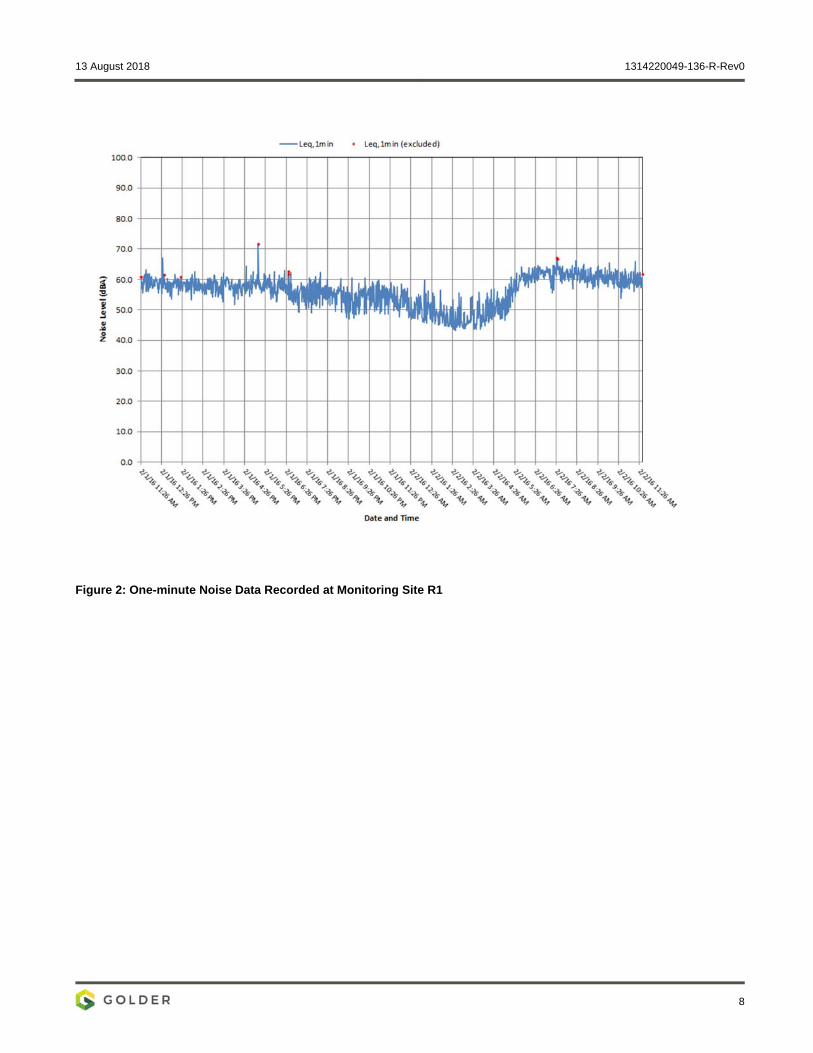
The individual Leq,1min recorded at the monitoring site R1 are shown graphically in Figure 2. The invalid samples
removed from the calculation of Leq,day and Leq,night are indicated. The weather data recorded during the noise
measurements (wind speed, wind direction, temperature and humidity) are presented in Appendix B.
13 August 2018 1314220049-136-R-Rev0
8
Figure 2: One-minute Noise Data Recorded at Monitoring Site R1
13 August 2018 1314220049-136-R-Rev0
9
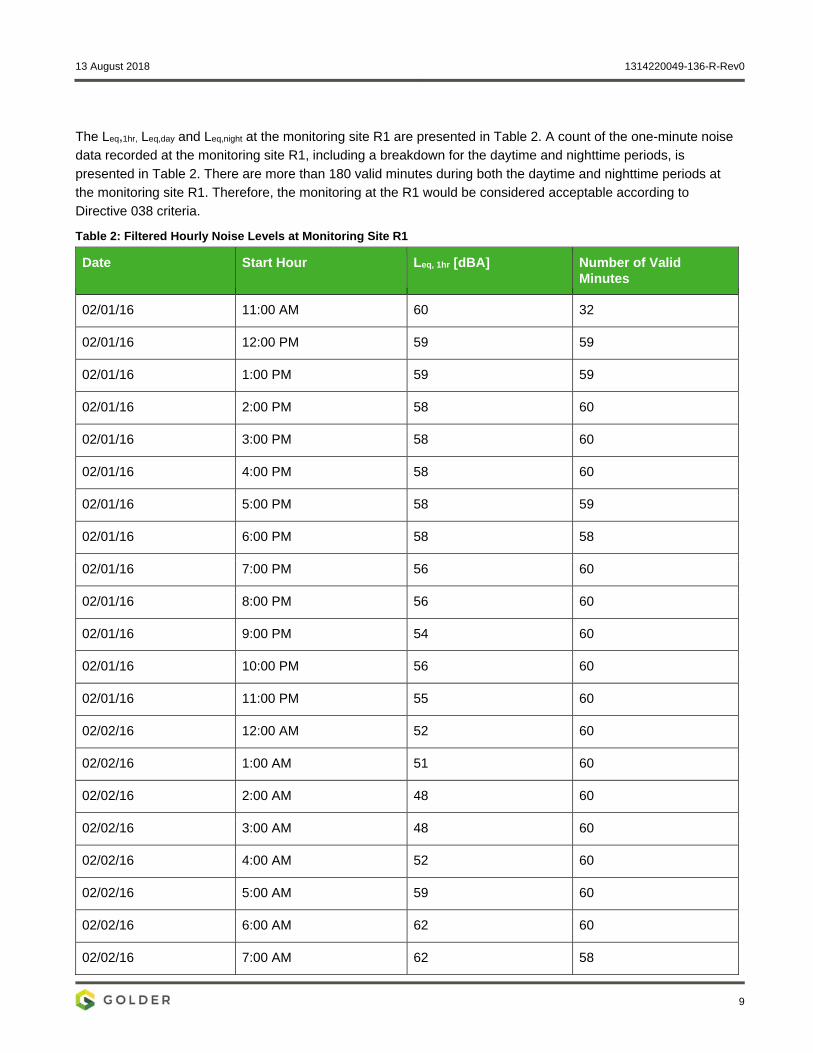
The Leq,1hr, Leq,day and Leq,night at the monitoring site R1 are presented in Table 2. A count of the one-minute noise
data recorded at the monitoring site R1, including a breakdown for the daytime and nighttime periods, is
presented in Table 2. There are more than 180 valid minutes during both the daytime and nighttime periods at
the monitoring site R1. Therefore, the monitoring at the R1 would be considered acceptable according to
Directive 038 criteria.
Table 2: Filtered Hourly Noise Levels at Monitoring Site R1
Date Start Hour Leq, 1hr [dBA] Number of Valid Minutes
02/01/16 11:00 AM 60 32
02/01/16 12:00 PM 59 59
02/01/16 1:00 PM 59 59
02/01/16 2:00 PM 58 60
02/01/16 3:00 PM 58 60
02/01/16 4:00 PM 58 60
02/01/16 5:00 PM 58 59
02/01/16 6:00 PM 58 58
02/01/16 7:00 PM 56 60
02/01/16 8:00 PM 56 60
02/01/16 9:00 PM 54 60
02/01/16 10:00 PM 56 60
02/01/16 11:00 PM 55 60
02/02/16 12:00 AM 52 60
02/02/16 1:00 AM 51 60
02/02/16 2:00 AM 48 60
02/02/16 3:00 AM 48 60
02/02/16 4:00 AM 52 60
02/02/16 5:00 AM 59 60
02/02/16 6:00 AM 62 60
02/02/16 7:00 AM 62 58
13 August 2018 1314220049-136-R-Rev0
10
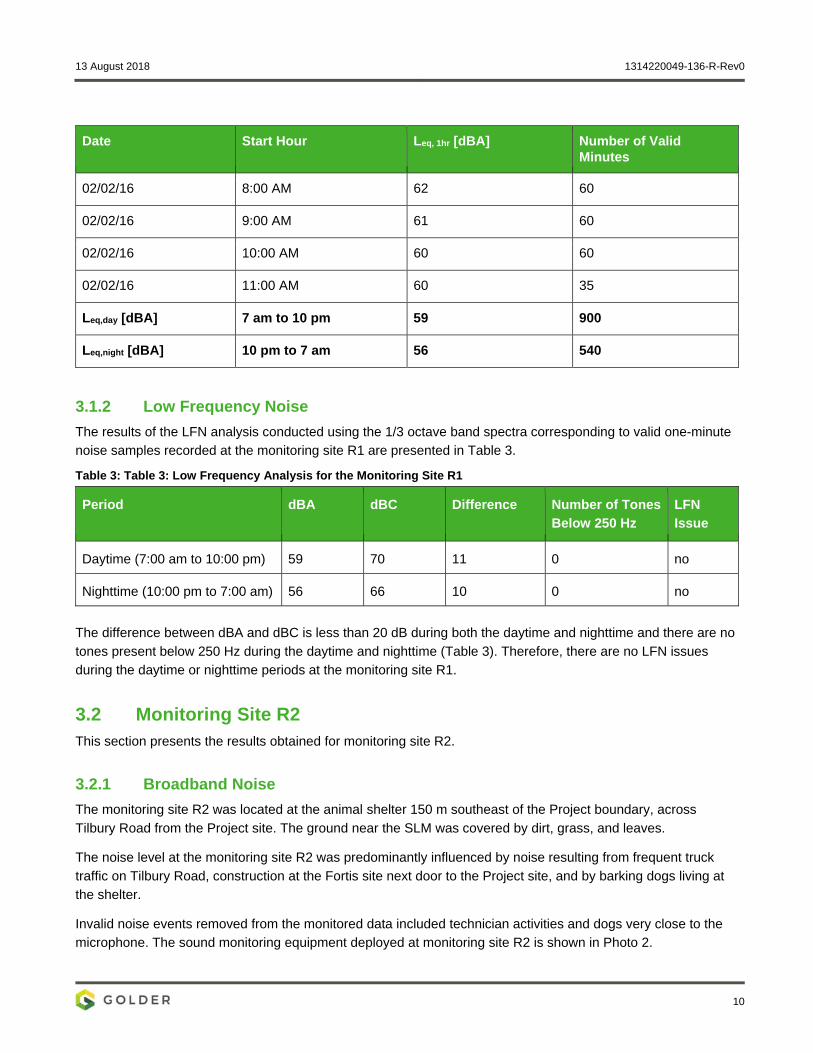
Date Start Hour Leq, 1hr [dBA] Number of Valid Minutes
02/02/16 8:00 AM 62 60
02/02/16 9:00 AM 61 60
02/02/16 10:00 AM 60 60
02/02/16 11:00 AM 60 35
Leq,day [dBA] 7 am to 10 pm 59 900
Leq,night [dBA] 10 pm to 7 am 56 540
3.1.2 Low Frequency Noise
The results of the LFN analysis conducted using the 1/3 octave band spectra corresponding to valid one-minute
noise samples recorded at the monitoring site R1 are presented in Table 3.
Table 3: Table 3: Low Frequency Analysis for the Monitoring Site R1
Period dBA dBC Difference Number of Tones
Below 250 Hz
LFN
Issue
Daytime (7:00 am to 10:00 pm) 59 70 11 0 no
Nighttime (10:00 pm to 7:00 am) 56 66 10 0 no
The difference between dBA and dBC is less than 20 dB during both the daytime and nighttime and there are no
tones present below 250 Hz during the daytime and nighttime (Table 3). Therefore, there are no LFN issues
during the daytime or nighttime periods at the monitoring site R1.
3.2 Monitoring Site R2 This section presents the results obtained for monitoring site R2.
3.2.1 Broadband Noise
The monitoring site R2 was located at the animal shelter 150 m southeast of the Project boundary, across
Tilbury Road from the Project site. The ground near the SLM was covered by dirt, grass, and leaves.
The noise level at the monitoring site R2 was predominantly influenced by noise resulting from frequent truck
traffic on Tilbury Road, construction at the Fortis site next door to the Project site, and by barking dogs living at
the shelter.
Invalid noise events removed from the monitored data included technician activities and dogs very close to the
microphone. The sound monitoring equipment deployed at monitoring site R2 is shown in Photo 2.

13 August 2018 1314220049-136-R-Rev0
11
Photo 2: Sound Level Meter Deployed at the Monitoring Site R2
The individual Leq,1min recorded at the monitoring site R2 are shown graphically in Figure 3. The invalid samples
removed from the calculation of Leq,day and Leq,night are indicated.

13 August 2018 1314220049-136-R-Rev0
12
Figure 3: One-minute Noise Data Recorded at Monitoring Site R2

13 August 2018 1314220049-136-R-Rev0
1
The Leq,1hr, Leq,day and Leq,night at monitoring site R2 are presented in Table 4. A count of the one-minute noise data
recorded at the monitoring site R2, including a breakdown for the daytime and nighttime periods, is presented in
Table 4. There are more than 180 valid minutes during both the daytime and nighttime periods at the monitoring
site R2. Therefore, the monitoring at the R2 would be considered acceptable according to Directive 038 criteria.
Table 4: Filtered Hourly Noise Levels at Monitoring Site R2
Date Start Hour Leq, 1hr [dBA] Number of Valid Minutes
10/01/15 2:00 PM 51 4
10/01/15 3:00 PM 52 60
10/01/15 4:00 PM 52 59
10/01/15 5:00 PM 50 60
10/01/15 6:00 PM 52 60
10/01/15 7:00 PM 55 59
10/01/15 8:00 PM 51 60
10/01/15 9:00 PM 57 60
10/01/15 10:00 PM 52 60
10/01/15 11:00 PM 53 60
10/02/15 12:00 AM 51 60
10/02/15 1:00 AM 49 60
10/02/15 2:00 AM 51 60
10/02/15 3:00 AM 48 60
10/02/15 4:00 AM 47 60
10/02/15 5:00 AM 48 60
10/02/15 6:00 AM 53 60
10/02/15 7:00 AM 55 60
10/02/15 8:00 AM 54 60
10/02/15 9:00 AM 55 60
10/02/15 10:00 AM 57 60
13 August 2018 1314220049-136-R-Rev0
2
Date Start Hour Leq, 1hr [dBA] Number of Valid Minutes
10/02/15 11:00 AM 55 60
10/02/15 12:00 PM 54 60
10/02/15 1:00 PM 53 60
10/02/15 2:00 PM 54 41
Leq,day [dBA] 7 am to 10 pm 54 883
Leq,night [dBA] 10 pm to 7 am 51 540
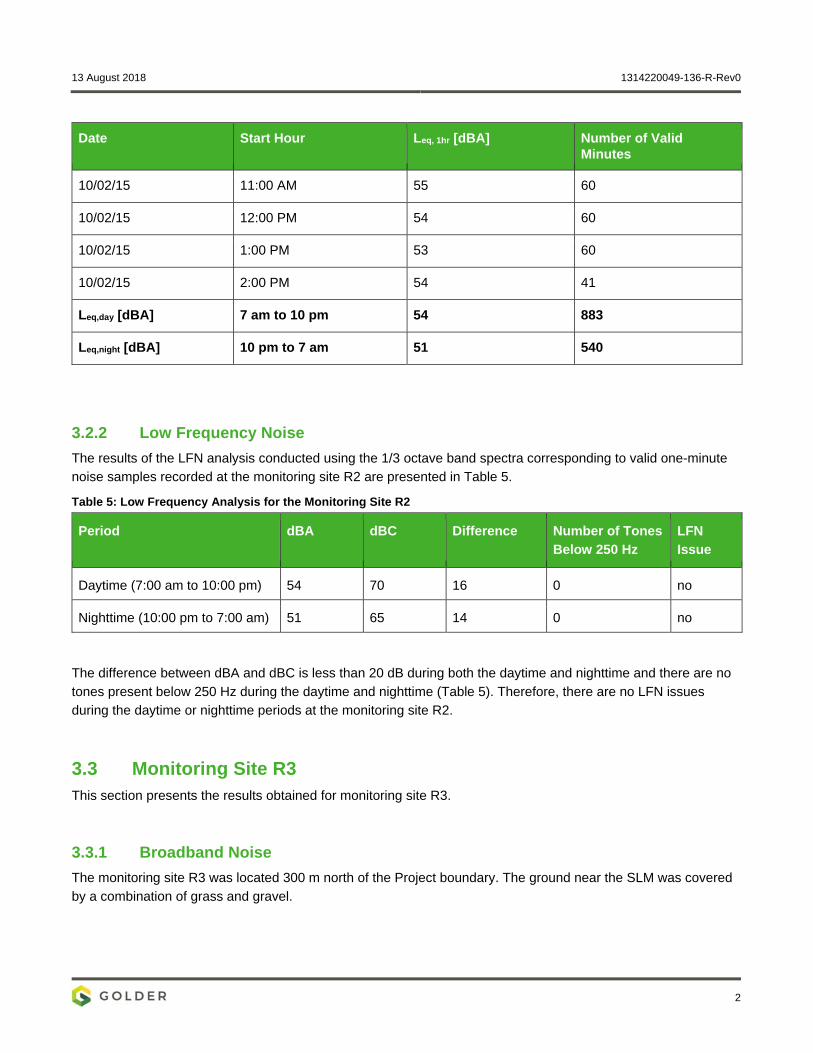
3.2.2 Low Frequency Noise
The results of the LFN analysis conducted using the 1/3 octave band spectra corresponding to valid one-minute
noise samples recorded at the monitoring site R2 are presented in Table 5.
Table 5: Low Frequency Analysis for the Monitoring Site R2
Period dBA dBC Difference Number of Tones
Below 250 Hz
LFN
Issue
Daytime (7:00 am to 10:00 pm) 54 70 16 0 no
Nighttime (10:00 pm to 7:00 am) 51 65 14 0 no
The difference between dBA and dBC is less than 20 dB during both the daytime and nighttime and there are no
tones present below 250 Hz during the daytime and nighttime (Table 5). Therefore, there are no LFN issues
during the daytime or nighttime periods at the monitoring site R2.
3.3 Monitoring Site R3 This section presents the results obtained for monitoring site R3.
3.3.1 Broadband Noise
The monitoring site R3 was located 300 m north of the Project boundary. The ground near the SLM was covered
by a combination of grass and gravel.
13 August 2018 1314220049-136-R-Rev0
3
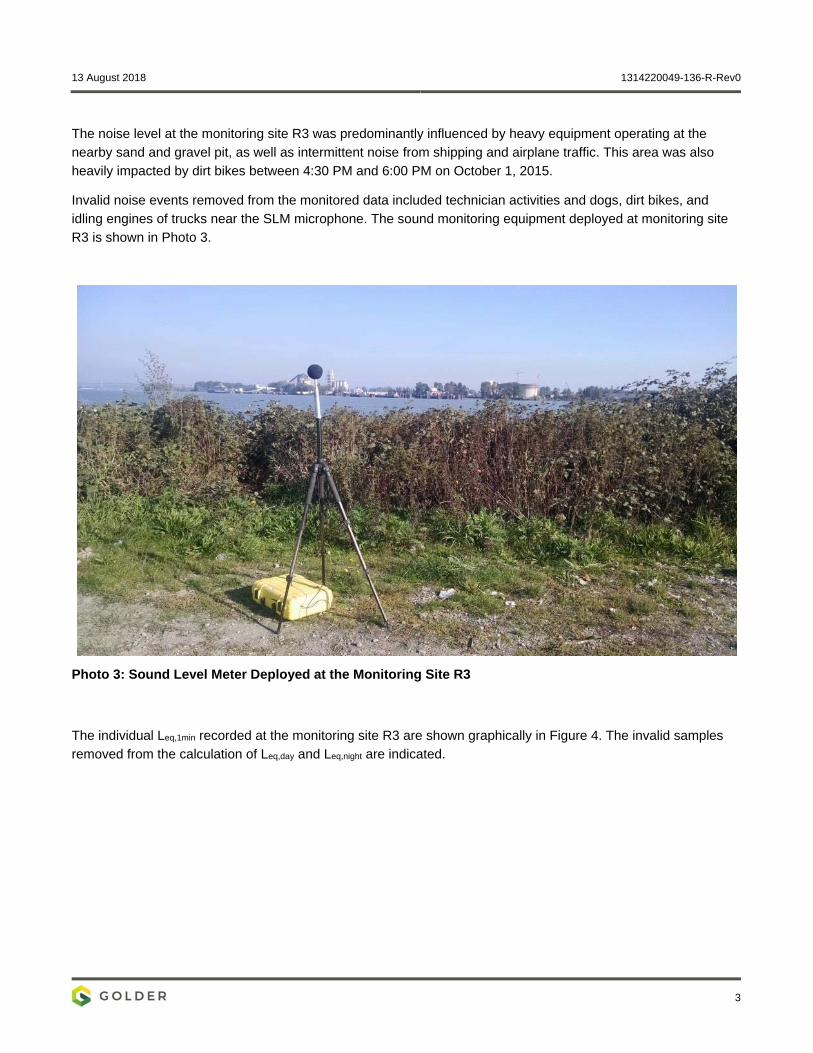
The noise level at the monitoring site R3 was predominantly influenced by heavy equipment operating at the
nearby sand and gravel pit, as well as intermittent noise from shipping and airplane traffic. This area was also
heavily impacted by dirt bikes between 4:30 PM and 6:00 PM on October 1, 2015.
Invalid noise events removed from the monitored data included technician activities and dogs, dirt bikes, and
idling engines of trucks near the SLM microphone. The sound monitoring equipment deployed at monitoring site
R3 is shown in Photo 3.
Photo 3: Sound Level Meter Deployed at the Monitoring Site R3
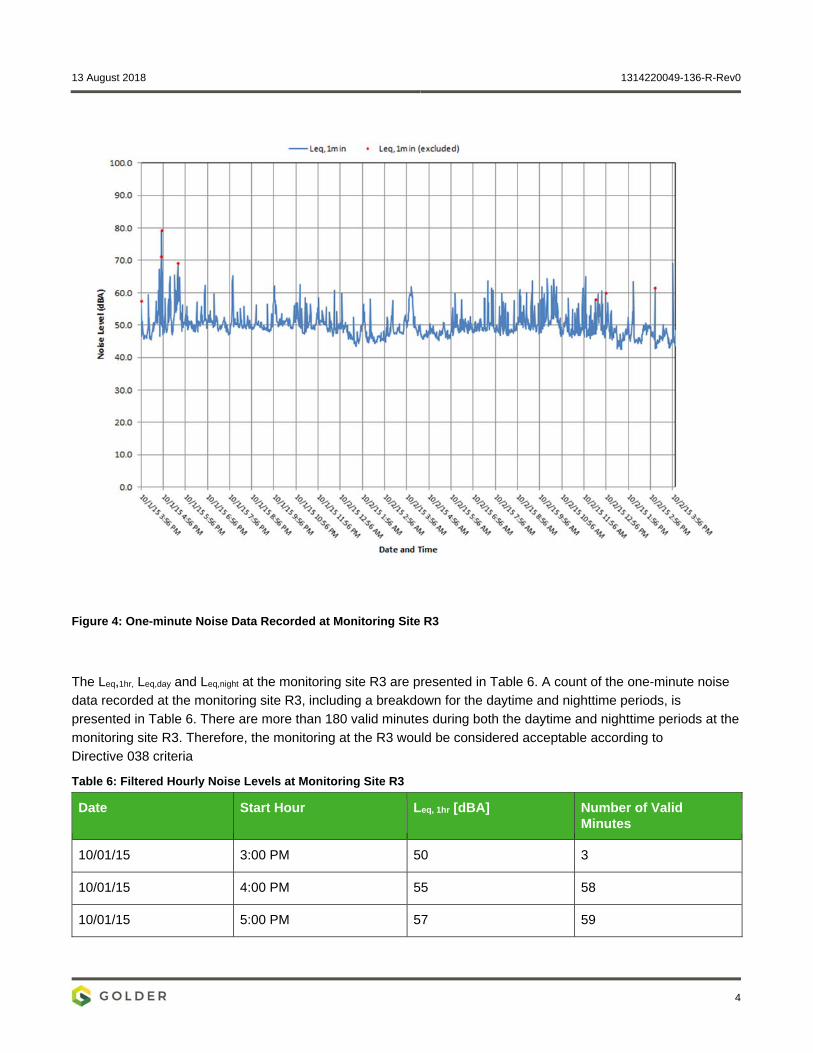
The individual Leq,1min recorded at the monitoring site R3 are shown graphically in Figure 4. The invalid samples
removed from the calculation of Leq,day and Leq,night are indicated.
13 August 2018 1314220049-136-R-Rev0
4
Figure 4: One-minute Noise Data Recorded at Monitoring Site R3
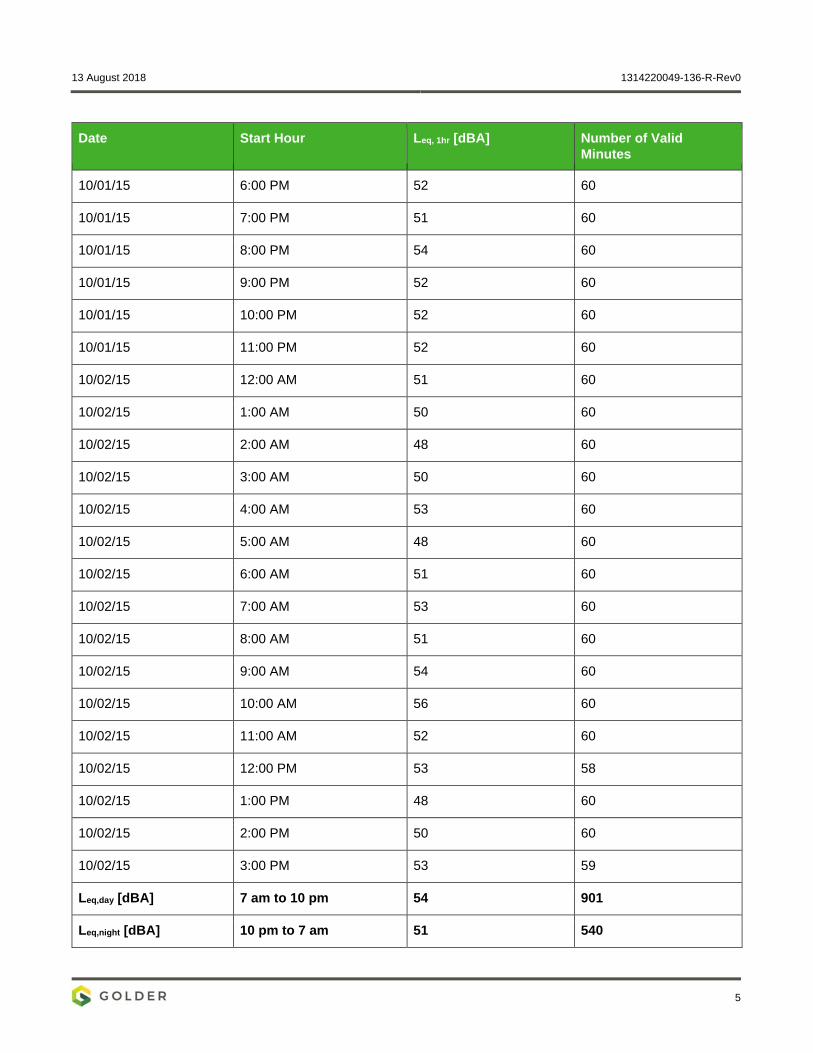
The Leq,1hr, Leq,day and Leq,night at the monitoring site R3 are presented in Table 6. A count of the one-minute noise
data recorded at the monitoring site R3, including a breakdown for the daytime and nighttime periods, is
presented in Table 6. There are more than 180 valid minutes during both the daytime and nighttime periods at the
monitoring site R3. Therefore, the monitoring at the R3 would be considered acceptable according to
Directive 038 criteria
Table 6: Filtered Hourly Noise Levels at Monitoring Site R3
Date Start Hour Leq, 1hr [dBA] Number of Valid Minutes
10/01/15 3:00 PM 50 3
10/01/15 4:00 PM 55 58
10/01/15 5:00 PM 57 59
13 August 2018 1314220049-136-R-Rev0
5
Date Start Hour Leq, 1hr [dBA] Number of Valid Minutes
10/01/15 6:00 PM 52 60
10/01/15 7:00 PM 51 60
10/01/15 8:00 PM 54 60
10/01/15 9:00 PM 52 60
10/01/15 10:00 PM 52 60
10/01/15 11:00 PM 52 60
10/02/15 12:00 AM 51 60
10/02/15 1:00 AM 50 60
10/02/15 2:00 AM 48 60
10/02/15 3:00 AM 50 60
10/02/15 4:00 AM 53 60
10/02/15 5:00 AM 48 60
10/02/15 6:00 AM 51 60
10/02/15 7:00 AM 53 60
10/02/15 8:00 AM 51 60
10/02/15 9:00 AM 54 60
10/02/15 10:00 AM 56 60
10/02/15 11:00 AM 52 60
10/02/15 12:00 PM 53 58
10/02/15 1:00 PM 48 60
10/02/15 2:00 PM 50 60
10/02/15 3:00 PM 53 59
Leq,day [dBA] 7 am to 10 pm 54 901
Leq,night [dBA] 10 pm to 7 am 51 540
13 August 2018 1314220049-136-R-Rev0
6
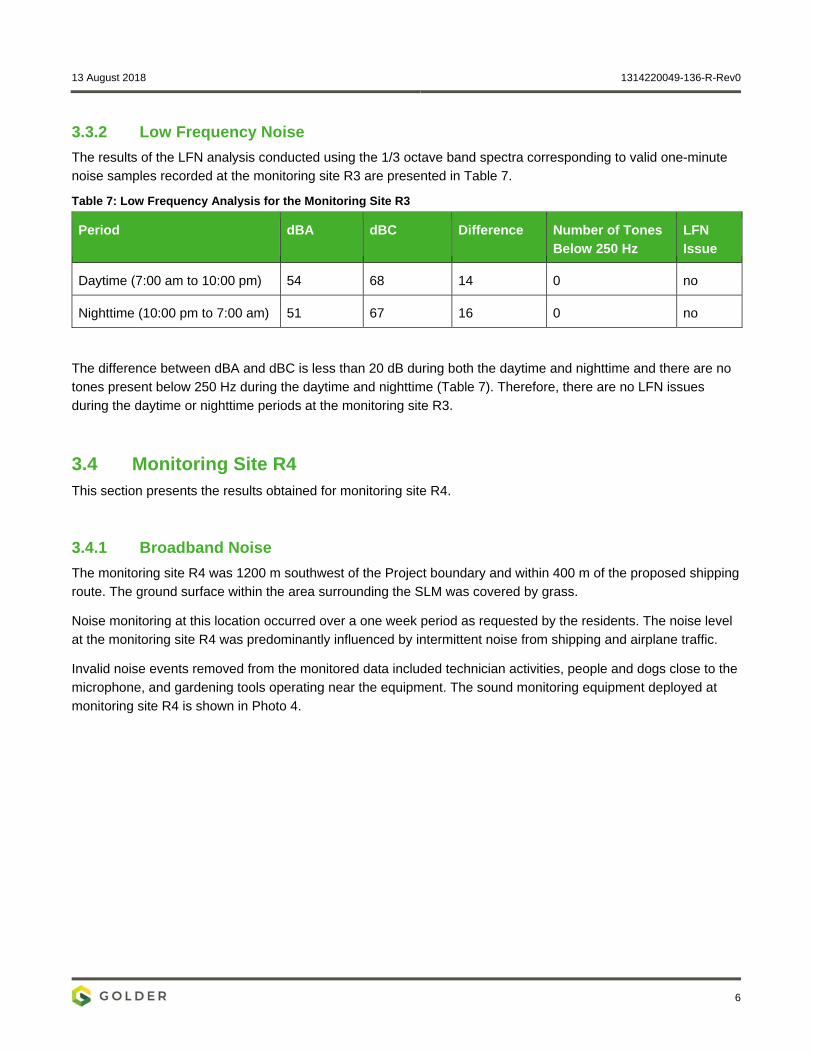
3.3.2 Low Frequency Noise
The results of the LFN analysis conducted using the 1/3 octave band spectra corresponding to valid one-minute
noise samples recorded at the monitoring site R3 are presented in Table 7.
Table 7: Low Frequency Analysis for the Monitoring Site R3
Period dBA dBC Difference Number of Tones
Below 250 Hz
LFN
Issue
Daytime (7:00 am to 10:00 pm) 54 68 14 0 no
Nighttime (10:00 pm to 7:00 am) 51 67 16 0 no
The difference between dBA and dBC is less than 20 dB during both the daytime and nighttime and there are no
tones present below 250 Hz during the daytime and nighttime (Table 7). Therefore, there are no LFN issues
during the daytime or nighttime periods at the monitoring site R3.
3.4 Monitoring Site R4 This section presents the results obtained for monitoring site R4.
3.4.1 Broadband Noise
The monitoring site R4 was 1200 m southwest of the Project boundary and within 400 m of the proposed shipping
route. The ground surface within the area surrounding the SLM was covered by grass.
Noise monitoring at this location occurred over a one week period as requested by the residents. The noise level
at the monitoring site R4 was predominantly influenced by intermittent noise from shipping and airplane traffic.
Invalid noise events removed from the monitored data included technician activities, people and dogs close to the
microphone, and gardening tools operating near the equipment. The sound monitoring equipment deployed at
monitoring site R4 is shown in Photo 4.

13 August 2018 1314220049-136-R-Rev0
7
Photo 4: Sound Level Meter Deployed at the Monitoring Site R4
The individual Leq,1min recorded at the monitoring site R4 are shown graphically in Figure 5. The invalid samples
removed from the calculation of Leq,day and Leq,night are indicated. The weather data recorded during the noise
measurements (wind speed, wind direction, temperature and humidity) are presented in Appendix B.

13 August 2018 1314220049-136-R-Rev0
8
Figure 5: One-minute Noise Data Recorded at Monitoring Site R4
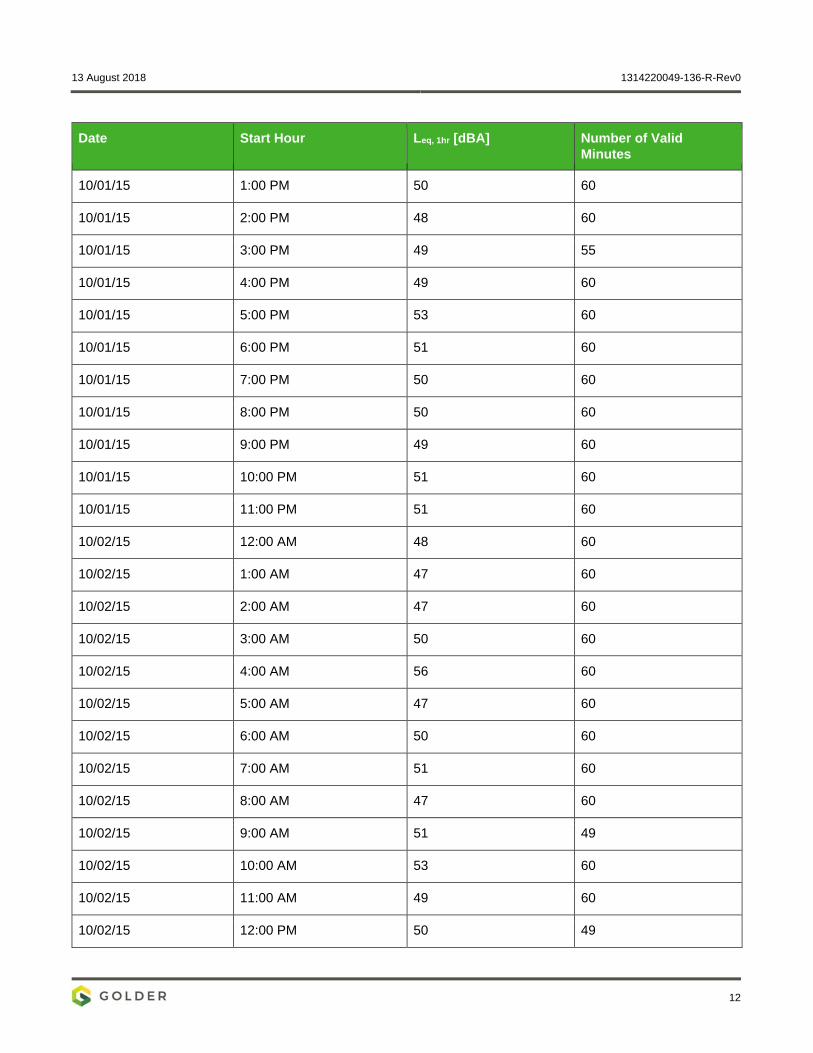
The Leq,1hr, Leq,day and Leq,night at the monitoring site R4 are presented in Table 8. A count of the one-minute noise
data recorded at the monitoring site R4, including a breakdown for the daytime and nighttime periods, is
presented in Table 8. There are more than 180 valid minutes during both the daytime and nighttime periods at the
monitoring site R4. Therefore, the monitoring at the R4 would be considered acceptable according to
Directive 038 criteria.
Table 8: Filtered Hourly Noise Levels at Monitoring Site R4
Date Start Hour Leq, 1hr [dBA] Number of Valid Minutes
09/28/15 10:00 AM 43 14
09/28/15 11:00 AM 43 60
09/28/15 12:00 PM 42 60

13 August 2018 1314220049-136-R-Rev0
9
Date Start Hour Leq, 1hr [dBA] Number of Valid Minutes
09/28/15 1:00 PM 48 60
09/28/15 2:00 PM 46 59
09/28/15 3:00 PM 48 60
09/28/15 4:00 PM 46 60
09/28/15 5:00 PM 46 60
09/28/15 6:00 PM 45 60
09/28/15 7:00 PM 47 60
09/28/15 8:00 PM 48 60
09/28/15 9:00 PM 54 60
09/28/15 10:00 PM 49 60
09/28/15 11:00 PM 50 60
09/29/15 12:00 AM 49 60
09/29/15 1:00 AM 48 60
09/29/15 2:00 AM 44 60
09/29/15 3:00 AM 46 59
09/29/15 4:00 AM 45 60
09/29/15 5:00 AM 50 60
09/29/15 6:00 AM 53 60
09/29/15 7:00 AM 57 60
09/29/15 8:00 AM 52 60
09/29/15 9:00 AM 49 60
09/29/15 10:00 AM 43 60
09/29/15 11:00 AM 44 59
09/29/15 12:00 PM 46 60

13 August 2018 1314220049-136-R-Rev0
10
Date Start Hour Leq, 1hr [dBA] Number of Valid Minutes
09/29/15 1:00 PM 47 60
09/29/15 2:00 PM 50 60
09/29/15 3:00 PM 48 60
09/29/15 4:00 PM 51 59
09/29/15 5:00 PM 53 58
09/29/15 6:00 PM 47 60
09/29/15 7:00 PM 47 59
09/29/15 8:00 PM 49 60
09/29/15 9:00 PM 50 60
09/29/15 10:00 PM 47 60
09/29/15 11:00 PM 49 60
09/30/15 12:00 AM 48 60
09/30/15 1:00 AM 49 60
09/30/15 2:00 AM 45 60
09/30/15 3:00 AM 56 60
09/30/15 4:00 AM 55 60
09/30/15 5:00 AM 51 60
09/30/15 6:00 AM 52 60
09/30/15 7:00 AM 55 60
09/30/15 8:00 AM 53 60
09/30/15 9:00 AM 51 60
09/30/15 10:00 AM 52 60
09/30/15 11:00 AM 49 60
09/30/15 12:00 PM 46 60

13 August 2018 1314220049-136-R-Rev0
11
Date Start Hour Leq, 1hr [dBA] Number of Valid Minutes
09/30/15 1:00 PM 48 60
09/30/15 2:00 PM 48 60
09/30/15 3:00 PM 48 60
09/30/15 4:00 PM 49 60
09/30/15 5:00 PM 49 60
09/30/15 6:00 PM 47 60
09/30/15 7:00 PM 50 60
09/30/15 8:00 PM 47 60
09/30/15 9:00 PM 54 60
09/30/15 10:00 PM 52 60
09/30/15 11:00 PM 50 60
10/01/15 12:00 AM 49 60
10/01/15 1:00 AM 46 60
10/01/15 2:00 AM 49 31
10/01/15 3:00 AM 46 33
10/01/15 4:00 AM 46 60
10/01/15 5:00 AM 45 60
10/01/15 6:00 AM 51 60
10/01/15 7:00 AM 56 60
10/01/15 8:00 AM 55 60
10/01/15 9:00 AM 50 60
10/01/15 10:00 AM 58 60
10/01/15 11:00 AM 46 60
10/01/15 12:00 PM 44 60
13 August 2018 1314220049-136-R-Rev0
12
Date Start Hour Leq, 1hr [dBA] Number of Valid Minutes
10/01/15 1:00 PM 50 60
10/01/15 2:00 PM 48 60
10/01/15 3:00 PM 49 55
10/01/15 4:00 PM 49 60
10/01/15 5:00 PM 53 60
10/01/15 6:00 PM 51 60
10/01/15 7:00 PM 50 60
10/01/15 8:00 PM 50 60
10/01/15 9:00 PM 49 60
10/01/15 10:00 PM 51 60
10/01/15 11:00 PM 51 60
10/02/15 12:00 AM 48 60
10/02/15 1:00 AM 47 60
10/02/15 2:00 AM 47 60
10/02/15 3:00 AM 50 60
10/02/15 4:00 AM 56 60
10/02/15 5:00 AM 47 60
10/02/15 6:00 AM 50 60
10/02/15 7:00 AM 51 60
10/02/15 8:00 AM 47 60
10/02/15 9:00 AM 51 49
10/02/15 10:00 AM 53 60
10/02/15 11:00 AM 49 60
10/02/15 12:00 PM 50 49

13 August 2018 1314220049-136-R-Rev0
13
Date Start Hour Leq, 1hr [dBA] Number of Valid Minutes
10/02/15 1:00 PM 45 60
10/02/15 2:00 PM 46 60
10/02/15 3:00 PM 54 57
10/02/15 4:00 PM 48 60
10/02/15 5:00 PM 48 60
10/02/15 6:00 PM 53 60
10/02/15 7:00 PM 50 60
10/02/15 8:00 PM 48 60
10/02/15 9:00 PM 50 60
10/02/15 10:00 PM 44 58
10/02/15 11:00 PM 47 60
10/03/15 12:00 AM 42 60
10/03/15 1:00 AM 45 60
10/03/15 2:00 AM 43 60
10/03/15 3:00 AM 38 60
10/03/15 4:00 AM 40 60
10/03/15 5:00 AM 38 60
10/03/15 6:00 AM 45 60
10/03/15 7:00 AM 55 60
10/03/15 8:00 AM 46 60
10/03/15 9:00 AM 44 60
10/03/15 10:00 AM 45 60
10/03/15 11:00 AM 50 60
10/03/15 12:00 PM 45 60

13 August 2018 1314220049-136-R-Rev0
14
Date Start Hour Leq, 1hr [dBA] Number of Valid Minutes
10/03/15 1:00 PM 46 60
10/03/15 2:00 PM 46 60
10/03/15 3:00 PM 47 60
10/03/15 4:00 PM 48 60
10/03/15 5:00 PM 43 60
10/03/15 6:00 PM 54 60
10/03/15 7:00 PM 46 58
10/03/15 8:00 PM 45 60
10/03/15 9:00 PM 46 60
10/03/15 10:00 PM 49 60
10/03/15 11:00 PM 49 60
10/04/15 12:00 AM 51 60
10/04/15 1:00 AM 43 60
10/04/15 2:00 AM 42 60
10/04/15 3:00 AM 44 59
10/04/15 4:00 AM 40 60
10/04/15 5:00 AM 56 60
10/04/15 6:00 AM 46 60
10/04/15 7:00 AM 51 60
10/04/15 8:00 AM 49 60
10/04/15 9:00 AM 46 60
10/04/15 10:00 AM 43 60
10/04/15 11:00 AM 42 60
10/04/15 12:00 PM 44 60

13 August 2018 1314220049-136-R-Rev0
15
Date Start Hour Leq, 1hr [dBA] Number of Valid Minutes
10/04/15 1:00 PM 45 60
10/04/15 2:00 PM 50 59
10/04/15 3:00 PM 46 60
10/04/15 4:00 PM 44 59
10/04/15 5:00 PM 42 60
10/04/15 6:00 PM 50 60
10/04/15 7:00 PM 45 60
10/04/15 8:00 PM 48 60
10/04/15 9:00 PM 46 60
10/04/15 10:00 PM 49 60
10/04/15 11:00 PM 49 60
10/05/15 12:00 AM 48 60
10/05/15 1:00 AM 46 60
10/05/15 2:00 AM 43 60
10/05/15 3:00 AM 41 60
10/05/15 4:00 AM 42 60
10/05/15 5:00 AM 56 60
10/05/15 6:00 AM 52 60
10/05/15 7:00 AM 53 60
10/05/15 8:00 AM 52 60
10/05/15 9:00 AM 48 60
10/05/15 10:00 AM 49 47
Leq,day [dBA] 7 am to 10 pm 50 6,261
Leq,night [dBA] 10 pm to 7 am 50 3,720

13 August 2018 1314220049-136-R-Rev0
16
3.4.2 Low Frequency Noise
The results of the LFN analysis conducted using the 1/3 octave band spectra corresponding to valid one-minute
noise samples recorded at the monitoring site R4 are presented in Table 9.
Table 9: Low Frequency Analysis for the Monitoring Site R4
Period dBA dBC Difference Number of Tones
Below 250 Hz
LFN
Issue
Daytime (7:00 am to 10:00 pm) 50 66 16 0 no
Nighttime (10:00 pm to 7:00 am) 50 66 16 1 no
The difference between dBA and dBC is less than 20 dB during both the daytime and nighttime (Table 9).
Therefore, there are no LFN issues during the daytime or nighttime periods at the monitoring site R4.
4.0 SUMMARY The results presented in Section 3 of this report indicate that the noise levels within the noise LAA and RAA are
already elevated due to presence of industrial and transportation noise sources. Based on the results presented
in Table 10, daytime noise levels measured at four receptors varied between 50 dBA and 59 dBA (9 dB), whereas
nighttime noise levels varied between 49 dBA and 56 dBA (7 dB). The difference between daytime and nighttime
noise levels can be explained by decreased road traffic during the nighttime period, which is evident at all
receptors but especially at R1 and R2. In addition, the maximum difference of 9 dB (daytime) and 7 dB (nighttime)
was identified between receptors R1 and R4. This difference can be attributed to lesser influence of traffic noise at
receptor R4 when compared to receptor R1.
The results of the LFN analysis indicate that at all monitoring sites no LFN issues were identified based on criteria
described in Directive 038.
Table 10: Daytime and Nighttime Noise Levels at WesPac Monitoring Sites
Noise Monitoring Site Leq,day [dBA] Leq, night [dBA]
R1 59 56
R2 54 51
R3 54 51
R4 50 50
13 August 2018 1314220049-136-R-Rev0
17
5.0 CLOSURE We trust that this baseline report is sufficient to characterize existing baseline conditions for noise in the LAA and
RAA. For any queries on the contents of this report, please do not hesitate to contact the undersigned.
Golder Associates Ltd.
Shira Daltrop, MASc Andrew Faszer, BSc, INCE, PEng
Acoustical Scientist Senior Acoustical Engineer
SD/AF/asd
Golder and the G logo are trademarks of Golder Associates Corporation
o:\final\2013\1422\13-1422-0049\1314220049-136-r-rev0\1314220049-136-r-rev0-tilbury noise baseline 13aug_18.docx
13 August 2018 1314220049-136-R-Rev0
18
6.0 REFERENCES Alberta Energy and Utilities Board. (2007, February). Directive 038: Noise Control.
British Columbia Oil and Gas Commission. (2009, March). British Columbia Noise Control Best Practices
Guideline.
13 August 2018 1314220049-136-R-Rev0
APPENDIX A
Calibration Data

APPENDIX A Calibration Record
1314220049-136-R-Rev013 August 2018
1
This Appendix presents the calibration results for the sound level meters used at the monitoring sites for the
baseline noise measurements. The Brüel and Kjær Type 4231 calibrator emits a 1,000 Hz tone at a sound
pressure level of 94 dB. For a calibration to be valid, the sound level meter must read 94 ± 1 dB.
At each monitoring site, an initial calibration is performed before the start of the sound level measurements and a
final calibration is performed after the sound level measurements are finished.
1.0 MONITORING SITE R1 Each of the sound level meter initial and final calibration measurements was at 94 ± 1 dB, as indicated on
Figure A-1 and Figure A-2, respectively, at the noise monitoring site R1.
Figure A-1: Monitoring Site R1: Initial Calibration
93
93.5
94
94.5
95
95.5
[dB]
WesPacR1001
11:22:40 AM2/1/2016
11:23:00 AM 11:23:20 AM 11:23:40 AM 11:24:00 AM 11:24:20 AM
Sound

APPENDIX A Calibration Record
1314220049-136-R-Rev013 August 2018
2
Figure A-2: Monitoring Site R1: Final Calibration
2.0 MONITORING SITE R2 Each of the sound level meter initial and final calibration measurements was at 94 ± 1 dB, as indicated on
Figure A-3 and Figure A-4, respectively, at the noise monitoring site R2.
Figure A-3: Monitoring Site R2: Initial Calibration
93
93.5
94
94.5
95
95.5[dB]
WesPacR1004
11:37:10 AM2/2/2016
11:37:20 AM 11:37:30 AM 11:37:40 AM 11:37:50 AM 11:38:00 AM
Sound
93
93.5
94
94.5
95
95.5
[dB]
WesPacR2001
2:42:10 PM10/1/2015
2:42:20 PM 2:42:30 PM 2:42:40 PM 2:42:50 PM 2:43:00 PM
Sound
APPENDIX A Calibration Record
1314220049-136-R-Rev013 August 2018
3
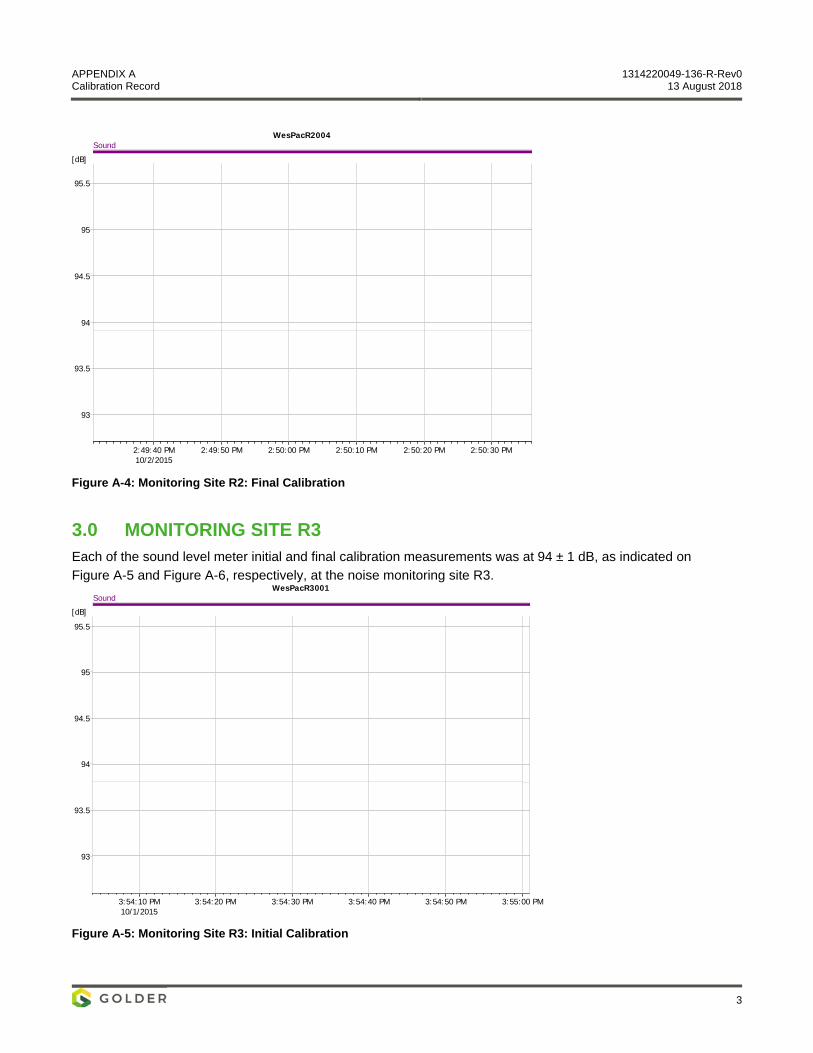
Figure A-4: Monitoring Site R2: Final Calibration
3.0 MONITORING SITE R3 Each of the sound level meter initial and final calibration measurements was at 94 ± 1 dB, as indicated on
Figure A-5 and Figure A-6, respectively, at the noise monitoring site R3.
Figure A-5: Monitoring Site R3: Initial Calibration
93
93.5
94
94.5
95
95.5
[dB]
WesPacR2004
2:49:40 PM10/2/2015
2:49:50 PM 2:50:00 PM 2:50:10 PM 2:50:20 PM 2:50:30 PM
Sound
93
93.5
94
94.5
95
95.5
[dB]
WesPacR3001
3:54:10 PM10/1/2015
3:54:20 PM 3:54:30 PM 3:54:40 PM 3:54:50 PM 3:55:00 PM
Sound
APPENDIX A Calibration Record
1314220049-136-R-Rev013 August 2018
4
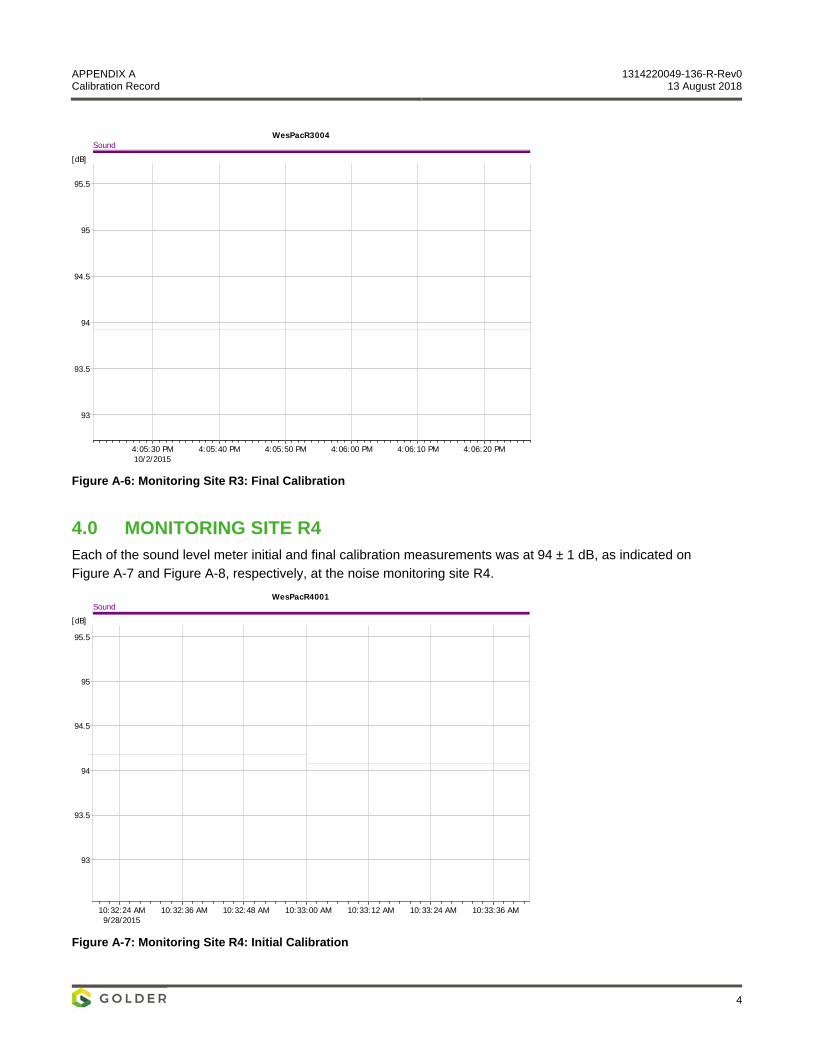
Figure A-6: Monitoring Site R3: Final Calibration
4.0 MONITORING SITE R4 Each of the sound level meter initial and final calibration measurements was at 94 ± 1 dB, as indicated on
Figure A-7 and Figure A-8, respectively, at the noise monitoring site R4.
Figure A-7: Monitoring Site R4: Initial Calibration
93
93.5
94
94.5
95
95.5
[dB]
WesPacR3004
4:05:30 PM10/2/2015
4:05:40 PM 4:05:50 PM 4:06:00 PM 4:06:10 PM 4:06:20 PM
Sound
93
93.5
94
94.5
95
95.5
[dB]
WesPacR4001
10:32:24 AM9/28/2015
10:32:36 AM 10:32:48 AM 10:33:00 AM 10:33:12 AM 10:33:24 AM 10:33:36 AM
Sound
APPENDIX A Calibration Record
1314220049-136-R-Rev013 August 2018
5
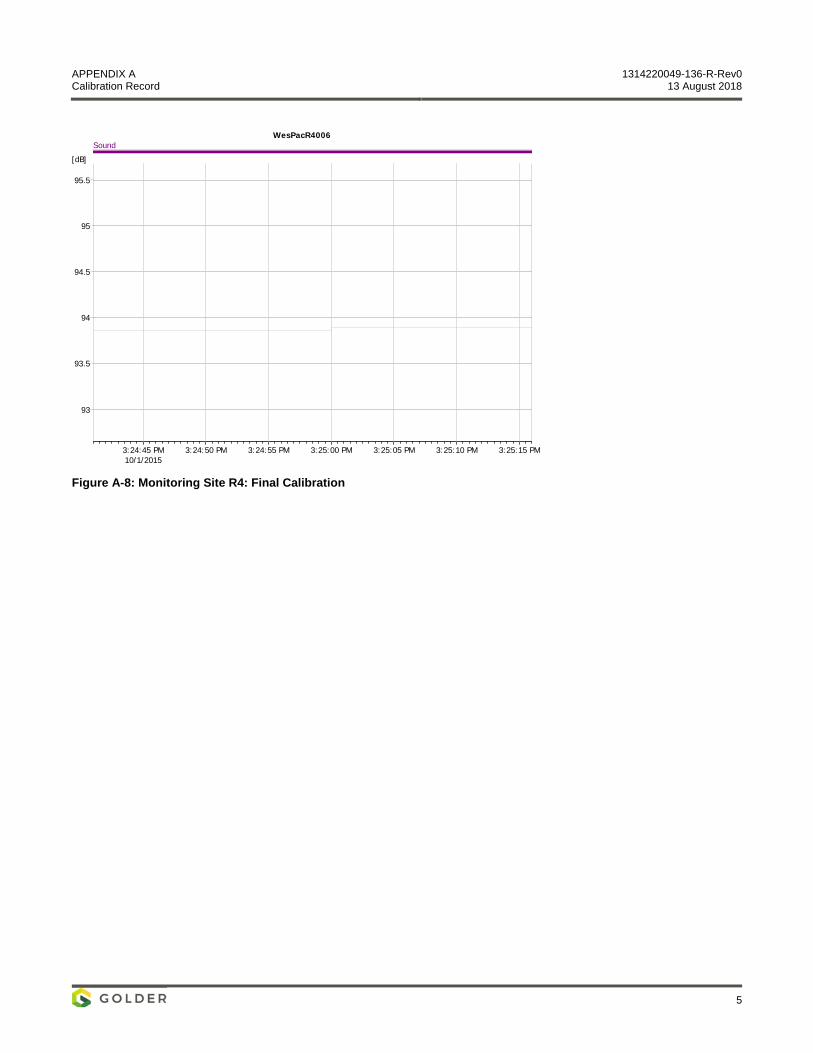
Figure A-8: Monitoring Site R4: Final Calibration
93
93.5
94
94.5
95
95.5
[dB]
WesPacR4006
3:24:45 PM10/1/2015
3:24:50 PM 3:24:55 PM 3:25:00 PM 3:25:05 PM 3:25:10 PM 3:25:15 PM
Sound
13 August 2018 1314220049-136-R-Rev0
APPENDIX B
Weather Data

APPENDIX B Weather Data
1314220049-136-R-Rev013 August 2018
1
Appendix B provides information regarding weather conditions observed during the noise baseline measurements
for the Project.
1.0 WEATHER DATA
1.1 Monitoring Site R1
Figure B-1: Wind Speed Recorded at Monitoring Site R1. Note the wind direction sensor malfunctioned during the monitoring period and therefore reliable wind direction was not measured.

APPENDIX B Weather Data
1314220049-136-R-Rev013 August 2018
2
Figure B-2: Temperature and Humidity Measured at Monitoring Site R1
APPENDIX B Weather Data
1314220049-136-R-Rev013 August 2018
3
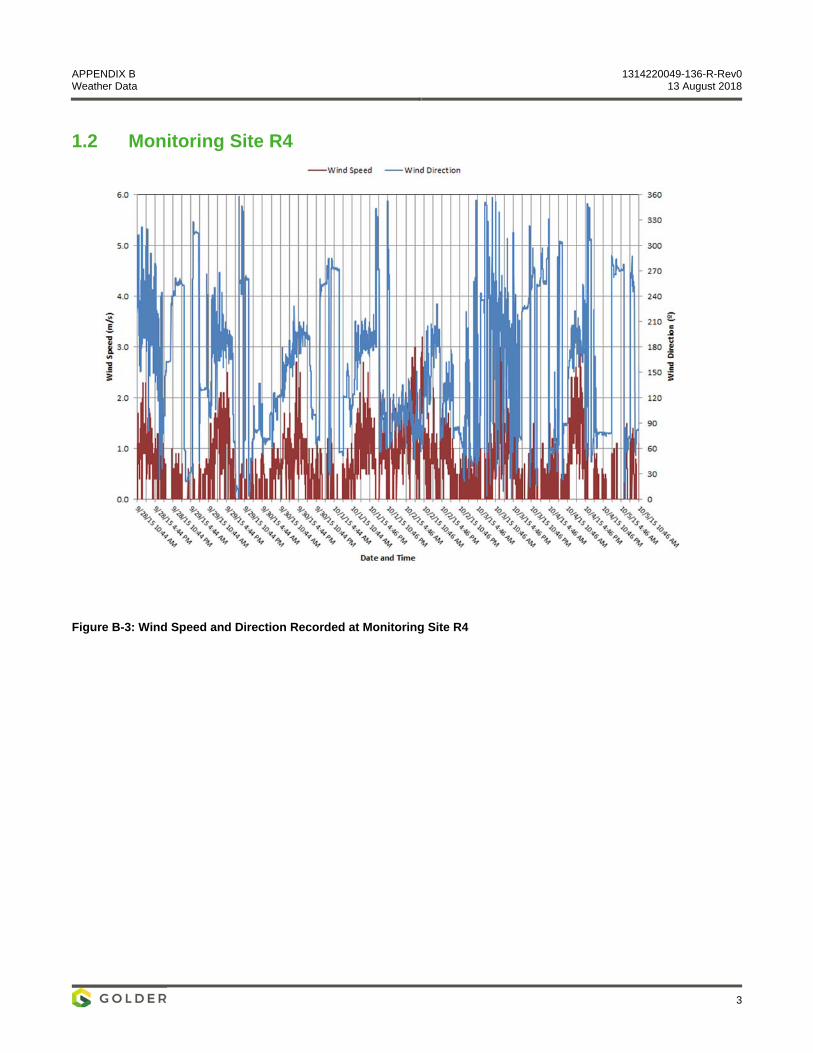
1.2 Monitoring Site R4
Figure B-3: Wind Speed and Direction Recorded at Monitoring Site R4
APPENDIX B Weather Data
1314220049-136-R-Rev013 August 2018
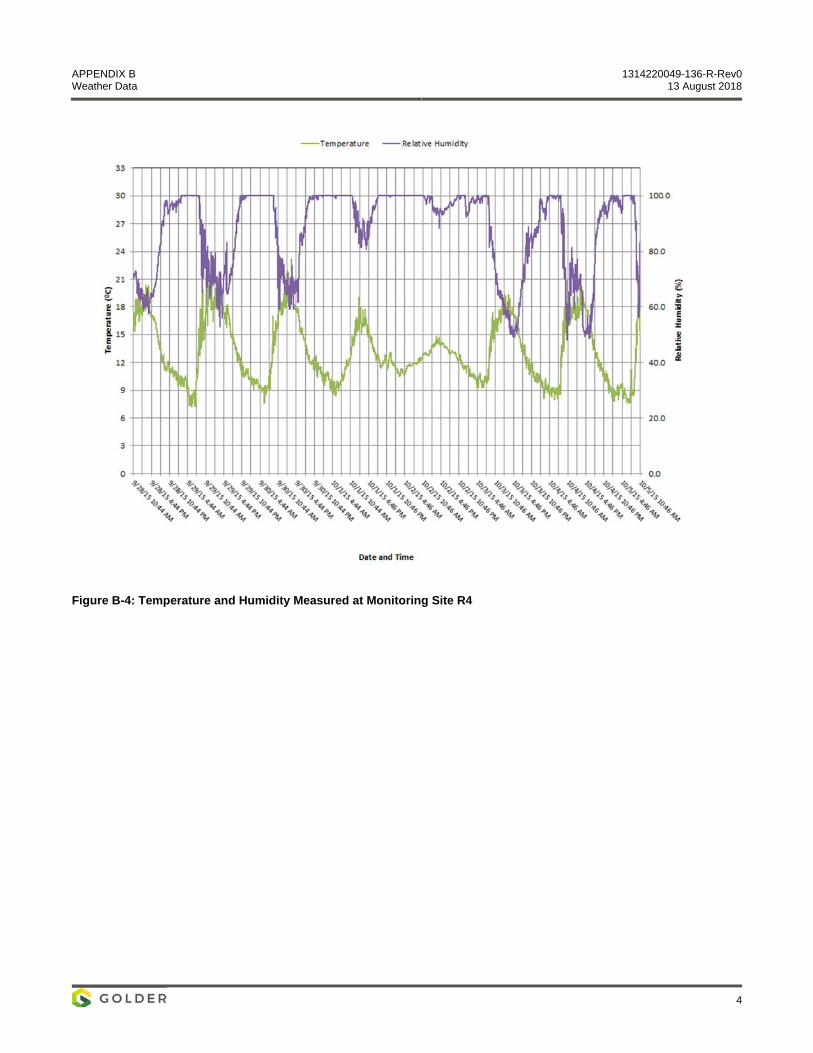
4
Figure B-4: Temperature and Humidity Measured at Monitoring Site R4

golder.com
Recommended