Commonwealth Bank of Australia ACN 123 123 124
Results Presentation For the half year ended 31 December 2009
10 February 2010
COMMONWEALTH BANK OF AUSTRALIA | ACN 123 123 124 | 11 FEBRUARY 2015
DEBT INVESTOR UPDATE FOR THE HALF YEAR ENDED 31 DECEMBER 2014

2
Notes
Disclaimer
The material that follows is a presentation of general background information about the Group’s activities
current at the date of the presentation, 11 February 2015. It is information given in summary form and
does not purport to be complete. It is not intended to be relied upon as advice to investors or potential
investors and does not take into account the investment objectives, financial situation or needs of any
particular investor.
Cash Profit
The Management Discussion and Analysis discloses the net profit after tax on both a statutory and cash
basis. The statutory basis is prepared and reviewed in accordance with the Corporations Act 2001 and the
Australian Accounting Standards, which comply with International Financial Reporting Standards (IFRS).
The cash basis is used by management to present a clear view of the Group’s underlying operating
results, excluding items that introduce volatility and/or one-off distortions of the Group’s current period
performance. These items, such as hedging and IFRS volatility, are calculated consistently with the prior
comparative period and prior half disclosures and do not discriminate between positive and negative
adjustments. A list of items excluded from statutory profit is provided in the reconciliation of the Net profit
after tax (“cash basis”) on page 3 of the Profit Announcement (PA) and described in greater detail on
page 15 of the PA and can be accessed at our website:
http://www.commbank.com.au/about-us/shareholders/financial-information/results/

Results & Strategy

4
Aust NZ Other Total
Customers 12.5m 2.2m 0.4m 15.1m
Staff 41,900 5,600 5,000 52,500
Branches2 1,150 140 115 1,405
ATMs2 4,400 466 173 5,039
Market capitalisation (ASX) #1
Credit Ratings (S&P, Moodys, Fitch) AA-/Aa2 /AA-
Household deposits – market share3 #1
Home lending – market share4 #1
FirstChoice platform – market share5 #1
1. All movements on prior comparative period unless stated otherwise.
2. Includes fully owned entities only 3. Source: APRA 4. Source: RBA 5.Source: Plan for Life
6 The Group has revised its international measure of CET1 at 31 December 2014 with the methodology consistent with that detailed in the August 2014
PwC Australia report commissioned by the ABA. The key changes in methodology include differences in calculating RWA for residential mortgages,
specialised lending and corporate exposures.
Capital – CET1 (Int’l) 13.3% na
Capital – CET1 (APRA) 9.2% 70 bpts
LT wholesale funding WAM (yrs) 3.9 0.1
Deposit funding 63% -
Liquids ($bn) 151 10%
Total assets ($bn) 851 9%
Total liabilities ($bn) 800 9%
FUA ($bn) 275 5%
RWA ($bn) 353 6%
Provisions to Credit RWAs (bpts) 125 (27 bpts)
Cash earnings ($m) 4,623 8%
ROE (Cash) 18.6% (10) bpts
Cash EPS ($) 2.84 8%
DPS ($) 1.98 8%
Cost-to-Income 42.2% (70) bpts
NIM (bpts) 212 (2) bpts
Additional
information
Balance Sheet
Financial
Capital & Funding
Snapshot 1H15
1
6
CBA overview – 1H 151

5
1,992
743 653
347 378 435
Retail Banking Services Business & PrivateBank
Inst Bank & Markets Wealth Management Bankwest NZ
$m
1 All movements on prior comparative period except where noted
2 Excluding Property
3 NZ result in AUD, performance metrics in NZD
2 3
Divisional results
Income 7%
Costs 2%
C:I 160 bpts to 34.5%
Cash NPAT 1H15
Income 6%
Business loans 5%
Costs 5%
Income 6%
Avg Lending 10%
Loan impairment 17bpts
Lending 5%
NIM (ASB)
ASB OBI 5%
+8%
+12%
+1% +8% +23%
-3%
Funds income 7%
Avg FUA 11%
Insurance inc. 2%
1
Transaction Deposits 16%
C:I 120 bpts to 43.5%
NIM lower (home loans)

6
7,444 7,891
2,234 2,370
1,389 1,386
Dec 13 Dec 14
Operating Income
Income
+5% (underlying +6%)
-
+6%
+6%
$m
Funds & Insurance (underlying +7%)
Property non-recurring ($100m)
Underlying FUA 10%
Funds management margin 6bpts
Net Interest Income
Volume 7%
Margin 2bpts
Other Banking Income
Commissions/fees/other 8%
Trading 1%
1
1
1 Wealth Management

7
Expenses
4,751
4,892 4,914
(140) 144
137
22
1H14 Productivity Staffcosts
Other 1H15underlying
FX 1H15
+0.4%
$m
Underlying +3.0%
+3.4%
Operating Expenses
1H13 1H14 1H15
Cost-to-income
43.8% 42.9%
42.2%
1H14 1H15

8
214 212
2 (1) 2 (1) (4)
2H14 Assetpricing
Fundingcosts
Basisrisk
Portfoliomix
Other 1H15
bpts
12 month NIM
bpts
210 217 214 214 212
Dec 12 Jun 13 Dec 13 Jun 14 Dec 14
Group NIM (Six Months)
213 214
1 Includes Treasury, impact from change in Non Lending Interest Earning Assets and other unallocated items
1 2H14 1H15
Group NIM
6 Month Movement
9
0.4%
0.9%
1.4%
Jun 12 Dec 12 Jun 13 Dec 13 Jun 14 Dec 14
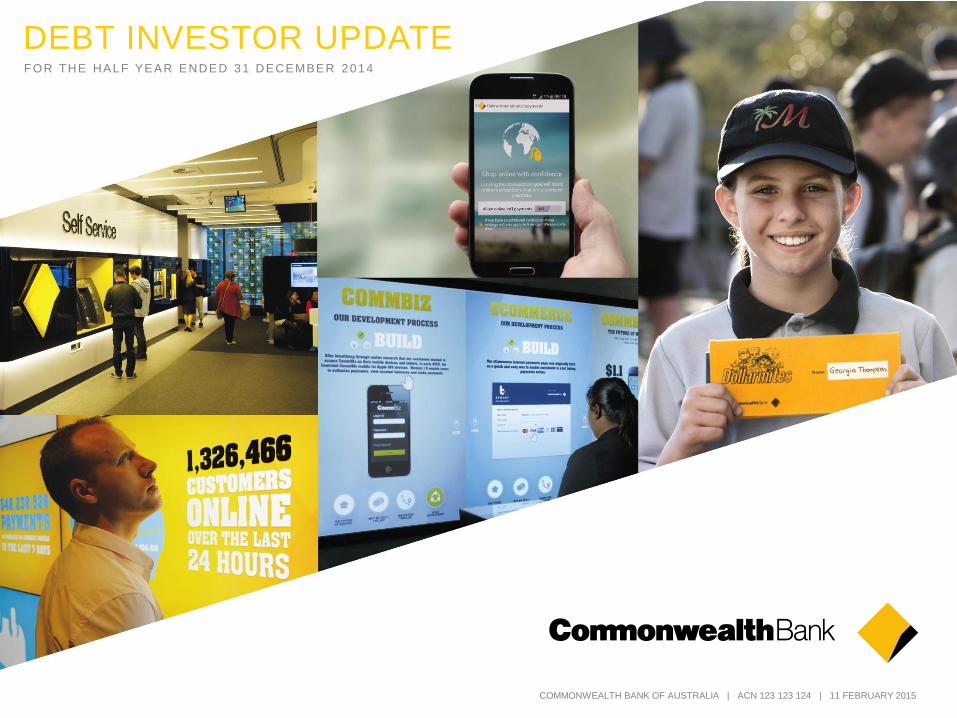
Loan Impairment Expense (Cash) Group Consumer Arrears
90+ days
1 Basis points as a percentage of average Gross Loans and Acceptances (GLA)
2 FY09 includes Bankwest on a pro-forma basis and is based on impairment expense for the year
3 Statutory Loan Impairment Expense (LIE) for FY10 48 bpts, FY13 21 bpts and FY14 16 bpts
4 Total committed credit exposure (TCE) = balance for uncommitted facilities or greater of limit or balance for committed facilities. Calculated before collateralisation. Includes Bank and
Sovereign exposures. CBA grades in S&P equivalents.
Troublesome and Impaired Assets
$bn
Credit quality
5.8 5.6 5.2 4.3 3.6 3.1
4.7 4.5 4.3
3.9 3.4
3.4
10.5 10.1 9.5
8.2
7.0 6.5
Jun 12 Dec 12 Jun 13 Dec 13 Jun 14 Dec 14
Commercial Troublesome Group Impaired
73
41
25 21 20 16 14
FY09Pro
Forma
FY10 FY11 FY12 FY13 FY14 1H15
CBA Group
(basis points) 1 2
3
3 3
Home Loans
Credit Cards
Personal Loans
Commercial Portfolio Quality4
0
100
200
300
400
Dec 12 Jun 13 Dec 13 Jun 14 Dec 14
TCE ($bn)
AAA/AA
A
BBB
Other
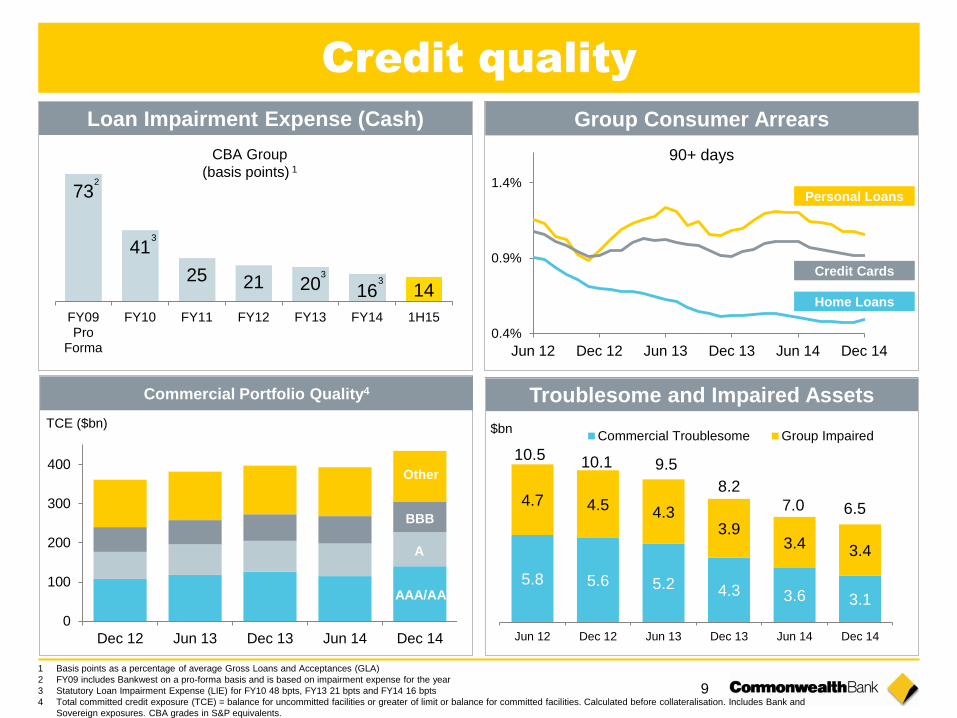
10
720 610 631
149
128 128
547
389 357
1,416
1,127 1,116
Dec 13 Jun 14 Dec 14
Provisions
$m $m
712 729 725
906 941 942
377 347 306
875 762 790
2,870 2,779 2,763
Dec 13 Jun 14 Dec 14
Individual Provisions
Bankwest
Consumer
Commercial
Overlay
Collective Provisions
Economic
overlay
unchanged

11
Customer Focus
TSR Outperformance
People Strength Technology Productivity
Capabilities
Growth
Opportunities
“One CommBank”
Continued growth in business and institutional banking
Disciplined capability-led growth outside Australia
Our strategy

12
41.6%
45.8%
42.3%
29.9%
28.1% 28.9%
42.7% 45.5%
39.2%
28.6%
26.5%
28.5%
68%
70%
72%
74%
76%
78%
80%
82%
84%
86%
1, 5, 6, 7, 9 Refer notes slide at back of this presentation for source information
Focus on the customer
Jun 07 Dec 14
% Satisfied ('Very Satisfied' or 'Fairly Satisfied')1
CBA
Peers
1
Dec 13 Dec 14
CBA MFI share by age
14-17 25-34 35-49 50-64 65+ 18-24
Overall 34.0%
MF
I S
ha
re
3
Customer lifecycle (age)
Retail Customer Satisfaction

13
43.8%
42.9%
42.2%
1H13 1H14 1H15
Productivity
Improving service
Personal loans funded
same day
Asset Finance – Credit
approval time
Home insurance claims –
turnaround time
Transaction Banking – client
on-boarding time
Bankwest – Business Account
documents required
Regional and Agribusiness –
client facing activities
27%
39%
30%
67%
58%
38%
Cost to Income %
Productivity
saving
$140m
1 Refer notes page at back of presentation for definition of productivity metrics. Movements shown are since inception of respective productivity initiatives.
1
60% 28%
12%
Branches
and Other
Risk &
Compliance
Productivity
& Growth
$595m
1H Investment spend

14
Fast in-store
payments
CBA market leading
in cards and
terminals
33% of all credit
transactions
Contactless
Leading technology, innovative solutions
Tap & Pay
Small Business App & Emmy
$48 million+ in spend
(12 mths)
2.3 million+ transactions
(12 mths)
Average spend per
transaction $21
400k logins since the
launch
Real time account
balances and
transaction history
Create, view and
authorise payments,
including FX
Improved cash flow, on-the-
spot payments and invoicing
Provides customers more
ways to pay, with BPAY™
included
Easily track and follow up
estimates to win more
business
Split bills and add tips
CommBiz Mobile

15
Transactional Account Users
Digital Banking Ecosystem
Banking Partner
Product
Banking license
Compliance
Mobile Network
Operator
Customer base
Data
Distribution
Airtime Retail Partners
Cash in / out
POS payments
Sales & service
Cash in / out and deposits to bank account
Card, transfers and point of sale payments
Value added services
Billing, payments and transaction history
Retail Business Services
TYME technology enables an ecosystem of partners to collectively deliver real-time banking
services at ultra-low cost through a distribution network of proprietary and third party channels

16
Capitalised Software
ROE
1 CBA is half to December 2014. Peers are half to September 2014.
2 CBA is as at December 2014. Peers are as at September 2014.
2
1,979 2,070 2,126
2,533
CBA Peer 3 Peer 2 Peer 1
$m
1 Group NIM
CBA Peers
Cash basis %
Result quality
1.8
1.9
2.0
2.1
2.2
2.3
2.4
2.5
Sep 11 Mar 12 Sep 12 Mar 13 Sep 13 Mar 14 Sep 14 Dec 14
18.6% 16.4% 15.3%
9.1%
CBA Peer 3 Peer 1 Peer 2
Capital 2
9.2%
9.0%
8.8%
8.6%
CBA Peer 3 Peer 1 Peer 2
APRA CET1
Additional
information Strength

Funding, Capital &
Liquidity

18
7
16
20
18 (17)
(23)
(23)
Equity IFRS & FX Net shortterm funding
Customerdeposits
New longterm funding
Long termmaturities
Lending Other Assets
$bn
63%
Deposit
Funded
Funding sources Funding
Source of funds Use of funds
6 Months to Dec 14
Funding and Liquidity
1 Liquids are reported net of applicable regulatory haircuts
2 Includes Government Guaranteed bonds buyback
3 Qualifying HQLA includes cash, Govt and Semi Govt securities. Also includes $5.6bn of RBNZ eligible securities.
4 CBA provided with a CLF of $70bn for period 1 Jan 2015 to 31 Mar 2015 inclusive, after which the CLF is $66bn
2
2
$bn Dec
14
Jun
14
Transactions 82 77
Savings 163 155
Investments 198 193
Other 15 14
Total customer
deposits 458 439
Wholesale funding 274 250
Total funding 732 689
Equity 51 49
Total funded assets 783 738
Customer % of
total funding 63% 64%

19
40 54
63 70
31
30
36 57
53
52
70
Dec 12 Dec 13 Dec 14 Dec 14Pro forma
LCRInternal RMBS
Bank, NCD, Bills, RMBS, Supra, Covered Bonds
Cash, Govt, Semi-govt
Liquidity $bn
151
Reg
min
$82bn
137 128
1
Liquidity
1 Liquids are reported net of applicable regulatory haircuts
2 Qualifying HQLA includes cash, Govt and Semi Govt securities. Also includes $5.6bn of RBNZ eligible securities.
3 CBA provided with a CLF of $70bn for period 1 Jan 2015 to 31 Mar 2015 inclusive, after which the CLF is $66bn
140
$18bn
buffer
CLF
HQLA
assets
100% LCR
115% LCR
2
3
♦ Full Liquidity Coverage Ratio (LCR) compliance from 1 Jan 2015
♦ CBA pro-forma LCR at 31 Dec 2014 - 115%
♦ RBA Committed Liquidity Facility (CLF)
– Available to meet AUD cash outflows
– 15bp commitment fee on approved amount with additional cost if used
– Collateralised by RBA repo-eligible securities (including Internal RMBS)
– CBA has additional internal RMBS above amount used for CLF
♦ APRA has determined the CBA CLF in context of AUD cash outflows and acceptable HQLA1 holdings - $66bn for calendar year 20152

20
Funding
1 Maturity profile includes all long term wholesale debt. Weighted Average Maturity of 3.9 years includes all deals with first call or residual maturity of
12 months or greater.
2 CBA Group Treasury estimated blended wholesale funding costs
Total Deposits
(excl CD’s)
Source : APRA Household deposits Other deposits
Australian Deposits
$bn
203 164 104 104
191 179
175 129
CBA Peer 3 Peer 2 Peer 1
233 279
343 394
4 5 5 7 10 3 2 2
3
3 7
4
10
11 5
-
5
10
15
20
25
Dec 12 Jun 13 Dec 13 Jun 14 Dec 14
Domestic Offshore Private Offshore Public
Funding Costs2
Indicative Long Term Wholesale Funding Costs
Term Issuance
$bn
3 8
13 14 17
19
42
69
84
99
25
45 67
80 92
0
50
100
1 year 2 year 3 year 4 year 5 year
Ma
rgin
to
BB
SW
Jun 07
Dec 13
Dec 14
FY14
$38bn
FY13
$25bn
Additional
information Funding – deposits and costs
52
86
43
5 23
NBS & Goal Saver
Investment accounts
Savings deposits
Business Online Saver
Transaction accounts
32
62
$bn
42
91
39
4 18
Dec 13 Dec 14
Retail Deposit Mix
Total Deposits +8%

21
5%
27%
15%
5%
15%
5%
9%
1%
13% 5%
Structured MTN
Vanilla MTN
Commercial Paper
Debt Capital
CDs
Securitisation
Covered Bonds
Bank Acceptance
FI Deposits
Other
63% 17%
4%
9% 4%
2% 1% Customer Deposits
ST Wholesale Funding
LT Wholesale Funding maturing< 12 months
LT Wholesale Funding maturing>= 12 months
Covered Bonds
RMBS
Hybrids
Funding Composition
Wholesale Funding by Currency
Wholesale Funding by Product
1 Total of debt issues (at current FX) plus A$ Transferable Certificates of deposit. Excludes IFRS.
35%
12% 32%
4%
12%
5% Australia
Europe
United States
Japan
United Kingdom
Other
Funding - Portfolio
0
20
40
60
80
100
120
Jun 11 Jun 12 Jun 13 Jun 14 Dec 14
AUD USD EUR Other
Term Debt Issues Outstanding (>12mths)1
81 93 92
$bn
101 105

22
Expected
funding
requirement
1 Maturity profile includes all long term wholesale debt. Weighted Average Maturity of 3.9 years includes all deals with first call or maturity of
12 months or greater.
Funding strategy driven by market and investor diversity, appropriate maturity profile and overall cost
Term wholesale funding requirement has eased materially since FY 2010
$bn
Funding – Issuance and Maturity 1
45
23 17
20
32
16 14
24 22
14 13
24
9
12 5
7
2
2 7
2 6
8
10
20
30
40
50
60
Jun 10 Jun 11 Jun 12 Jun 13 Jun 14 Dec 14 Jun 15 Jun 16 Jun 17 Jun 18 Jun 19 > Jun 19
Issuance Issuance Issuance Issuance Issuance Issuance Maturity Maturity Maturity Maturity Maturity Maturity
Long Term Wholesale Debt Government Guaranteed Covered Bond
Weighted Average Maturity 3.9yrs

23
International
Capital Position
8.5%
9.3% 9.2%
8.0%
13.3%
(100) 131 (47)
19 (13)
Dec 13APRA
Jun 14APRA
Jun 14Final
Dividend(DRP
Neutral)
CashNPAT
CreditRWA
Volume
CreditRWA
Quality
Other Dec 14 APRAMin
2016
Dec 142
CET1 - APRA 1
(DRP Neutral)
1 The Group has revised its international measure of CET1 at 31 December 2014 with the methodology consistent with that detailed in the August 2014 PwC Australia report
commissioned by the ABA. The key changes in methodology include differences in calculating RWA for residential mortgages, specialised lending and corporate exposures.
2 Changes in regulatory treatments, equity investments, software and capitalised costs, increases in Operational/Market RWA and non-cash NPAT items, partially offset by lower
IRRBB RWA

24
APRA & International Comparison
The following table provides details on the differences, as at 31 December 2014, between the
APRA Basel III prudential requirements and capital as measured on an Internationally
Comparable basis1.
1 The Group has revised its international measure of CET1 at 31 December 2014 with the methodology consistent with that detailed in the August
2014 PwC Australia report commissioned by the ABA
% CET1
Basel III (APRA) 9.2%
Equity investments 1.0%
Deferred tax assets 0.2%
IRRBB risk weighted assets 0.1%
Treatment of residential mortgages 0.8%
Treatment of specialised lending and other standardised exposures 0.9%
Treatment of corporate exposures 1.1%
Total adjustments 4.1%
Basel III (Internationally Comparable) 13.3%

25
13.3% 13.3%
11.8%
12.5% 12.8%
4.5%
9.2%
2.5%
1.0%
0.8%
0.8%
8.0%
CBA Canada UK Europe Singapore
Inte
rnationally
Com
para
ble
AP
RA
CB
A if re
gu
late
d in
Can
ad
a
CB
A if re
gu
late
d in
UK
CB
A if re
gu
late
d in
Eu
rop
e
CB
A if re
gu
late
d in
Sin
ga
po
re
CET1 min
D-SIB buffer
CCB
5
+4.1% +2.6% +3.3% +3.6%
1. Calculations under the non-APRA regimes include the impact of international harmonisation as well as adjusting for additional regulatory constraints imposed by APRA which are not required in those jurisdictions
2. The Group has revised its international measure of CET1 at 31 December 2014 with the methodology consistent with that detailed in the August 2014 PwC Australia report commissioned by the ABA
3. Does not include the benefit of the Canadian Government guarantee of mortgage insurers which allows Canadian banks to realise lower risk-weights
4. Since 31 December 2013, UK and European banks have taken a deduction for accrued expected future dividends (if they are paying dividends)
5. Based on CRD IV as implemented by the European Commission
Source: CBA and PwC.
1
2 4
4
3
CBA CET1 under various regulatory regimes Additional
information Strong Capital Position

26
15.7
13.7 13.3 13.1 13.0
12.7
12.0 11.8 11.7 11.7 11.6 11.4 11.1 11.1
10.8 10.8 10.8 10.7 10.7 10.5 10.5 10.4 10.4 10.4 10.4 10.4 10.3 10.2 10.1 10.1 9.9 9.8 9.7 9.6 9.6 9.5 9.4 8.9
No
rdea
UB
S
CB
A
Westp
ac
Inte
sa S
anp
aolo
AN
Z
Llo
yds
ICB
C
De
uts
ch
e
Ch
ina
Con
str
uct.
Ba
nk
NA
B
HS
BC
Bank o
f C
om
m
ING
Mitsubis
hi U
FJ
RB
S
Sco
tia
ban
k
Sta
nd
ard
Chart
ere
d
Sum
itom
o M
itsui
Bank o
f C
hin
a
Citi
Wells
Farg
o
BB
VA
SocG
en
Ch
ina
Me
rcha
nts
Bank
Un
iCre
dit
BN
P P
ari
bas
Barc
lays
Cre
dit A
gri
co
le S
A
JP
Morg
an
RB
C
Cre
dit S
uis
se
Santa
nde
r
Bank o
f A
merica
Co
mm
erz
ba
nk
Miz
uho
Toro
nto
Dom
inio
n
Agri.
Ban
k o
f C
hin
a
2
Peer bank average CET1 ratio
(ex. Australian banks):
10.8%
Source: Morgan Stanley. Based on last reported CET1 ratios up to 5 February 2015 assuming Basel III capital reforms fully implemented.
Peer group comprises listed commercial banks with total assets in excess of A$800 billion and which have disclosed fully implemented Basel III ratios or provided sufficient disclosure for a Morgan Stanley estimate.
1 Domestic peer figures as at 30 September 2014
2 Includes deduction for accrued expected future dividends
International Peer Basel III CET1
2
1
1
1
2
2
2
2
2
2
2
%

27
In December 2013, APRA announced
that the Australian major banks are
domestic systemically-important banks
(D-SIBs)
From 1 January 2016, D-SIBs are
required to hold 1% additional capital in
the form of CET1 (called the D-SIB
buffer)
D-SIB buffer forms part of the capital
conservation buffer (CCB) – from 1
January 2016, if a bank’s CET1 ratio
falls within the capital conservation
buffer, then it will only be able to use a
certain percentage of its earnings to
make discretionary payments such as
dividends, hybrid Tier 1 distributions
and bonuses
CET1 ratio Value
% of earnings
able to be used
for discretionary
payments
Above top of
CCB
PCR + 3.5%,
and above
100%
Fourth quartile of
CCB
Less than PCR
+ 3.5%
60%
Third quartile of
CCB
Less than PCR
+ 2.625%
40%
Second quartile
of CCB
Less than PCR
+ 1.75%
20%
First quartile of
CCB
Less than PCR+
0.875%
0%
Prudential capital
ratio
PCR (minimum) 0%
Above example assumes the total CCB (including the D-SIB buffer) is 3.5%
D-SIB and CCB Buffer

28 Capital assigned to interest rate risk in banking book per APS117. Basis points of APRA CET1 ratio.
$781m
$880m
$1,303m $1,403m $1,181m
$388m
Jun 12 Dec 12 Jun 13 Dec 13 Jun 14 Dec 14
Repricing and
Yield Curve
Risk
Basis Risk
Optionality
Risk
Embedded Gain
(offset to capital)
Repricing & Yield
Curve Risk
Basis Risk
Optionality
Risk
Interest Rate Risk in the Banking Book
bpts 24 29 43 47 43 13

29
Dividend per Share Additional
information
107 113 113 120 132 137 164 183 198 149 153 115 170 188 197 200 218
FY07 FY08 FY09 FY10 FY11 FY12 FY13 FY14 FY15
Interim Final
cents
63%
84%
Payout
ratio (cash)
88%
90%
71%
61% 63%
87%
84% 74%
81%
70%
81%
62%
84%
62%
70%
75.0% 73.9% 73.2% 75.8% 75.1% 74.2% 78.2% 75.9%
Dividends

30
On-going focus on long-term strategy to strengthen the
franchise in an increasingly competitive environment
Some signs of positive transition in Australian economy:
reality ahead of sentiment
But clear, long term policy needed to build confidence so
as to sustain and accelerate the transition: job creation,
infrastructure, foreign investment, trade, business
competitiveness
Outlook

Credit & housing

32
Credit Exposures by Industry 1
Dec 14 Jun 14
Consumer 54.2% 55.8%
Agriculture 1.9% 2.0%
Mining 1.9% 1.5%
Manufacturing 1.6% 1.8%
Energy 1.0% 1.0%
Construction 0.9% 0.8%
Retail & Wholesale 2.3% 2.2%
Transport 1.5% 1.5%
Banks 8.3% 9.0%
Finance – other 4.5% 3.4%
Business Services 1.2% 1.2%
Property 6.1% 6.4%
Sovereign 8.8% 7.8%
Health & Community 0.7% 0.6%
Culture & Recreation 0.8% 0.9%
Other 4.3% 4.1%
Total 100% 100%
Jun 14
Australia 76.7%
New Zealand 8.8%
Europe 6.1%
Other International 8.4%
Australia 78.4%
New Zealand 8.9%
Europe 5.0%
Other International 7.7%
Dec 14
1 Total Credit Exposure (TCE) = balance for uncommitted facilities or greater of limit or balance for committed facilities. Calculated before
collateralisation. Includes ASB and Bankwest. Excludes settlement risk.

33
1. Total Credit Exposure before collateralisation (TCE) = balance for uncommitted facilities and greater of limit or balance for committed facilities. Includes
ASB and Bankwest, excludes settlement exposures.
2. CBA grades in S&P Equivalents
$bn AAA
to AA-
A+
to A-
BBB+
to BBB- Other Total
Banks 35.9 38.9 3.6 1.8 80.2
Finance Other 23.1 12.1 4.4 4.1 43.7
Property 1.3 4.8 12.5 41.0 59.6
Sovereign 74.9 9.8 0.6 0.2 85.5
Manufacturing 0.2 3.1 5.9 6.7 15.9
Retail/Wholesale
Trade 0.5 2.3 7.2 12.4 22.4
Agriculture - 0.5 2.1 15.5 18.1
Energy 0.2 2.4 5.8 0.9 9.3
Transport 0.2 1.8 7.9 4.2 14.1
Mining 1.8 5.9 6.8 4.0 18.5
All other
(ex consumer) 1.9 5.4 20.0 40.5 67.8
Total 140.0 87.0 76.8 131.3 435.1
Sector Exposures
Commercial Exposures by Industry 1,2 Top 20 Commercial Exposures2
$m - 500 1,000 1,500 2,000 2,500
A+
A-
A
A-
A
BBB+
BBB-
AA-
AA-
AA-
A+
A-
BBB-
A-
BBB
BBB
AA
A-
A+
A
($m)

34
1. Total Credit Exposure (TCE) = balance for uncommitted facilities and the greater of limit or balance for committed facilities. Calculated before collateralisation.
Includes ASB and Bankwest and excludes settlement exposures. Exposure assigned to ANZSIC Codes according to main business activity.
2. Energy includes: electricity generation, distribution & supply; and gas supply
3. Assessed carbon emissions arising from our project finance (definition at back of presentation) - includes both onshore and offshore
Resources Exposure
Mining, Oil and Gas
Resources Industries Dec 14
Dec 14
Commercial Exposure1
Sector $bn % of Group
TCE
Mining ex Oil & Gas Extraction 6.9 0.7
Oil and Gas Extraction 11.6 1.2
Energy2 9.3 1.0
Coal Ports & Transport Terminals 1.7 0.2
Assessed carbon emissions arising from the Group’s project finance
exposure to the energy sector, per the Group’s ESG reporting
commitments. Data is reported as at June 2014 due to availability of
client and public data sources of generation, production and emissions
data.
Project Financed Coal Operations
Emissions intensity of CBA project finance coal operations;
Direct (scope 1 & 2) emissions:
– 0.011tCO2e/tonne extracted
– 81tCO2e/$m project finance debt
Indirect (scope 3 combustion) emissions:
– 17.5ktCO2e/$m project finance debt
CBA project finance facilitated 940kt of coal extraction during FY14.
This is approximately 0.19% of Australia’s total coal production (FY14
produced saleable black coal and FY13 produced brown coal).
Project Financed Oil and Gas Operations
Direct (scope 1 & 2) emissions intensity of CBA project finance oil and
gas operations: 41tCO2e/$m.
Project Financed Electricity Generation
Emissions intensity of CBA project finance electricity generation:
0.77tCO2e/MWh in Australia, 9% below the Australian average
emissions intensity of 0.85tCO2e/MWh
0.45tCO2e/MWh in the USA, 17% lower than the USA average grid
emissions intensity of 0.55tCO2e/MWh
Assessed Carbon Emissions – Project Finance
We recognise that we play a crucial role in enabling the economic and social development of Australia, supporting jobs,
growth, innovation and opportunities for people and businesses. We also recognise our role in addressing the challenge of
climate change, including helping organisations to transition to a low carbon economy, investing in renewables and
ensuring we have robust responsible lending practices in place. The charts below show Group total exposures to mining
and energy sectors and emissions arising from our project finance exposure3 to the energy sector.

35
0%
5%
10%
15%
20%
25%
30%
35%
40%
Sydney Melbourne Brisbane Perth Adelaide
1991 Recession Jun 14 Dec 14
Commercial Property Market
0%
5%
10%
15%
20%
25%
30%
35%
40%
Sydney Melbourne Brisbane Perth Adelaide
Peak 1990s Jun 14 Dec 14
1 The development pipeline includes projects currently under construction
2 As at December 2014. Includes ASB and Bankwest, excludes service sectors.
Commercial Property by State2
CBD Office Supply Pipeline1 CBD Vacancy Rates
Source: JLL Research Source: JLL Research
% of Total Stock
65% 11%
12%
7%
3% 2% NSW
VIC
WA
QLD
SA
Other
Group Commercial Property Profile2
28%
22% 17%
14%
13%
6% Other Commercial
REIT
Retail
Office
Residential
Industrial

36
RBS Home Loan Portfolio
Dec 14 Jun 14 Dec 13
Total Balances - Spot ($bn) 310 302 293
Total Balances - Average ($bn) 306 293 289
Total Accounts (m) 1.5 1.5 1.4
Variable Rate - % of balances 81 81 82
Owner Occupied - % of balances 58 58 58
Investment - % of balances 36 35 35
Line of Credit - % of balances 6 7 7
Proprietary - % of balances 62 62 63
Broker - % of balances 38 38 37
Interest Only - % of balances2 36 34 34
First Home Buyers - % of balances2 11 12 13
Low Doc - % of balances2 1.2 1.4 1.6
LMI - % of balances2,3 24 24 25
LDP - % of balances2,4 7 6 6
MIP - % of balances5 0.04 0.04 0.06
Customers in Advance (%)6 73 76 78
Payments in Advance (#)7 7 7 7
Portfolio Dynamic LVR (%)9 48 48 49
Dec 14 Jun 14 Dec 13
Total Funding ($bn)1 40 73 37
Average Funding Size ($’000)1 267 254 252
Serviceability Buffer (%)8 1.5 1.5 1.5
Variable Rate - % of funding1 83 81 80
Owner Occupied - % of funding1 60 61 61
Investment - % of funding1 36 35 35
Line of Credit - % of funding1 4 4 4
Proprietary - % of funding1 60 62 62
Broker - % of funding1 40 38 38
Interest Only - % of funding1,2 38 35 35
First Home Buyers - % of funding1,2 5 6 6
Low Doc - % of funding1,2 0.1 0.1 0.2
LMI - % of funding1,2,3 19 21 21
Portfolio Run-Off (%)1 20 19 20
1. 12 months to June and 6 months to December
2. Excludes Viridian LOC
3. Lenders’ Mortgage Insurance
4. Low Deposit Premium
5. Mortgagees in Possession
6. Any payment ahead of monthly minimum repayment
7. Average number of payments ahead of scheduled repayments
8. Serviceability test based on the higher of the customer rate plus a 1.5% interest rate buffer or a
minimum floor rate
9. Defined as current balance/current valuation (data as at Sep 14)

37
Australian Investment Home Lending2 Growth Summary
302 310
40 14 (41)
(4)
Jun 14 New
fundings
Redraw
&
interest
Repayments
/ Other
External
refinance Dec 14
Portfolio Balances Dec 14
28%
Home Loan Balances
1H15
Growth
$bn
NSW/ACT Qld SA/NT Vic/Tas WA
Home Loan Growth Profile
Channel Growth1
1
Excludes Bankwest
Excludes Bankwest
9.4% 10.1%
12.4%
10.5% 10.6%
CBA Peer 1 Peer 2 Peer 3 System
12 months to Dec 14
33%
12%
20%
7% +5.4%
+4.8%
+4.9%
+5.3%
+5.4%
CBA Majors CBA Majors
7.5%
10.9%
4.6% 3.7%
1. CBA estimates. Growth rates shown are Sep 14 vs Sep 13.
2. Source : APRA (includes Bankwest)
Broker Proprietary
1
Excludes Bankwest

38
RBS Home Loans – LVR & Arrears
Home Loan Arrears Rates by Vintage
90+ days
Home Loan Dynamic LVR1 Profile
Months on Book
FY09
FY08
FY07
FY13
FY10
FY11
FY12
FY14
Average
Dynamic
LVR1
Dec 13 49%
Jun 14 48%
Dec 14 48%
0.0%
0.5%
1.0%
1.5%
2.0%
0 6 12 18 24 30 36 42 48 54 60 66 72 78 84 90 96
0%
10%
20%
30%
40%
50%
60%
70%
0-60% 61-75% 76-80% 81-90% 91+%
Pro
po
rtio
n o
f T
ota
l P
ort
folio
Dec 13 Jun 14 Dec 14
1 Dynamic LVR is current balance / current valuation (data as at Sep 14 due to the lag in the publication of current valuations data)

39
Credit Cards 1
90+ days
Home Loans 1
Personal Loans 1
90+ days
90+ days
1 Results not consistently measured/defined across the industry. CBA definition is conservative as it includes Hardship accounts.
Consumer Arrears (Group)
0.0%
1.0%
2.0%
Jun 12 Dec 12 Jun 13 Dec 13 Jun 14 Dec 14
RBS Bankwest ASB
0.0%
1.0%
2.0%
Jun 12 Dec 12 Jun 13 Dec 13 Jun 14 Dec 14
RBS Bankwest ASB
0.0%
1.0%
2.0%
Jun 12 Dec 12 Jun 13 Dec 13 Jun 14 Dec 14
RBS Bankwest ASB
Retail Banking Services Home Loans
90+ days
0.0%
1.0%
2.0%
Jun 12 Dec 12 Jun 13 Dec 13 Jun 14 Dec 14
Owner Occupied Investment Loan Portfolio

40
2.5 5.9
10.1
2.75 7.0
11.4 (15)
1.0
10.5 15.8
(32)
1.0
11.5
18.4
(32)
RBS Home Loans – Stress Test
Key Assumptions
Base Yr 1 Yr 2 Yr 3 Base Yr 1 Yr 2 Yr 3 Base Yr 1 Yr 2 Yr 3 Base Yr 1 Yr 2 Yr 3
Cash Rate
(%)
Unemployment
(%)
Hours under-employed
(%)
Cumulative reduction
in house prices (%)
1
Stressed
Losses
$m
Insured
Losses2
$m
Net
Losses
$m
Probability
of
Default
Year 1 584 224 360 1.14%
Year 2 1,059 403 656 1.74%
Year 3 1,492 574 918 2.48%
Total 3,135 1,201 1,934
Key Outcomes Summary
1 One of multiple regular stress tests undertaken
2 Assumes a payout ratio of 70% for each of the three years
Results based on June 2014
3 year “stress test” scenario of cumulative 32%
house price decline, peak 11.5% unemployment
and a reduction in the cash rate to 1%1
House prices and PDs are stressed at regional
level
Total potential losses over 3 years of
$3.14bn, of which $1.93bn represents the losses
net of LMI recoveries
Total potential losses reduced by 10% between
December 2013 ($3.49bn) and June 2014 ($3.14bn),
primarily due to an increase in house prices over
the period
Total
Potential
Losses
$m
Insured
Losses2
$m
Net
Losses
$m
Probability
of
Default
Year 1 584 224 360 1.14%
Year 2 1,059 403 656 1.74%
Year 3 1,492 574 918 2.48%
Total 3,135 1,201 1,934
Key Outcomes
41
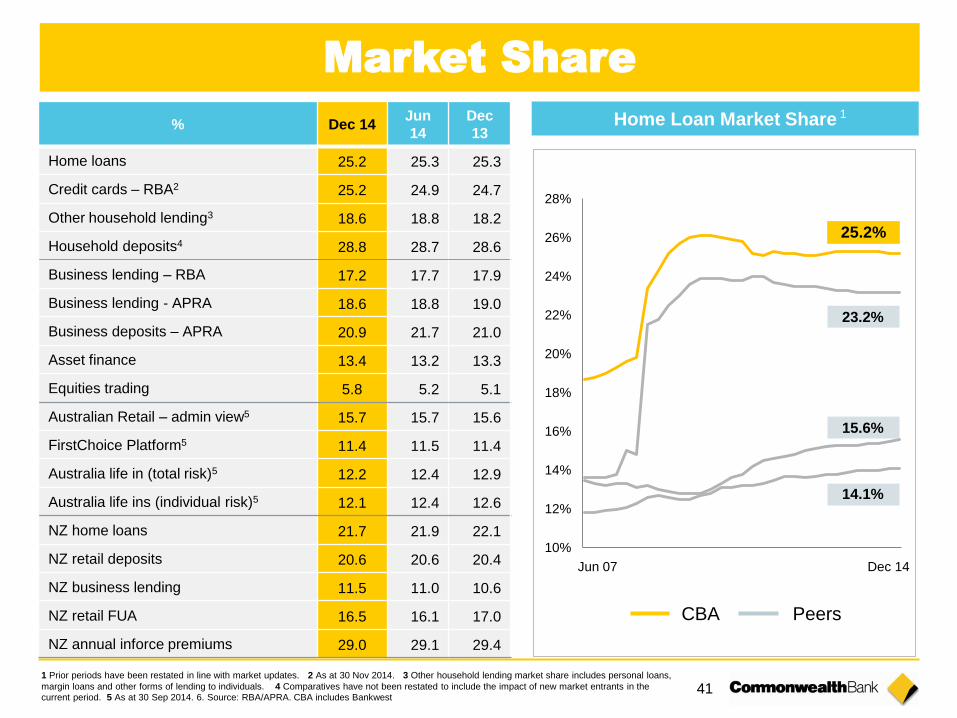
Market Share 1
% Dec 14 Jun
14
Dec
13
Home loans 25.2 25.3 25.3
Credit cards – RBA2 25.2 24.9 24.7
Other household lending3 18.6 18.8 18.2
Household deposits4 28.8 28.7 28.6
Business lending – RBA 17.2 17.7 17.9
Business lending - APRA 18.6 18.8 19.0
Business deposits – APRA 20.9 21.7 21.0
Asset finance 13.4 13.2 13.3
Equities trading 5.8 5.2 5.1
Australian Retail – admin view5 15.7 15.7 15.6
FirstChoice Platform5 11.4 11.5 11.4
Australia life in (total risk)5 12.2 12.4 12.9
Australia life ins (individual risk)5 12.1 12.4 12.6
NZ home loans 21.7 21.9 22.1
NZ retail deposits 20.6 20.6 20.4
NZ business lending 11.5 11.0 10.6
NZ retail FUA 16.5 16.1 17.0
NZ annual inforce premiums 29.0 29.1 29.4
1 Prior periods have been restated in line with market updates. 2 As at 30 Nov 2014. 3 Other household lending market share includes personal loans,
margin loans and other forms of lending to individuals. 4 Comparatives have not been restated to include the impact of new market entrants in the current period. 5 As at 30 Sep 2014. 6. Source: RBA/APRA. CBA includes Bankwest
Additional
information Market Share
Home Loan Market Share
Jun 07
CBA Peers
23.2%
15.6%
14.1%
Dec 14
25.2%
1
10%
12%
14%
16%
18%
20%
22%
24%
26%
28%

42
Population growth is solid in Australia
because of a high migration program
High population growth increased
demand for housing
■ Australia’s population growth rate of 1.6% is well above the OECD average of 0.7%.
■ Strong population growth has increased housing demand while the supply of new dwellings
has been low because of competition with mining and infrastructure. Underlying demand for
housing has run ahead of new supply until very recently. So there is a accumulated demand
for housing.
Housing market dynamics
0
150
300
450
0
150
300
450
1949/50 1964/65 1979/80 1994/95 2009/10
POPULATION DRIVERS'000 '000
Netmigration
Naturalincrease
-100
0
100
200
-100
0
100
200
Sep-90 Sep-96 Sep-02 Sep-08 Sep-14
Demand
Supply
'000
Pent-updemand
Excesssupply
CBA: HOUSING DEMAND & SUPPLY
'000

43
State population growth Dwelling price growth
Source: CoreLogic RP Data, Hedonic Index.
■ Rising dwelling prices is one of the transmission paths for monetary policy.
■ Higher dwelling prices boost wealth and consumer spending, encourage new construction
and lift sentiment.
■ House prices are rising ahead of income, so household leverage is lifting again.
Housing market dynamics
change (%)
3 Years
to
Dec 14
12 mths
to
Dec 14
6 mths
to
Dec 14
Sydney 30.6 12.4 6.5
Melbourne 13.4 7.6 4.5
Brisbane 9.2 4.8 2.5
Adelaide 6.4 4.3 3.5
Perth 13.1 2.1 2.1
Australia 18.1 7.9 4.5 -25
0
25
50
75
100
-25
0
25
50
75
100
Sep-02 Sep-05 Sep-08 Sep-11 Sep-14
'000'000
SA
STATE POPULATION GROWTH(annual change)
Qld
Vic
NSWWA
Tas

44
CBA TEI & THE CASH RATE
3.8
4.4
5.1
5.7
6.4
7.0
Jul-97 Jul-99 Jul-01 Jul-03 Jul-05
-8
-5
-2
2
5
8
Cash
rate
(lhs)
CBA TEI*
(adv 9 mnths ,rhs)
%pa %pa
* Deviat ion from trend
Housing market dynamics
Are investors a problem?
RBA concerns about the level of investor interest in the housing market are likely to remain
in 2015. This investor interest is a rational response to the environment created by central
banks. The low debt rate environment encouraged a search for yield.
Some “investors” may in fact be concealed first-home buyers. Affordability constraints
mean they are initially entering the market as investors and taking advantage of the rental
income and tax offsets for a while before shifting to owner occupation.
0
3
6
9
12
0
3
6
9
12
Jan-11 Jan-12 Jan-13 Jan-14 Jan-15
HOUSING LOAN APPROVALS$bn $bn
O-Occupier(ex refin & FHB)
First Home Buyers
Investor
Refinancing
Rental yields
0
3
6
9
0
3
6
9
Mar-03 Mar-06 Mar-09 Mar-12 Mar-15
%%
Sydneyrental yield*
Term depositspecial rate
Melbournerental yield*
RENTAL YIELDS(2 bedroom "other" dwelling)
*Source: REIA

45
■ The RBA is now favouring the use of macroprudential tools. APRA has delivered a relatively
restrained response. APRA will further lift supervisory oversight and loan affordability tests
for the investor segment in 2015. These tools may dampen the housing contribution to the
growth transition at the margin. But it is unlikely to derail the process.
■ Australian household leverage ratios are creeping up again but, debt servicing remains
manageable.
Housing market dynamics
Housing debt
0
8
16
24
0
8
16
24
2009 2014
%%
FIRST TIME BUYERS(% buying an investment property)
Source: Mortgage Choice First Time Investor Survey
First time buyers
0
5
10
15
20
25
30
35
40
0
20
40
60
80
100
120
140
160
Mar-00 Mar-04 Mar-08 Mar-12
HOUSING DEBT RATIOS
Housing debtto housing assets (rhs)
Housing debt to disposable income, (lhs)
%
Source: RBA
%
Housing debt interestas % of disposable income (rhs)

46 1 Replicating portfolio provides partial economic hedge for certain liabilities and assets that display imperfect correlation
between the cash rate and the product interest rate
2 Forecast assumes wholesale market conditions / rates remain at current levels
Replicating Portfolio and Funding Costs
Average Long Term Funding Costs 2
% Margin to BBSW
0.00
0.25
0.50
0.75
1.00
1.25
1.50
1.75
2.00
Dec 06 Dec 08 Dec 10 Dec 12 Dec 14 Dec 16
Portfolio average cost
Indicative spot market cost
Predicted
funding costs
if current
market rates
remain
unchanged
1 Replicating Portfolio 1
Actual and Forecast Scenario
Replicating Portfolio Yield
Official Cash Rate
2002 1H15 FY16

47
Jakarta
Singapore
Melbourne Auckland
Hong Kong
Beijing
Shenzhen
Tokyo
Edinburgh
London Frankfurt
1. Includes Realindex Investments which is a wholly owned investment management subsidiary of the Colonial First State group of companies
2. USA assets managed through CFSAMAL, (Australia based non-domiciled), FSII, (UK based non-domiciled), FSI Singapore (Singaporean based
non-domiciled), USA SEC Registered Investment Advisers
Paris
UK, Europe and Middle East AUM $56.7 billion
Asia AUM $18.8 billion
Australia and New Zealand AUM $110.9 billion1
North America AUM $5.2 billion2
AUM as at 31 December 2014
Portfolio Management Team / Distribution team
Joint Venture or Strategic Alliance
Sydney
Dubai
New York
CFSGAM – Global Reach
48
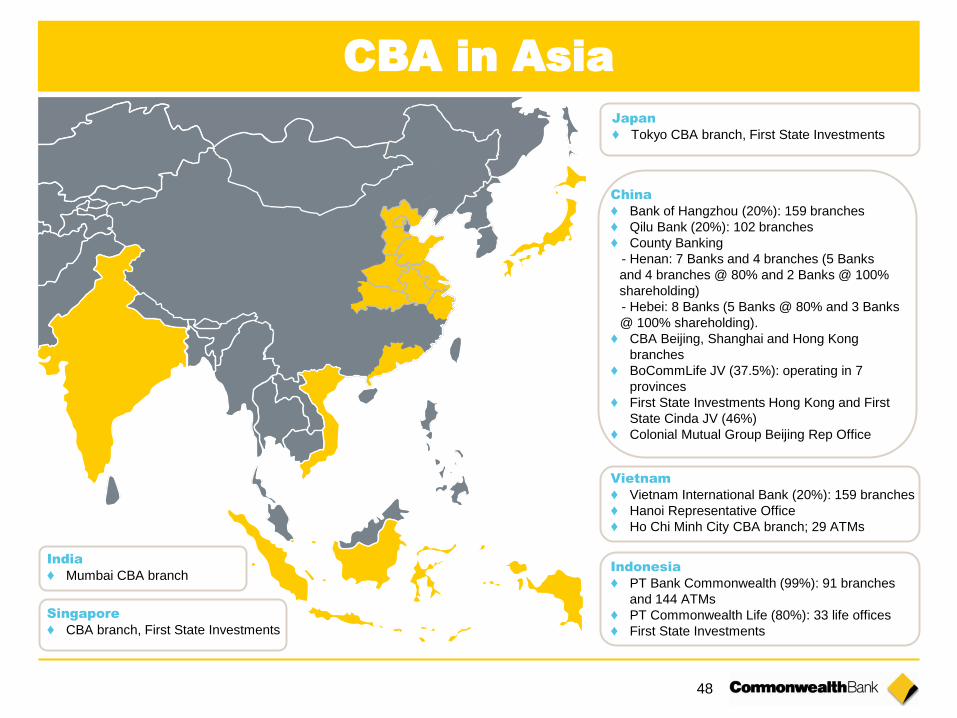
CBA in Asia
Indonesia
♦ PT Bank Commonwealth (99%): 91 branches
and 144 ATMs
♦ PT Commonwealth Life (80%): 33 life offices
♦ First State Investments
China
♦ Bank of Hangzhou (20%): 159 branches
♦ Qilu Bank (20%): 102 branches
♦ County Banking
- Henan: 7 Banks and 4 branches (5 Banks
and 4 branches @ 80% and 2 Banks @ 100%
shareholding)
- Hebei: 8 Banks (5 Banks @ 80% and 3 Banks
@ 100% shareholding).
♦ CBA Beijing, Shanghai and Hong Kong
branches
♦ BoCommLife JV (37.5%): operating in 7
provinces
♦ First State Investments Hong Kong and First
State Cinda JV (46%)
♦ Colonial Mutual Group Beijing Rep Office
Japan
♦ Tokyo CBA branch, First State Investments
Singapore
♦ CBA branch, First State Investments
Vietnam
♦ Vietnam International Bank (20%): 159 branches
♦ Hanoi Representative Office
♦ Ho Chi Minh City CBA branch; 29 ATMs
India
♦ Mumbai CBA branch

Economic
indicators

50
Additional
information Economic Indicators
Economic Summary – Australia
CBA Economist’s Forecasts
Credit Growth = 12 months to June qtr
GDP, Unemployment & CPI = Financial year average
Cash Rate = As at end June qtr
f = forecast
2011 2012 2013 2014 2015
(f)
2016
(f)
2017
(f)
Credit Growth % – Total 2.7 4.3 3.0 5.1 5-7 4½-6½ 4-6
Credit Growth % – Housing 6.0 5.0 4.6 6.4 6-7 5½-7½ 5-7
Credit Growth % – Business -2.2 4.4 0.9 3.5 4-6 3-5 3-5
Credit Growth % – Other Personal 0.6 -1.2 0.4 0.7 2-4 2½-4½ 2-4
GDP % 2.3 3.7 2.5 2.5 2.5 3.2 3.2
CPI % 3.1 2.3 2.3 2.7 1.7 2.6 2.9
Unemployment rate % 5.0 5.2 5.4 5.8 6.2 5.9 5.6
Cash Rate % 4¾ 3½ 2¾ 2½ 2 2 2
Economic Indicators

51
Key resource exports
Australian growth to run a little below trend in 2015 as growth transition proceeds
– the economy needs to generate more income and more jobs;
– resource exports set to deliver significant income boost;
– the growth transition to generate jobs is underway but the unemployment rate remains
high;
– more than construction required to drive growth over the medium term.
Australian economy – growth transition
3.0
4.3
5.7
7.0
0
15
30
45
Jul-11 Jul-12 Jul-13 Jul-14
'000 %
LABOUR MARKET INDICATORS
Required jobs growth
(lhs)
Trend jobs growth (lhs)
Unemploymentrate(rhs)
Labour market indicators Growth drivers from
mining peak
0
25
50
75
100
0
250
500
750
1000
1989 93 97 01 05 09 13 17 2021
KEY RESOURCE EXPORTSMt Mt
Ironore(lhs)
CBA(f)
LNG(rhs)
Coal(lhs)
-2
0
2
4
6
-2
0
2
4
6
Dec-12 Jun-13 Dec-13 Jun-14
%pts
GDP(rhs)
Downturn in mining capex
(lhs)
GROWTH DRIVERS FROM MINING PEAK(cumulative contribution to GDP since end 2012)
Rise in resource exports
(lhs)
Other(mainly non-
mining)(lhs)
%

52
0
20
40
60
2007/08 2010/11 2013/14 2016/17
$bn
Th
ou
san
ds
States
Federal
INFRASTRUCTURE SPEND(State & Federal)
Projections
Growth transition – Infrastructure & business investment
Infrastructure spend by Government will boost GDP. IMF estimates show a 1% of GDP lift in
infrastructure spending boosts output by 0.4% in Year 1 and 1.5% after four years.
RBA believes that it has created an environment where businesses can play their part in the
growth dynamic.
Infrastructure spend Business finances
40
48
55
63
70
100
300
500
700
900
Mar-05 Mar-09 Mar-13 Sep-06 Sep-10 Sep-14
NON-FINANCIAL BUSINESS FINANCES
Business Credit (lhs)
Business Bank Deposits (lhs)
Business Credit (% of GDP, rhs)
$bn %
53
CBA TEI & THE CASH RATE
3.8
4.4
5.1
5.7
6.4
7.0
Jul-97 Jul-99 Jul-01 Jul-03 Jul-05
-8
-5
-2
2
5
8
Cash
rate
(lhs)
CBA TEI*
(adv 9 mnths ,rhs)
%pa %pa
* Deviat ion from trend
-20
20
60
1001.0
2.3
3.7
5.0
Jul-98 Jul-01 Jul-04 Jul-07 Jul-10 Jul-13
EXPECTATIONS & WAGES
*Source: Melbourne Institute
%pa %
Unemploymentexpectations*
(net bal. exp. rise)(adv 12 months, inverse, rhs)
WPIprivate sector
(lhs)
-5
0
5
10
15
20
-5
0
5
10
15
20
Sep-72 Sep-80 Sep-88 Sep-96 Sep-04 Sep-12
SAVING RATIO% %
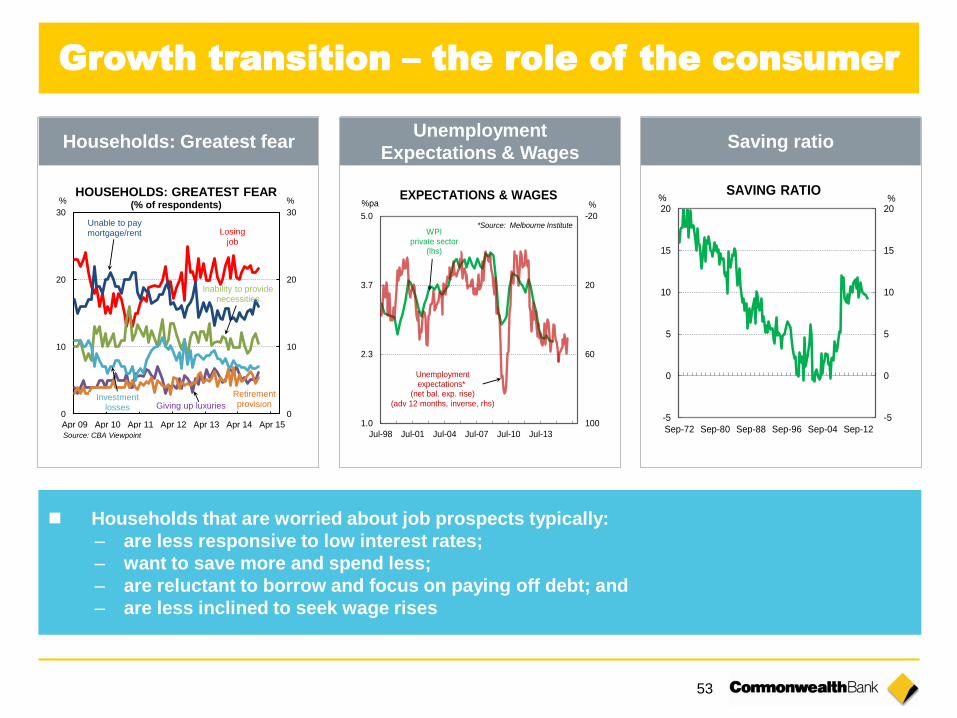
Growth transition – the role of the consumer
Households: Greatest fear Unemployment
Expectations & Wages Saving ratio
Households that are worried about job prospects typically:
– are less responsive to low interest rates;
– want to save more and spend less;
– are reluctant to borrow and focus on paying off debt; and
– are less inclined to seek wage rises
0
10
20
30
0
10
20
30
Apr 09 Apr 10 Apr 11 Apr 12 Apr 13 Apr 14 Apr 15
%%
Unable to pay mortgage/rent
Source: CBA Viewpoint
HOUSEHOLDS: GREATEST FEAR(% of respondents)
Losingjob
Inability to provide necessities
Investmentlosses
Retirement provisionGiving up luxuries

54
Growth transition – housing construction
Dwelling commencements look to have hit a record high in 2014, and will be at a
similar level in 2015.
Construction activity to run well above 150k “normal” level.
Composition of lending (more focussed on multi-density dwellings) argues for a
drawn out peak.
Dwelling commencements
130
150
170
190
130
150
170
190
1998 2002 2006 2010 2014
'000
Th
ou
san
ds
'000
Th
ou
san
ds
Average 2005-12 (ex 2010 stimulus
boost)
Boosted by government
stimulus package
DWELLING COMMENCEMENTS
CBA(f)
CBA Dwelling starts forecast
Calendar year Dwelling starts
2012 151k
2013 168k
2014e 198k
2015f 193k
2016f 183k

Recommended