Retail Strategy for the City of Cambridge
Market Analysis
Prepared by Larisa Ortiz Associates (LOA)
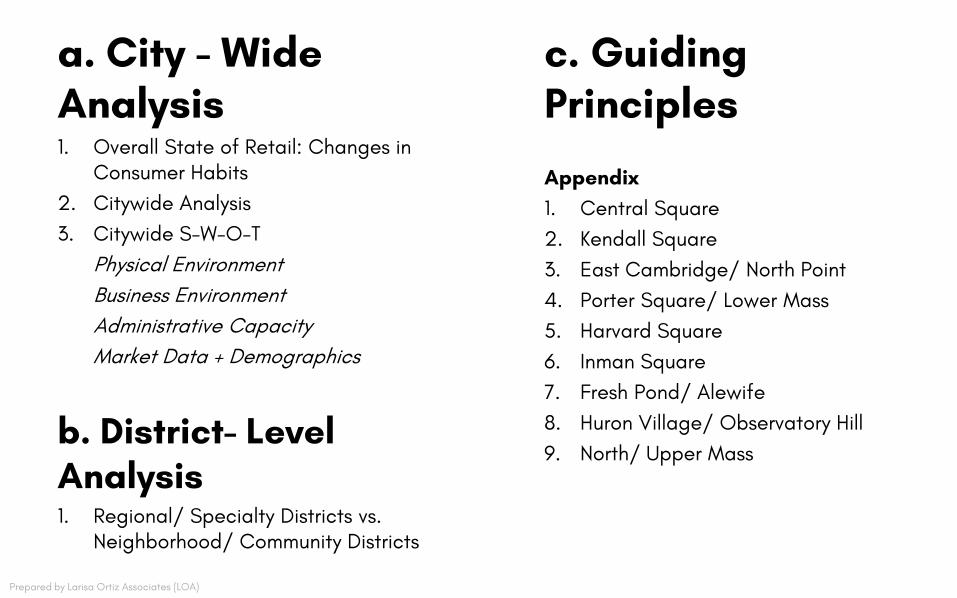
a. City - Wide Analysis 1. Overall State of Retail: Changes in
Consumer Habits
2. Citywide Analysis
3. Citywide S-W-O-T
Physical Environment Business Environment Administrative Capacity Market Data + Demographics
b. District- Level Analysis 1. Regional/ Specialty Districts vs.
Neighborhood/ Community Districts
c. Guiding Principles
Appendix 1. Central Square
2. Kendall Square
3. East Cambridge/ North Point
4. Porter Square/ Lower Mass
5. Harvard Square
6. Inman Square
7. Fresh Pond/ Alewife
8. Huron Village/ Observatory Hill
9. North/ Upper Mass
Prepared by Larisa Ortiz Associates (LOA)
Prepared by Larisa Ortiz Associates (LOA)
Overall State of Retail
b 0 0'
--=-- ----= - -
•••
~('~ t... .I
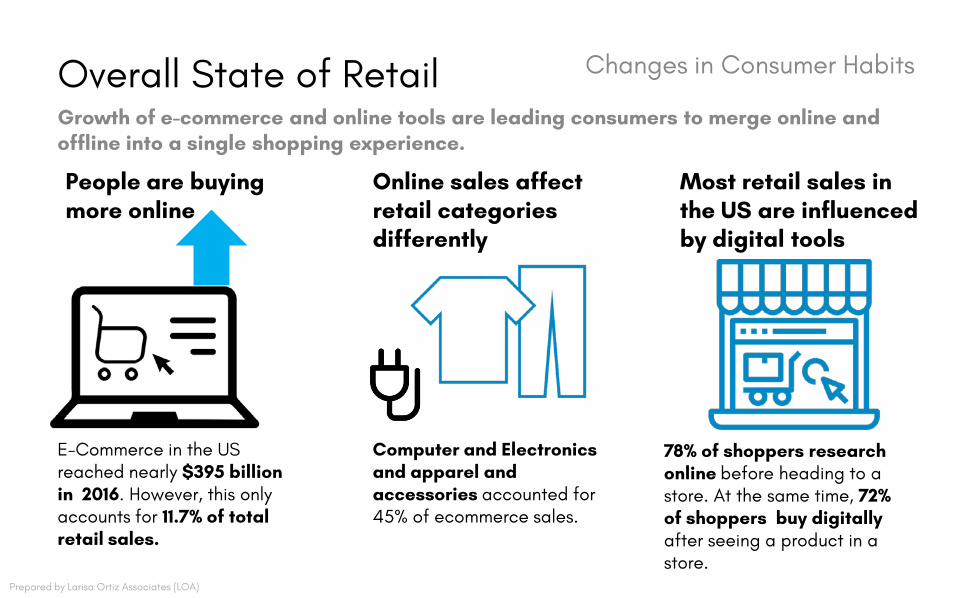
Changes in Consumer Habits Overall State of Retail Growth of e-commerce and online tools are leading consumers to merge online and offline into a single shopping experience.
People are buying Online sales affect Most retail sales in more online retail categories the US are influenced
differently by digital tools
E-Commerce in the US reached nearly $395 billion in 2016. However, this only accounts for 11.7% of total retail sales.
Computer and Electronics and apparel and accessories accounted for 45% of ecommerce sales.
78% of shoppers research online before heading to a store. At the same time, 72% of shoppers buy digitally after seeing a product in a store.
Prepared by Larisa Ortiz Associates (LOA)
• • •
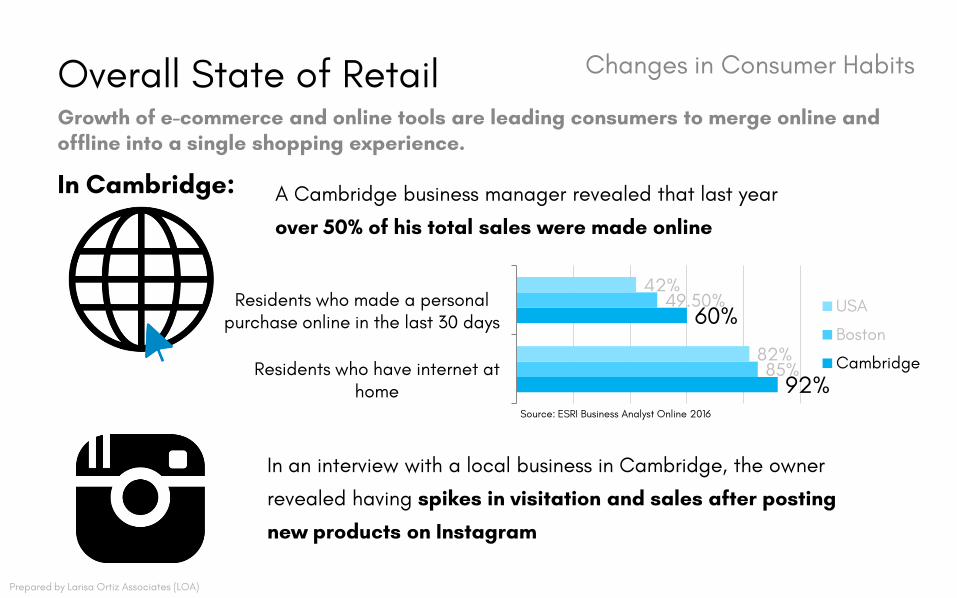
Changes in Consumer Habits Overall State of Retail Growth of e-commerce and online tools are leading consumers to merge online and offline into a single shopping experience.
In Cambridge: A Cambridge business manager revealed that last year
over 50% of his total sales were made online
42% Residents who made a personal 49.50% USA 60% purchase online in the last 30 days
Boston 82% Cambridge Residents who have internet at 85%
92% home Source: ESRI Business Analyst Online 2016
In an interview with a local business in Cambridge, the owner
revealed having spikes in visitation and sales after posting
new products on Instagram
Prepared by Larisa Ortiz Associates (LOA)
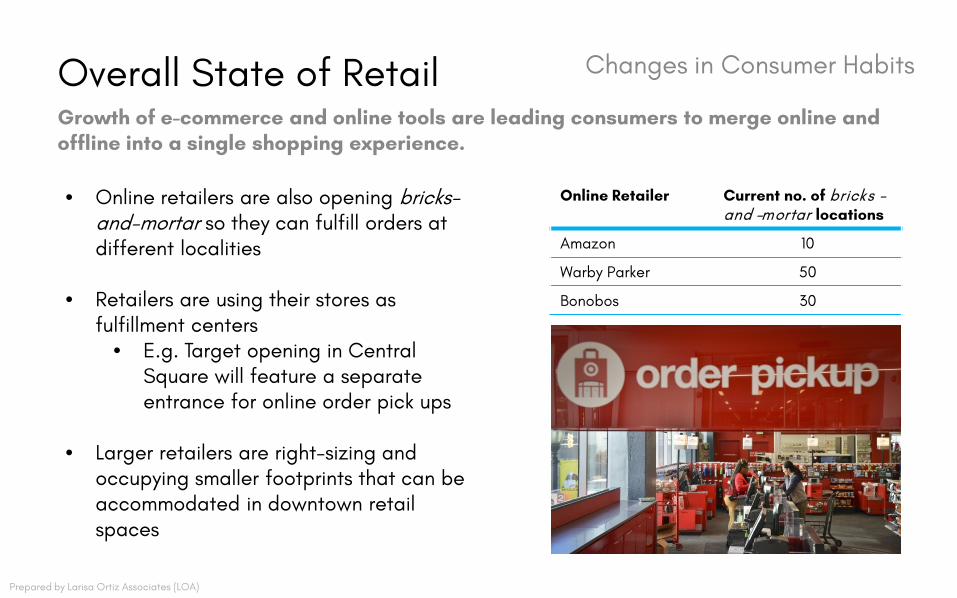
Changes in Consumer Habits Overall State of Retail Growth of e-commerce and online tools are leading consumers to merge online and offline into a single shopping experience.
Online Retailer Current no. of bricks • Online retailers are also opening bricks-and -mortar locations and-mortar so they can fulfill orders at
Amazon 10different localities Warby Parker 50
Bonobos 30
fulfillment centers • Retailers are using their stores as
• E.g. Target opening in Central Square will feature a separate entrance for online order pick ups
• Larger retailers are right-sizing and occupying smaller footprints that can be accommodated in downtown retail spaces
Prepared by Larisa Ortiz Associates (LOA)
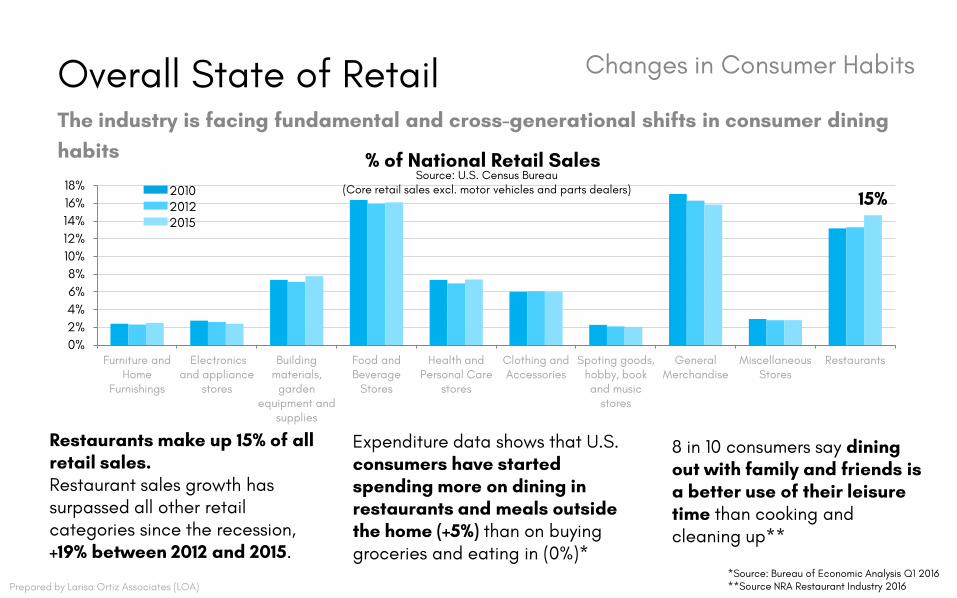
Changes in Consumer Habits Overall State of Retail The industry is facing fundamental and cross-generational shifts in consumer dining habits 18% 16% 14% 12% 10% 8% 6% 4% 2% 0%
Furniture and Electronics Building Home and appliance materials,
Furnishings stores garden equipment and
supplies
Restaurants make up 15% of all retail sales. Restaurant sales growth has surpassed all other retail categories since the recession, +19% between 2012 and 2015.
% of National Retail Sales Source: U.S. Census Bureau
15% (Core retail sales excl. motor vehicles and parts dealers) 2010 2012 2015
Food and Health and Clothing and Spoting goods, Beverage Personal Care Accessories hobby, book
Stores stores and music stores
Expenditure data shows that U.S. consumers have started spending more on dining in restaurants and meals outside the home (+5%) than on buying groceries and eating in (0%)*
General Miscellaneous Restaurants Merchandise Stores
8 in 10 consumers say dining out with family and friends is a better use of their leisure time than cooking and cleaning up**
Prepared by Larisa Ortiz Associates (LOA) *Source: Bureau of Economic Analysis Q1 2016 **Source NRA Restaurant Industry 2016
/
,/ '"\.,
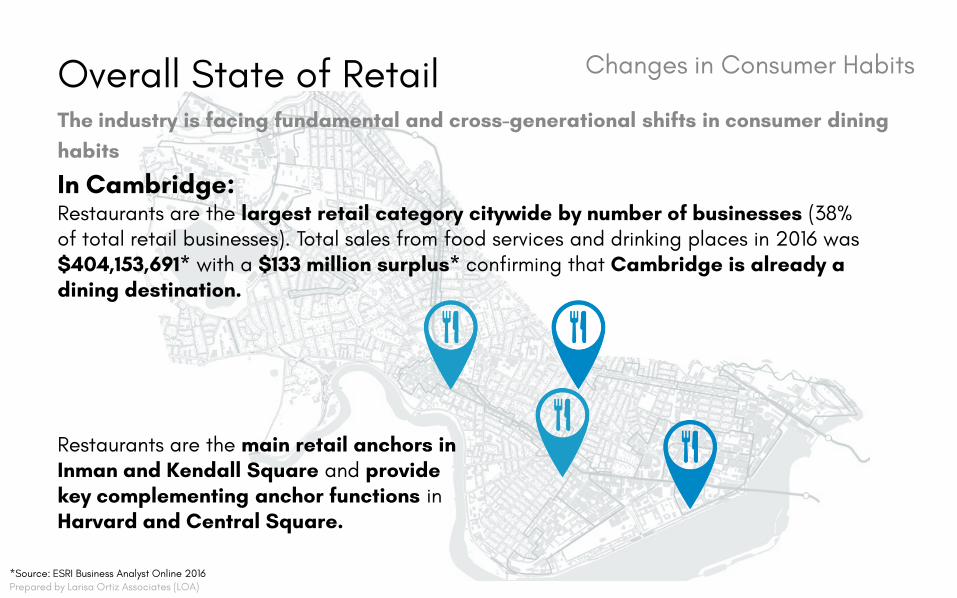
Changes in Consumer Habits Overall State of Retail The industry is facing fundamental and cross-generational shifts in consumer dining habits
In Cambridge: Restaurants are the largest retail category citywide by number of businesses (38% of total retail businesses). Total sales from food services and drinking places in 2016 was
dining destination.
Restaurants are the main retail anchors in Inman and Kendall Square and provide key complementing anchor functions in
$404,153,691* with a $133 million surplus* confirming that Cambridge is already a
Harvard and Central Square.
*Source: ESRI Business Analyst Online 2016 Prepared by Larisa Ortiz Associates (LOA)
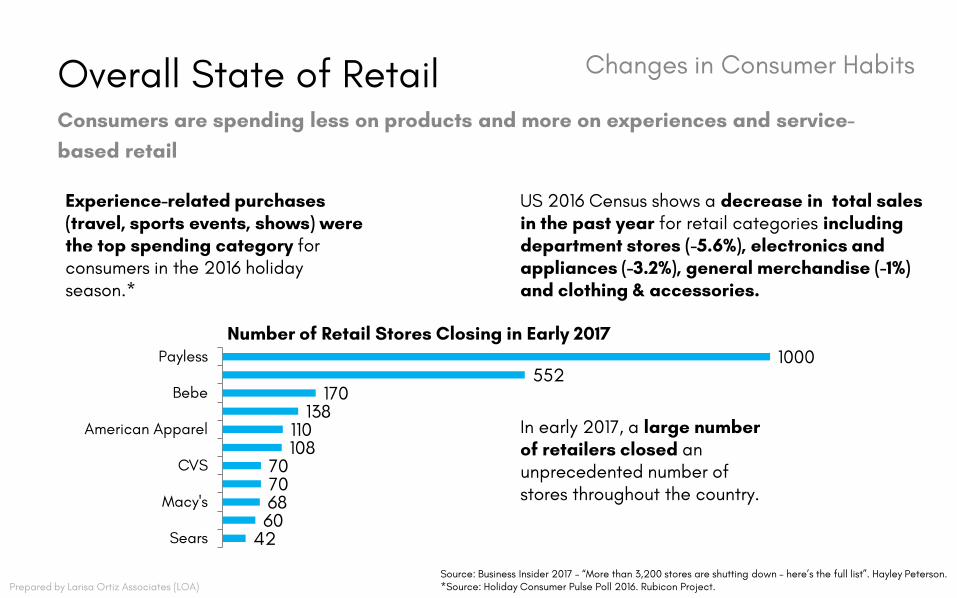
Changes in Consumer Habits Overall State of Retail Consumers are spending less on products and more on experiences and service-based retail
Experience-related purchases (travel, sports events, shows) were the top spending category for consumers in the 2016 holiday season.*
Payless
Bebe
American Apparel
CVS
Macy's
Sears
US 2016 Census shows a decrease in total sales in the past year for retail categories including department stores (-5.6%), electronics and appliances (-3.2%), general merchandise (-1%) and clothing & accessories.
Number of Retail Stores Closing in Early 2017 1000
552 170
138 110 In early 2017, a large number 108 of retailers closed an
70 unprecedented number of 70 stores throughout the country. 68
60 42
Prepared by Larisa Ortiz Associates (LOA) Source: Business Insider 2017 – “More than 3,200 stores are shutting down – here’s the full list”. Hayley Peterson. *Source: Holiday Consumer Pulse Poll 2016. Rubicon Project.
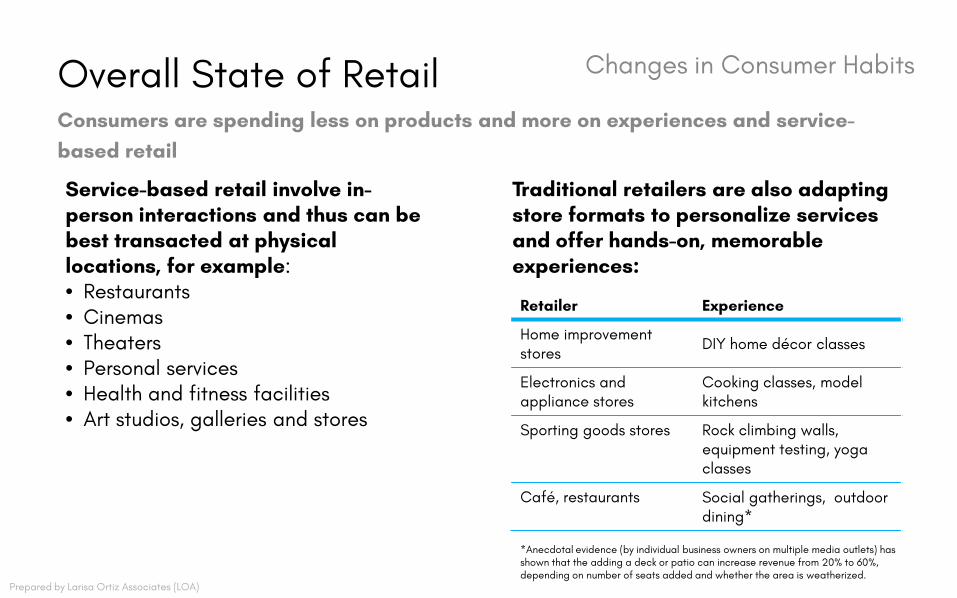
Changes in Consumer Habits Overall State of Retail Consumers are spending less on products and more on experiences and service-based retail
Service-based retail involve in-person interactions and thus can be best transacted at physical locations, for example: • Restaurants • Cinemas • Theaters • Personal services • Health and fitness facilities • Art studios, galleries and stores
Traditional retailers are also adapting store formats to personalize services and offer hands-on, memorable experiences:
Retailer Experience
Home improvement DIY home décor classes
stores
Electronics and Cooking classes, model appliance stores kitchens
Sporting goods stores Rock climbing walls, equipment testing, yoga classes
Café, restaurants Social gatherings, outdoor dining*
*Anecdotal evidence (by individual business owners on multiple media outlets) has shown that the adding a deck or patio can increase revenue from 20% to 60%, depending on number of seats added and whether the area is weatherized.
Prepared by Larisa Ortiz Associates (LOA)
Prepared by Larisa Ortiz Associates (LOA)
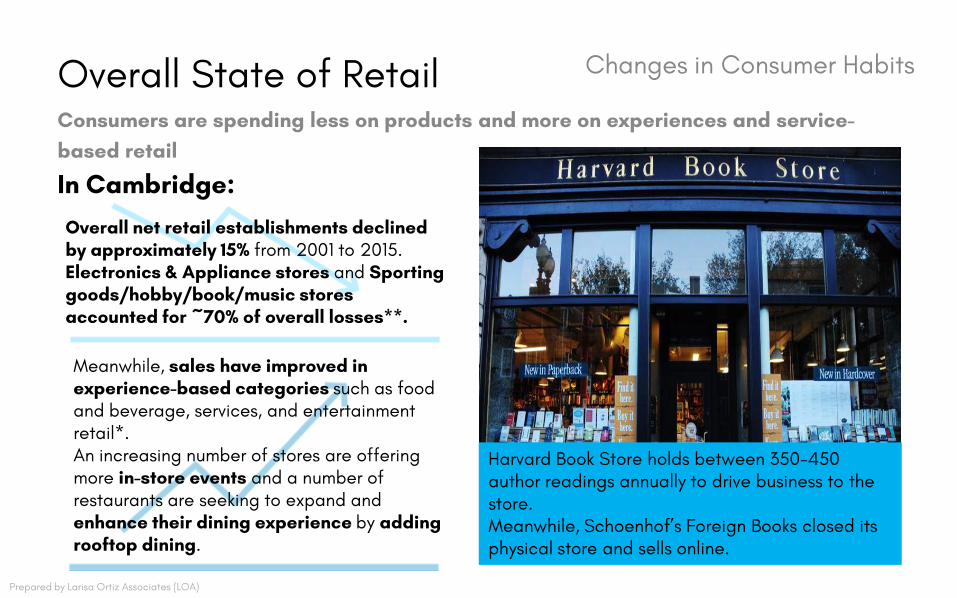
Changes in Consumer Habits Overall State of Retail Consumers are spending less on products and more on experiences and service-based retail
In Cambridge: Overall net retail establishments declined by approximately 15% from 2001 to 2015. Electronics & Appliance stores and Sporting goods/hobby/book/music stores accounted for ~70% of overall losses**.
Meanwhile, sales have improved in experience-based categories such as food and beverage, services, and entertainment retail*. An increasing number of stores are offering Harvard Book Store holds between 350-450 more in-store events and a number of author readings annually to drive business to the restaurants are seeking to expand and store. enhance their dining experience by adding Meanwhile, Schoenhof’s Foreign Books closed its rooftop dining. physical store and sells online.
.. • T-Moblle 4G
@
Q O 1i' A Q
07:3&
G Q
• 9~1111) ••• •• T-Mobile 4G 07:3&
jcrew
Ruffle-Hem Midi DrHI In Liberty Wilt1hire Flor• I
• 93"•
This pretty dreu with • ruffle hem 1s lhe ulbmale leminme pidt for eve-rythmg ·drnsy-ish.· Pius, it's FN<le in a vintage pattern lrom Liberty "11 Fabrics, the British pnnt house that's been known for 11s mood-lilting lk>rats since 1875. This mot1I in particular was created lor the bftnd over 80 years ago and is one of our personal favorites Falls below knee, 43• 1rom high po111t of shoulder (~sed on size &).Cotton.Dry clean.Import.Online only.
.....
••
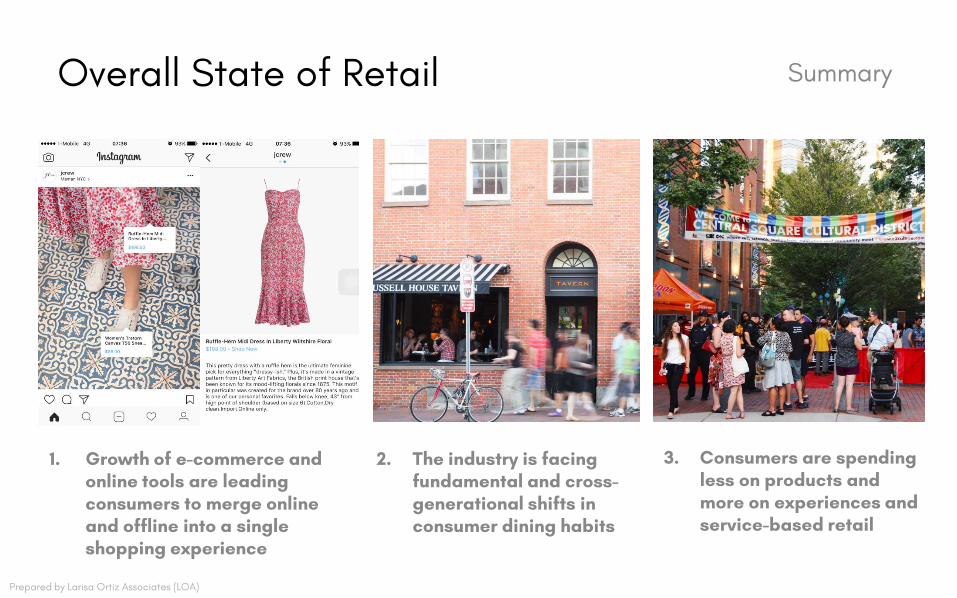
Overall State of Retail Summary
1. Growth of e-commerce and online tools are leading consumers to merge online and offline into a single shopping experience
2. The industry is facing fundamental and cross-generational shifts in consumer dining habits
3. Consumers are spending less on products and more on experiences and service-based retail
Prepared by Larisa Ortiz Associates (LOA)
Prepared by Larisa Ortiz Associates (LOA)
City- Wide Analysis
I I I I I
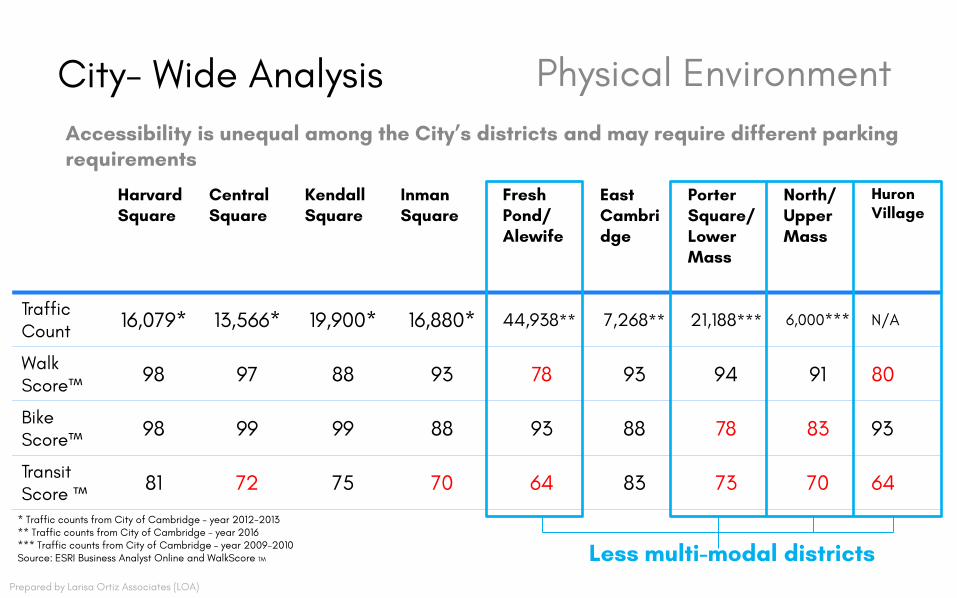
City- Wide Analysis Physical Environment Accessibility is unequal among the City’s districts and may require different parking requirements
Harvard Square
Central Square
Kendall Square
Inman Square
Fresh Pond/ Alewife
East Cambri dge
Porter Square/ Lower Mass
North/ Upper Mass
Huron Village
Traffic Count 16,079* 13,566* 19,900* 16,880* 44,938** 7,268** 21,188*** 6,000*** N/A
Walk Score™ 98 97 88 93 78 93 94 91 80
Bike Score™ 98 99 99 88 93 88 78 83 93
Transit Score ™ 81 72 75 70 64 83 73 70 64
Less multi-modal districts
* Traffic counts from City of Cambridge – year 2012-2013 ** Traffic counts from City of Cambridge – year 2016 *** Traffic counts from City of Cambridge – year 2009-2010 Source: ESRI Business Analyst Online and WalkScore TM
Prepared by Larisa Ortiz Associates (LOA)
t t t
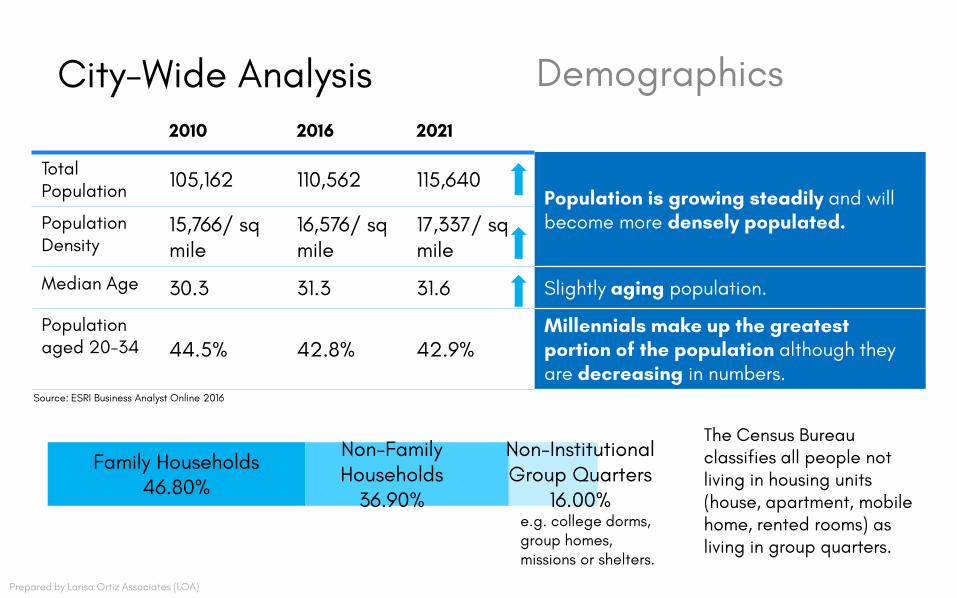
City-Wide Analysis Demographics 2010 2016 2021
Total 105,162 110,562 115,640 Population
Population 15,766/ sq 16,576/ sq 17,337/ sq Density mile mile mile
Median Age 30.3 31.3 31.6
Population is growing steadily and will become more densely populated.
Slightly aging population.
Millennials make up the greatest portion of the population although they are decreasing in numbers.
Population aged 20-34 44.5% 42.8% 42.9%
Source: ESRI Business Analyst Online 2016
Non-Family Households
Non-Institutional
36.90% Group Quarters
16.00%
The Census Bureau classifies all people not Family Households living in housing units 46.80% (house, apartment, mobile
e.g. college dorms, home, rented rooms) as group homes, living in group quarters. missions or shelters.
Prepared by Larisa Ortiz Associates (LOA)
t
t t t
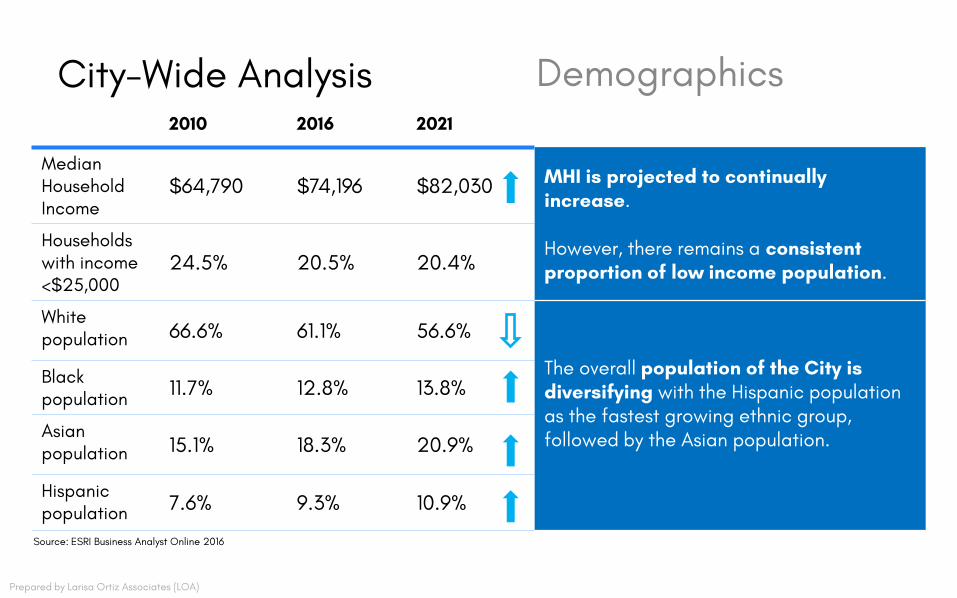
City-Wide Analysis Demographics 2010 2016 2021
Median Household Income
$64,790 $74,196 $82,030
Households with income <$25,000
24.5% 20.5% 20.4%
MHI is projected to continually increase.
However, there remains a consistent proportion of low income population.
White 66.6% 61.1% 56.6% population
The overall population of the City is Black 11.7% 12.8% 13.8% diversifying with the Hispanic population population as the fastest growing ethnic group,
Asian followed by the Asian population. 15.1% 18.3% 20.9% population
Hispanic 7.6% 9.3% 10.9% population
Source: ESRI Business Analyst Online 2016
Prepared by Larisa Ortiz Associates (LOA)
City-Wide Analysis Demographics
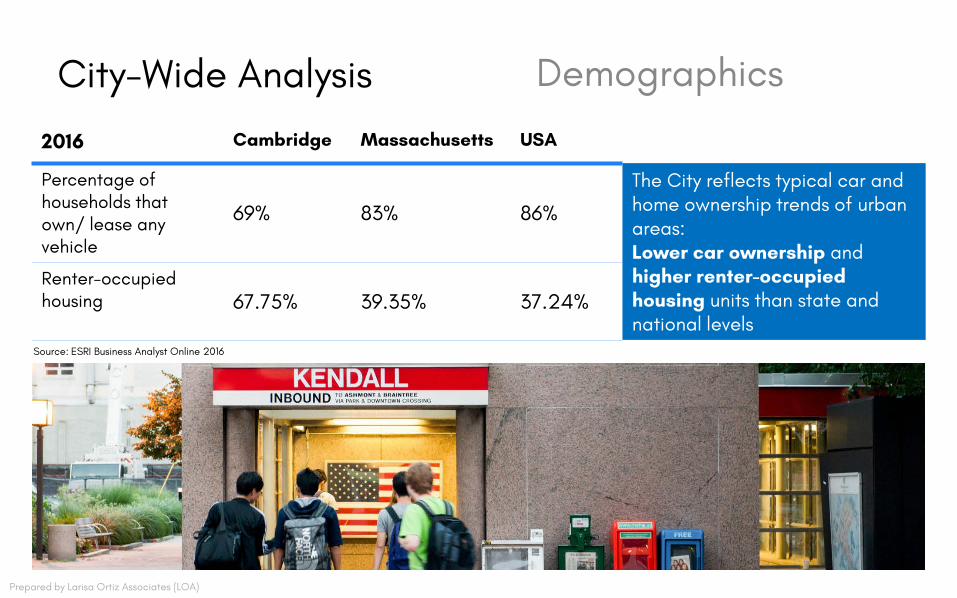
2016 Cambridge Massachusetts USA
Percentage of The City reflects typical car and households that own/ lease any 69% 83% 86% home ownership trends of urban
areas: vehicle Lower car ownership and Renter-occupied higher renter-occupied housing 67.75% 39.35% 37.24% housing units than state and
national levels Source: ESRI Business Analyst Online 2016
Prepared by Larisa Ortiz Associates (LOA)
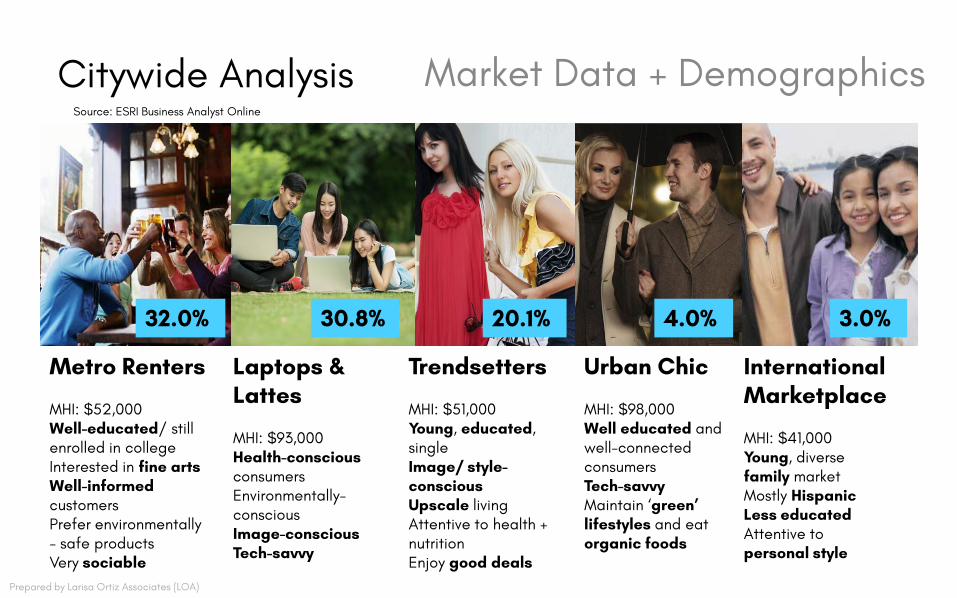
Citywide Analysis Market Data + Demographics Source: ESRI Business Analyst Online
32.0% 30.8% 20.1% 4.0% 3.0%
Metro Renters
MHI: $52,000 Well-educated/ still enrolled in college Interested in fine arts Well-informed customers Prefer environmentally - safe products Very sociable
Laptops & Lattes
MHI: $93,000 Health-conscious consumers Environmentally- conscious Image-conscious Tech-savvy
Trendsetters
MHI: $51,000 Young, educated, single Image/ style-conscious Upscale living Attentive to health + nutrition Enjoy good deals
Urban Chic
MHI: $98,000 Well educated and well-connected consumers Tech-savvy Maintain ‘green’ lifestyles and eat organic foods
International Marketplace
MHI: $41,000 Young, diverse family market Mostly Hispanic Less educated Attentive to personal style
Prepared by Larisa Ortiz Associates (LOA)
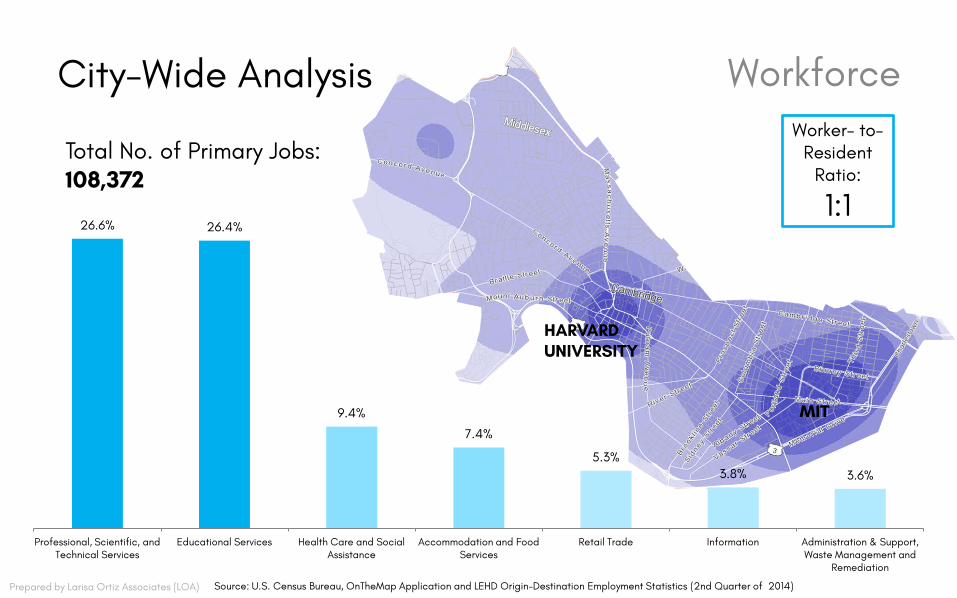
26.6% 26.4%
9.4%
7.4%
5.3% 3.8% 3.6%
City-Wide Analysis Workforce Worker- to-
Resident Ratio:
1:1
Total No. of Primary Jobs: 108,372
MIT
HARVARD UNIVERSITY
Professional, Scientific, and Technical Services
Educational Services Health Care and Social Assistance
Accommodation and Food Services
Retail Trade Information Administration & Support, Waste Management and
Remediation
Source: U.S. Census Bureau, OnTheMap Application and LEHD Origin-Destination Employment Statistics (2nd Quarter of 2014) Prepared by Larisa Ortiz Associates (LOA)
•
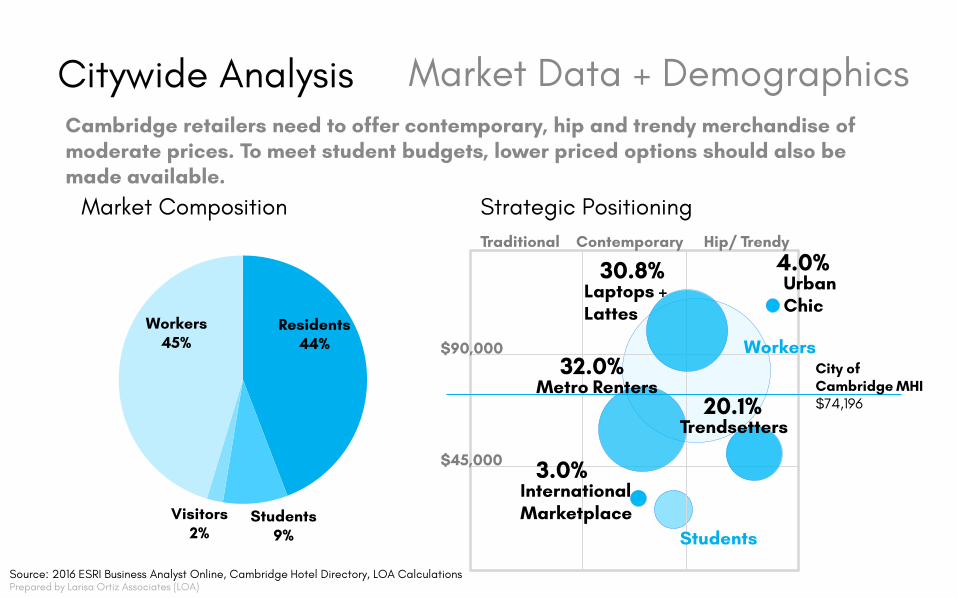
Citywide Analysis Market Data + Demographics Cambridge retailers need to offer contemporary, hip and trendy merchandise of moderate prices. To meet student budgets, lower priced options should also be made available.
Market Composition Strategic Positioning
Source: 2016 ESRI Business Analyst Online, Cambridge Hotel Directory, LOA Calculations
Residents 44%
Students 9%
Visitors 2%
Workers 45%
$45,000
$90,000
Traditional Contemporary Hip/ Trendy
Metro Renters
Trendsetters
Workers
International Marketplace
Laptops + Lattes
Urban Chic
Students
32.0%
30.8%
20.1%
4.0%
3.0%
City of Cambridge MHI $74,196
Prepared by Larisa Ortiz Associates (LOA)
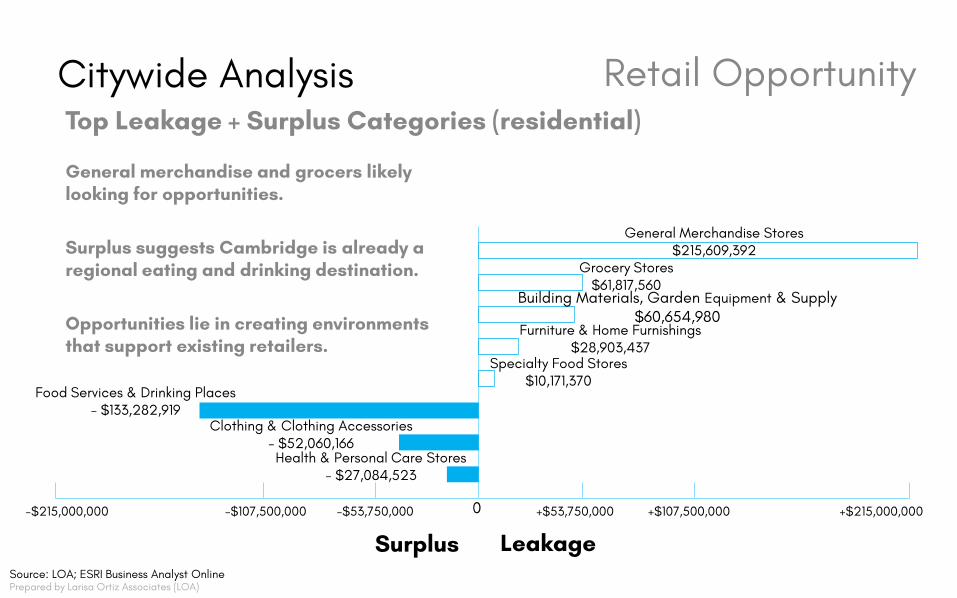
Citywide Analysis Retail Opportunity Top Leakage + Surplus Categories (residential)
General merchandise and grocers likely looking for opportunities.
General Merchandise Stores $215,609,392
Building Materials, Garden Equipment & Supply $60,654,980
Furniture & Home Furnishings $28,903,437
Specialty Food Stores $10,171,370
Surplus suggests Cambridge is already a regional eating and drinking destination.
Opportunities lie in creating environments that support existing retailers.
Grocery Stores $61,817,560
Food Services & Drinking Places - $133,282,919
Clothing & Clothing Accessories - $52,060,166 Health & Personal Care Stores
- $27,084,523
-$215,000,000 -$107,500,000 -$53,750,000 0 +$53,750,000 +$107,500,000 +$215,000,000
Surplus Leakage Source: LOA; ESRI Business Analyst Online Prepared by Larisa Ortiz Associates (LOA)
\
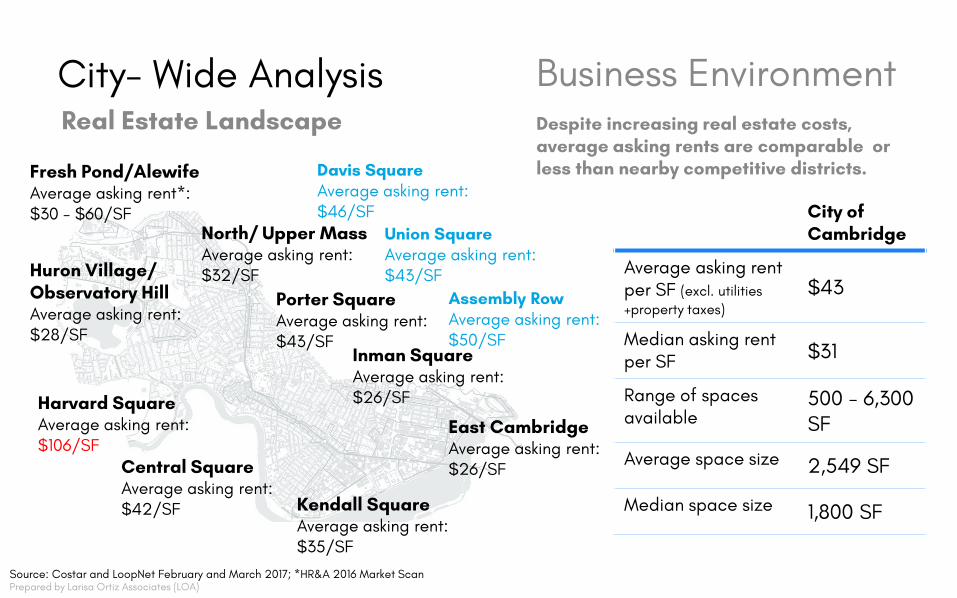
City- Wide Analysis Business Environment Real Estate Landscape Despite increasing real estate costs,
average asking rents are comparable or Fresh Pond/Alewife Davis Square less than nearby competitive districts. Average asking rent*: Average asking rent: $30 - $60/SF $46/SF City of
North/ Upper Mass Union Square Cambridge Average asking rent: Average asking rent:
Average asking rent Huron Village/ $32/SF $43/SF per SF (excl. utilities $43 Observatory Hill Porter Square Assembly Row +property taxes) Average asking rent: Average asking rent: Average asking rent:
$28/SF Median asking rent $43/SF $50/SF $31 Inman Square per SF
Average asking rent: $26/SF Range of spaces 500 - 6,300 Harvard Square
available Average asking rent: East Cambridge SF $106/SF Average asking rent: Average space size 2,549 SF
Average asking rent: $42/SF Kendall Square
Central Square $26/SF
Median space size 1,800 SF Average asking rent: $35/SF
Source: Costar and LoopNet February and March 2017; *HR&A 2016 Market Scan Prepared by Larisa Ortiz Associates (LOA)
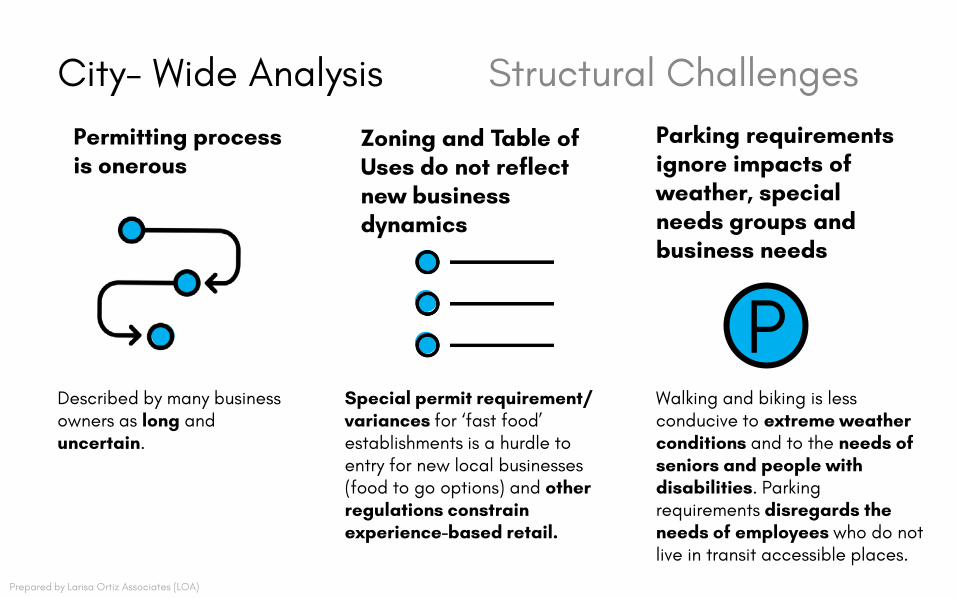
City- Wide Analysis Structural Challenges
Permitting process is onerous
Described by many business owners as long and uncertain.
Zoning and Table of Uses do not reflect new business dynamics
Special permit requirement/ variances for ‘fast food’ establishments is a hurdle to entry for new local businesses (food to go options) and other regulations constrain experience-based retail.
Parking requirements ignore impacts of weather, special needs groups and business needs
P Walking and biking is less conducive to extreme weather conditions and to the needs of seniors and people with disabilities. Parking requirements disregards the needs of employees who do not live in transit accessible places.
Prepared by Larisa Ortiz Associates (LOA)
--~f------------~.... --~f------------~ ....
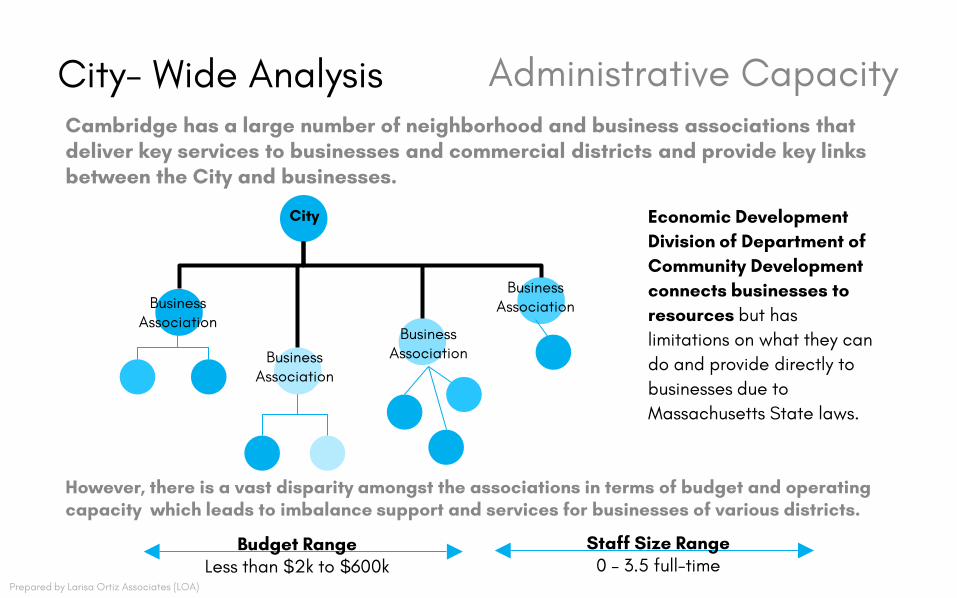
City- Wide Analysis Administrative Capacity Cambridge has a large number of neighborhood and business associations that deliver key services to businesses and commercial districts and provide key links between the City and businesses.
City
Business Association Business
Association Business
Association Business Association
Economic Development Division of Department of Community Development connects businesses to resources but has limitations on what they can do and provide directly to businesses due to Massachusetts State laws.
However, there is a vast disparity amongst the associations in terms of budget and operating capacity which leads to imbalance support and services for businesses of various districts.
Staff Size Range Budget Range 0 – 3.5 full-time Less than $2k to $600k
Prepared by Larisa Ortiz Associates (LOA)
Prepared by Larisa Ortiz Associates (LOA)
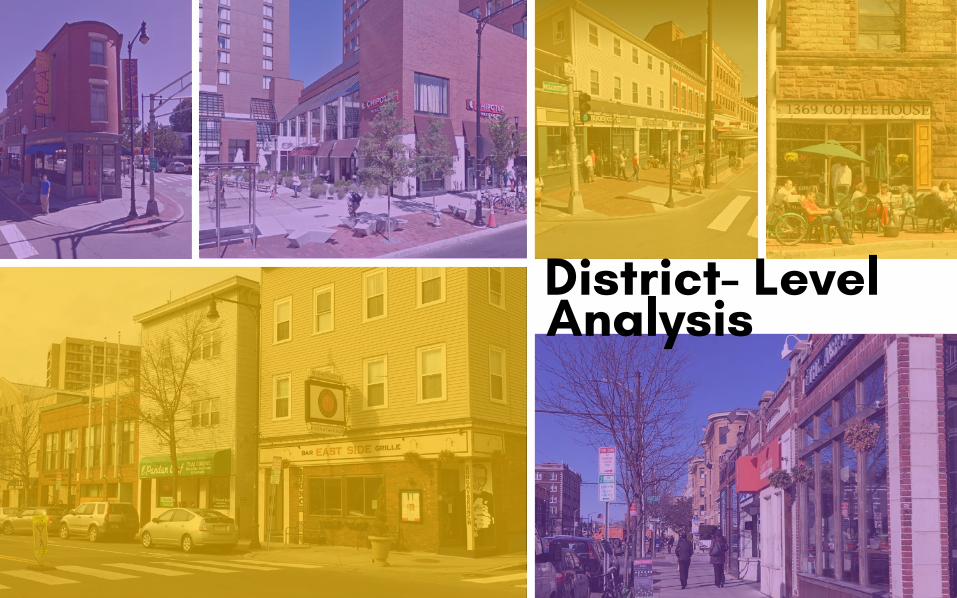
District- Level Analysis
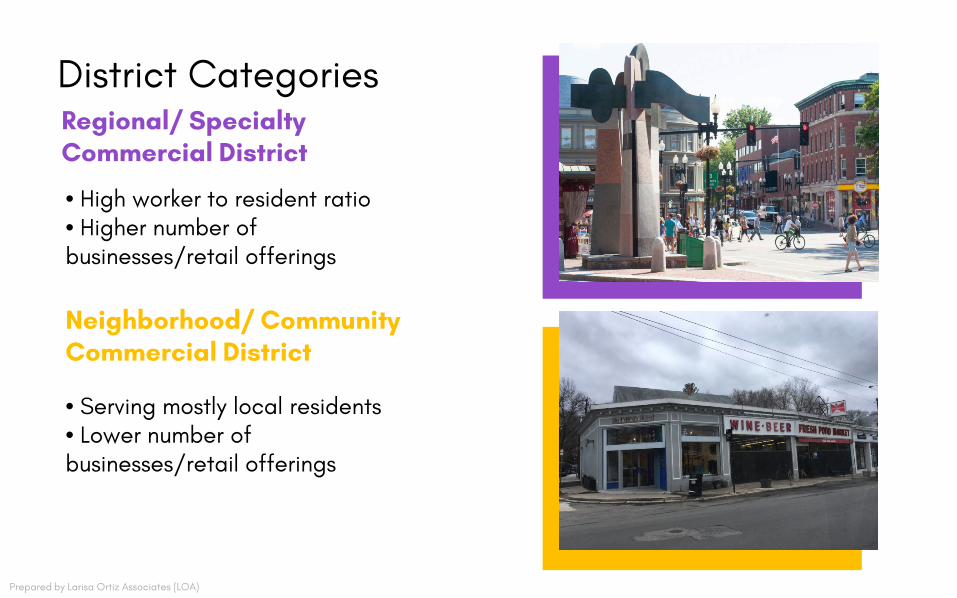
District Categories Regional/ Specialty Commercial District
• High worker to resident ratio • Higher number of businesses/retail offerings
Neighborhood/ Community Commercial District
• Serving mostly local residents • Lower number of businesses/retail offerings
Prepared by Larisa Ortiz Associates (LOA)
• • D •
,.,._ D •
\. ~ •
D
" ~,
v ' :.-.c....
• \.J,l'\
• I
D
(] • • D
• D CJ :
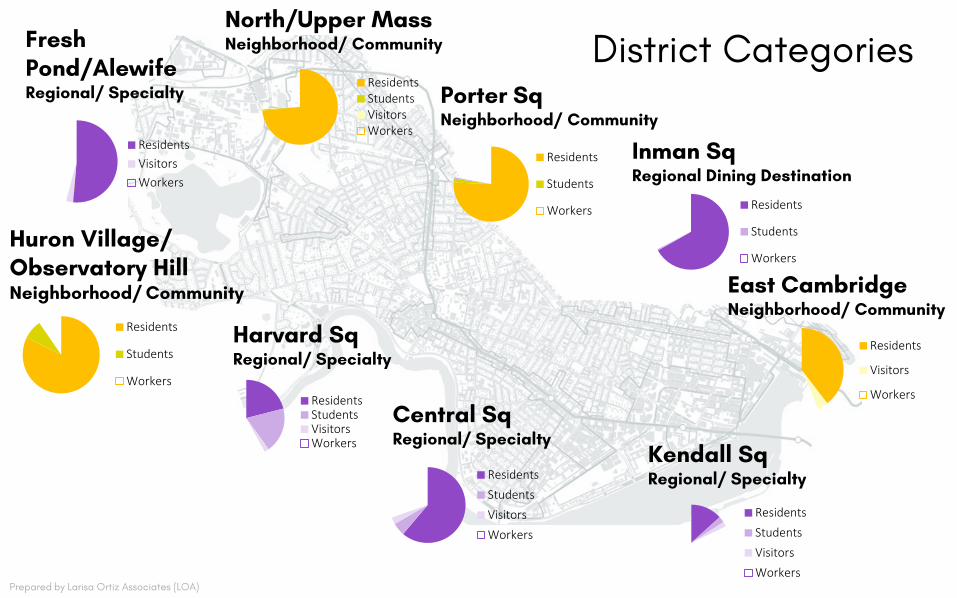
North/Upper Mass
Fresh Neighborhood/ Community District Categories Pond/Alewife Residents
Regional/ Specialty Students Porter Sq Visitors Neighborhood/ Community Workers
Residents Visitors Workers
Huron Village/ Observatory Hill Neighborhood/ Community
Residents
Students
Workers
Harvard Sq Regional/ Specialty
Residents Students Visitors Workers
Residents Students Visitors Workers
Residents Inman Sq Students
Workers
Central Sq Regional/ Specialty
Regional Dining Destination
Residents
Students
Workers
East Cambridge Neighborhood/ Community
Residents
Visitors
Workers
Kendall Sq Regional/ Specialty
Residents Students Visitors Workers
Prepared by Larisa Ortiz Associates (LOA)
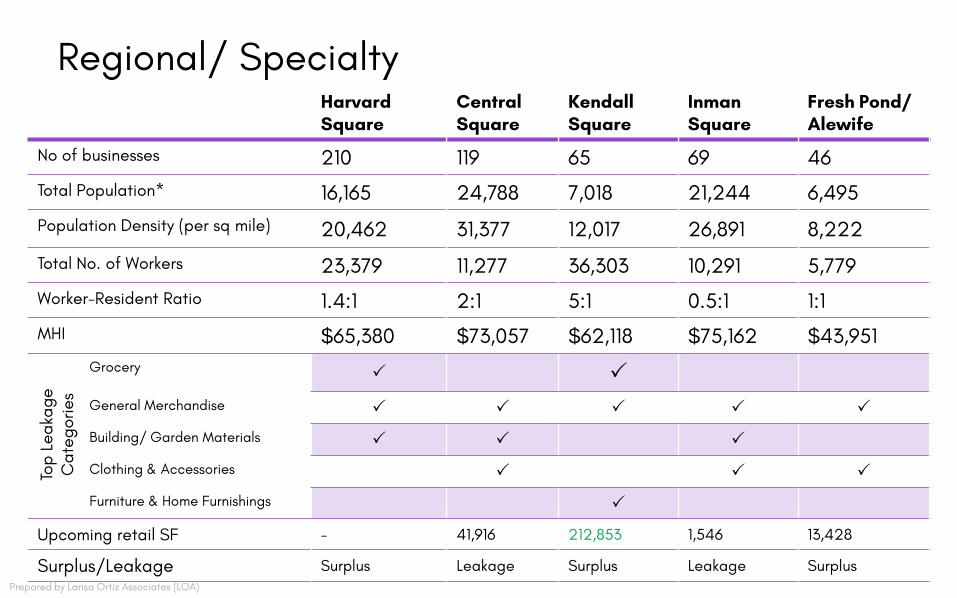
Regional/ Specialty
Harvard Square
Central Square
Kendall Square
Inman Square
Fresh Pond/ Alewife
No of businesses 210 119 65 69 46
Total Population* 16,165 24,788 7,018 21,244 6,495
Population Density (per sq mile) 20,462 31,377 12,017 26,891 8,222
Total No. of Workers 23,379 11,277 36,303 10,291 5,779
Worker-Resident Ratio 1.4:1 2:1 5:1 0.5:1 1:1
MHI $65,380 $73,057 $62,118 $75,162 $43,951 Grocery General Merchandise
Building/ Garden Materials
Clothing & Accessories
Furniture & Home Furnishings
Upcoming retail SF - 41,916 212,853 1,546 13,428
Surplus/Leakage Surplus Leakage Surplus Leakage Surplus
Top
Lea
kag
eC
ate
gor
ies
Prepared by Larisa Ortiz Associates (LOA)
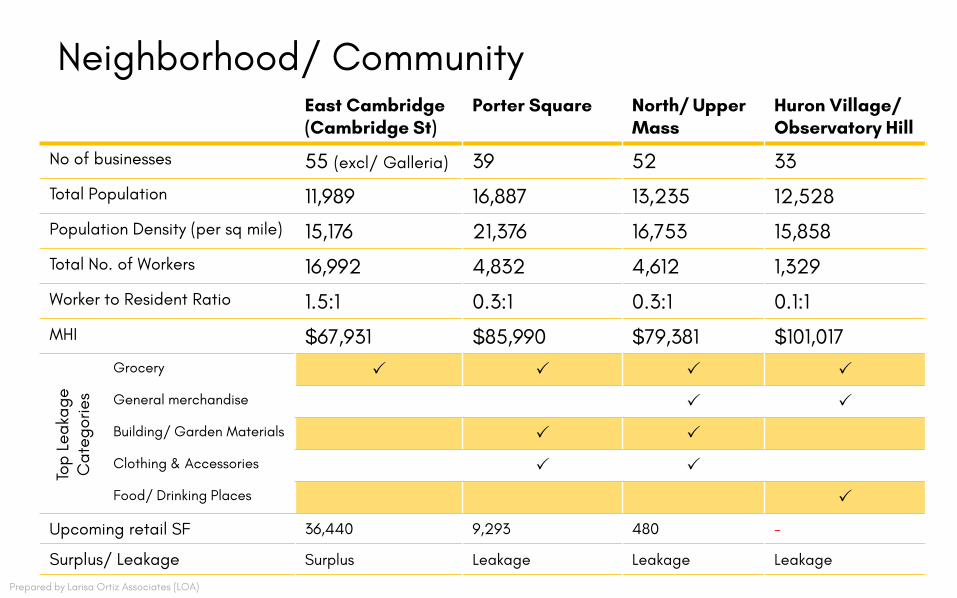
Neighborhood/ CommunityEast Cambridge (Cambridge St)
Porter Square North/ Upper Mass
Huron Village/ Observatory Hill
No of businesses 55 (excl/ Galleria) 39 52 33
Total Population 11,989 16,887 13,235 12,528
Population Density (per sq mile) 15,176 21,376 16,753 15,858
Total No. of Workers 16,992 4,832 4,612 1,329
Worker to Resident Ratio 1.5:1 0.3:1 0.3:1 0.1:1
MHI $67,931 $85,990 $79,381 $101,017 Grocery
General merchandise
Building/ Garden Materials
Clothing & Accessories
Food/ Drinking Places
Upcoming retail SF 36,440 9,293 480 -
Surplus/ Leakage Surplus Leakage Leakage Leakage
Top
Lea
kag
eC
ate
gor
ies
Prepared by Larisa Ortiz Associates (LOA)

Prepared by Larisa Ortiz Associates (LOA)
GUIDING PRINCIPLES
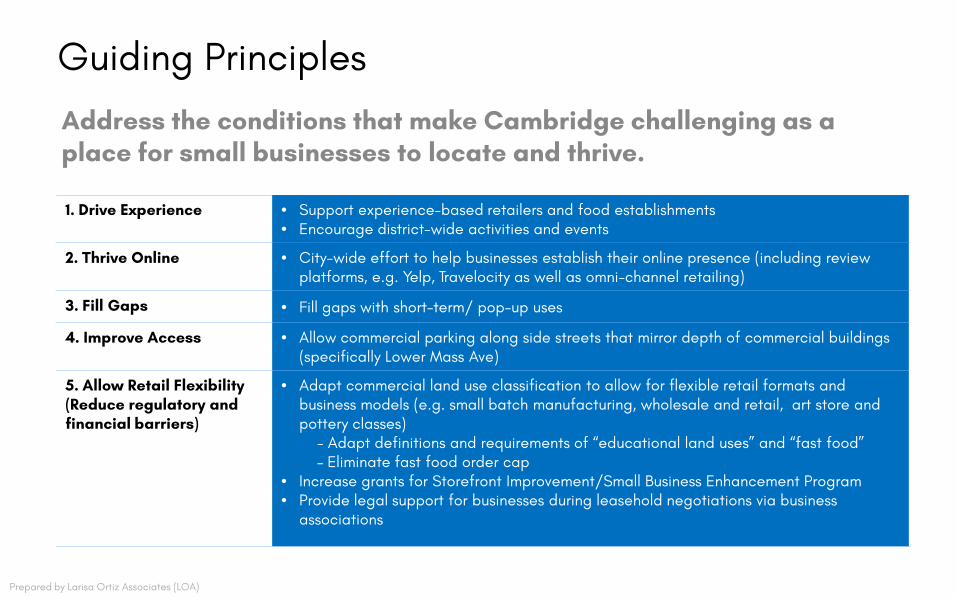
Guiding Principles
Address the conditions that make Cambridge challenging as a place for small businesses to locate and thrive.
1. Drive Experience • Support experience-based retailers and food establishments • Encourage district-wide activities and events
2. Thrive Online • City-wide effort to help businesses establish their online presence (including review platforms, e.g. Yelp, Travelocity as well as omni-channel retailing)
3. Fill Gaps
4. Improve Access
• Fill gaps with short-term/ pop-up uses
• Allow commercial parking along side streets that mirror depth of commercial buildings (specifically Lower Mass Ave)
5. Allow Retail Flexibility (Reduce regulatory and financial barriers)
• Adapt commercial land use classification to allow for flexible retail formats and business models (e.g. small batch manufacturing, wholesale and retail, art store and pottery classes)
- Adapt definitions and requirements of “educational land uses” and “fast food” – Eliminate fast food order cap
• Increase grants for Storefront Improvement/Small Business Enhancement Program • Provide legal support for businesses during leasehold negotiations via business
associations
Prepared by Larisa Ortiz Associates (LOA)

APPENDIX
Prepared by Larisa Ortiz Associates (LOA)
Prepared by Larisa Ortiz Associates (LOA)
' i
L - L -
Harvard Square
Photo: Massachusetts Office of Travel and Tourism (via Flickr)
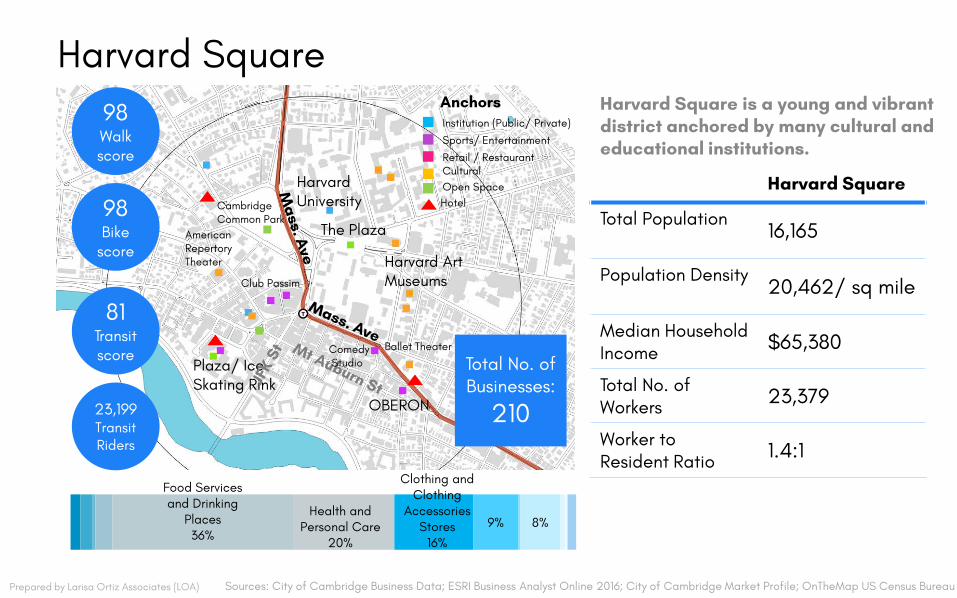
Harvard Square 98 Walk score
98 Bike
score
81 Transit score
23,199 Transit Riders
Harvard University
American Repertory Theater
Ballet Theater
Harvard Art Museums
The Plaza
Club Passim
Plaza/ Ice Skating Rink
Cambridge Common Park
Comedy Studio
OBERON
Anchors Harvard Square is a young and vibrant Institution (Public/ Private) district anchored by many cultural and Sports/ Entertainment educational institutions. Retail / Restaurant Cultural Open Space Harvard Square Hotel
Total Population 16,165
Population Density 20,462/ sq mile
Total No. of Businesses:
210
Median Household $65,380 Income
Total No. of 23,379 Workers
Worker to 1.4:1 Resident Ratio Clothing and
Food Services and Drinking
Places 36%
Health and Personal Care
Accessories
20% Stores
16%
9%
Clothing
8%
Prepared by Larisa Ortiz Associates (LOA) Sources: City of Cambridge Business Data; ESRI Business Analyst Online 2016; City of Cambridge Market Profile; OnTheMap US Census Bureau
•
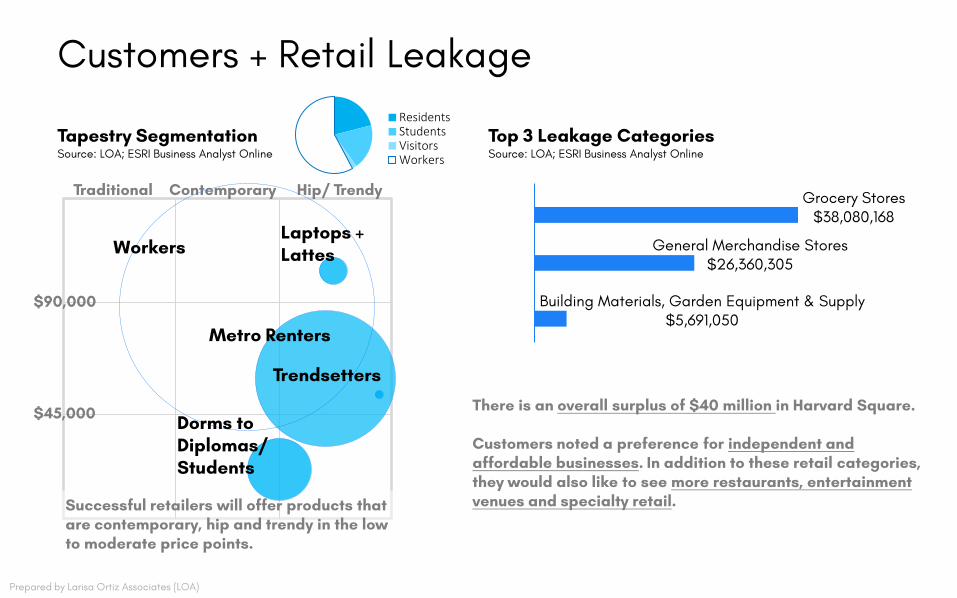
Customers + Retail Leakage
Tapestry Segmentation Source: LOA; ESRI Business Analyst Online
$45,000
$90,000
Traditional Contemporary Hip/ Trendy
Metro Renters
Laptops + Lattes
Trendsetters
Successful retailers will offer products that are contemporary, hip and trendy in the low to moderate price points.
Workers
Dorms to Diplomas/ Students
Residents Students Top 3 Leakage Categories Visitors
Source: LOA; ESRI Business Analyst Online Workers
Grocery Stores $38,080,168
General Merchandise Stores $26,360,305
Building Materials, Garden Equipment & Supply $5,691,050
There is an overall surplus of $40 million in Harvard Square.
Customers noted a preference for independent and affordable businesses. In addition to these retail categories, they would also like to see more restaurants, entertainment venues and specialty retail.
Prepared by Larisa Ortiz Associates (LOA)
Prepared by Larisa Ortiz Associates (LOA)
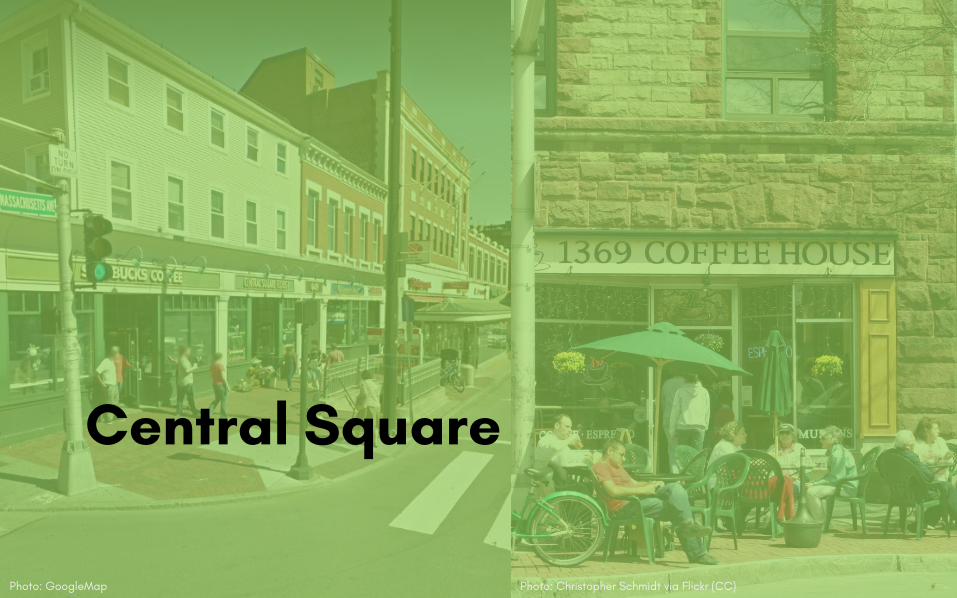
Central Square
Photo: GoogleMap Photo: Christopher Schmidt via Flickr (CC)
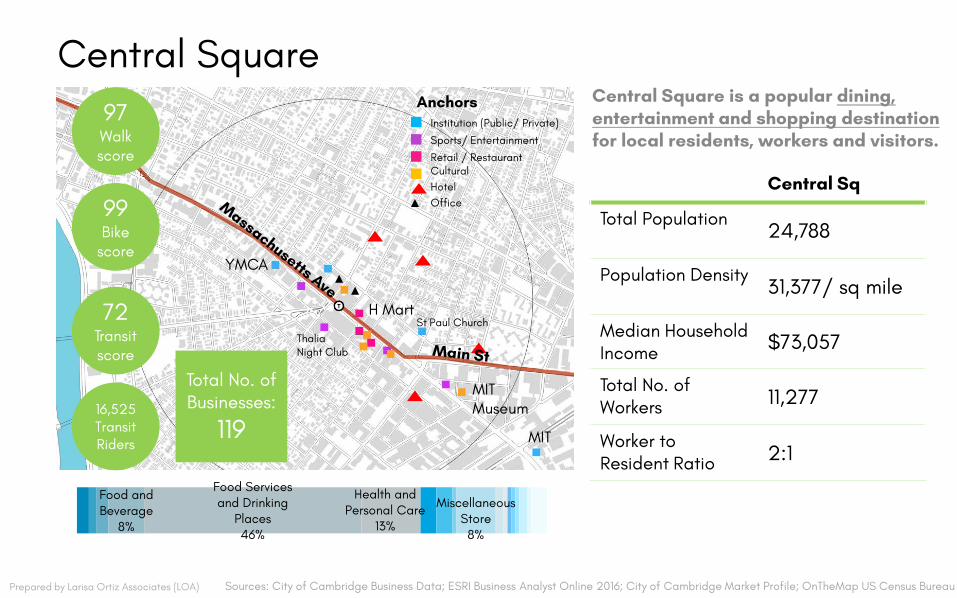
Central Square Central Square is a popular dining, entertainment and shopping destination for local residents, workers and visitors.
Central Sq
Total Population 24,788
Population Density 31,377/ sq mile
Median Household $73,057 Income
Total No. of 11,277 Workers
MIT Worker to 2:1 Resident Ratio
Total No. of Businesses:
119
97 Walk score
99 Bike
score
72 Transit score
Retail / Restaurant
Sports/ Entertainment
Institution (Public/ Private)
Cultural
Anchors
Hotel Office
H Mart
YMCA
MIT Museum
St Paul Church Thalia Night Club
16,525 Transit Riders
Food and Beverage
8%
Food Services and Drinking
Places 46%
Health and Personal Care
13%
Miscellaneous Store 8%
Prepared by Larisa Ortiz Associates (LOA) Sources: City of Cambridge Business Data; ESRI Business Analyst Online 2016; City of Cambridge Market Profile; OnTheMap US Census Bureau
I~
0 • ------
• •
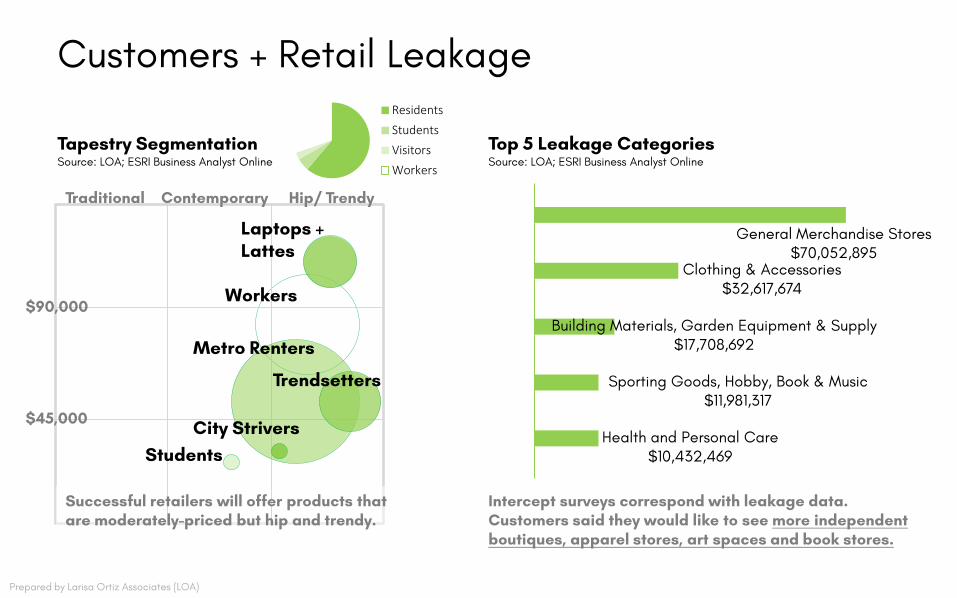
$45,000
$90,000
Metro Renters
Trendsetters
City Strivers
Laptops + Lattes
Workers
Successful retailers will offer products that are moderately-priced but hip and trendy.
Students
Customers + Retail Leakage Residents Students
Tapestry Segmentation Visitors Source: LOA; ESRI Business Analyst Online
Workers
Traditional Contemporary Hip/ Trendy
Top 5 Leakage Categories Source: LOA; ESRI Business Analyst Online
General Merchandise Stores $70,052,895
Clothing & Accessories $32,617,674
Building Materials, Garden Equipment & Supply $17,708,692
Sporting Goods, Hobby, Book & Music $11,981,317
Health and Personal Care $10,432,469
Intercept surveys correspond with leakage data. Customers said they would like to see more independent boutiques, apparel stores, art spaces and book stores.
Prepared by Larisa Ortiz Associates (LOA)
Prepared by Larisa Ortiz Associates (LOA)
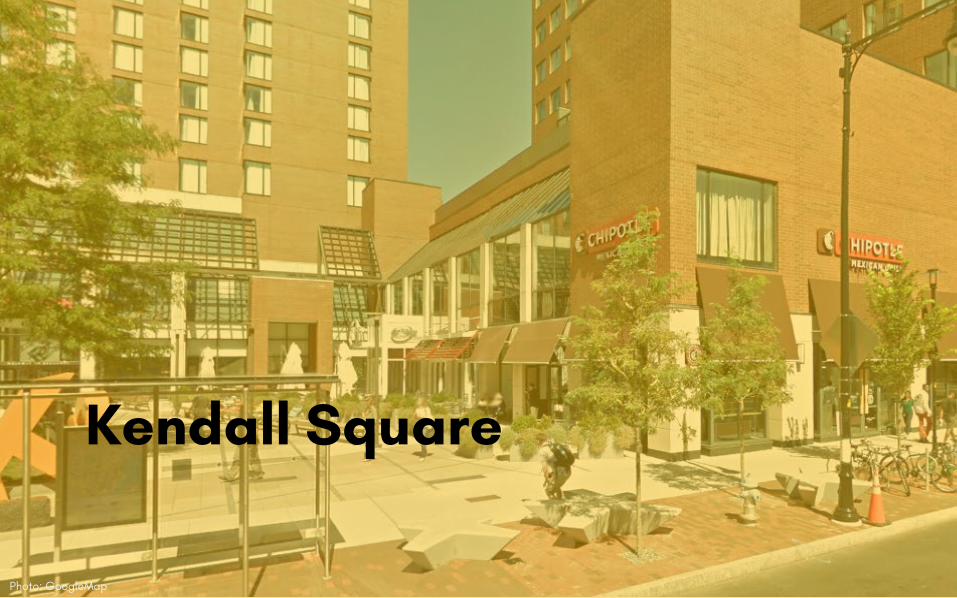
Kendall Square
Photo: GoogleMap
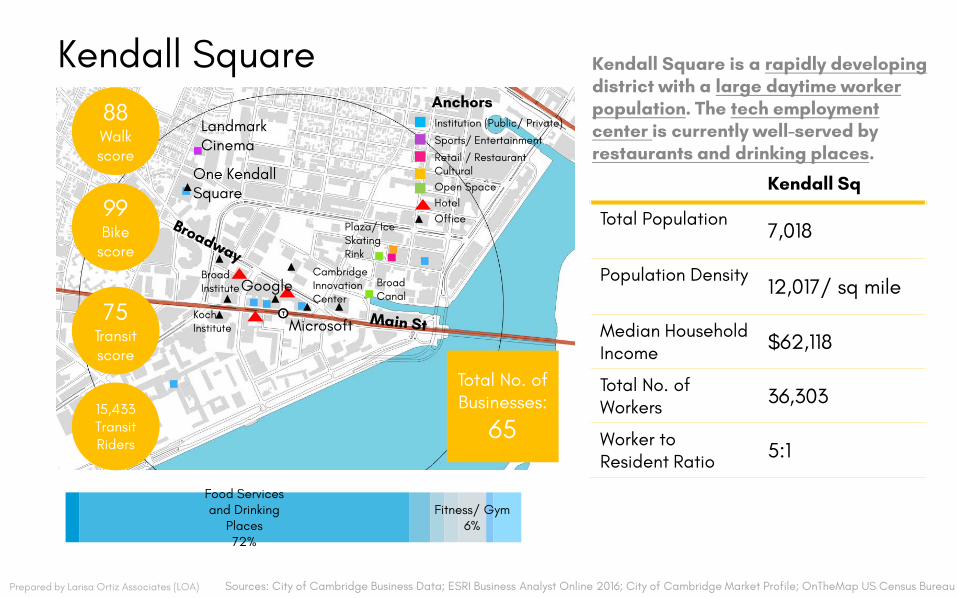
Kendall Square Kendall Square is a rapidly developing
88 Walk score
99 Bike
score
75 Transit score
15,433 Transit Riders
Institute Microsoft
Anchors Institution (Public/ Private)
Sports/ Entertainment
Retail / Restaurant Cultural Open Space Hotel Office
Total No. of Businesses:
65
district with a large daytime worker population. The tech employment center is currently well-served by restaurants and drinking places.
Kendall Sq
Total Population 7,018
Population Density 12,017/ sq mile
Median Household Income
Total No. of Workers
Worker to Resident Ratio
$62,118
36,303
5:1
Landmark Cinema
One Kendall Square
Broad Institute Google
Koch
Plaza/ Ice Skating Rink
Cambridge Innovation Broad
Center Canal
Food Services and Drinking
Places 72%
Fitness/ Gym 6%
Prepared by Larisa Ortiz Associates (LOA) Sources: City of Cambridge Business Data; ESRI Business Analyst Online 2016; City of Cambridge Market Profile; OnTheMap US Census Bureau
-+ ~
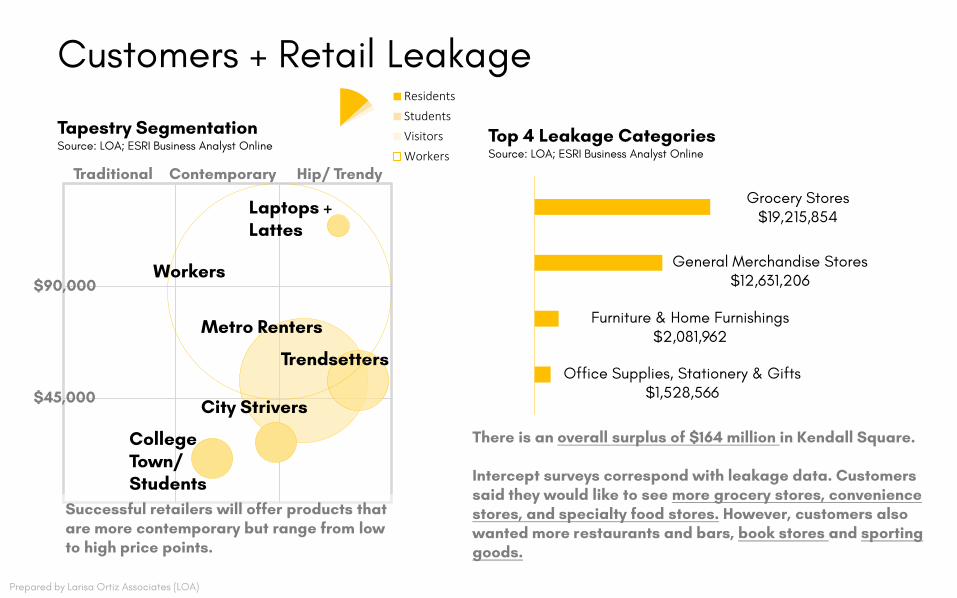
Customers + Retail Leakage Residents Students
Tapestry Segmentation Visitors Source: LOA; ESRI Business Analyst Online
Workers Traditional Contemporary Hip/ Trendy
$45,000
$90,000
Metro Renters
Trendsetters
City Strivers
Laptops + Lattes
College Town/ Students
Workers
Successful retailers will offer products that are more contemporary but range from low to high price points.
Top 4 Leakage Categories Source: LOA; ESRI Business Analyst Online
Grocery Stores $19,215,854
General Merchandise Stores $12,631,206
Furniture & Home Furnishings $2,081,962
Office Supplies, Stationery & Gifts $1,528,566
There is an overall surplus of $164 million in Kendall Square.
Intercept surveys correspond with leakage data. Customers said they would like to see more grocery stores, convenience stores, and specialty food stores. However, customers also wanted more restaurants and bars, book stores and sporting goods.
Prepared by Larisa Ortiz Associates (LOA)
Prepared by Larisa Ortiz Associates (LOA)
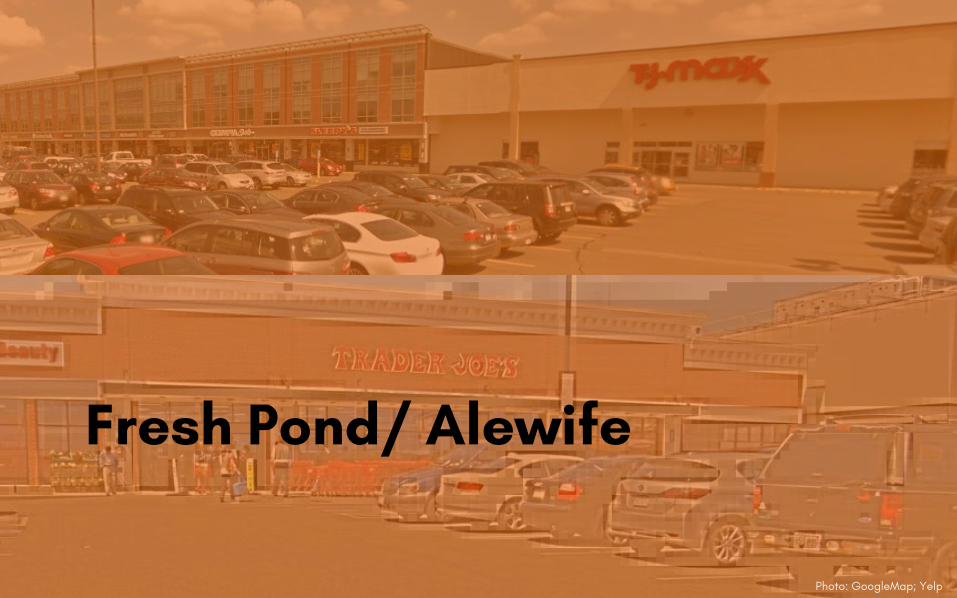
Fresh Pond/ Alewife
Photo: GoogleMap; Yelp
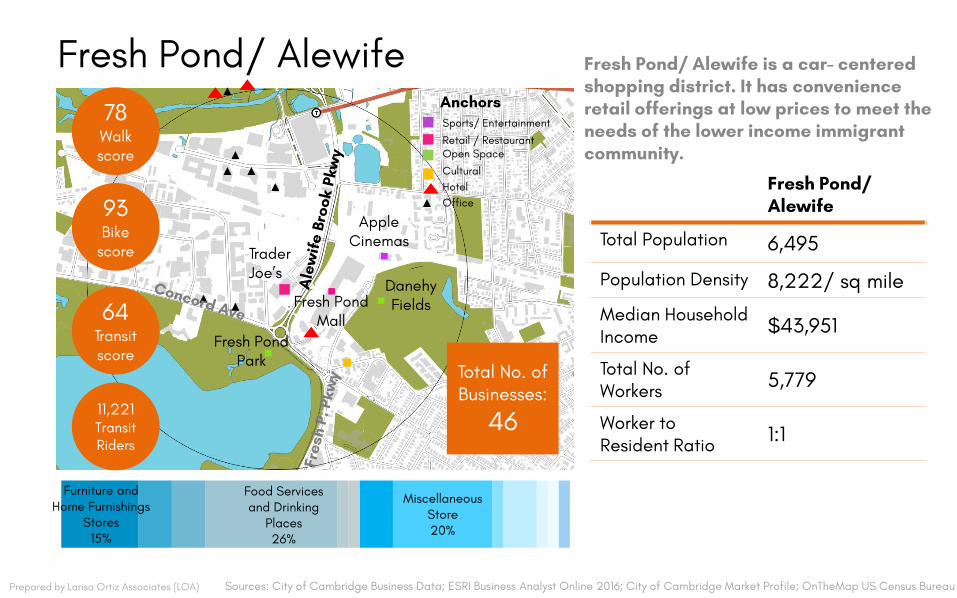
Fresh Pond/ Alewife 78 Walk score
93 Bike
score
64 Transit score
Trader Joe’s
Fresh Pond Mall
Fresh Pond Park
11,221 Transit Riders
Food Services and Drinking
Places 26%
Apple Cinemas
Fresh Pond/ Alewife is a car- centered shopping district. It has convenience retail offerings at low prices to meet the needs of the lower income immigrant community.
Fresh Pond/ Alewife
Total Population 6,495
Population Density 8,222/ sq mile
Median Household Income $43,951
Total No. of Workers 5,779
Worker to Resident Ratio 1:1
Furniture and Home Furnishings
Stores 15%
Danehy Fields
Total No. of Businesses:
46
Miscellaneous Store 20%
Anchors Sports/ Entertainment
Retail / Restaurant Open Space
Cultural Hotel Office
Prepared by Larisa Ortiz Associates (LOA) Sources: City of Cambridge Business Data; ESRI Business Analyst Online 2016; City of Cambridge Market Profile; OnTheMap US Census Bureau
• • D
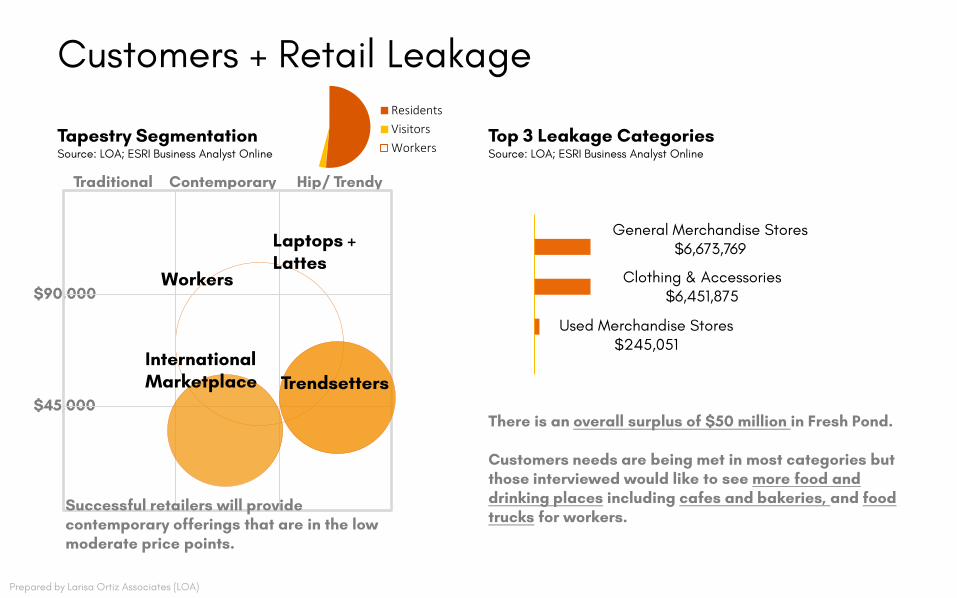
Customers + Retail Leakage Residents Visitors Tapestry Segmentation Top 3 Leakage Categories Workers Source: LOA; ESRI Business Analyst Online Source: LOA; ESRI Business Analyst Online
Traditional Contemporary Hip/ Trendy
General Merchandise Stores $6,673,769
Clothing & Accessories $6,451,875
Used Merchandise Stores $245,051
There is an overall surplus of $50 million in Fresh Pond.
Customers needs are being met in most categories but those interviewed would like to see more food and drinking places including cafes and bakeries, and food trucks for workers. contemporary offerings that are in the low
moderate price points.
$45,000
$90,000
International Marketplace Trendsetters
Laptops + Lattes
Workers
Successful retailers will provide
Prepared by Larisa Ortiz Associates (LOA)
Prepared by Larisa Ortiz Associates (LOA)
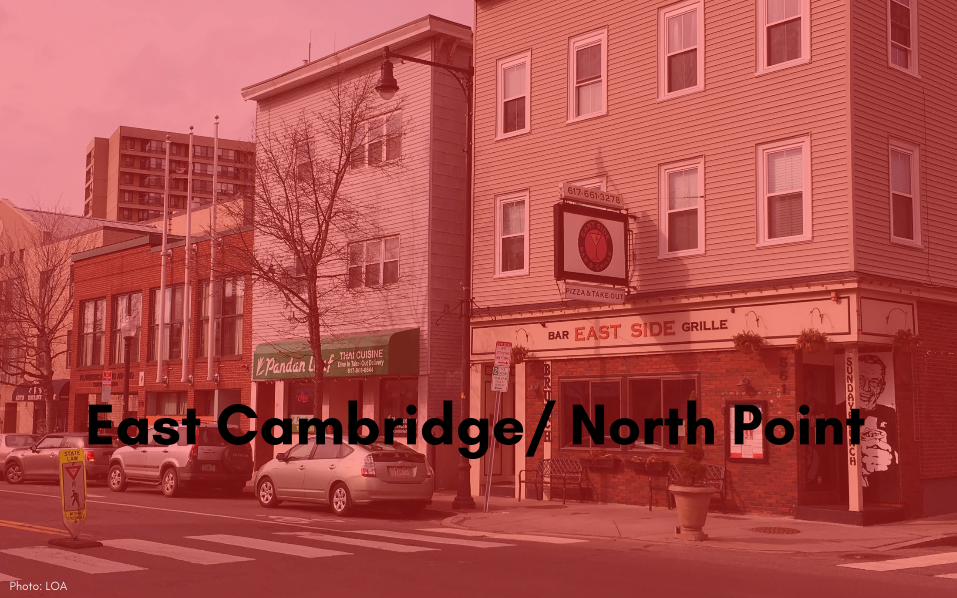
East Cambridge/ North Point
Photo: LOA
I
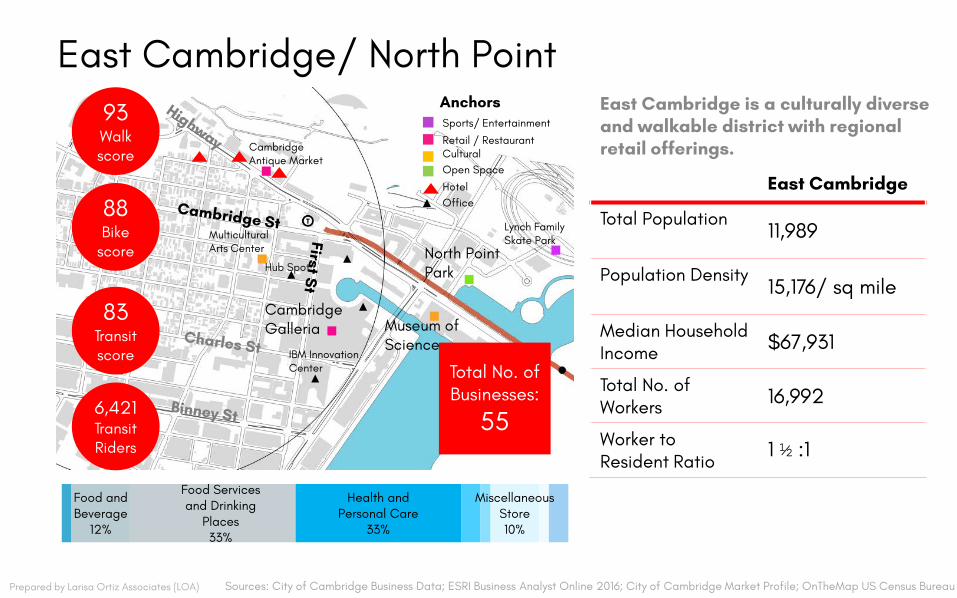
East Cambridge/ North Point 93 Walk score
88 Bike
score
83 Transit score
6,421 Transit Riders
Anchors East Cambridge is a culturally diverse Sports/ Entertainment and walkable district with regional Retail / Restaurant
Cambridge Cultural retail offerings.
Antique Market Open Space
Hotel East Cambridge Office
Total Population Lynch Family 11,989 Multicultural Skate Park Arts Center North Point
Hub Spot Park Population Density 15,176/ sq mile
Cambridge Museum of Galleria Median Household
Total No. of Businesses:
55
$67,931 Science IBM Innovation Income Center
Total No. of 16,992 Workers
Worker to 1 ½ :1Resident Ratio
Food Services Food and Health and
and Drinking Beverage Personal Care
Places 12% 33%
33%
Miscellaneous Store 10%
Prepared by Larisa Ortiz Associates (LOA) Sources: City of Cambridge Business Data; ESRI Business Analyst Online 2016; City of Cambridge Market Profile; OnTheMap US Census Bureau
•
• • D
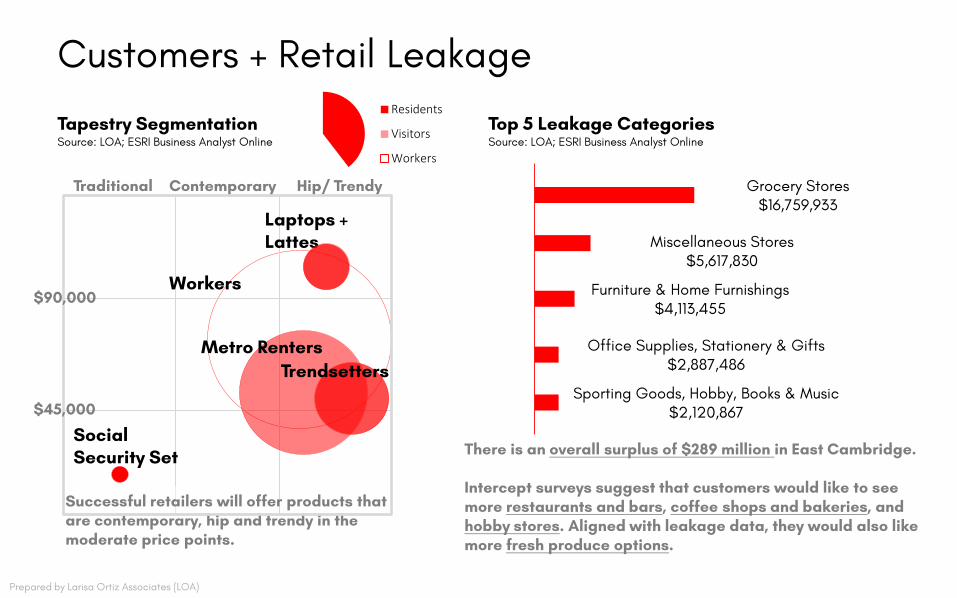
Customers + Retail Leakage Residents
Tapestry Segmentation Top 5 Leakage Categories Visitors Source: LOA; ESRI Business Analyst Online Source: LOA; ESRI Business Analyst Online
Workers
Traditional Contemporary Hip/ Trendy
are contemporary, hip and trendy in the moderate price points.
$45,000
$90,000
Metro Renters Trendsetters
Laptops + Lattes
Social Security Set
Workers
Successful retailers will offer products that
Grocery Stores $16,759,933
Miscellaneous Stores $5,617,830
Furniture & Home Furnishings $4,113,455
Office Supplies, Stationery & Gifts $2,887,486
Sporting Goods, Hobby, Books & Music $2,120,867
There is an overall surplus of $289 million in East Cambridge.
Intercept surveys suggest that customers would like to see more restaurants and bars, coffee shops and bakeries, and hobby stores. Aligned with leakage data, they would also like more fresh produce options.
Prepared by Larisa Ortiz Associates (LOA)
Prepared by Larisa Ortiz Associates (LOA)
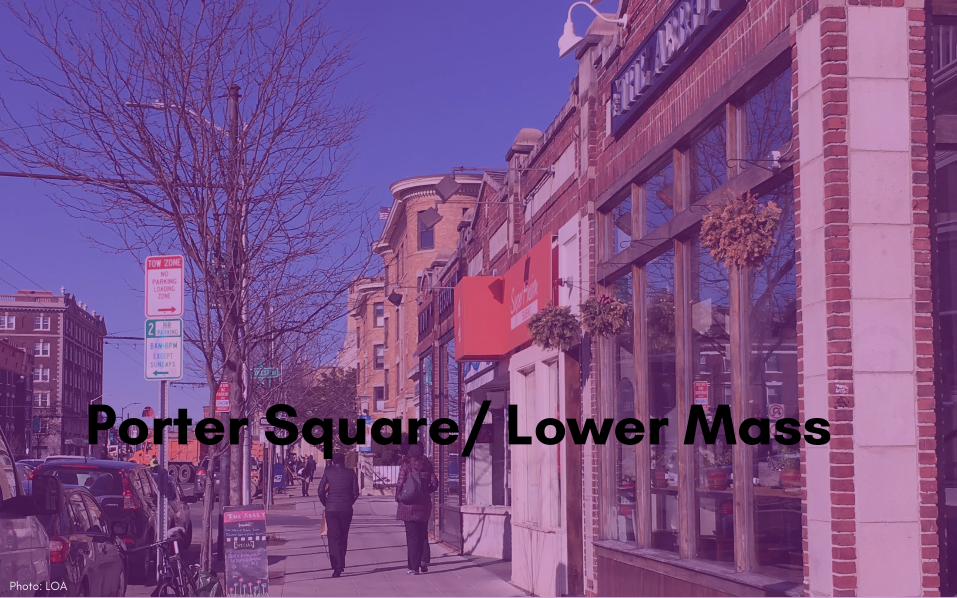
Porter Square/ Lower Mass
Photo: LOA
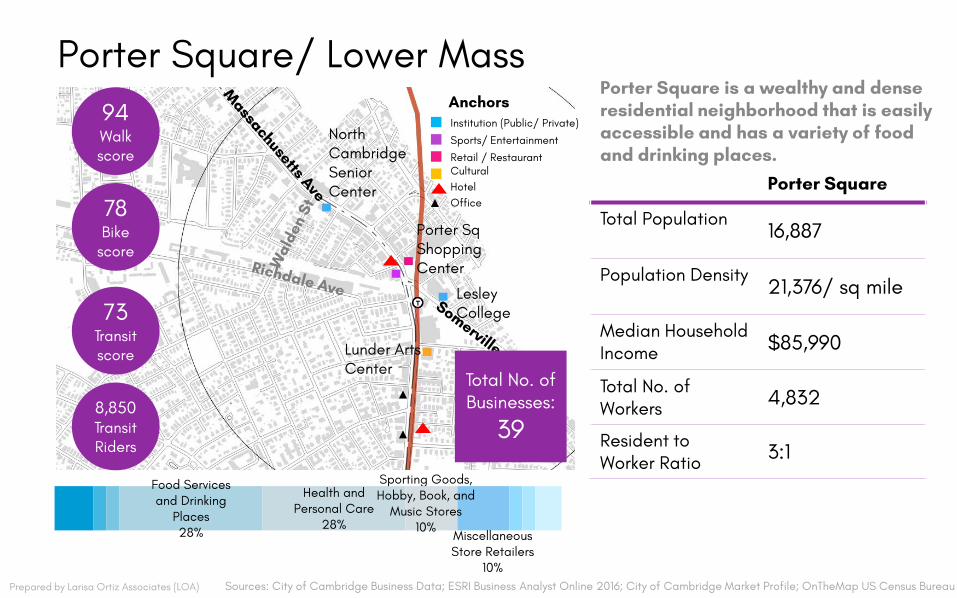
Porter Square/ Lower Mass 94 Walk score
78 Bike
score
73 Transit score
Anchors Institution (Public/ Private)
North Sports/ Entertainment Cambridge Retail / Restaurant
Cultural Hotel
Senior Center
Office
Porter Sq Shopping Center
College
Total No. of Businesses:
39
Lesley
Lunder Arts Center
8,850 Transit Riders
Sporting Goods,
Porter Square is a wealthy and dense residential neighborhood that is easily accessible and has a variety of food and drinking places.
Porter Square
Total Population 16,887
Population Density 21,376/ sq mile
Median Household Income
Total No. of Workers
Resident to Worker Ratio
$85,990
4,832
3:1 Food Services and Drinking
Places 28%
Health and Personal Care
28%
Hobby, Book, and Music Stores
10% Miscellaneous Store Retailers
10% Prepared by Larisa Ortiz Associates (LOA) Sources: City of Cambridge Business Data; ESRI Business Analyst Online 2016; City of Cambridge Market Profile; OnTheMap US Census Bureau
0
• • • D
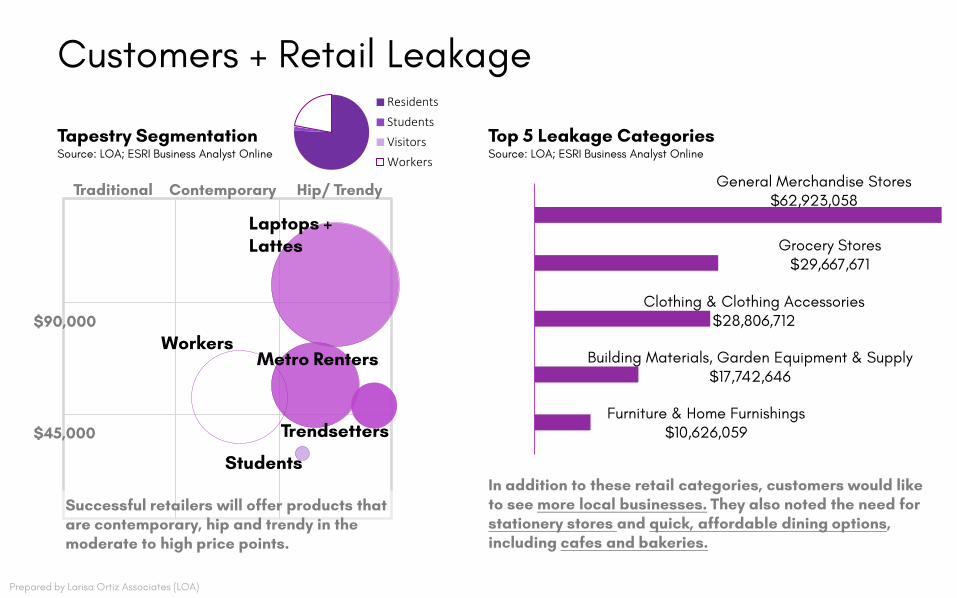
Customers + Retail Leakage
Tapestry Segmentation Source: LOA; ESRI Business Analyst Online
$45,000
$90,000
Traditional Contemporary Hip/ Trendy
Metro Renters
Laptops + Lattes
Top 5 Leakage Categories Source: LOA; ESRI Business Analyst Online
Grocery Stores $29,667,671
General Merchandise Stores $62,923,058
In addition to these retail categories, customers would like to see more local businesses. They also noted the need for stationery stores and quick, affordable dining options,
Building Materials, Garden Equipment & Supply $17,742,646
Clothing & Clothing Accessories $28,806,712
Furniture & Home Furnishings $10,626,059 Trendsetters
Residents Students Visitors Workers
Workers
Students
Successful retailers will offer products that are contemporary, hip and trendy in the moderate to high price points. including cafes and bakeries.
Prepared by Larisa Ortiz Associates (LOA)
Prepared by Larisa Ortiz Associates (LOA)
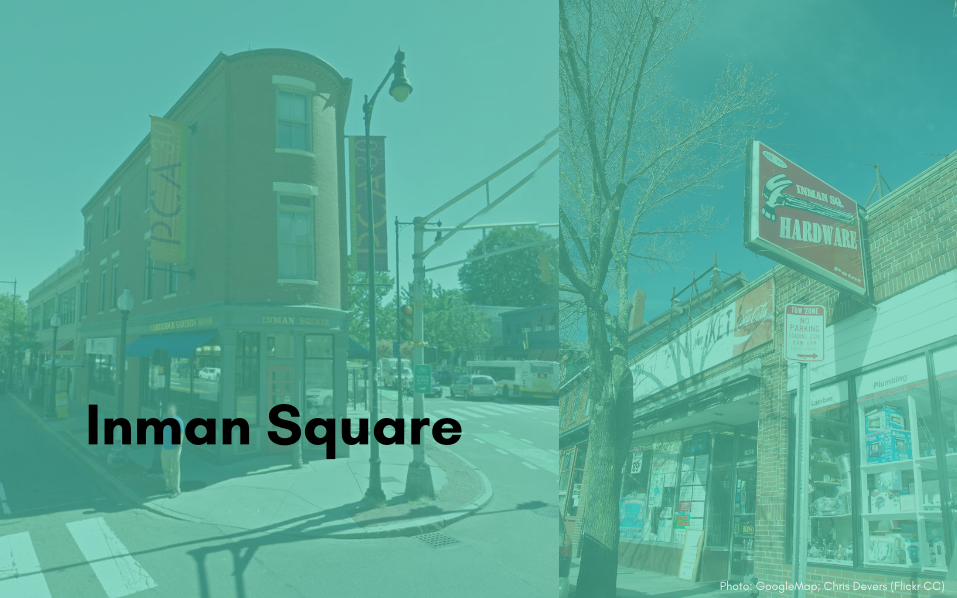
Inman Square
Photo: GoogleMap; Chris Devers (Flickr CC)
• • •
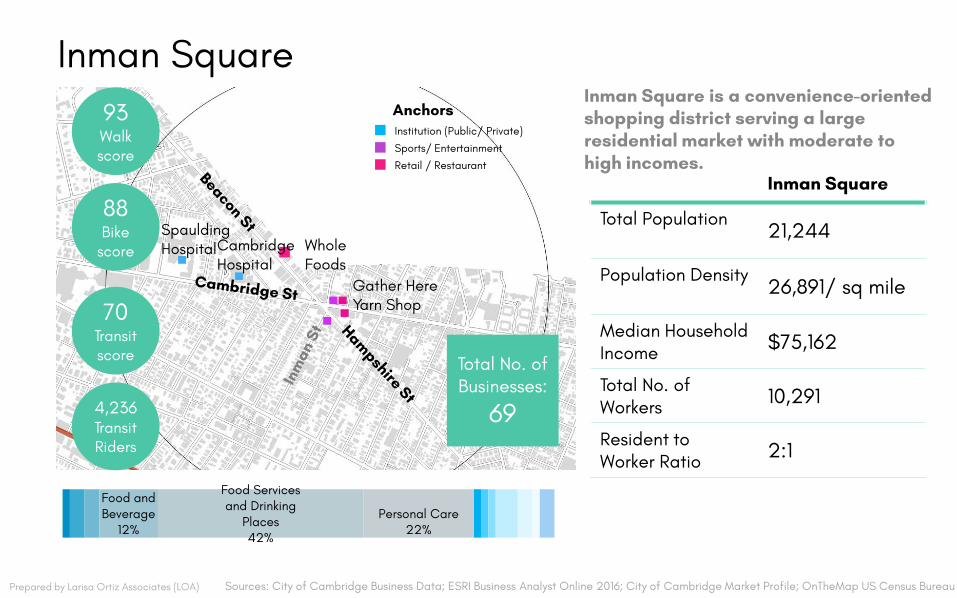
Inman Square 93 Walk score
88 Bike
score
70 Transit score
4,236 Transit Riders
Anchors Institution (Public/ Private)
Sports/ Entertainment
Retail / Restaurant
Spaulding Cambridge Whole Hospital Hospital Foods
Gather Here Yarn Shop
Total No. of Businesses:
69
Inman Square is a convenience-oriented shopping district serving a large residential market with moderate to high incomes.
Inman Square
Total Population 21,244
Population Density 26,891/ sq mile
Median Household $75,162 Income
Total No. of 10,291 Workers
Resident to 2:1 Worker Ratio
Food and Food Services and Drinking
Places 42%
Health and Beverage Personal Care
12% 22%
Prepared by Larisa Ortiz Associates (LOA) Sources: City of Cambridge Business Data; ESRI Business Analyst Online 2016; City of Cambridge Market Profile; OnTheMap US Census Bureau
+
•
• • D
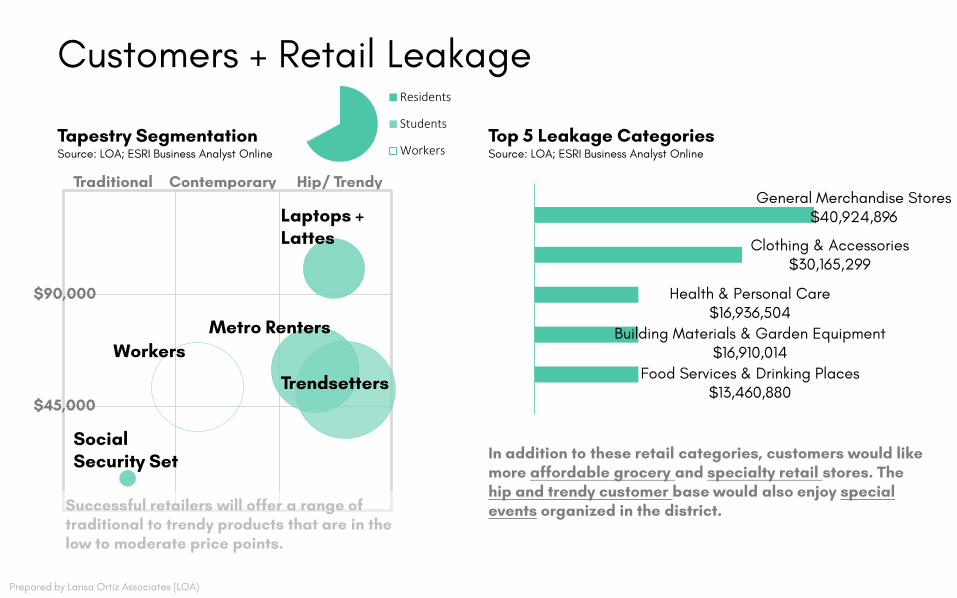
Customers + Retail Leakage Residents
Students Tapestry Segmentation Top 5 Leakage Categories
Workers Source: LOA; ESRI Business Analyst Online Source: LOA; ESRI Business Analyst Online
Traditional Contemporary Hip/ Trendy
$45,000
$90,000
Metro Renters
Trendsetters
Social Security Set
Laptops + Lattes
Workers
Successful retailers will offer a range of traditional to trendy products that are in the low to moderate price points.
General Merchandise Stores $40,924,896
Clothing & Accessories $30,165,299
Health & Personal Care $16,936,504
Building Materials & Garden Equipment $16,910,014
Food Services & Drinking Places $13,460,880
In addition to these retail categories, customers would like more affordable grocery and specialty retail stores. The hip and trendy customer base would also enjoy special events organized in the district.
Prepared by Larisa Ortiz Associates (LOA)
Prepared by Larisa Ortiz Associates (LOA)
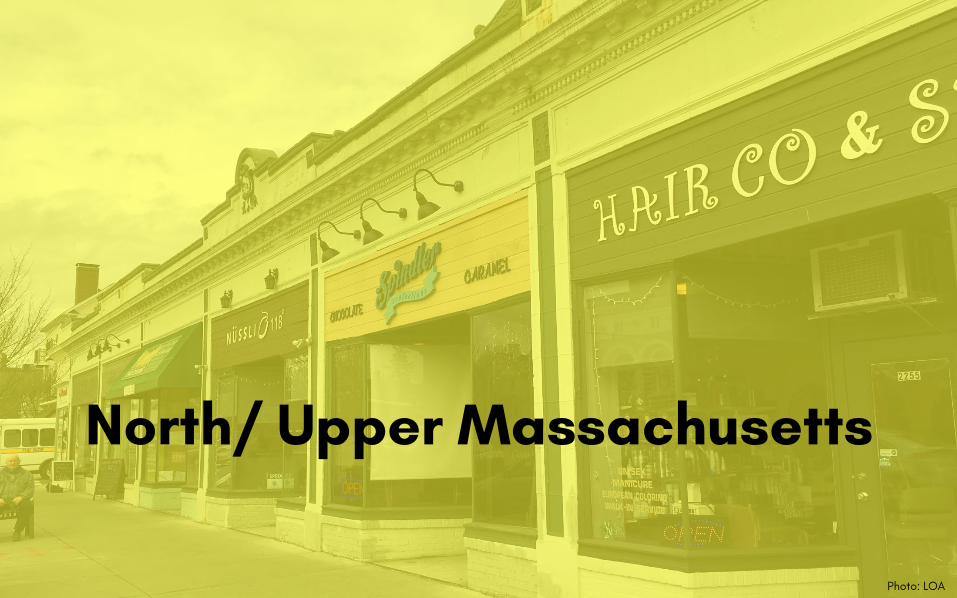
North/ Upper Massachusetts
Photo: LOA
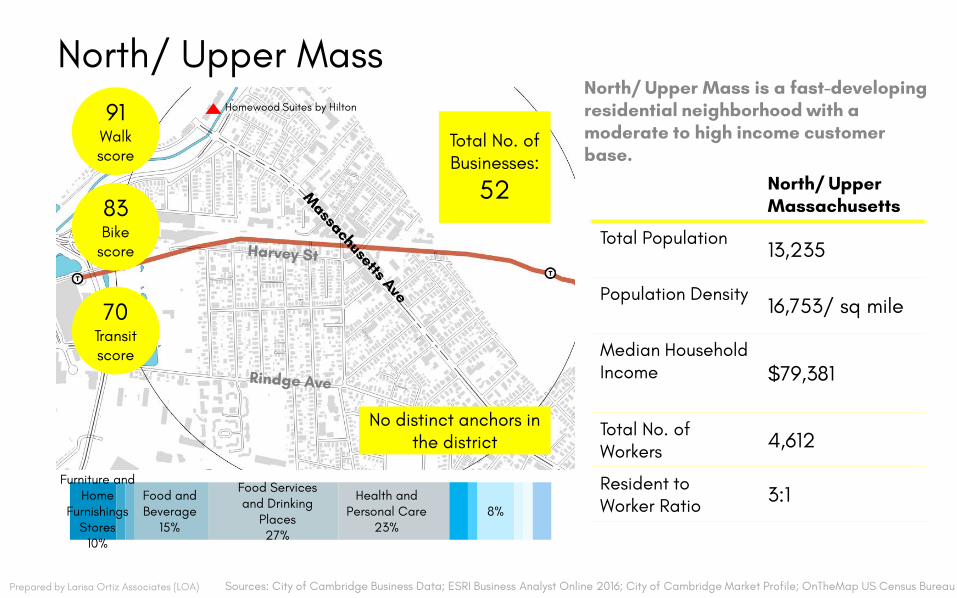
North/ Upper Mass
Total No. of Businesses:
52
91 Walk score
83 Bike
score
70 Transit score
No distinct anchors in the district
Furniture and
Homewood Suites by Hilton
North/ Upper Mass is a fast-developing residential neighborhood with a moderate to high income customer base.
North/ Upper Massachusetts
Total Population 13,235
Population Density 16,753/ sq mile
Median Household Income $79,381
Total No. of 4,612 Workers
Resident to 3:1 Worker Ratio Food Services
Food and Health and and Drinking
Beverage Personal Care 8%Places
15% 23% 27%
Home Furnishings
Stores 10%
Prepared by Larisa Ortiz Associates (LOA) Sources: City of Cambridge Business Data; ESRI Business Analyst Online 2016; City of Cambridge Market Profile; OnTheMap US Census Bureau
• • D
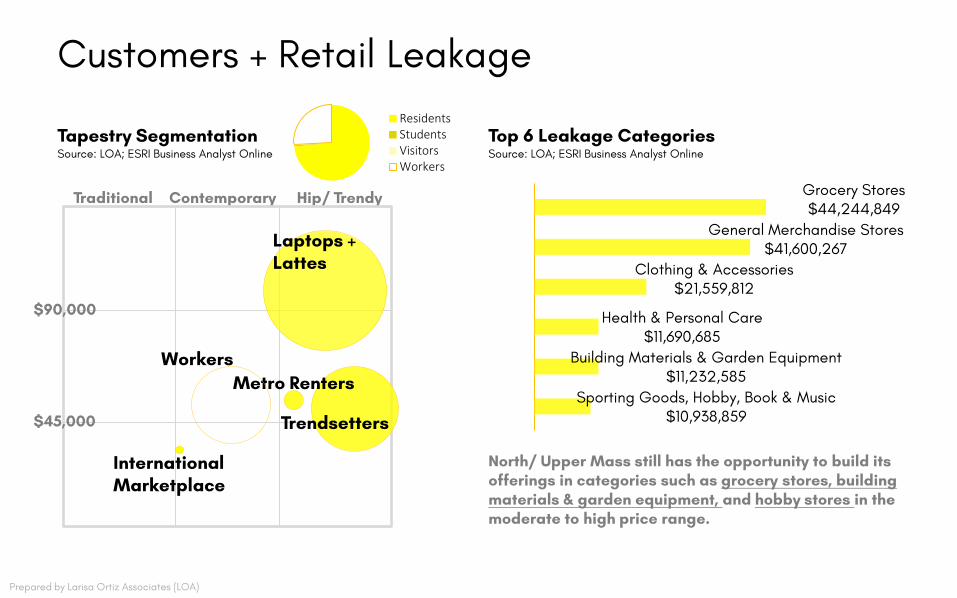
Customers + Retail Leakage Residents Students Tapestry Segmentation Visitors Source: LOA; ESRI Business Analyst Online Workers
Traditional Contemporary Hip/ Trendy
$45,000
$90,000
Laptops + Lattes
Trendsetters
International Marketplace
Metro Renters Workers
Top 6 Leakage Categories Source: LOA; ESRI Business Analyst Online
Grocery Stores $44,244,849
General Merchandise Stores $41,600,267
Clothing & Accessories $21,559,812
Health & Personal Care $11,690,685
Building Materials & Garden Equipment $11,232,585
Sporting Goods, Hobby, Book & Music $10,938,859
North/ Upper Mass still has the opportunity to build its offerings in categories such as grocery stores, building materials & garden equipment, and hobby stores in the moderate to high price range.
Prepared by Larisa Ortiz Associates (LOA)
Prepared by Larisa Ortiz Associates (LOA)
Huron Village/ Observatory Hill
Photo: LOA
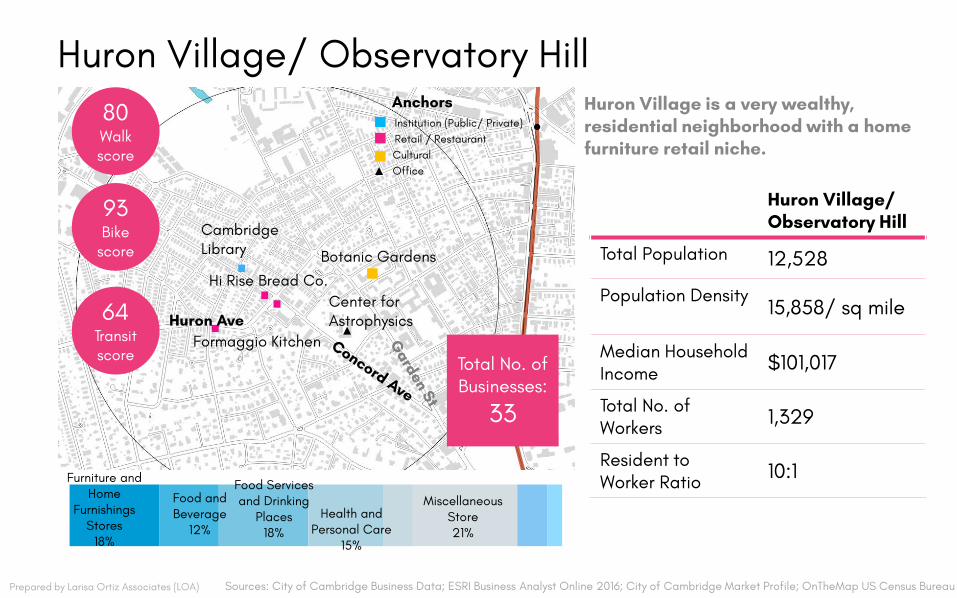
Huron Village/ Observatory Hill 80 Walk score
93 Bike
score
64 Transit score
Cambridge Library
Hi Rise Bread Co.
Formaggio Kitchen
Center for Astrophysics Huron Ave
Retail / Restaurant Institution (Public/ Private)
Anchors
Office Cultural
Botanic Gardens
Huron Village is a very wealthy, residential neighborhood with a home furniture retail niche.
Huron Village/ Observatory Hill
Total Population 12,528
Population Density 15,858/ sq mile
Total No. of Businesses:
33
Median Household $101,017 Income
Total No. of 1,329 Workers
Resident to 10:1 Furniture and Worker Ratio Home
Furnishings Stores
18%
Food anBeverage
12%
d and Drinking Places
18%
Health and Personal Care
Food Services Miscellaneous
Store 21%
15%
Prepared by Larisa Ortiz Associates (LOA) Sources: City of Cambridge Business Data; ESRI Business Analyst Online 2016; City of Cambridge Market Profile; OnTheMap US Census Bureau
+
+
• • D
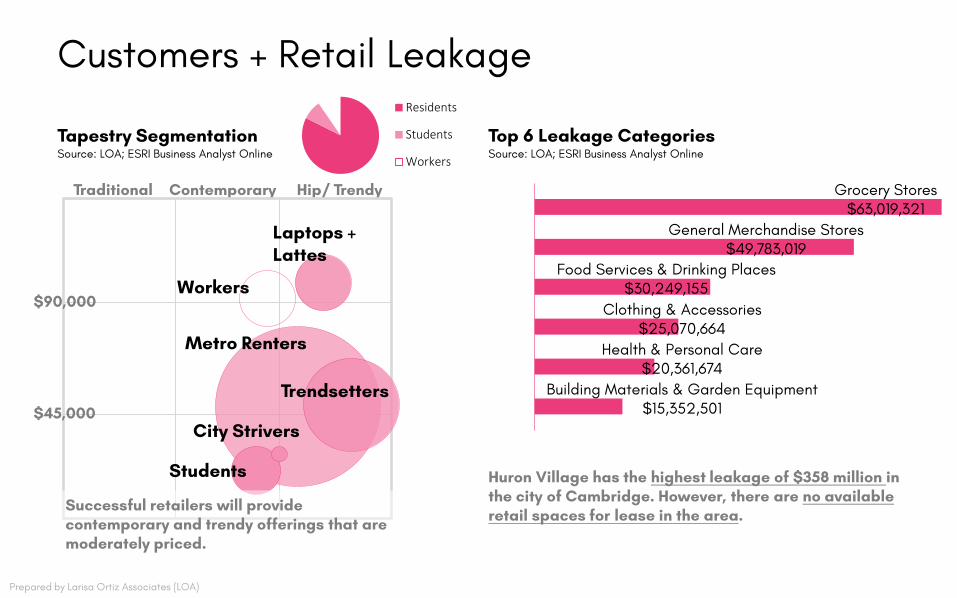
Customers + Retail Leakage Residents
Tapestry Segmentation Students Top 6 Leakage Categories Source: LOA; ESRI Business Analyst Online Source: LOA; ESRI Business Analyst Online Workers
Traditional Contemporary Hip/ Trendy
$45,000
$90,000
Metro Renters
Laptops + Lattes
Trendsetters
City Strivers
Workers
Students
Successful retailers will provide contemporary and trendy offerings that are moderately priced.
Grocery Stores $63,019,321
General Merchandise Stores $49,783,019
Food Services & Drinking Places $30,249,155
Clothing & Accessories $25,070,664
Health & Personal Care $20,361,674
Building Materials & Garden Equipment $15,352,501
Huron Village has the highest leakage of $358 million in the city of Cambridge. However, there are no available retail spaces for lease in the area.
Prepared by Larisa Ortiz Associates (LOA)
Recommended