Technical Strategy
Robert Sluymer, CFA
+1 212 293 7135
For exclusive use by Fundstrat clients only January 15, 2019
Slide 1
Source: Fundstrat, Bloomberg, Optuma
Fundstrat Global Advisors150 East 52nd St, 31st floorNew York, NY 10022
www.Fundstrat.com | Bloomberg: FSGA <<GO>>
2019 Technical StrategyEstablishing Cycle Lows
January 2019
• Secular outlook: Bullish into early 2030’s
• Cycle: 4-year cycle evident since 1950s
- Cycle low likely developing at 200-week sma
- A roadmap through 2019 - New up cycle in 2020
• Global markets - Weak but oversold. FIFO for EM?
• US 10-year yields - Stalling at secular downtrend
• USD - Peaking - Q1 2019 vs Q1 2018 contrasted
A market of stocks - Barbell between:
• Established and emerging leaders: V, PYPL, KEYS, HD, NKE, DG, VRTX, DE
• Stocks bottoming at rising rising 200-weeks sma’s: AMAT, MCHP, BK, SCHW, PHM, HON, ITW, VLO
• Laggards in broad trading ranges: AMGN, BIIB, DIS
Robert Sluymer, CFAAC
Head of Technical Strategy
twitter: @rsluymer
Thomas J. Lee, CFA AC
Head of Research
twitter: @fundstrat
Sam Doctor AC
Head of Data Science Research
twitter: @fundstratQuant
L. Thomas BlockPolicy Strategist
twitter: @TomBlock_FS
Data Science Team
Ken Xuan
Alex Kern
Kelsey Burhans

For exclusive use by Fundstrat clients only
Robert Sluymer, CFA
+1 212 293 [email protected]
Technical StrategyJanuary 15, 2019 Slide 2
Markets OverviewSecular OutlookPositive into 2034
Secular backdrop remains bullish – Long-term inflection points have developed in the equity and bond markets coinciding with 17 and 34-year cycles that, in theory, should support an further equity gains well into the early- to mid 2030s. While the obvious risk to the this analysis is the very small sample size, we would note that the secular trend for equities remains positive as defined by the 4-year/200-week sma.
Market Cycle Cycle lows likely developing (again) at rising 200-week sma
Equity markets are likely establishing cycle lows at their 200-week sma? Since the 1950s equity markets have established multi-year cycle lows at a relatively consistent, although not perfect, 4-year frequency. During the secular bull markets of the 1950s-60s and 1980s-90s, cycle corrections bottomed near rising 200-weeks moving averages with an average gain of 100%, with the smallest rebound 65% in 1994, while the average decline was just over -20%.
The current cycle appears to be following a very similar profile given the 2016-2018 rally was +62% followed by -20% correction back to the 200-week sma. While it is premature to conclude an ‘all clear’ signal is in place given the technical damage that developed in Q4, our opinion is equity markets are in the process of establishing cycle lows. Market internals (Sentiment, Momentum) reached suitably oversold extremes that the risk/reward favors an upside rebound in Q1.
Our expectation is that the S&P trades in a volatile sideways range through most of 2019 under 2800-2900 resistance ultimately emerging to new highs in 2020 consistent with a new 4-year up-cycle. IF, history repeats, a 65% return from the recent cycle low at S&P 2346 would be consistent with the lower end of cycle rebound for a potential move to 3870+ by 2023.
International EquitiesTactical trade in EM LatAm leading
Index price and relative performance trends remain weak but oversold. Markets that corrected first are showing early evidence of bottoming first notably EM.
Tactically overweight EM for an intermediate-term trade in Q1. Favor LatAm.
RatesRange bound 2.50-3.00%
US 10-year bond yields have peaked on track at their secular downtrend. Intermediate-term/weekly indicators are already becoming oversold suggesting rates trade sideways in broad band between 2.50-3.00% well through Q1, potentially Q2.
Currencies USD Peaking
In contrast to Q1 2018, Q1 2019 is beginning with the USD (DXY Index) peaking intermediate-term which should be positive for equities, notably Cyclicals.
WTI – Oil $60-64 resistance
Oversold rebound from 61.2% retracement near 42 underway with the upside likely capped between 60-64 at a 50-62% retracement of the Q4 2018 decline.

For exclusive use by Fundstrat clients only
Robert Sluymer, CFA
+1 212 293 [email protected]
Technical StrategyJanuary 15, 2019 Slide 3
20 Equity Ideas
Sector Established and Emerging Leadership Bottoming at rising 200-wk ma’s Laggards/bottoming
Technology Financials Processors: V, PYPL5G: KEYS
Semis: AMAT, MCHP
Healthcare Biotech: VRTX Biotech: AMGN, BIIB
Discretionary Retail: HD, DG – Footwear: NKE Homebuilders: PHM
Communication Services
Movies & Ent: DIS
Industrials Ag: DE Machinery: HON, ITW
Financials Select Banks/Brokers: BK, SCHW
Energy Refiners: VLO
Given our expectation for a volatile zig-zag market through 2019, we recommend exposure to stocks with similar chart profiles to the 20 examples below representing three main chart profiles:
• Established and emerging leadership
• Former leaders that have corrected back to support at rising 200-week sma’s
• Laggards that are in bases

Technical Strategy
Robert Sluymer, CFA
+1 212 293 7135
For exclusive use by Fundstrat clients only January 15, 2019
Slide 4
Source: Fundstrat, Bloomberg, Optuma
Secular Perspective – The Big Picture
4-year cycles within secular bull markets
The Current Cycle – Where are we now?
Rates, Currencies and Commodities
International Equity Markets
US Sector and Group Leadership
Equity Ideas charts
Appendix
Technical Strategy

Technical Strategy
Robert Sluymer, CFA
+1 212 293 7135
For exclusive use by Fundstrat clients only January 15, 2019
Slide 5
Source: Fundstrat, Bloomberg, Optuma
34 & 17 year secular cycle perspective The 4-year cycle in the 1950’s-1960’s
The 4-year cycle in the 1980’s-1990’s The current cycle - Early signs of bottoming

Technical Strategy
Robert Sluymer, CFA
+1 212 293 7135
For exclusive use by Fundstrat clients only January 15, 2019
Slide 6
Source: Fundstrat, Bloomberg, Optuma
Secular expansion favor equities underway potentially lasting into late 2020s/early 2030s
Yields and P/E’s Positively correlated < 4.5% Negatively correlated > 4.5%
US 10-year bond yields
Dow and 10-year Bond Yield - 34 & 17-year cycles
“New” secular uptrend
intact

Technical Strategy
Robert Sluymer, CFA
+1 212 293 7135
For exclusive use by Fundstrat clients only January 15, 2019
Slide 7
Source: Fundstrat, Bloomberg, Optuma
Secular Perspective – The Big Picture
4-year cycles within secular bull markets
The Current Cycle – Where are we now?
Rates, Currencies and Commodities
International Equity Markets
US Sector and Group Leadership
Equity Ideas charts
Appendix
Technical Strategy

Technical Strategy
Robert Sluymer, CFA
+1 212 293 7135
For exclusive use by Fundstrat clients only January 15, 2019
Slide 8
Source: Fundstrat, Bloomberg, Optuma
S&P 500: 4- year cycle 1950s-1960s
4 Year Cycle % Rally % Correction
1949-1953 97 -15
1953-1957 118 -22
1958-1962* 86 -28
1962-1970 80 -22
Average 95.25 -21.75
* included a -14% mid-cycle correction
• 4-year cycle lows consistently developed near the rising 200-week during the secular bull market of the 1950s-1960s
1962-1966

Technical Strategy
Robert Sluymer, CFA
+1 212 293 7135
For exclusive use by Fundstrat clients only January 15, 2019
Slide 9
Source: Fundstrat, Bloomberg, Optuma
S&P 500: 4- year cycle 1970s• During the secular consolidation of the inflationary 70s, a 4 year cycle continued to develop, but in contrast to the secular
uptrend of the 1950s-60s and 1980s-90s, the cycles were more symmetrical consisting of 2-years up and down.

Technical Strategy
Robert Sluymer, CFA
+1 212 293 7135
For exclusive use by Fundstrat clients only January 15, 2019
Slide 10
Source: Fundstrat, Bloomberg, Optuma
4 Year Cycle % Rally % Correction
1982-1987* 231 -36
1987-1990^ 71 -20
1990-1994 64 -10
1994-1998 173 -22
Average 134.75 -22
* 4-year cycle extended beyond 1987
A shortened cycle reset into the 1990 lows
S&P 500: 4- year cycle 1980s-1990s
• Similar to the secular uptrend of the 1950s-1960s, 4-year cycle lows developed near the rising 200-week during the 1980s-1990s

Technical Strategy
Robert Sluymer, CFA
+1 212 293 7135
For exclusive use by Fundstrat clients only January 15, 2019
Slide 11
Source: Fundstrat, Bloomberg, Optuma
Secular Perspective – The Big Picture
4-year cycles within secular bull markets
The Current Cycle – Where are we now?
Rates, Currencies and Commodities
International Equity Markets
US Sector and Group Leadership
Equity Ideas charts
Appendix
Technical Strategy

Technical Strategy
Robert Sluymer, CFA
+1 212 293 7135
For exclusive use by Fundstrat clients only January 15, 2019
Slide 12
Source: Fundstrat, Bloomberg, Optuma
S&P 500: 4-year cycle in 2000-2018
2007
Cycle bypass
Next 4-year up-
cycle unlikely
to accelerate
until 2020
The Q4 2018 correction appears to be consistent with the cycle corrections that developed in prior secular bull markets. The recent rebound from the 200-week moving average likely defines a cycle low with a new up-cycle expected to develop in 2020

Technical Strategy
Robert Sluymer, CFA
+1 212 293 7135
For exclusive use by Fundstrat clients only January 15, 2019
Slide 13
Source: Fundstrat, Bloomberg, Optuma
• Bounce from the rising 200-week sma establishes an intermediate-term and likely a cycle low• 2019 could see a zig-zag sawtooth pattern into 2020 at which point a new 4-year upcycle is likely to reaccelerate
S&P Emini Futures - Weekly
Support band
S&P vs TLT Testing 2016-2018 uptrend
2800-2900resistance band

Technical Strategy
Robert Sluymer, CFA
+1 212 293 7135
For exclusive use by Fundstrat clients only January 15, 2019
Slide 14
Source: Fundstrat, Bloomberg, Optuma
Weekly momentum is
turning up from deeply
oversold levels
(+) Weekly Quadrant Balance data peaked in the Summer and
is rebounding from oversold levels WITH developing a
positive divergence with price (higher lows)
• Bottoming at rising 200-week ma with weekly momentum indicators (top and bottom panels) turning up from oversold levels
S&P 500 - Weekly
200-week sma = 2345

Technical Strategy
Robert Sluymer, CFA
+1 212 293 7135
For exclusive use by Fundstrat clients only January 15, 2019
Slide 15
Source: Fundstrat, Bloomberg, Optuma
• Economic and Equity (AAII Bulls-AAII Bears) sentiment is depressed/oversold and bullish for a rebound
Citi G10 Economic Surprise AAII Bullish-Bearish Sentiment

Technical Strategy
Robert Sluymer, CFA
+1 212 293 7135
For exclusive use by Fundstrat clients only January 15, 2019
Slide 16
Source: Fundstrat, Bloomberg, Optuma
• Weekly Quadrant Balance Data (bottom panel) tracking the percentage of stocks with rising weekly momentum, reflects a broad-based upturn from oversold levels within the Russell 2000.
Russell 2000 - Weekly
Quadrant Balance, measuring the percentage of stocks within the Russell
2000 with rising/positive weekly momentum, is quickly building toward
overbought levels.
Weekly momentum has bottomed and turned positive
1500-1550 Resistance

Technical Strategy
Robert Sluymer, CFA
+1 212 293 7135
For exclusive use by Fundstrat clients only January 15, 2019
Slide 17
Source: Fundstrat, Bloomberg, Optuma
S&P 500 Daily
Resistance begins at 2600 followed by 2643-2713 at 50-62% retracement of the Q4 decline
Daily momentum moving toward overbought levels
Resistance band 2600-2700
15-dma support ~2500
Daily Quadrant Balance Oscillator, measuring the percentage of stocks with rising/positive daily momentum is again overbought as the S&P moves toward resistance near 2600+

Technical Strategy
Robert Sluymer, CFA
+1 212 293 7135
For exclusive use by Fundstrat clients only January 15, 2019
Slide 18
Source: Fundstrat, Bloomberg, Optuma
• Short-term momentum becoming overbought and poised to peak as the Russell tests first trading resistance.
Russell 2000 - Daily
Daily Quadrant Balance, measuring the % of stocks
with rising daily momentum is overbought and likely to begin peaking
within the coming week
Daily momentum building positively

Technical Strategy
Robert Sluymer, CFA
+1 212 293 7135
For exclusive use by Fundstrat clients only January 15, 2019
Slide 19
Source: Fundstrat, Bloomberg, Optuma
• -61/2% retracement of the 2016-2018 rally likely.
MSCI Cyclical vs Defensive Sectors (MXCXDRN Index)

Technical Strategy
Robert Sluymer, CFA
+1 212 293 7135
For exclusive use by Fundstrat clients only January 15, 2019
Slide 20
Source: Fundstrat, Bloomberg, Optuma
• A break below the Q4 2018 relative lows (red arrow) would confirm a trend reversal between Growth and Value
Growth versus Value Weekly
Mid-cap Growth versus
Mid-cap Value
Large-cap Growth versus
Large-cap Value
Small-cap Growth versus
Small-cap Value

Technical Strategy
Robert Sluymer, CFA
+1 212 293 7135
For exclusive use by Fundstrat clients only January 15, 2019
Slide 21
Source: Fundstrat, Bloomberg, Optuma
Secular Perspective – The Big Picture
4-year cycles within secular bull markets
The Current Cycle – Where are we now?
Rates, Currencies and Commodities
International Equity Markets
US Sector and Group Leadership
Equity Ideas charts
Appendix
Technical Strategy

Technical Strategy
Robert Sluymer, CFA
+1 212 293 7135
For exclusive use by Fundstrat clients only January 15, 2019
Slide 22
Source: Fundstrat, Bloomberg, Optuma
Global Markets MSCI EAFE (MXEA) Long-term
• Index price is back to trend support
Momentum working toward oversold
Pullback to long-term trend support near 48-month sma.
We expect a rebound from current levels
Relative to S&P 500 Downtrend intact

Technical Strategy
Robert Sluymer, CFA
+1 212 293 7135
For exclusive use by Fundstrat clients only January 15, 2019
Slide 23
Source: Fundstrat, Bloomberg, Updata
EAFE Regional Relative Performance vs. MSCI EAFE
EUROPE vs EAFEOversold bounce stalling
UK vs EAFERange-bound/stalling
JAPAN vs EAFETesting uptrend and
showing very early signs of firming
ASIA EX-JAPAN vs EAFEOversold recovery
underway
Monthly Data Daily data

Technical Strategy
Robert Sluymer, CFA
+1 212 293 7135
For exclusive use by Fundstrat clients only January 15, 2019
Slide 24
Source: Fundstrat, Bloomberg, Updata
EAFE Sector Relative Performance vs. MSCI EAFE
Weekly data Weekly data
FINANCIALSWeak but oversold
UTILITIESRebound becoming
overbought
TELCOsDowntrend
reversal underway
STAPLESRebound beginning
to stall
HEALTHCARE Rebound back to
resistance
DISCRETIONARYIntermediate-term
lows developing
TECHNOLOGYChallenging/breaking
uptrend
INDUSTRIALSBreaking uptrend
MATERIALSWeak but nearing
next support
ENERGYPullback to long-term
bottoming range

Technical Strategy
Robert Sluymer, CFA
+1 212 293 7135
For exclusive use by Fundstrat clients only January 15, 2019
Slide 25
Source: Fundstrat, Bloomberg, Optuma
Global Markets MSCI EM (MXEF) Long-term• Early signs of stabilizing at 4-year/48-month sma with momentum becoming oversold.
Momentum becoming oversold
Early signs of stabilizing near the 4-year/48-month sma
Relative downtrend intact vs the S&P 500

Technical Strategy
Robert Sluymer, CFA
+1 212 293 7135
For exclusive use by Fundstrat clients only January 15, 2019
Slide 26
Source: Fundstrat, Bloomberg, Optuma
Global Markets MSCI EM (EEM ETF) - Weekly
• Early signs of bottoming as the EEM begins to stabilize at its 200-week sma
Momentum bottoming
Early signs of downtrend reversal following a correction to support at the 200-week sma and 62% retracement
Relative performance vs S&P 500reversing the 2018 downtrend

Technical StrategyFor exclusive use by Fundstrat clients only January 15, 2019
Slide 27
Source: Fundstrat, Bloomberg Optuma
Robert Sluymer, CFA
+1 212 293 7135
[email protected] EM Sector Relative Performance vs. MSCI Emerging Markets
Weekly dataWeekly data
FINANCIALSRelative
performance weak but oversold with
early signs of improving
UTILITIESStalling
TELCOsReversing
downtrend
STAPLESRange bound
HEALTHCARE Range bound
DISCRETIONARYWeak but oversold
TECHNOLOGYBreaking/challenging
uptrend
INDUSTRIALSReversing
downtrend
MATERIALSChallenging uptrend
ENERGYUptrend intact

Technical Strategy
Robert Sluymer, CFA
+1 212 293 7135
For exclusive use by Fundstrat clients only January 15, 2019
Slide 28
Source: Fundstrat, Bloomberg, Optuma
Japan Nikkei 225
• Early signs of stabilizing/bottoming at support at the rising 200-week sma.
Relative performance testing 3-year relative
downtrend.
Correction to support at the 200-week sma

Technical Strategy
Robert Sluymer, CFA
+1 212 293 7135
For exclusive use by Fundstrat clients only January 15, 2019
Slide 29
Source: Fundstrat, Bloomberg, Optuma
China Shanghai Composite Weekly
• Nearing lower end of long-term trend channel with divergences developing (see next page)
~2400-2500 support

Technical Strategy
Robert Sluymer, CFA
+1 212 293 7135
For exclusive use by Fundstrat clients only January 15, 2019
Slide 30
Source: Fundstrat, Bloomberg, Optuma
China Shanghai Composite Weekly
• Early signs of bottoming near 76% retracement near above 2400-2500 support.• Note RSI is bottoming.
~2400-2500 support
Weekly RSI Positive divergence

Technical Strategy
Robert Sluymer, CFA
+1 212 293 7135
For exclusive use by Fundstrat clients only January 15, 2019
Slide 31
Source: Fundstrat, Bloomberg, Optuma
MSCI Latin America MXLA - Monthly• Correction from resistance near 3340 is now showing early evidence of bottoming near the 4-year sma
WITH relative performance showing early signs of improving. Tactical/intermediate-term lows developing
Oversold/bottoming
Relative performance showing VERY early signs
of bottoming

Technical Strategy
Robert Sluymer, CFA
+1 212 293 7135
For exclusive use by Fundstrat clients only January 15, 2019
Slide 32
Source: Fundstrat, Bloomberg, Optuma
MSCI Latin America MXLA - Weekly
• Beginning to reverse the 2018 downtrend WITH improving relative performance
Relative performance recovering from Q3 lows

Technical Strategy
Robert Sluymer, CFA
+1 212 293 7135
For exclusive use by Fundstrat clients only January 15, 2019
Slide 33
Source: Fundstrat, Bloomberg, Optuma
• Stalled under resistance and challenging/bouncing from key support near the 5-decade uptrend • Relative performance remains weak
Relative performance remains weak
S&P TSX - Monthly

Technical Strategy
Robert Sluymer, CFA
+1 212 293 7135
For exclusive use by Fundstrat clients only January 15, 2019
Slide 34
Source: Fundstrat, Bloomberg, Optuma
• Weekly momentum has bottomed and turned following a 50% retracement of the 2016-2018 rally.• Heavy resistance begins near 14,655 up to 15,393.
S&P TSX - Weekly

Technical Strategy
Robert Sluymer, CFA
+1 212 293 7135
For exclusive use by Fundstrat clients only January 15, 2019
Slide 35
Source: Fundstrat, Bloomberg, Optuma
Secular Perspective – The Big Picture
4-year cycles within secular bull markets
The Current Cycle – Where are we now?
Rates, Currencies and Commodities
International Equity Markets
US Sector and Group Leadership
Equity Ideas charts
Appendix
Technical Strategy

Technical Strategy
Robert Sluymer, CFA
+1 212 293 7135
For exclusive use by Fundstrat clients only January 15, 2019
Slide 36
Source: Fundstrat, Bloomberg, Optuma
• Pausing under secular downtrend (blue line) and 50% retracement of the 2007-2016 decline at 3.32%.• Our expectation is that rates will consolidate sideways near current levels well into Q1 2019.
US 10-year bond yields Monthly 1980+
Monthly RSI momentum is
peaking

Technical Strategy
Robert Sluymer, CFA
+1 212 293 7135
For exclusive use by Fundstrat clients only January 15, 2019
Slide 37
Source: Fundstrat, Bloomberg, Optuma
Weekly RSI momentum unwinding from
overbought levels toward oversold levels
• Weekly momentum (bottom panel) is becoming oversold suggesting rates are likely to begin stabilizing near current levels and consolidate in a range between 2.50-3.00/3.25 through H1 2019.
US 10-year bond yields - Weekly
Secular downtrend

Technical Strategy
Robert Sluymer, CFA
+1 212 293 7135
For exclusive use by Fundstrat clients only January 15, 2019
Slide 38
Source: Fundstrat, Bloomberg, Optuma
• -2.60% as RSI becomes oversold and bottoms. • 2.80-3.00% short-term yield resistance
Daily RSI momentum is bottoming short-term
US 10-year bond yields - Daily

Technical Strategy
Robert Sluymer, CFA
+1 212 293 7135
For exclusive use by Fundstrat clients only January 15, 2019
Slide 39
Source: Fundstrat, Bloomberg, Optuma
US Dollar Index DXY - Weekly• Intermediate-term backdrop continues to suggest a pause/pullback likely developing for the USD well into/through Q1.
Weekly momentumis peaking
Technical Strategy
Robert Sluymer, CFA
+1 212 293 7135
For exclusive use by Fundstrat clients only January 15, 2019
Slide 40
Source: Fundstrat, Bloomberg, Optuma
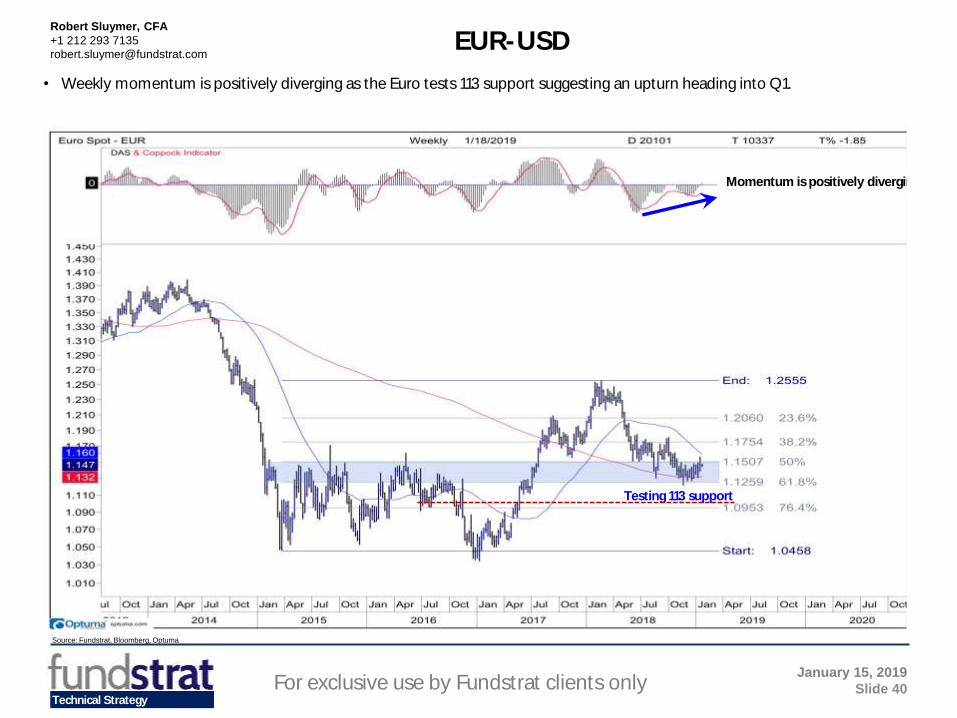
• Weekly momentum is positively diverging as the Euro tests 113 support suggesting an upturn heading into Q1.
EUR-USD
Momentum is positively diverging
Testing 113 support
Technical Strategy
Robert Sluymer, CFA
+1 212 293 7135
For exclusive use by Fundstrat clients only January 15, 2019
Slide 41
Source: Fundstrat, Bloomberg, Optuma
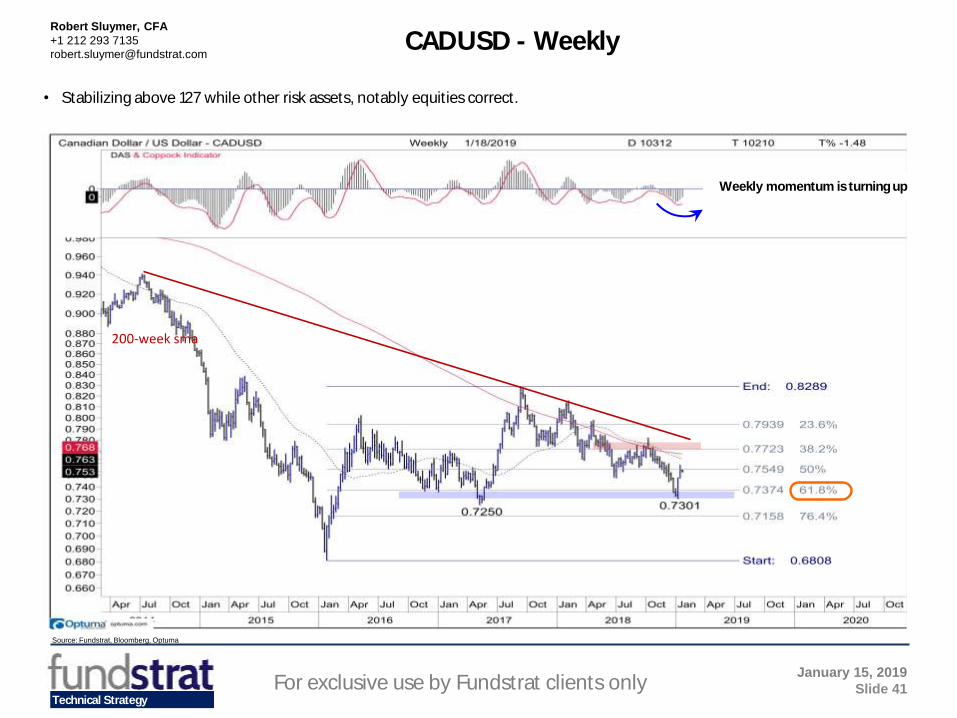
• Stabilizing above 127 while other risk assets, notably equities correct.
Weekly momentum is turning up
CADUSD - Weekly
200-week sma

Technical Strategy
Robert Sluymer, CFA
+1 212 293 7135
For exclusive use by Fundstrat clients only January 15, 2019
Slide 42
Source: Fundstrat, Bloomberg, Optuma
• Reversal and trend break from $75-80 resistance and now below support at 55. See next page for a short-term perspective.
Oil WTI Weekly
$75-80 resistance band

Technical Strategy
Robert Sluymer, CFA
+1 212 293 7135
For exclusive use by Fundstrat clients only January 15, 2019
Slide 43
Source: Fundstrat, Bloomberg, Optuma
WTI Crude Oil Futures - Daily• WTI is rebounding from oversold levels near the 61.8% retracement of its 2016-2018 rally. • First resistance is near 53 (50-dma) with 60-64 next major resistance at the 50-62% retracement of the 2018 correction.
Momentum bottoming

Technical Strategy
Robert Sluymer, CFA
+1 212 293 7135
For exclusive use by Fundstrat clients only January 15, 2019
Slide 44
Source: Fundstrat, Bloomberg, Optuma
Gold Spot XAU - Weekly
Bottoming
• Range bound with heavy resistance between 1300-1375 and support near 1150

Technical Strategy
Robert Sluymer, CFA
+1 212 293 7135
For exclusive use by Fundstrat clients only January 15, 2019
Slide 45
Source: Fundstrat, Bloomberg, Optuma
Gold GCA Futures Daily
Overbought short-term
• Short-term rebound showing early evidence of stalling near a 62% retracement 1288

Technical Strategy
Robert Sluymer, CFA
+1 212 293 7135
For exclusive use by Fundstrat clients only January 15, 2019
Slide 46
Source: Fundstrat, Bloomberg, Optuma
Secular Perspective – The Big Picture
4-year cycles within secular bull markets
The Current Cycle – Where are we now?
Rates, Currencies and Commodities
International Equity Markets
US Sector and Group Leadership
Equity Ideas charts
Appendix
Technical Strategy

Technical Strategy
Robert Sluymer, CFA
+1 212 293 7135
For exclusive use by Fundstrat clients only January 15, 2019
Slide 47
Source: Fundstrat, Bloomberg, Optuma
EARLY OUTPERFORMANCE
Relative close above declining trend
ESTABLISHED OUTPERFORMANCE
Relative close above rising trend
MARKET PERFORMANCE
Flat/neutral trend
EARLY UNDERPERFORMANCE
Relative close below rising trend
ESTABLISHED UNDERPERFORMANCE
Relative close below declining trend MAJOR US EQUITY MARKETS
* QQQ - INVESCO QQQ TRUST SERIES SSO - PROSHARES ULTRA S&P500 DIA - SPDR DJIA TRUST * SPY - SPDR S&P 500 ETF TRUST
RUSSELL STYLES* IWF - ISHARES RUSSELL 1000 GROW > IWP - ISHARES RUSSELL MID-CAP G * IWB - ISHARES RUSSELL 1000 ETF
* IWD - ISHARES RUSSELL 1000 VALU* IWM - ISHARES RUSSELL 2000 ETF IWO - ISHARES RUSSELL 2000 GRO* IWN - ISHARES RUSSELL 2000 VALU* IWR - ISHARES RUSSELL MID-CAP E* IWS - ISHARES RUSSELL MID-CAP V
CANADA & SOUTH AMERICA> ILF - ISHARES LATIN AMERICA 40 * EWC - ISHARES MSCI CANADA ETF> EWZ - ISHARES MSCI BRAZIL ETF * EWW - ISHARES MSCI MEXICO ETF BRF - VANECK VECTORS BRAZIL SM
MSCI EAFE & EMERGING MARKETS* EEB - INVESCO BRIC ETF* EFA - ISHARES MSCI EAFE ETF* SCZ - ISHARES MSCI EAFE SMALL-C* EEM - ISHARES MSCI EMERGING MAR
EURO, RUSS, TURKEY, S AFRICA* IEV - ISHARES EUROPE ETF* EZU - ISHARES MSCI EUROZONE ETF* EWG - ISHARES MSCI GERMANY ETF* EZA - ISHARES MSCI SOUTH AFRICA* TUR - ISHARES MSCI TURKEY ETF* EWU - ISHARES MSCI UNITED KINGD* RSX - VANECK VECTORS RUSSIA ETF
ASIA - PACIFIC> EWH - ISHARES MSCI HONG KONG ET \ INDY - ISHARES INDIA 50 ETF HAO - INVESCO CHINA SMALL CAP
* FXI - ISHARES CHINA LARGE-CAP E* AAXJ - ISHARES MSCI ALL COUNTRY* EWA - ISHARES MSCI AUSTRALIA ET* EWJ - ISHARES MSCI JAPAN ETF SCJ - ISHARES MSCI JAPAN SMALL* EWM - ISHARES MSCI MALAYSIA ETF* EPP - ISHARES MSCI PACIFIC EX J* EWS - ISHARES MSCI SINGAPORE ET* EWY - ISHARES MSCI SOUTH KOREA EWT - ISHARES MSCI TAIWAN ETF* VPL - VANGUARD FTSE PACIFIC ETF
BONDS BKLN - INVESCO SENIOR LOAN ETF * BIL - SPDR BBG BARC 1-3 MONTH T TLT - ISHARES 20+ YEAR TREASUR IEF - ISHARES 7-10 YEAR TREASU HYG - ISHARES IBOXX HIGH YLD C LQD - ISHARES IBOXX INVESTMENT TIP - ISHARES TIPS BOND ETF JNK - SPDR BBG BARC HIGH YIELD
CURRENCIES FXE - INVESCO CURRENCYSHARES E * UUP - INVESCO DB US DOLLAR INDE FXY - INVESCO CURRENCYSHARES J CYB - WISDOMTREE CHINESE YUAN
COMMODITIES SLV - ISHARES SILVER TRUST \ DBA - INVESCO DB AGRICULTURE FU DBC - INVESCO DB COMMODITY IND * JJCTF - IPATH BLOOMBERG COPPER GLD - SPDR GOLD SHARES > DBO - INVESCO DB OIL FUND SLX - VANECK VECTORS STEEL ETF> UNG - US NATURAL GAS FUND LP
ETF Monthly relative performance trend versus the S&P 500
Lat-
showing very early evidence of testing
downtrends vs the S&P

Technical Strategy
Robert Sluymer, CFA
+1 212 293 7135
For exclusive use by Fundstrat clients only January 15, 2019
Slide 48
Source: Fundstrat, Bloomberg, Optuma
EARLY OUTPERFORMANCE
Relative close above declining trend
ESTABLISHED OUTPERFORMANCE
Relative close above rising trend
MARKET PERFORMANCE
Flat/neutral trend
EARLY UNDERPERFORMANCE
Relative close below rising trend
ESTABLISHED UNDERPERFORMANCE
Relative close below declining trend FINANCIALS
IYR - ISHARES US REAL ESTATE E IAI - ISHARES U.S. BROKER-DEAL XLF - FINANCIAL SELECT SECTOR
> KIE - SPDR S&P INSURANCE ETF * IXG - ISHARES GLOBAL FINANCIALS
KBE - SPDR S&P BANK ETF
KRE - SPDR S&P REGIONAL BANKIN
UTILITIES
> PHO - INVESCO WATER RESOURCES E \ XLU - UTILITIES SELECT SECTOR S
JXI - ISHARES GLOBAL UTILITIES
COMMUNICATION SERVICES
> XLC - COMM SERV SELECT SECTOR S * IXP - ISHARES GLOBAL COMM SERVI
PBS - INVESCO DYNAMIC MEDIA ET
IYZ - ISHARES US TELECOMMUNICA
CONSUMER STAPLES
XLP - CONSUMER STAPLES SPDR * KXI - ISHARES GLOBAL CONSUMER S
HEALTH CARE
XLV - HEALTH CARE SELECT SECTO * IHI - ISHARES U.S. MEDICAL DEVI + PPH - VANECK VECTORS PHARMACEUT
IXJ - ISHARES GLOBAL HEALTHCAR
> IBB - ISHARES NASDAQ BIOTECHNOL
CONSUMER DISCRETIONARY
XLY - CONSUMER DISCRETIONARY S > XRT - SPDR S&P RETAIL ETF * PEJ - INVESCO DYNAMIC LEISURE A
* RTH - VANECK VECTORS RETAIL ETF * RXI - ISHARES GLOBAL CONSUMER D
* XHB - SPDR S&P HOMEBUILDERS ETF
INFORMATION TECHNOLOGY
* PXQ - INVESCO DYNAMIC NETWORKIN XLK - TECHNOLOGY SELECT SECT S \ IXN - ISHARES GLOBAL TECH ETF
IGV - ISHARES EXPANDED TECH-SO * SMH - VANECK VECTORS SEMICONDUC
INDUSTRIALS
IYT - ISHARES TRANSPORTATION A * XLI - INDUSTRIAL SELECT SECT SP
* PPA - INVESCO AEROSPACE & DEFEN
* SEA - INVESCO SHIPPING ETF
* EXI - ISHARES GLOBAL INDUSTRIAL
MATERIALS
> MOO - VANECK VECTORS AGRIBUSINE * MXI - ISHARES GLOBAL MATERIALS
GDX - VANECK VECTORS GOLD MINE * XLB - MATERIALS SELECT SECTOR S
XME - SPDR S&P METALS & MINING
ENERGY
PBW - Invesco WilderHill Clean Energy XLE - ENERGY SELECT SECTOR SPD
FCG - FIRST TRUST NATURAL GAS
* TAN - INVESCO SOLAR ETF
IXC - ISHARES GLOBAL ENERGY ET
XOP - SPDR S&P OIL & GAS EXP &
KOL - VANECK VECTORS COAL ETF
OIH - VANECK VECTORS OIL SERVI
ETF weekly relative performance trend versus the S&P 500
Retail improving. Homebuilders bottoming
Utilities stalling

Technical StrategyFor exclusive use by Fundstrat clients only January 15, 2019
Slide 49
Source: Fundstrat, Bloomberg Optuma
Robert Sluymer, CFA
+1 212 293 7135
[email protected]&P 500 Sector Relative Performance vs. S&P 500
FINANCIALS Correction back to 2012
relative uptrend beginning to bottom
UTILITIES 2018 defensive rebound
beginning to stall
Communications Services Downtrend reversal
beginning to develop
STAPLESDowntrend reversal stalling short-term
HEALTHCARE Trend reversal continues
Weekly data Daily data

Technical StrategyFor exclusive use by Fundstrat clients only January 15, 2019
Slide 50
Source: Fundstrat, Bloomberg Optuma
Robert Sluymer, CFA
+1 212 293 7135
DISCRETIONARYLeadership intact with oversold trading lows
developing
TECHNOLOGY2017-2018 uptrend break
in place against an uptrend that began in 2012
INDUSTRIALSEarly evidence of oversold lows developing at the low
end of 2013-2018 range
MATERIALSWeak but oversold
ENERGY Downtrend intact
Weekly data Daily data
S&P 500 Sector Relative Performance vs. S&P 500

Technical Strategy
Robert Sluymer, CFA
+1 212 293 7135
For exclusive use by Fundstrat clients only January 15, 2019
Slide 51
Source: Fundstrat, Bloomberg, Optuma
S&P 500 Financials - Monthly
• Financials technical profile remains weak after stalling under the 2007 highs BUT remains in a longer-term uptrend with higher highs
• However, the Financial sector is now back to next support at its rising 200-week sma
Momentum is negative crossing below the zero axis and unlikely to turn up for
many months
Relative performance vs S&P 500
remains weak

Technical Strategy
Robert Sluymer, CFA
+1 212 293 7135
For exclusive use by Fundstrat clients only January 15, 2019
Slide 52
Source: Fundstrat, Bloomberg, Optuma
• Intermediate-term lows developing at the long-term uptrend/ 200-week sma.
XLF - S&P 500 Financials (XLF ETF) - Weekly
Weekly momentum is turning up from oversold levels
-week sma and 50% retracement
Early signs of bottoming BUT relative performance has yet to reverse the 2018 downtrend

Technical Strategy
Robert Sluymer, CFA
+1 212 293 7135
For exclusive use by Fundstrat clients only January 15, 2019
Slide 53
Source: Fundstrat, Bloomberg, Optuma
• Oversold intermediate-term lows developing at rising 200-week near the 50-62% retracement
BKX Bank Index
Weekly momentum is oversold and turning up
Bounce from 50-62% retracement near 200-week sma.
Downtrend intact

Technical Strategy
Robert Sluymer, CFA
+1 212 293 7135
For exclusive use by Fundstrat clients only January 15, 2019
Slide 54
Source: Fundstrat, Bloomberg, Optuma
• 2018 correction has take the KRE back to key support at the 2015 highs and 62% retracement. • Our expectation is that the KRE is establishing longer-term lows but will likely be range bound/base for the coming 1-2 quarters
KRE - Regional Bank ETF (KRE ETF) - Weekly
Momentum is
Oversold and bottoming
Relative performance
vs S&P 500 remains in
a downtrend.
Retest of next key
support at the 2015
highs and 62%
retracement

Technical Strategy
Robert Sluymer, CFA
+1 212 293 7135
For exclusive use by Fundstrat clients only January 15, 2019
Slide 55
Source: Fundstrat, Bloomberg, Optuma
S&P 500 Utilities - Monthly
• Price uptrend intact retesting the 2017 price highs. • Despite the absolute price strength the long-term relative performance downtrend remains intact and beginning to peak
Bottoming
Relative performance vs S&P 500
Long-term downtrend intact

Technical Strategy
Robert Sluymer, CFA
+1 212 293 7135
For exclusive use by Fundstrat clients only January 15, 2019
Slide 56
Source: Fundstrat, Bloomberg, Optuma
S&P 500 Staples - Weekly
Relative performance vs S&P 500
Early signs of stalling intermediate-term
• Relative performance beginning to stall following a rebound in 2018

Technical Strategy
Robert Sluymer, CFA
+1 212 293 7135
For exclusive use by Fundstrat clients only January 15, 2019
Slide 57
Source: Fundstrat, Bloomberg, Optuma
S&P 500 Healthcare - Monthly
Neutral
Relative performance vs S&P 500Improving within a longer-term
uptrend
• Long-term relative uptrend (bottom panel) intact

Technical Strategy
Robert Sluymer, CFA
+1 212 293 7135
For exclusive use by Fundstrat clients only January 15, 2019
Slide 58
Source: Fundstrat, Bloomberg, Optuma
Weekly momentum bottoming
Relative performance vs the S&P 500 beginning to slow/stall as cyclicals and
growth begin to rebound
• Intermediate-term relative performance beginning to stall after outperforming in Q3 through Q4
S&P 500 Healthcare Index - Weekly

Technical Strategy
Robert Sluymer, CFA
+1 212 293 7135
For exclusive use by Fundstrat clients only January 15, 2019
Slide 59
Source: Fundstrat, Bloomberg, Optuma
Weekly momentum turning up from oversold levels
Relative performance vs S&P 500
Very early signs of bottoming
• Biotech is oversold tactically within a broad trading range.
Biotech iShares IBB - Weekly
Technical Strategy
Robert Sluymer, CFA
+1 212 293 7135
For exclusive use by Fundstrat clients only January 15, 2019
Slide 60
Source: Fundstrat, Bloomberg, Optuma
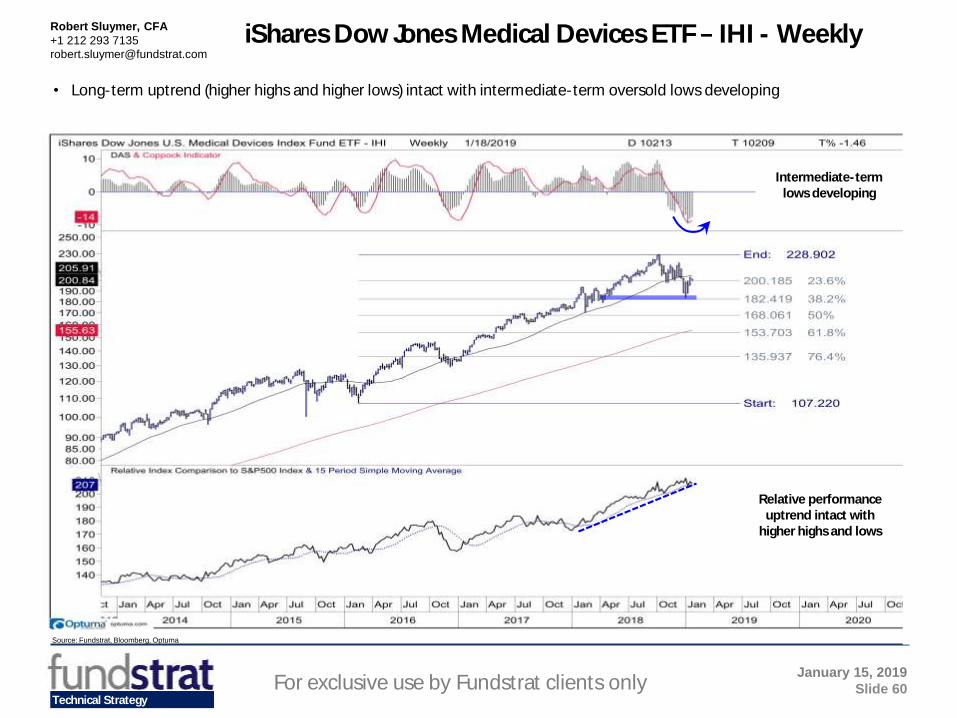
Intermediate-term lows developing
• Long-term uptrend (higher highs and higher lows) intact with intermediate-term oversold lows developing
iShares Dow Jones Medical Devices ETF IHI - Weekly
Relative performance uptrend intact with
higher highs and lows

Technical Strategy
Robert Sluymer, CFA
+1 212 293 7135
For exclusive use by Fundstrat clients only January 15, 2019
Slide 61
Source: Fundstrat, Bloomberg, Optuma
Oversold /bottoming
Relative performance vs the S&P 500 improving
• Bottoming intermediate-term at the 200-week sma and 62% retracement
S&P Consumer Discretionary Sector - Weekly

Technical Strategy
Robert Sluymer, CFA
+1 212 293 7135
For exclusive use by Fundstrat clients only January 15, 2019
Slide 62
Source: Fundstrat, Bloomberg, Optuma
S&P 500 Technology - Monthly
Decelerating
Relative performance vs S&P 500
Challenging/breaking its long-term uptrend
• Firming/rebounding from lower end 9 year 2 standard deviation band.

Technical Strategy
Robert Sluymer, CFA
+1 212 293 7135
For exclusive use by Fundstrat clients only January 15, 2019
Slide 63
Source: Fundstrat, Bloomberg, Optuma
• Intermediate-term lows in developing as weekly momentum begins to bottom and turn up
S&P 500 Technology Sector - Weekly
Momentum is bottoming at
oversold territory
2016-2018 uptrend has been broken
but holding above the prior
intermediate-term lows in Q1 2018.
Relative performance has broken to lower
lows BUT is attempting to
stabilize

Technical Strategy
Robert Sluymer, CFA
+1 212 293 7135
For exclusive use by Fundstrat clients only January 15, 2019
Slide 64
Source: Fundstrat, Bloomberg, Optuma
Momentum is oversold and bottoming
Breaking the 2016-2018 uptrend
Relative performance is rebuilding to the upside
• Intermediate-term lows developing with relative performance leading to the upside.
Software Index IGV ETF - Weekly

Technical Strategy
Robert Sluymer, CFA
+1 212 293 7135
For exclusive use by Fundstrat clients only January 15, 2019
Slide 65
Source: Fundstrat, Bloomberg, Optuma
Semiconductor ETF (SMH)- Weekly• -week sma and 50% retracement.
Weekly momentum oversold and beginning to turn up
Bounce from support
Relative vs S&P 500 Downtrend intact
Relative vs Sector Beginning to reverse the 2018 downtrend.

Technical Strategy
Robert Sluymer, CFA
+1 212 293 7135
For exclusive use by Fundstrat clients only January 15, 2019
Slide 66
Source: Fundstrat, Bloomberg, Optuma
S&P 500 Industrial Sector - Monthly
Momentum remains negative
Relative performance vs S&P 500
Early signs of improving after breaking to multi-year lows
• Challenging rising 4-year sma with early signs of relative performance improving

Technical Strategy
Robert Sluymer, CFA
+1 212 293 7135
For exclusive use by Fundstrat clients only January 15, 2019
Slide 67
Source: Fundstrat, Bloomberg, Optuma
S&P 500 Industrial Sector - Weekly
• Weak technical profile following the break of the 2016-• -term at the 50-62% retracement and 200-week sma.
Weekly momentum is
support at the rising 200-week sma and 50-62%
retracement
Relative performance vs the S&P 500 is in an
established downtrend and probing new lows.

Technical Strategy
Robert Sluymer, CFA
+1 212 293 7135
For exclusive use by Fundstrat clients only January 15, 2019
Slide 68
Source: Fundstrat, Bloomberg, Optuma
• Oversold bound from rising 200-week sma and 50% retracement
Weekly
momentum is
bottoming
Dow Jones Transportation Index - Weekly
Relative performance vs the S&P 500 remains
weak

Technical Strategy
Robert Sluymer, CFA
+1 212 293 7135
For exclusive use by Fundstrat clients only January 15, 2019
Slide 69
Source: Fundstrat, Bloomberg, Optuma
S&P 500 Materials - Monthly
Momentum has crossed below the zero axis but becoming
oversold
Relative performance vs S&P 500Long-term downtrend remains negative
• Test of rising 4-year sma underway with monthly momentum becoming oversold

Technical Strategy
Robert Sluymer, CFA
+1 212 293 7135
For exclusive use by Fundstrat clients only January 15, 2019
Slide 70
Source: Fundstrat, Bloomberg, Optuma
• Intermediate-term lows developing at key support at the rising 200-week sma and 50-62% retracement
S&P 500 Materials Sector ETF (XLB)

Technical Strategy
Robert Sluymer, CFA
+1 212 293 7135
For exclusive use by Fundstrat clients only January 15, 2019
Slide 71
Source: Fundstrat, Bloomberg, Optuma
• Intermediate-term rebound nearing next resistance near the 40- and 200-week and 50% retracement between 21-22. • Note relative performance is showing early signs of stalling as risk assets begin to bounce back from oversold levels
Gold GDX

Technical Strategy
Robert Sluymer, CFA
+1 212 293 7135
For exclusive use by Fundstrat clients only January 15, 2019
Slide 72
Source: Fundstrat, Bloomberg, Optuma
S&P 500 Energy - Monthly
Relative performance vs S&P 500
• Challenging/breaking a long-term uptrend that began in the early 1990s with relative performance yet to reverse its established downtrend.
Technical Strategy
Robert Sluymer, CFA
+1 212 293 7135
For exclusive use by Fundstrat clients only January 15, 2019
Slide 73
Source: Fundstrat, Bloomberg, Optuma
Secular Perspective – The Big Picture
4-year cycles within secular bull markets
The Current Cycle – Where are we now?
Rates, Currencies and Commodities
International Equity Markets
US Sector and Group Leadership
Equity Ideas charts
Appendix
Technical Strategy

Technical Strategy
Robert Sluymer, CFA
+1 212 293 7135
For exclusive use by Fundstrat clients only January 15, 2019
Slide 74
Source: Fundstrat, Bloomberg, Optuma
• Momentum leadership intact with relative performance (bottom panel) making new high intermediate-term momentum bottoms
V

Technical Strategy
Robert Sluymer, CFA
+1 212 293 7135
For exclusive use by Fundstrat clients only January 15, 2019
Slide 75
Source: Fundstrat, Bloomberg, Optuma
• Relative performance continues to lead to the upside as price begins to rally from support
PYPL

Technical Strategy
Robert Sluymer, CFA
+1 212 293 7135
For exclusive use by Fundstrat clients only January 15, 2019
Slide 76
Source: Fundstrat, Bloomberg, Optuma
• Momentum leader reaccelerating from support at its 40-wee sma WITH relative performance leading to the upside.
KEYS

Technical Strategy
Robert Sluymer, CFA
+1 212 293 7135
For exclusive use by Fundstrat clients only January 15, 2019
Slide 77
Source: Fundstrat, Bloomberg, Optuma
AMAT Early 2018 downside leader beginning to bottom Weekly momentum has bottomed as AMAT begins to stabilize at its rising 200-week sma. Expect a multi-
quarter bottoming process to develop similar to late 2015/early 2016.
Technical Strategy
Robert Sluymer, CFA
+1 212 293 7135
For exclusive use by Fundstrat clients only January 15, 2019
Slide 78
Source: Fundstrat, Bloomberg, Optuma
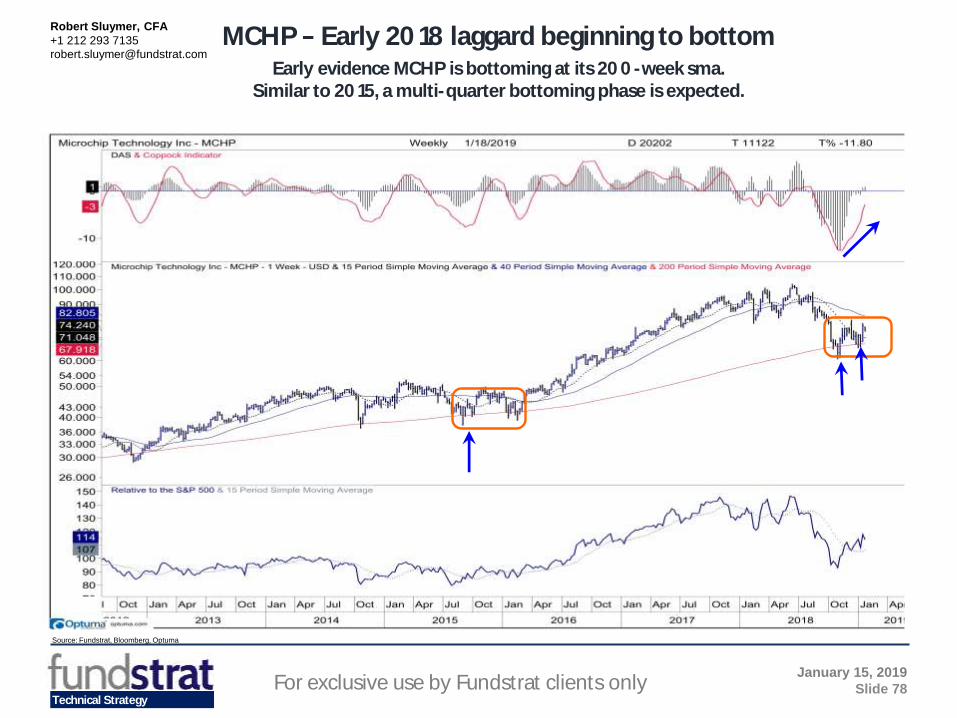
MCHP Early 2018 laggard beginning to bottomEarly evidence MCHP is bottoming at its 200-week sma.
Similar to 2015, a multi-quarter bottoming phase is expected.

Technical Strategy
Robert Sluymer, CFA
+1 212 293 7135
For exclusive use by Fundstrat clients only January 15, 2019
Slide 79
Source: Fundstrat, Bloomberg, Optuma
HD Oversold nearing support
Weekly momentum beginning to bottom as HD nears its rising 200-week sma.
Technical Strategy
Robert Sluymer, CFA
+1 212 293 7135
For exclusive use by Fundstrat clients only January 15, 2019
Slide 80
Source: Fundstrat, Bloomberg, Optuma
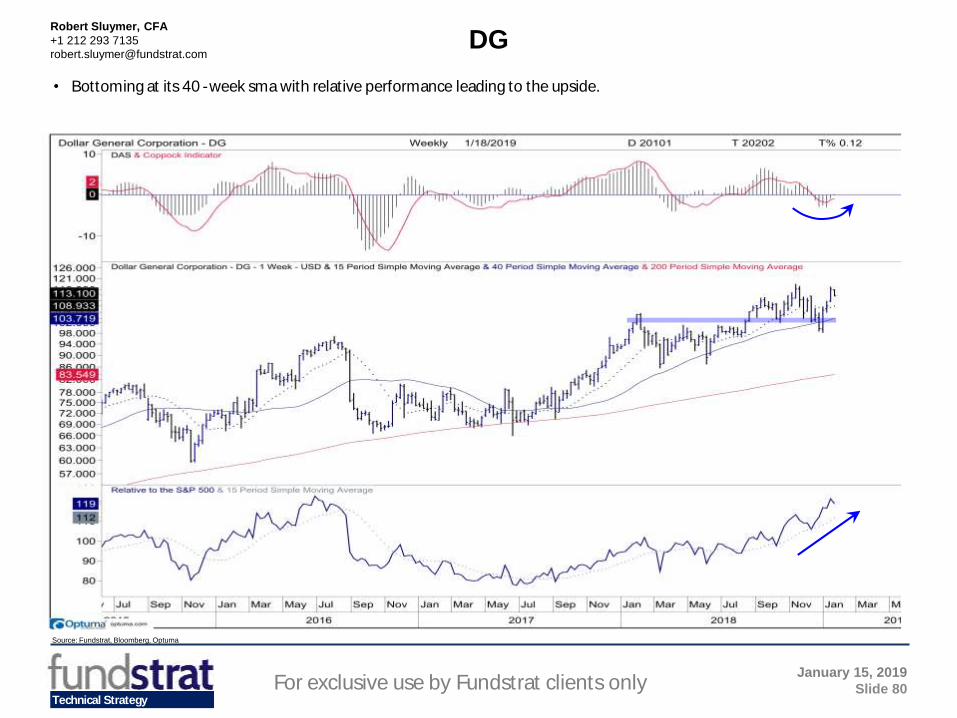
• Bottoming at its 40-week sma with relative performance leading to the upside.
DG

Technical Strategy
Robert Sluymer, CFA
+1 212 293 7135
For exclusive use by Fundstrat clients only January 15, 2019
Slide 81
Source: Fundstrat, Bloomberg, Optuma
DLTR Bottoming at 200-week sma
Bottoming at its long-term uptrend defined by its rising 200-week sma with relative performance improving

Technical Strategy
Robert Sluymer, CFA
+1 212 293 7135
For exclusive use by Fundstrat clients only January 15, 2019
Slide 82
Source: Fundstrat, Bloomberg, Optuma
• Bottoming intermediate-term at support with relative performance building to the upside
NKE

Technical Strategy
Robert Sluymer, CFA
+1 212 293 7135
For exclusive use by Fundstrat clients only January 15, 2019
Slide 83
Source: Fundstrat, Bloomberg, Optuma
• Recovery continues from long-term support at rising 200-week sma WITH improving relative performance
PHM
Technical Strategy
Robert Sluymer, CFA
+1 212 293 7135
For exclusive use by Fundstrat clients only January 15, 2019
Slide 84
Source: Fundstrat, Bloomberg, Optuma
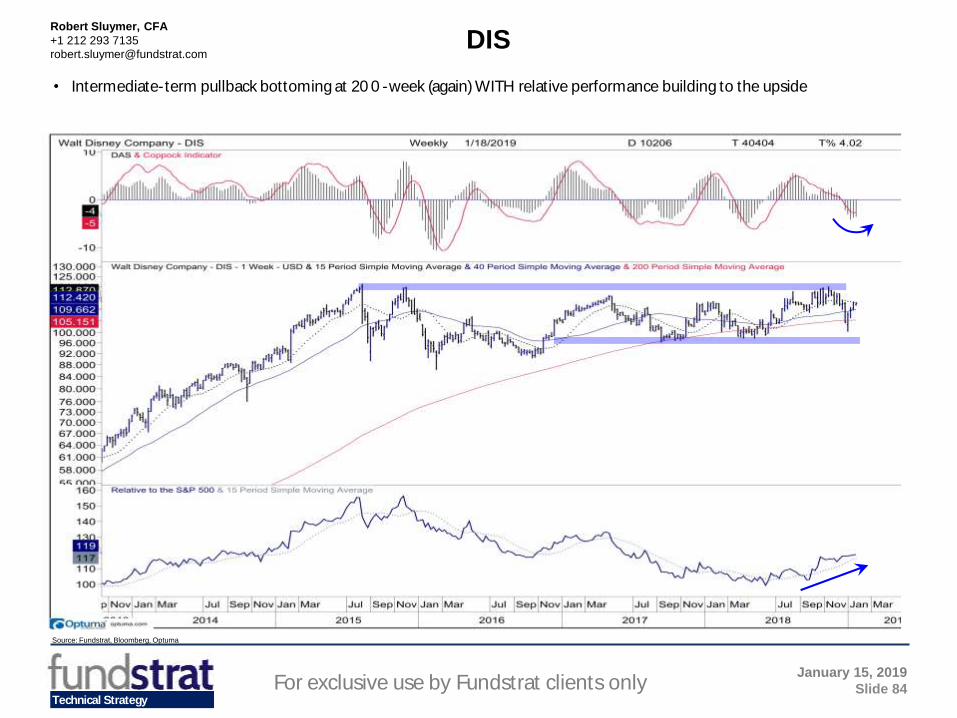
• Intermediate-term pullback bottoming at 200-week (again) WITH relative performance building to the upside
DIS
Technical Strategy
Robert Sluymer, CFA
+1 212 293 7135
For exclusive use by Fundstrat clients only January 15, 2019
Slide 85
Source: Fundstrat, Bloomberg, Optuma
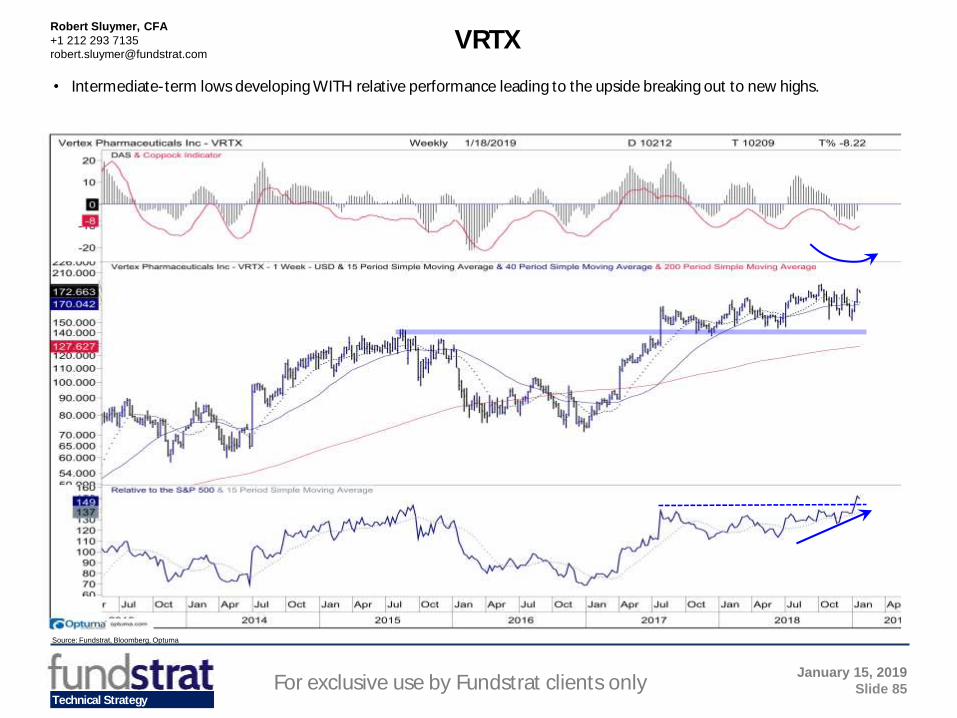
• Intermediate-term lows developing WITH relative performance leading to the upside breaking out to new highs.
VRTX

Technical Strategy
Robert Sluymer, CFA
+1 212 293 7135
For exclusive use by Fundstrat clients only January 15, 2019
Slide 86
Source: Fundstrat, Bloomberg, Optuma
• Bottoming intermediate-term at the upper end of long-term support WITH relative performance building to the upside
AMGN

Technical Strategy
Robert Sluymer, CFA
+1 212 293 7135
For exclusive use by Fundstrat clients only January 15, 2019
Slide 87
Source: Fundstrat, Bloomberg, Optuma
• Bottoming intermediate-term within a longer-term basing profile
BIIB

Technical Strategy
Robert Sluymer, CFA
+1 212 293 7135
For exclusive use by Fundstrat clients only January 15, 2019
Slide 88
Source: Fundstrat, Bloomberg, Optuma
• Resiliently consolidating above 2018 support with relative performance rebuilding to the upside
DE

Technical Strategy
Robert Sluymer, CFA
+1 212 293 7135
For exclusive use by Fundstrat clients only January 15, 2019
Slide 89
Source: Fundstrat, Bloomberg, Optuma
• Bottoming intermediate-term at its 200-week sma
HON

Technical Strategy
Robert Sluymer, CFA
+1 212 293 7135
For exclusive use by Fundstrat clients only January 15, 2019
Slide 90
Source: Fundstrat, Bloomberg, Optuma
• Bottoming intermediate-term at its 200-week sma with improving relative performance
ITW

Technical Strategy
Robert Sluymer, CFA
+1 212 293 7135
For exclusive use by Fundstrat clients only January 15, 2019
Slide 91
Source: Fundstrat, Bloomberg, Optuma
BK Testing long-term trend supportTest of support at long-term uptrend at its rising 200-week sma.
Note relative performance is beginning to reverse its 2018 downtrend.

Technical Strategy
Robert Sluymer, CFA
+1 212 293 7135
For exclusive use by Fundstrat clients only January 15, 2019
Slide 92
Source: Fundstrat, Bloomberg, Optuma
SCHW Testing 200-week sma support
Weekly momentum oversold and bottoming as SCHW tests its rising 200-week sma. Expect a multi-quarter bottoming/basing process well into 2019
Technical Strategy
Robert Sluymer, CFA
+1 212 293 7135
For exclusive use by Fundstrat clients only January 15, 2019
Slide 93
Source: Fundstrat, Bloomberg, Optuma
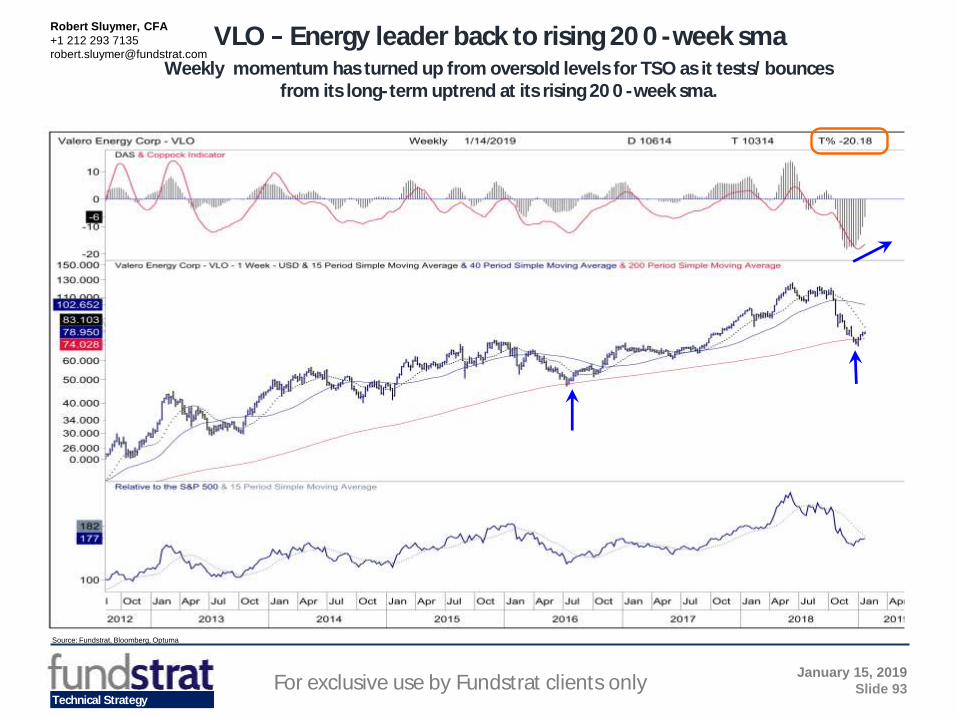
VLO Energy leader back to rising 200-week smaWeekly momentum has turned up from oversold levels for TSO as it tests/bounces
from its long-term uptrend at its rising 200-week sma.

Technical Strategy
Robert Sluymer, CFA
+1 212 293 7135
For exclusive use by Fundstrat clients only January 15, 2019
Slide 94
Source: Fundstrat, Bloomberg, Optuma
DUK Defensive performance stalling
Weekly momentum is peaking/turning negative as DUK stalls near resistance near 90 and its 2015, 2016 and 2017 highs. Note relative performance is beginning to peak at its downtrend.

Technical Strategy
Robert Sluymer, CFA
+1 212 293 7135
For exclusive use by Fundstrat clients only January 15, 2019
Slide 95
Source: Fundstrat, Bloomberg, Optuma
KO Defensive leaders stalling
Weekly momentum has peaked for KO as relative performance stalls under its long-term downtrend

Technical Strategy
Robert Sluymer, CFA
+1 212 293 7135
For exclusive use by Fundstrat clients only January 15, 2019
Slide 96
Source: Fundstrat, Bloomberg, Optuma
Secular Perspective – The Big Picture
4-year cycles within secular bull markets
The Current Cycle – Where are we now?
Rates, Currencies and Commodities
International Equity Markets
US Sector and Group Leadership
Equity Ideas charts
Appendix
Technical Strategy

Technical Strategy
Robert Sluymer, CFA
+1 212 293 7135
For exclusive use by Fundstrat clients only January 15, 2019
Slide 97
Source: Fundstrat, Bloomberg, OptumaSource: Fundstrat, Bloomberg, Optuma
EARLY
OUTPERFORMANCE
ESTABLISHED
OUTPERFORMANCE
MARKET
PERFORMANCE
EARLY
UNDERPERFORMANCE
ESTABLISHED
UNDERPERFORMANCE
Relative performance is breaking ABOVE
a DECLININGrelative moving average
Relative performance is trending ABOVE
a RISINGrelative moving average
> = improving categories
Relative performance is RANGE BOUND
around a FLAT/NEUTRALrelative moving average
* = Slowing uptrend
Relative performance is breaking BELOW
a RISINGrelative moving average
/ = deteriorating categories
Relative performance is trending BELOW
a DECLININGrelative moving average
Trend is defined by a 15-
week moving average of
relative performance
Momentum indicator measuring the difference between a
5- and 15-week moving averages
Useful to identify turning points and confirm trend shifts
Categorizing Relative Performance Trends through a “Life Cycle”

Technical Strategy
Robert Sluymer, CFA
+1 212 293 7135
For exclusive use by Fundstrat clients only January 15, 2019
Slide 98
Source: Fundstrat, Bloomberg, Optuma
Disclosures
This research is for the clients of Fundstrat Global Advisors only. For important disclosures and rating histories regarding sectors or companies that are the subject of this report, please contact your sales representative or Fundstrat Global Advisors at 150 East 52nd Street, New York, NY, 10022 USA.
Analyst Certification (Reg AC)
Robert Sluymer, the research analyst denoted by an “AC” on the cover of this report, hereby certifies that all of the views expressed in this report accurately reflect his personal views, which have not been influenced by considerations of the firm’s business or client relationships.
Neither I, nor a member of my household is an officer, director, or advisory board member of the issuer(s) or has another significant affiliation with the issuer(s) that is/are the subject of this research report. There is a possibility that we will from time to time have long or short positions in, and buy or sell, the securities or derivatives, if any, referred to in this research
Conflicts of Interest
This research contains the views, opinions and recommendations of Fundstrat. As of the time of writing and publication of this presentation, Fundstrat does not know of, or have reason to know of any material conflicts of interest at the time of the publication of this presentation. The Company has no contractual relationship, nor have we received any compensation from any of the companies listed in this research report.
Analyst Industry/Sector Views
Positive (+): The analyst expects the performance of his industry/sector coverage universe over the next 6-18 months to be attractive vs. the relevant broad market benchmark, being the S&P 500 for North America.
Neutral (N): The analyst expects the performance of his or her industry/sector coverage universe over the next 6-18 months to be in line with the relevant broad market benchmark, being the S&P 500 for North America.
Negative (-): The analyst expects his or her industry coverage universe over the next 6-18 months to underperform vs. the relevant broad market benchmark, being the S&P 500 for North America.
General Disclosures
Fundstrat Global Advisors is an independent research company and is not a registered investment advisor and is not acting as a broker dealer under any federal or state securities laws. Fundstrat Global Advisors is a member of IRC Securities’ Research Prime Services Platform. IRC Securities is a FINRA registered broker-dealer that is focused on supporting the independent research industry. Certain personnel of Fundstrat (i.e. Research Analysts) are registered representatives of IRC Securities, a FINRA member firm registered as a broker-dealer with the Securities and Exchange Commission and certain state securities regulators. As registered representatives and independent contractors of IRC Securities, such personnel may receive commissions paid to or shared with IRC Securities for transactions placed by Fundstrat clients directly with IRC Securities or with securities firms that may share commissions with IRC Securities in accordance with applicable SEC and FINRA requirements. IRC Securities does not distribute the research of Fundstrat, which is available to select institutional clients that have engaged Fundstrat.
As registered representatives of IRC Securities our analysts must follow IRC Securities’ Written Supervisory Procedures. Notable compliance policies include (1) prohibition of insider trading or the facilitation thereof, (2) maintaining client confidentiality, (3) archival of electronic communications, and (4) appropriate use of electronic communications, amongst other compliance related policies.
Fundstrat does not have the same conflicts that traditional sell-side research organizations have because Fundstrat (1) does not conduct any investment banking activities, (2) does not manage any investment funds, and (3) our clients are only institutional investors.
This research is for the clients of Fundstrat Global Advisors only. Additional information is available upon request. Information has been obtained from sources believed to be reliable but Fundstrat Global Advisors does not warrant its completeness or accuracy except with respect to any disclosures relative to Fundstrat and the analyst's involvement (if any) with any of the subject companies of the research. All pricing is as of the market close for the securities discussed, unless otherwise stated. Opinions and estimates constitute our judgment as of the date of this material and are subject to change without notice. Past performance is not indicative of future results. This material is not intended as an offer or solicitation for the purchase or sale of any financial instrument. The opinions and recommendations herein do not take into account individual client circumstances, risk tolerance, objectives, or needs and are not intended as recommendations of particular securities, financial instruments or strategies. The recipient of this report must make its own independent decision regarding any securities or financial instruments mentioned herein. Except in circumstances where Fundstrat expressly agrees otherwise in writing, Fundstrat is not acting as a municipal advisor and the opinions or views contained herein are not intended to be, and do not constitute, advice, including within the meaning of Section 15B of the Securities Exchange Act of 1934. All research reports are disseminated and available to all clients simultaneously through electronic publication to our internal client website, fundstrat.com. Not all research content is redistributed to our clients or made available to third-party aggregators or the media. Please contact your sales representative if you would like to receive any of our research publications.
Copyright 2019 Fundstrat Global Advisors LLC. All rights reserved. No part of this material may be reprinted, sold or redistributed without the prior written consent of Fundstrat Global Advisors LLC.
Recommended