ROI Dashboard
Metrics for the User Experience Indicator
Michael Hafnerhttp://www.kbex.eu
michael-hafner (at) a1.net

Introduction
These are additional materials supporting the concept of the ROI Dashboard the full story can be found on the kbex-blog (http://www.kbex.eu, http://kbex.wordpress.com/tag/roi-dashboard/)

Efficiency – Creation efficiency time spent for content
creation (compared to old system)
wiki effort (pages+edits) compared to users
Row 4
0.00000
1000.00000
2000.00000
3000.00000
4000.00000
5000.00000
6000.00000
7000.00000
8000.00000
9000.00000
10000.00000
now
then
creation ratio (time in mins)
now
then
Row 24
2300.00000
2350.00000
2400.00000
2450.00000
2500.00000
2550.00000
2600.00000
2650.00000
2700.00000
2750.00000
2800.00000
wiki factor
pages*edits
users

Efficiency – Creation efficiency 2 RSS Factor: Feeds and
feedintegrations compared to users (clickers)
Development of added value: increase value through valued content (wiki, media (video))
III
III
0
5
10
15
20
25
30
35
40
45
50
Development of added value
wiki edits (1:100)
media items
Row 46
0.00000
200.00000
400.00000
600.00000
800.00000
1000.00000
1200.00000
1400.00000
1600.00000
1800.00000
2000.00000
rss factor
feeds*feedboxes
users
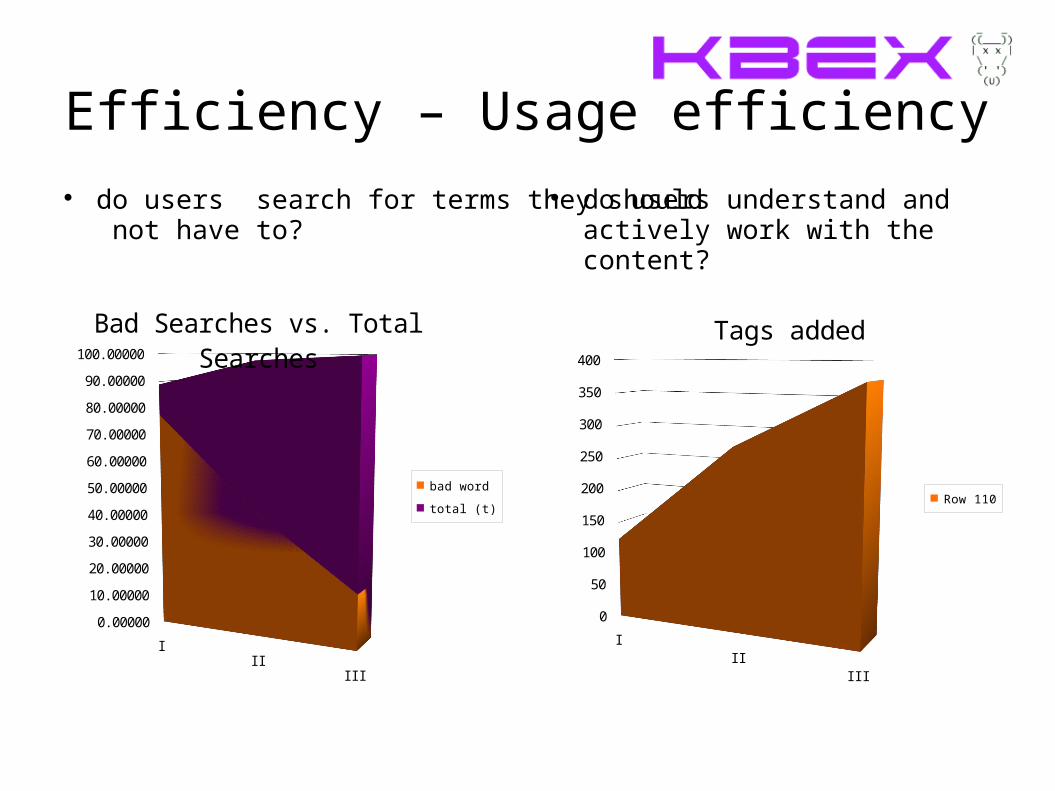
Efficiency – Usage efficiency do users search for terms they should
not have to? do users understand and
actively work with the content?
III
III
0.00000
10.00000
20.00000
30.00000
40.00000
50.00000
60.00000
70.00000
80.00000
90.00000
100.00000
Bad Searches vs. Total Searches
bad word
total (t)
III
III
0
50
100
150
200
250
300
350
400
Tags added
Row 110
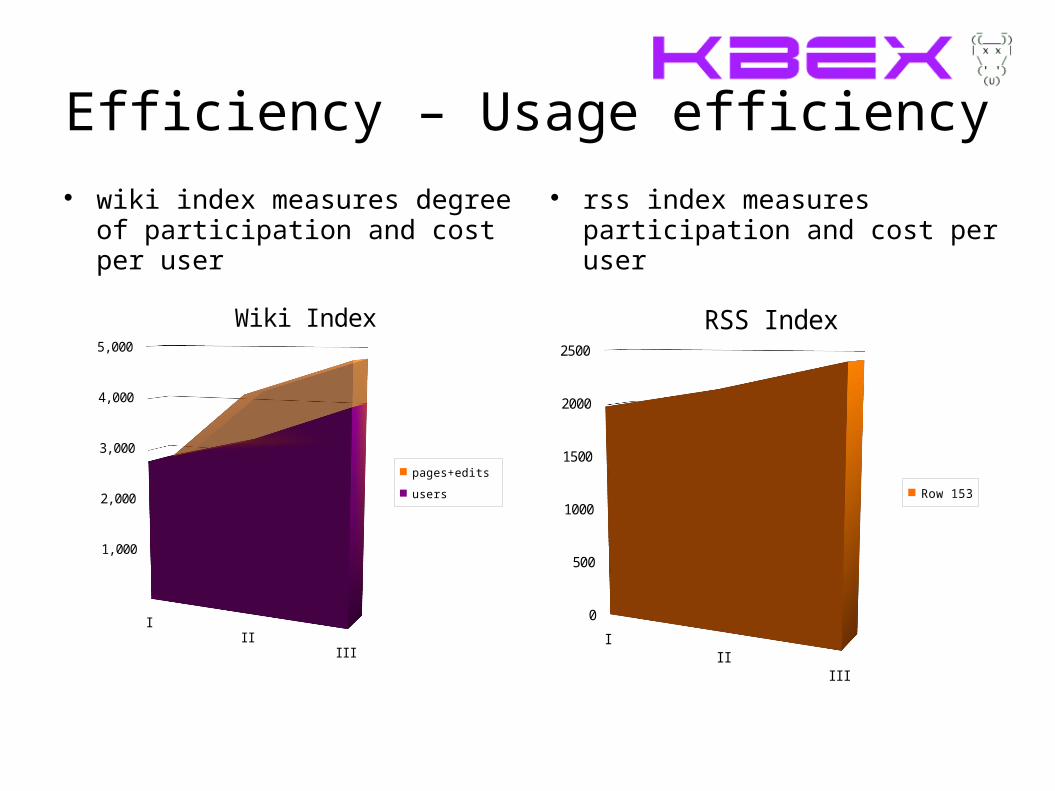
Efficiency – Usage efficiency wiki index measures degree of
participation and cost per user rss index measures
participation and cost per user
III
III
0
500
1000
1500
2000
2500
RSS Index
Row 153
III
III
1,000
2,000
3,000
4,000
5,000
Wiki Index
pages+edits
users

Satisfaction - Ease of Access Search Index – does search
deliver the desired results do users consume added
value, in what extent (participation, cost per user)
III
III
0
5000
10000
15000
20000
25000
30000
35000
40000
Media Index
media consumed
media consumed >50%
III
III
0
0.5
1
1.5
2
2.5
3
3.5
4
Search Index
resultclicks (t)
resultpages(avg)
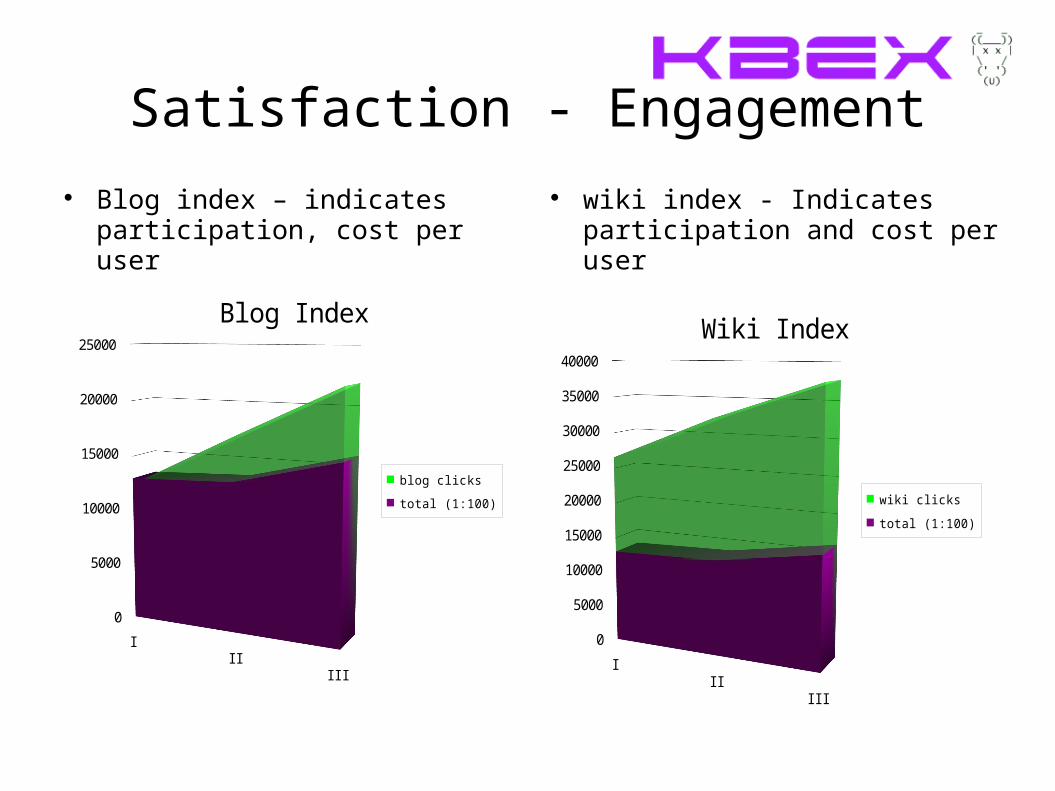
Satisfaction - Engagement Blog index – indicates
participation, cost per user wiki index - Indicates
participation and cost per user
III
III
0
5000
10000
15000
20000
25000
Blog Index
blog clicks
total (1:100)
III
III
0
5000
10000
15000
20000
25000
30000
35000
40000
Wiki Index
wiki clicks
total (1:100)
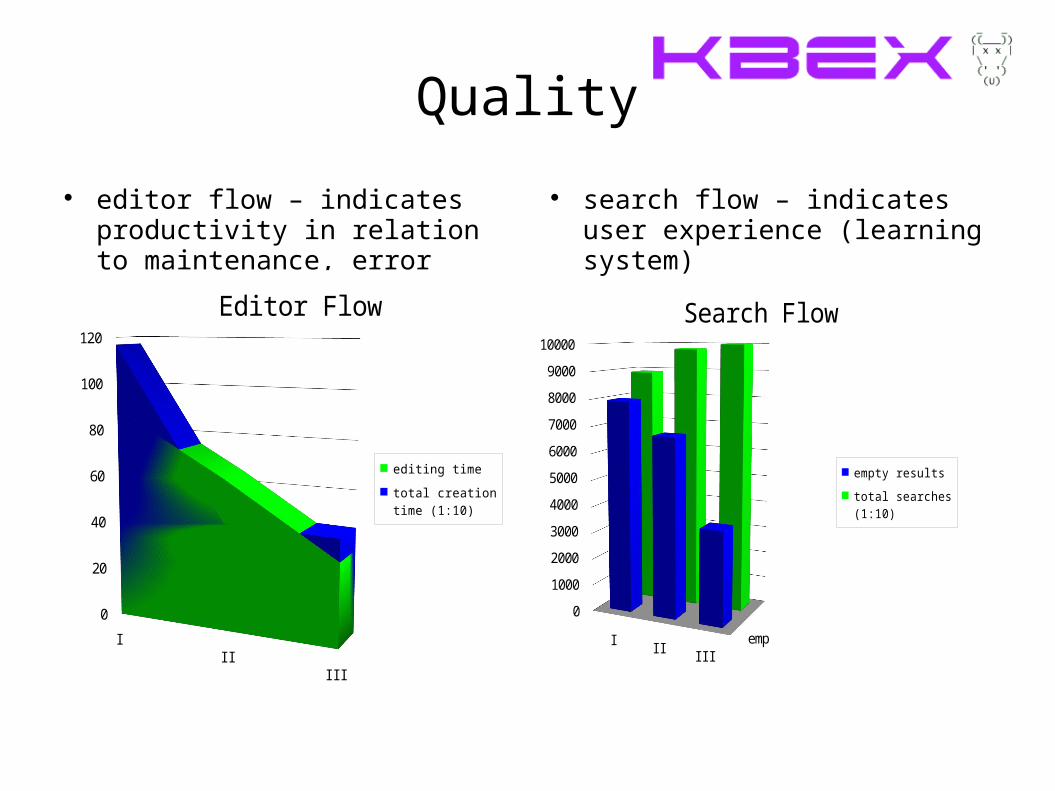
Quality
editor flow – indicates productivity in relation to maintenance, error handling
search flow – indicates user experience (learning system)
III
III
0
20
40
60
80
100
120
Editor Flow
editing time
total creation time (1:10)
III
III
0
1000
2000
3000
4000
5000
6000
7000
8000
9000
10000
empty re-sults
Search Flow
empty results
total searches (1:10)
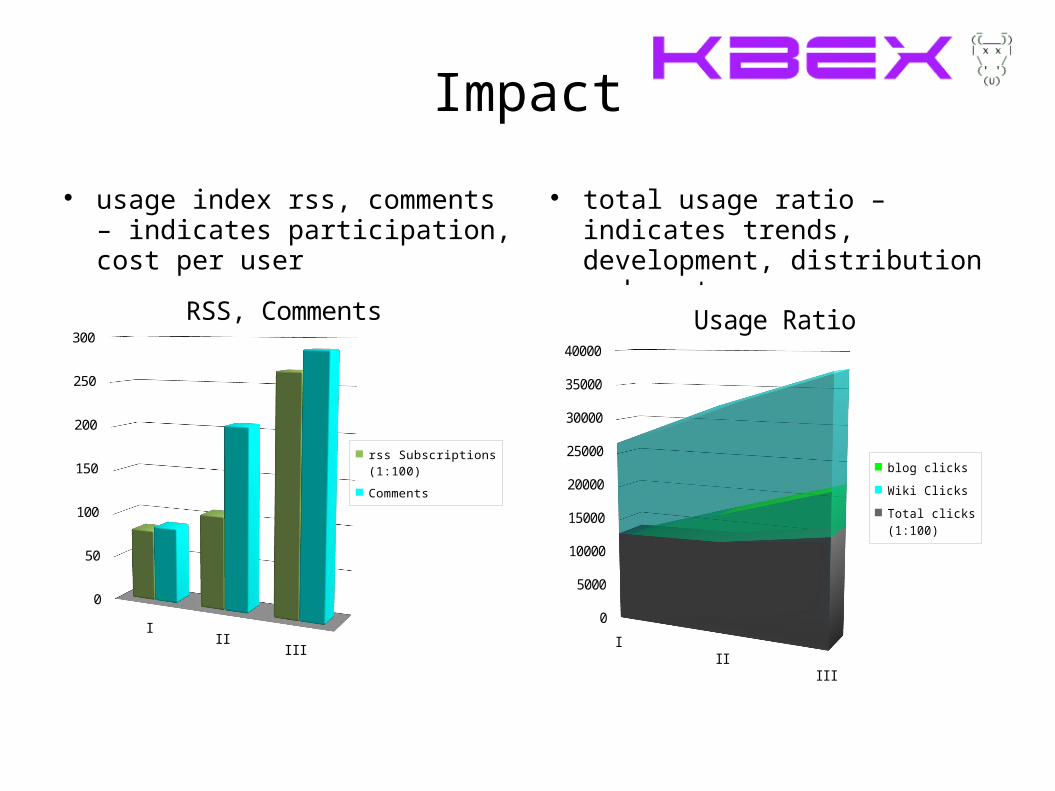
Impact
usage index rss, comments – indicates participation, cost per user
total usage ratio – indicates trends, development, distribution and cost per user
III
III
0
50
100
150
200
250
300
RSS, Comments
rss Subscriptions (1:100)
Comments
III
III
0
5000
10000
15000
20000
25000
30000
35000
40000
Usage Ratio
blog clicks
Wiki Clicks
Total clicks (1:100)
Monetization – Creation Efficiency Efficiency creation ratio: (time then – time now) * hourly fee = $$$
wiki factor: pages * (cost per cms page – cost per wiki page) = $$$
costs cms page: 1 editor – 30 pages per week – 120 pages per month – 100% salary -> 100/120 = 0,83 % of salary per page
costs wiki page: 1 employee – 5 edits per month – 1 hour per week (2,5 % of worktime) - > 2,5/5 = 0,5 % of salary per page

Monetization – Creation Efficiency Efficiency 2 rss factor: (cost per page / (integrated,applied feeds) ) = $$$
reduced cost per page, optimized cost per user through rss reuse
added value: media value x $ + wiki value y $ = $$$
Monetization – Usage Efficiency Usage efficiency bad search, total search:
cost of bad search: (3 * hourly fee) / 60 * bad searches =$$$
gain of good search: (total search – bad search) * 2 * hourly fee / 60 = $$$
bad search: 3 mins lost
good search: 2 mins won tag factor: define participation value * tags = $$$
wiki index: (participation value * pages + edits) = $$$
(cost per page * (pages = edits) ) / users= $$$ rss index: cost per page / rss subscriptions = $$$, optimized cost
per user
Monetization – Satisfaction, Ease of Access
Satisfaction – Ease of Access Search Index:
cost of browsing: (2 * hourly fee) / 60 * resultpages =$$$
gain of result clicks: clicks * 2 * hourly fee / 60 = $$$
the more users click on search results, the better the search; the more resultspages they have to browse, the more potential for optimization
browse: 2 min per page lost; click: 2 min won media index
items consumed * x $ = $$$
items consumed > 50% * 3x = $$$
define contact price: reaching users with a video is worth x $, reaching them intensely (> 50%) is worth 3x $
Monetization – Satisfaction, Engagement
Satisfaction – Engagement Blog Index:
worth of total portal: clicks * x $ = $$$
worth of blogs: clicks * 3x $ = $$$
efficiency total: worth of total portal / (cost per page * clicks) = $$$
efficiency blogs: worth of blogs / (cost per page * clicks) = $$$
efficiency through engagement ratio 1: efficiency blogs / efficiency total
assumption: blogs are non mandatory content – consumed with more interest
reaching users with mandatory content is worth x $, with optional content is worth 3x $ (compared to tcp, advertising)
Monetization – Satisfaction, Engagement
Satisfaction – Engagement Wiki Index:
worth of total portal: clicks * x $ = $$$
worth of wikis: clicks * 3x $ = $$$
efficiency total: worth of total portal / (cost per page * clicks) = $$$
efficiency wikis: worth of wiki / (cost per page * clicks) = $$$
efficiency through engagement ratio 2: efficiency wikis / efficiency total
assumption: wikis are non mandatory content – consumed with more interest
reaching users with mandatory content is worth x $, with optional content is worth 3x $ (compared to tcp, advertising)
total efficiency through engagement ratio: ratio 1 * ratio 2
Monetization - Quality
Quality editor flow:
editor productivity ratio = (total time editing * hourly fee) / (time for fixing, administrating, changes * hourly fee)
search flow:
empty search results: loss of 10 mins
search flow: total searches / empty searches
search flow ratio: empty searches * 10 * hourly fee / 60 = $$$
Monetization - Impact
Impact rss, comments:
rss: cost per page / number of subscriptions
comments: comments * 12x = $$$
comments show value and user engagement, if one pageview values x $, 1 comments values 12x $
total usage ratio:
(wiki clicks / total clicks) = ratio 1
(blog clicks / total clicks) = ratio 2
indicates growth or decrease in total value
The Dashboard Display charts Display values integrate and extend easily
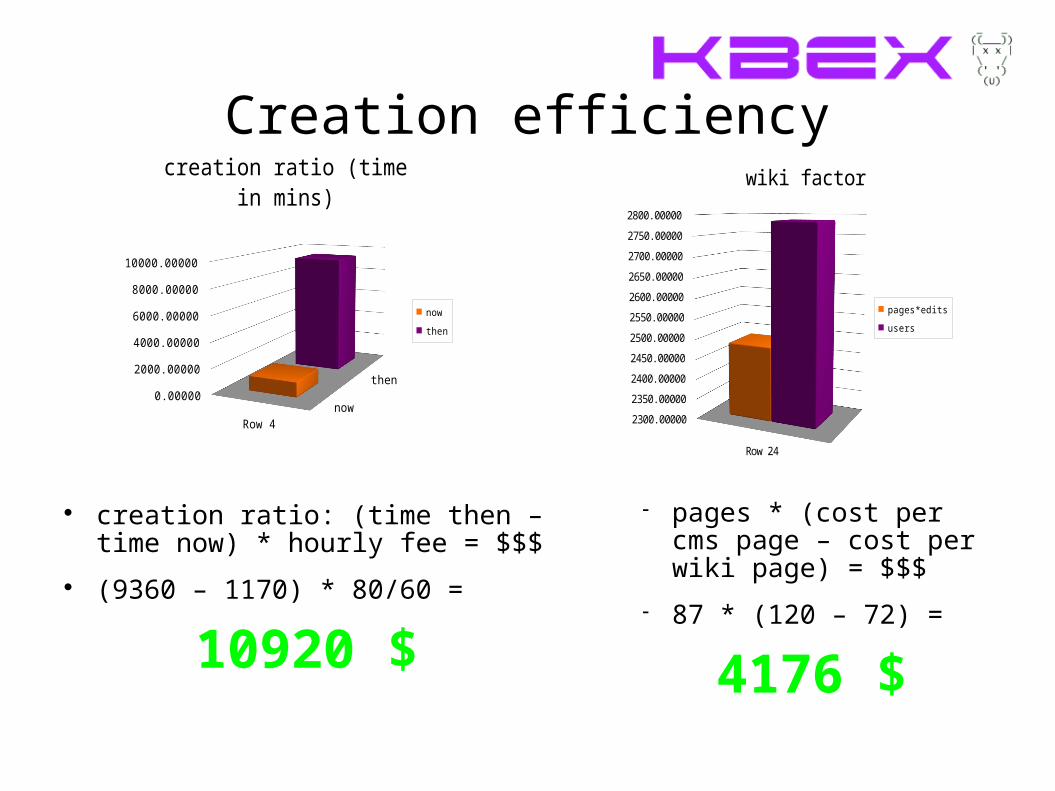
Creation efficiency
creation ratio: (time then – time now) * hourly fee = $$$
(9360 – 1170) * 80/60 =
10920 $
Row 4
0.00000
1000.00000
2000.00000
3000.00000
4000.00000
5000.00000
6000.00000
7000.00000
8000.00000
9000.00000
10000.00000
now
then
creation ratio (time in mins)
now
then
pages * (cost per cms page – cost per wiki page) = $$$
87 * (120 – 72) =
4176 $
Row 24
2300.00000
2350.00000
2400.00000
2450.00000
2500.00000
2550.00000
2600.00000
2650.00000
2700.00000
2750.00000
2800.00000
wiki factor
pages*edits
users
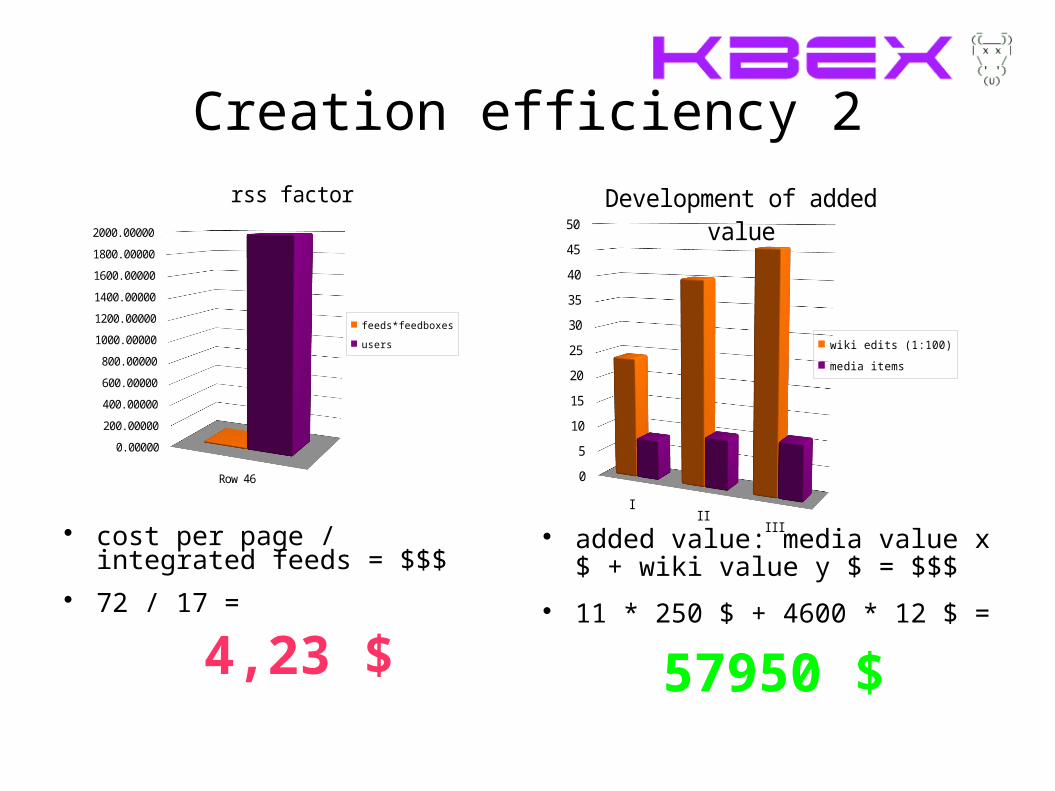
Creation efficiency 2
cost per page / integrated feeds = $$$
72 / 17 =
4,23 $
III
III
0
5
10
15
20
25
30
35
40
45
50
Development of added value
wiki edits (1:100)
media items
added value: media value x $ + wiki value y $ = $$$
11 * 250 $ + 4600 * 12 $ =
57950 $
Row 46
0.00000
200.00000
400.00000
600.00000
800.00000
1000.00000
1200.00000
1400.00000
1600.00000
1800.00000
2000.00000
rss factor
feeds*feedboxes
users
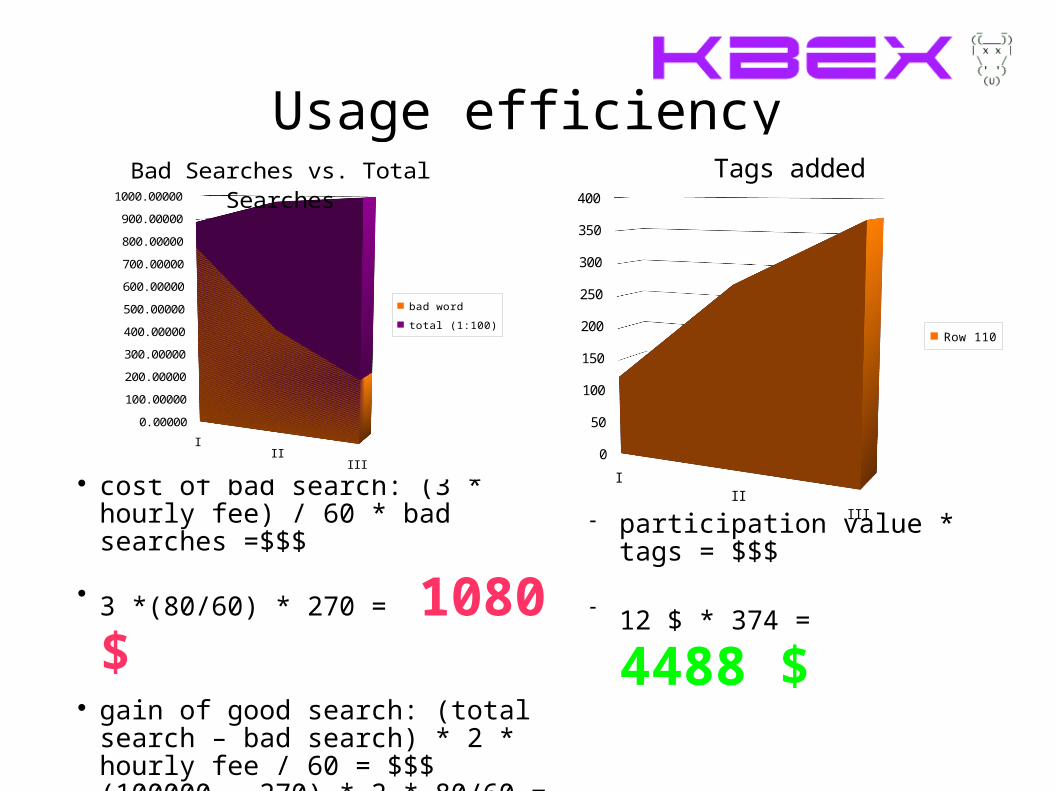
Usage efficiency
III
III
0
50
100
150
200
250
300
350
400
Tags added
Row 110
cost of bad search: (3 * hourly fee) / 60 * bad searches =$$$
3 *(80/60) * 270 = 1080 $
gain of good search: (total search – bad search) * 2 * hourly fee / 60 = $$$(100000 – 270) * 2 * 80/60 =
265964 $
III
III
0.00000
100.00000
200.00000
300.00000
400.00000
500.00000
600.00000
700.00000
800.00000
900.00000
1000.00000
Bad Searches vs. Total Searches
bad word
total (1:100)
participation value * tags = $$$
12 $ * 374 = 4488 $
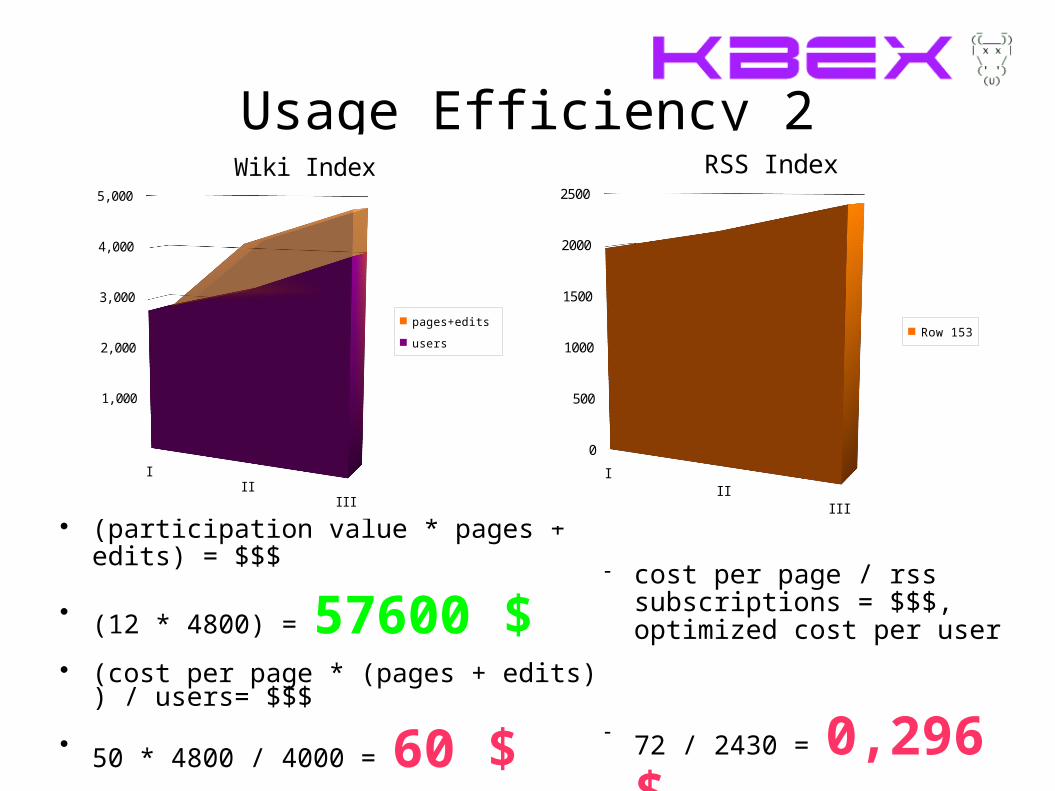
Usage Efficiency 2
(participation value * pages + edits) = $$$
(12 * 4800) = 57600 $
(cost per page * (pages + edits) ) / users= $$$
50 * 4800 / 4000 = 60 $
III
III
0
500
1000
1500
2000
2500
RSS Index
Row 153
III
III
1,000
2,000
3,000
4,000
5,000
Wiki Index
pages+edits
users
cost per page / rss subscriptions = $$$, optimized cost per user
72 / 2430 = 0,296 $

Satisfaction – Ease of Access
cost of browsing: (2 * hourly fee) / 60 * resultpages =$$$
2 * 80 / 60 * 0,15* 100000 =
40000 $ gain of result clicks: clicks * 2 *
hourly fee / 60 = $$$
2570 * 2 * 80/60 = 6853 $
III
III
0
5000
10000
15000
20000
25000
30000
35000
40000
Media Index
media consumed
media consumed >50%
III
III
0
0.5
1
1.5
2
2.5
3
3.5
4
Search Index
resultclicks (t)
resultpages(avg)
items consumed * x $ = $$$
37679 * 12 $ =
452148 $ items consumed > 50% *
3x = $$$ 16345 * 36 $ =
588420 $
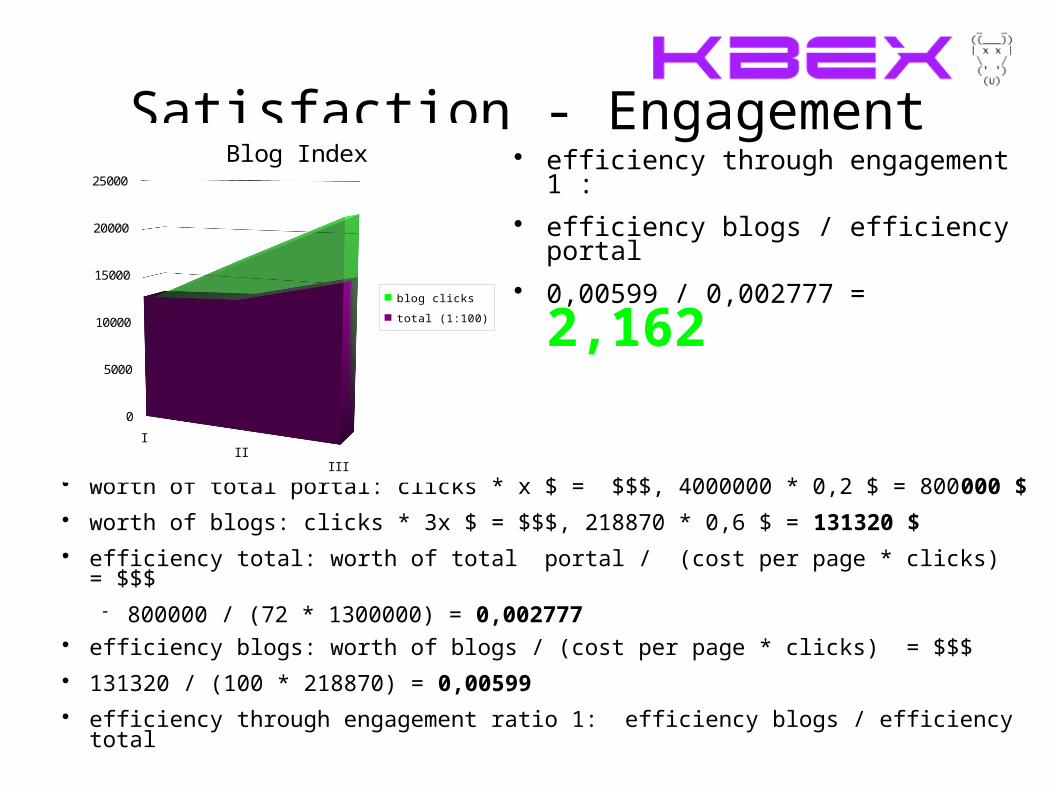
Satisfaction - Engagement
worth of total portal: clicks * x $ = $$$, 4000000 * 0,2 $ = 800000 $ worth of blogs: clicks * 3x $ = $$$, 218870 * 0,6 $ = 131320 $ efficiency total: worth of total portal / (cost per page * clicks) = $$$
800000 / (72 * 1300000) = 0,002777 efficiency blogs: worth of blogs / (cost per page * clicks) = $$$ 131320 / (100 * 218870) = 0,00599 efficiency through engagement ratio 1: efficiency blogs / efficiency
total
III
III
0
5000
10000
15000
20000
25000
Blog Index
blog clicks
total (1:100)
efficiency through engagement 1 : efficiency blogs / efficiency portal
0,00599 / 0,002777 = 2,162
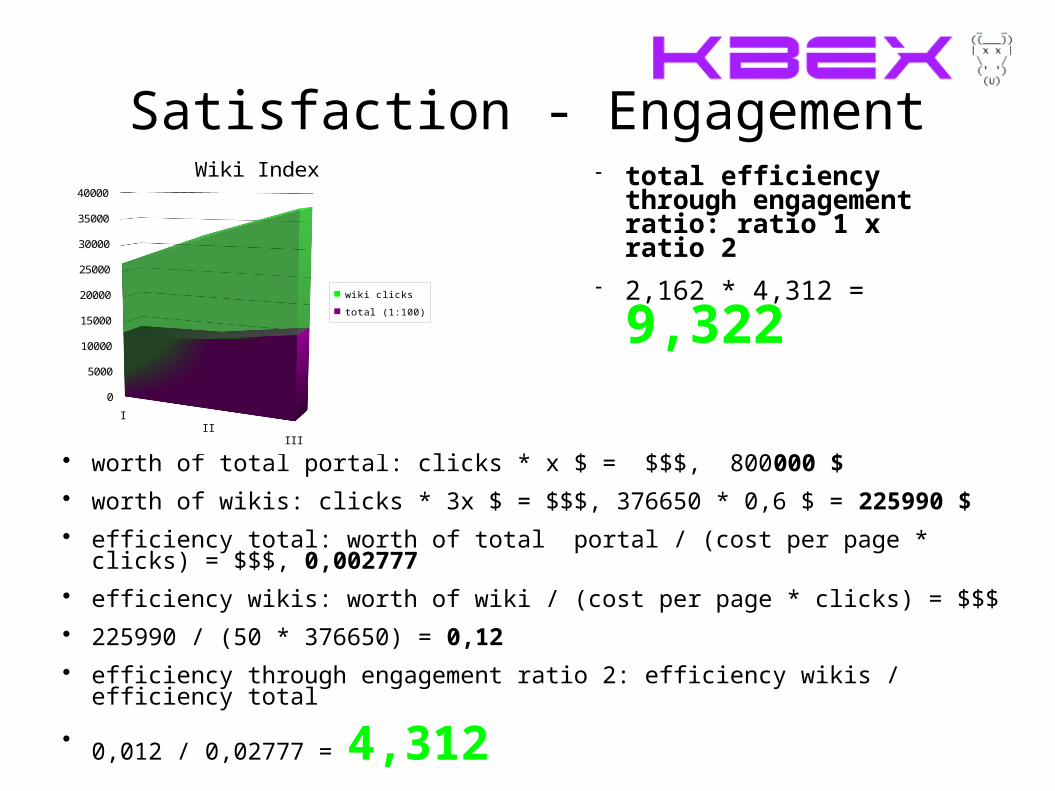
Satisfaction - Engagement
worth of total portal: clicks * x $ = $$$, 800000 $ worth of wikis: clicks * 3x $ = $$$, 376650 * 0,6 $ = 225990 $ efficiency total: worth of total portal / (cost per page * clicks) = $$
$, 0,002777 efficiency wikis: worth of wiki / (cost per page * clicks) = $$$ 225990 / (50 * 376650) = 0,12 efficiency through engagement ratio 2: efficiency wikis / efficiency
total
0,012 / 0,02777 = 4,312
III
III
0
5000
10000
15000
20000
25000
30000
35000
40000
Wiki Index
wiki clicks
total (1:100)
total efficiency through engagement ratio: ratio 1 x ratio 2
2,162 * 4,312 =
9,322
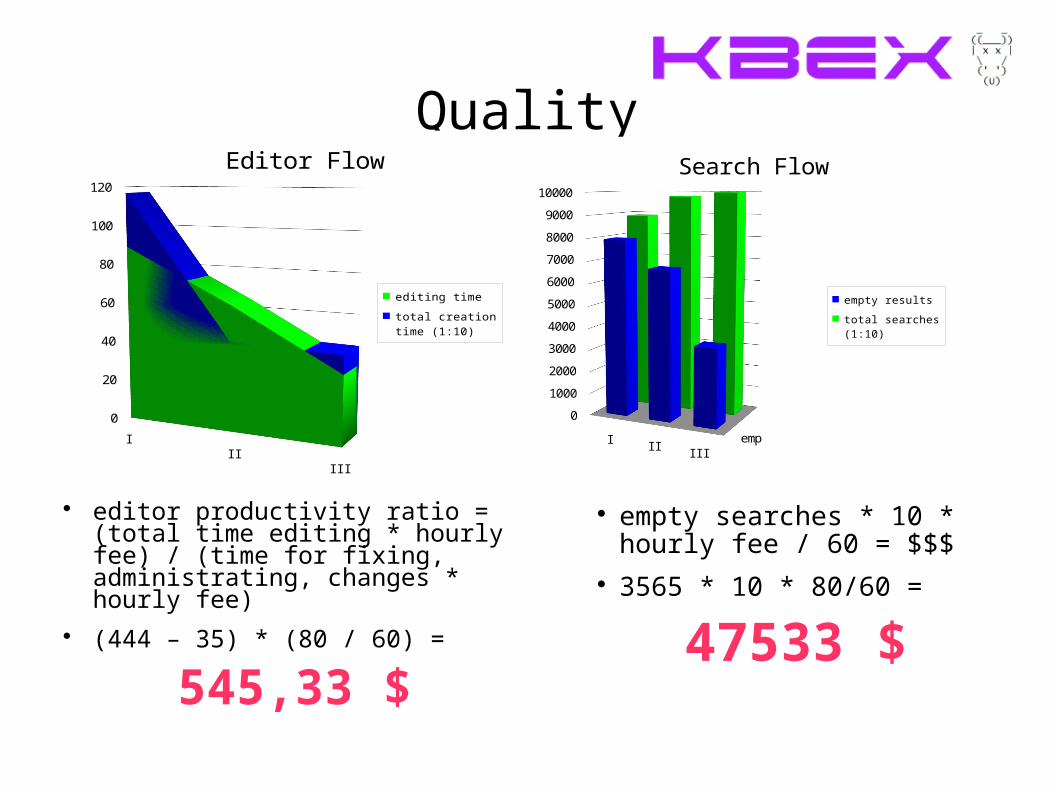
Quality
editor productivity ratio = (total time editing * hourly fee) / (time for fixing, administrating, changes * hourly fee)
(444 – 35) * (80 / 60) =
545,33 $
III
III
0
20
40
60
80
100
120
Editor Flow
editing time
total creation time (1:10)
III
III
0
1000
2000
3000
4000
5000
6000
7000
8000
9000
10000
empty re-sults
Search Flow
empty results
total searches (1:10)
empty searches * 10 * hourly fee / 60 = $$$
3565 * 10 * 80/60 =
47533 $
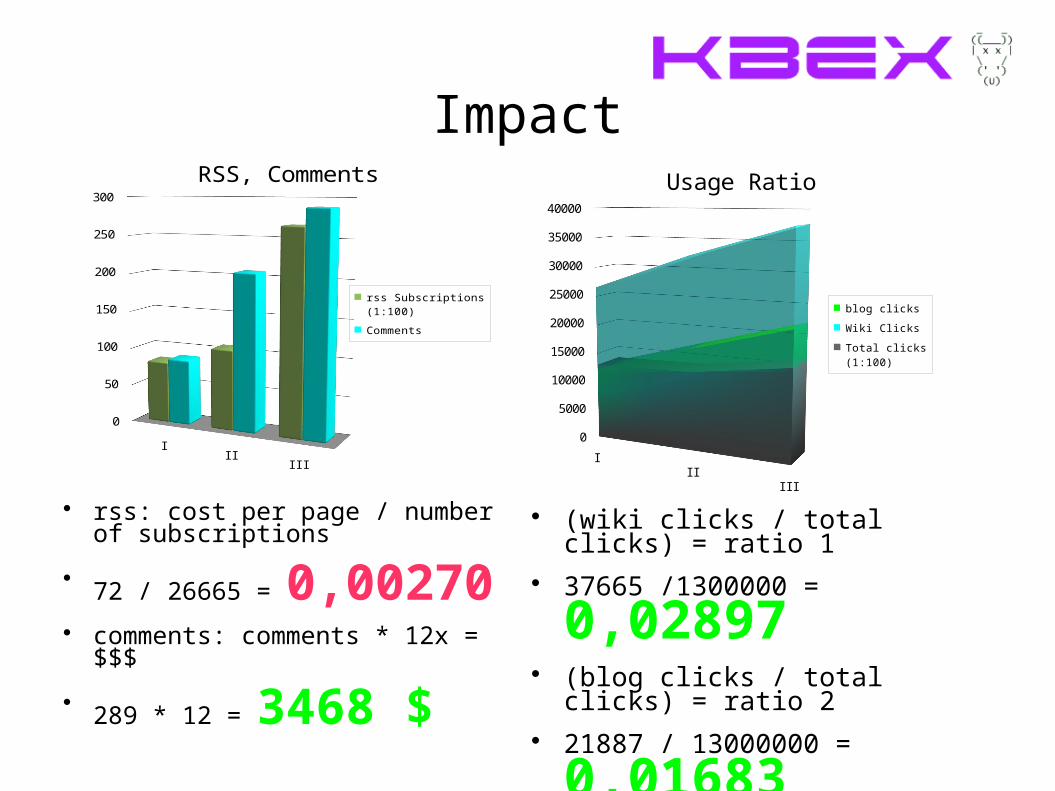
Impact
rss: cost per page / number of subscriptions
72 / 26665 = 0,00270
comments: comments * 12x = $$$
289 * 12 = 3468 $
III
III
0
50
100
150
200
250
300
RSS, Comments
rss Subscriptions (1:100)
Comments
III
III
0
5000
10000
15000
20000
25000
30000
35000
40000
Usage Ratio
blog clicks
Wiki Clicks
Total clicks (1:100)
(wiki clicks / total clicks) = ratio 1
37665 /1300000 =
0,02897 (blog clicks / total clicks) =
ratio 2 21887 / 13000000 =
0,01683
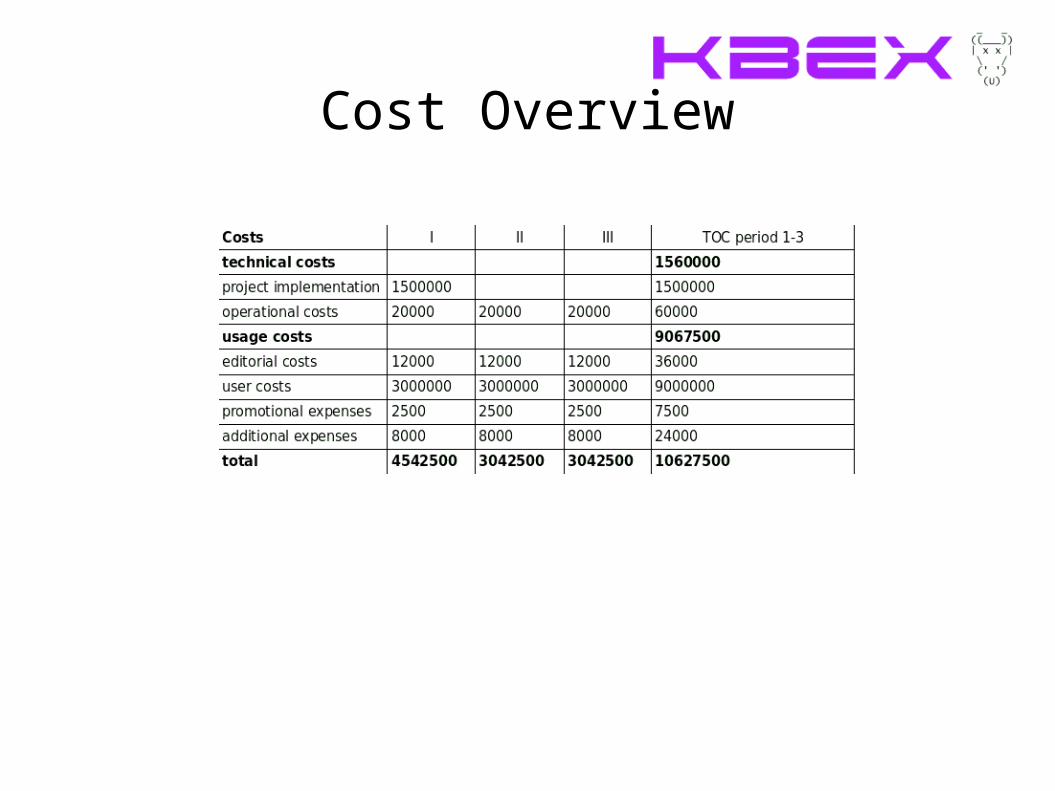
Cost Overview
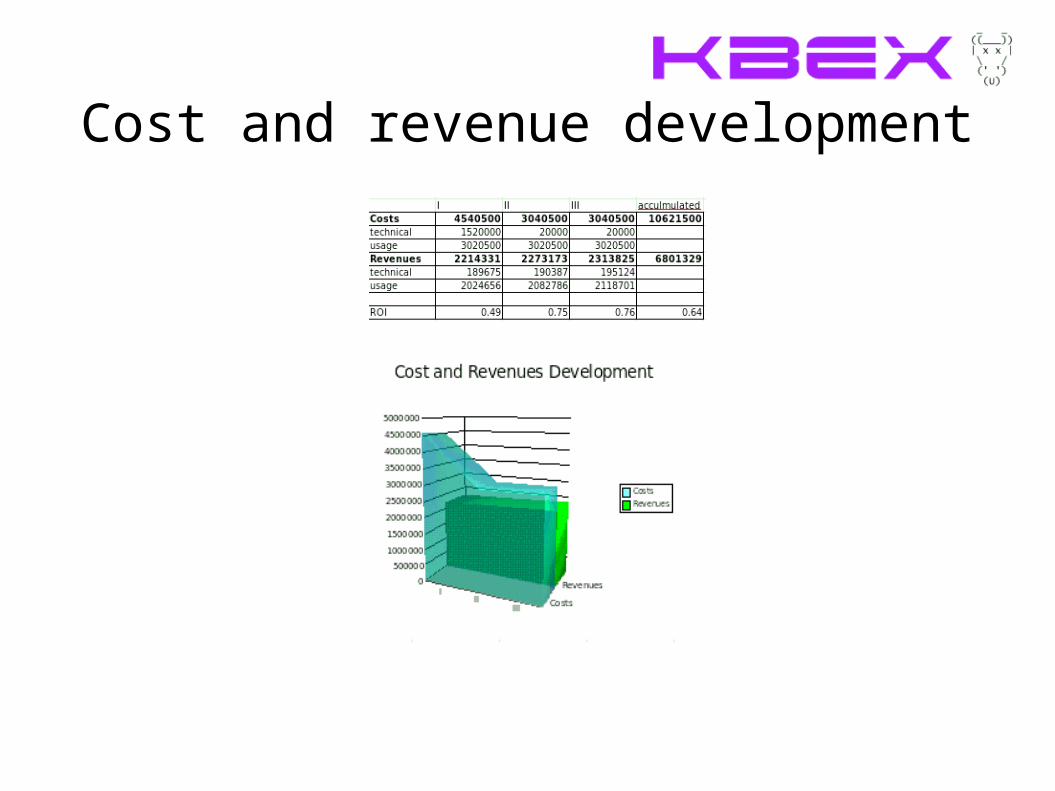
Cost and revenue development
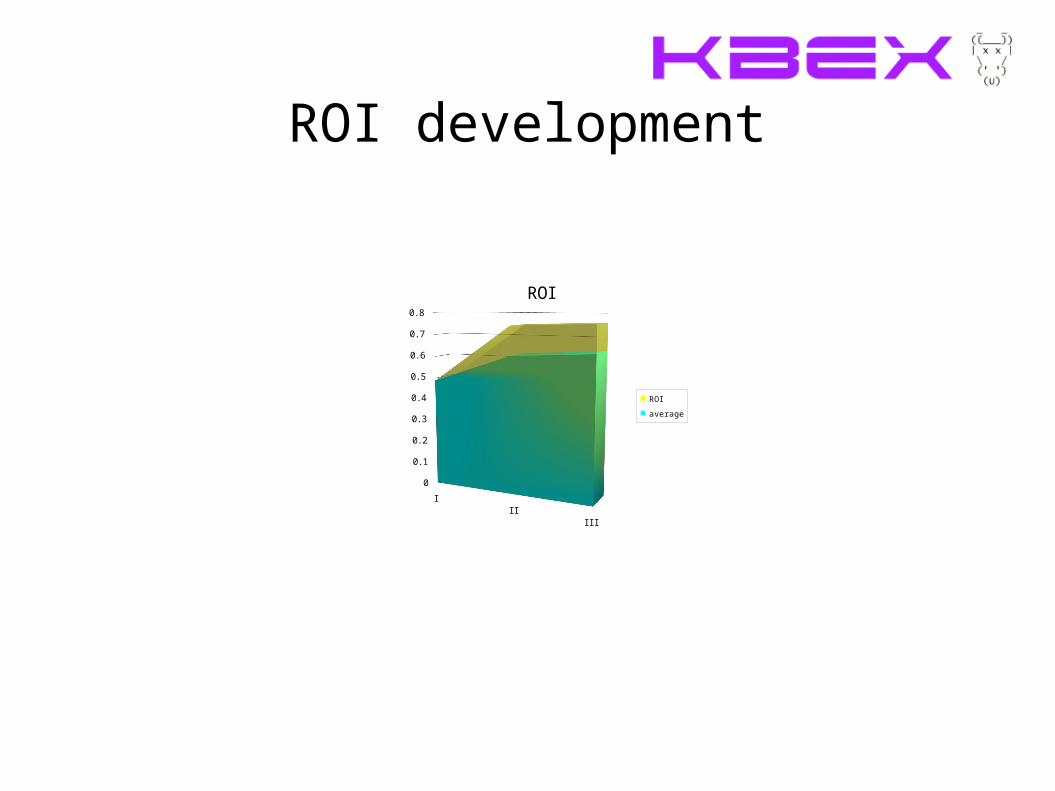
ROI development
III
III
0
0.1
0.2
0.3
0.4
0.5
0.6
0.7
0.8
ROI
ROI
average

Dashboard add your favorite charts or add all charts and cluster them or use the ROI chart only
...you know the details, how to handle them and how to control changes
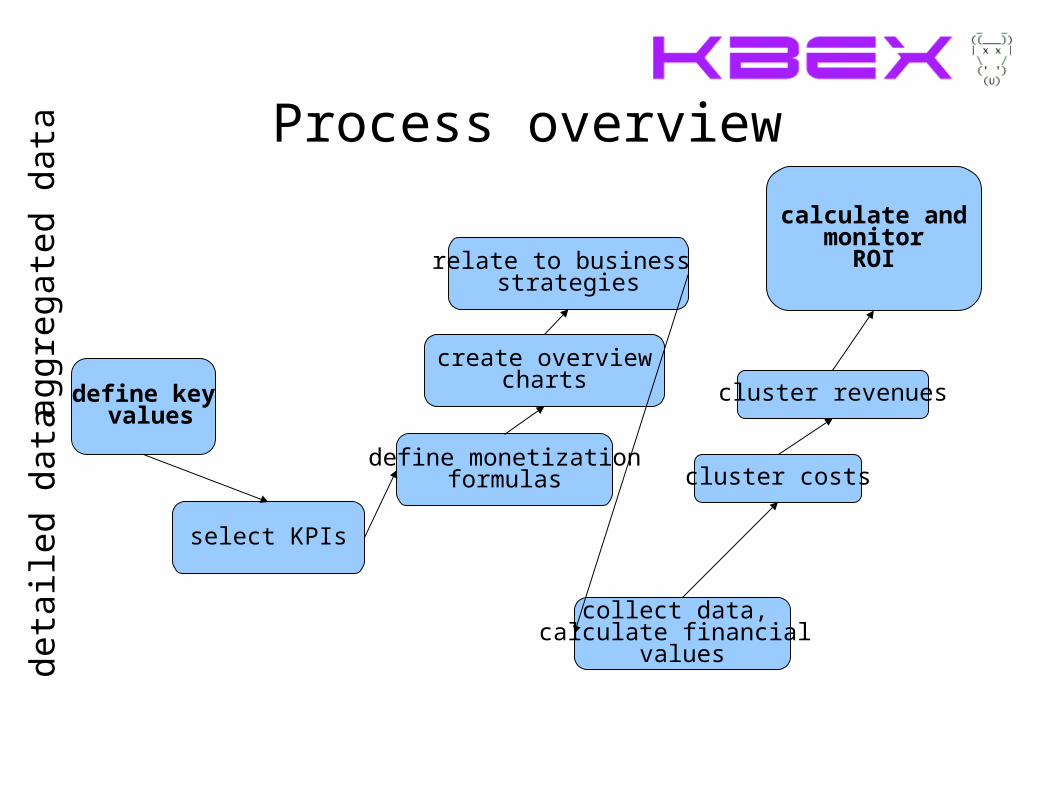
Process overview
relate to business strategies
define key values
select KPIs
define monetizationformulas
create overviewcharts
collect data, calculate financial
values
cluster costs
cluster revenues
calculate andmonitor
ROI
deta
iled
data
aggr
egat
ed d
ata

Read the full story kbex Blog deals with communication, collaboration and the
philosophy of media: ideas around intranets, internet, e commerce, social media, and online media in general. it serves as a best practise repository and sometimes reports from conferences
http://kbex.wordpress.com/tag/roi-dashboard/
Recommended