Cancer Chemother Pharmacol (2007) 60:713–723
DOI 10.1007/s00280-007-0417-8ORIGINAL ARTICLE
Role of NADPH cytochrome P450 reductase in activation of RH1
Asher Begleiter · Marsha K. Leith · Daywin Patel · Brian B. HasinoV
Received: 28 April 2006 / Accepted: 3 January 2007 / Published online: 26 January 2007© Springer-Verlag 2007
AbstractPurpose RH1 is a new bioreductive agent that is anexcellent substrate for the two-electron reducingenzyme, NAD(P)H quinone oxidoreductase 1 (NQO1).RH1 may be an eVective NQO1-directed antitumoragent for treatment of cancer cells having elevatedNQO1 activity. As some studies have indicated thatRH1 may also be a substrate for the one-electron reduc-ing enzyme, NADPH cytochrome P450 reductase (P450Red), P450 Red may contribute to the activation of RH1where NQO1 activities are low and P450 Red activitiesare high. The mean P450 Red activity in the humantumor cell line panel used by NCI for evaluation of newanticancer agents is 14.8 nmol min¡1 mg prot¡1, whilethe mean NQO1 activity in these cell lines is
199.5 nmol min¡1 mg prot¡1. Thus, we investigatedwhether P450 Red could play a role in activating RH1.Methods Reduction of RH1 by puriWed human P450Red was investigated using electron paramagnetic res-onance and spectroscopic assays. The ability of RH1 toproduce DNA damage following reduction by P450Red was studied using gel assays. To determine therole of P450 Red in activation of RH1 in cells, cellgrowth inhibition studies with inhibitors of P450 Redand NQO1 were carried out in T47D human breastcancer cells and T47D cells transfected with the humanP450 Red gene (T47D-P450) that have P450 Red activ-ities of 11.5 and 311.8 nmol min¡1 mg prot¡1, respec-tively.Results Reduction studies using puriWed P450 Redand NQO1 conWrmed that RH1 can be reduced byboth enzymes, but redox cycling was slower followingreduction by NQO1. RH1 produced DNA strandbreaks and crosslinks in isolated DNA after reduc-tion by either P450 Red or NQO1. DPIC, an inhibi-tor of P450 Red, had no eVect on cell growthinhibition by RH1 in T47D cells, and had only a smalleVect on cell growth inhibition by RH1 in the pres-ence of the NQO1 inhibitor, dicoumarol, in T47D-P450 cells.Conclusions These results demonstrated thatP450 Red does not contribute to the activation ofRH1 in cells with normal P450 Red activity and playsonly a minor role in activating this agent in cells withhigh levels of this enzyme. These studies conWrmedthat P450 Red could activate RH1 and provided theWrst direct evidence that RH1 could produce bothDNA strand breaks and DNA crosslinks after reduc-tion by P450 Red. However, the results strongly sug-gest that P450 Red does not play a signiWcant role in
Supported by grants from the National Cancer Institute of Canada with funds from the Canadian Cancer Society and the CancerCare Manitoba Foundation to A.B., by grants from the Canadian Institutes of Health Research to B.B.H. and by a Canada Research Chair in Drug Development to B.B.H.
A. Begleiter (&) · M. K. LeithManitoba Institute of Cell Biology, CancerCare Manitoba, Department of Internal Medicine, University of Manitoba, 675 McDermot Avenue, R3E 0V9 Winnipeg, MB, Canadae-mail: [email protected]
A. BegleiterManitoba Institute of Cell Biology, CancerCare Manitoba, Department of Pharmacology & Therapeutics, University of Manitoba, 675 McDermot Avenue, R3E 0V9 Winnipeg, MB, Canada
D. Patel · B. B. HasinoVFaculty of Pharmacy, University of Manitoba, R3T 2N2 Winnipeg, MB, Canada
123
714 Cancer Chemother Pharmacol (2007) 60:713–723
activating RH1 in cells with normal P450 Redactivity.
Keywords RH1 · NADPH cytochrome P450 reductase · Reduction · Activation
AbbreviationsRH1 2,5-Diaziridinyl-3-(hydroxymethyl)
-6-methyl-1,4-benzoquinoneP450 Red NADPH cytochrome P450 reductaseNQO1 NAD(P)H quinone oxidoreductase 1T47D-P450 T47D cells transfected with the
human NADPH cytochrome P450 reductase gene
EPR Electron paramagnetic resonanceDPIC Diphenyliodonium chlorideIC50 Concentration of drug that reduced the
relative absorbance fraction to 0.5
Introduction
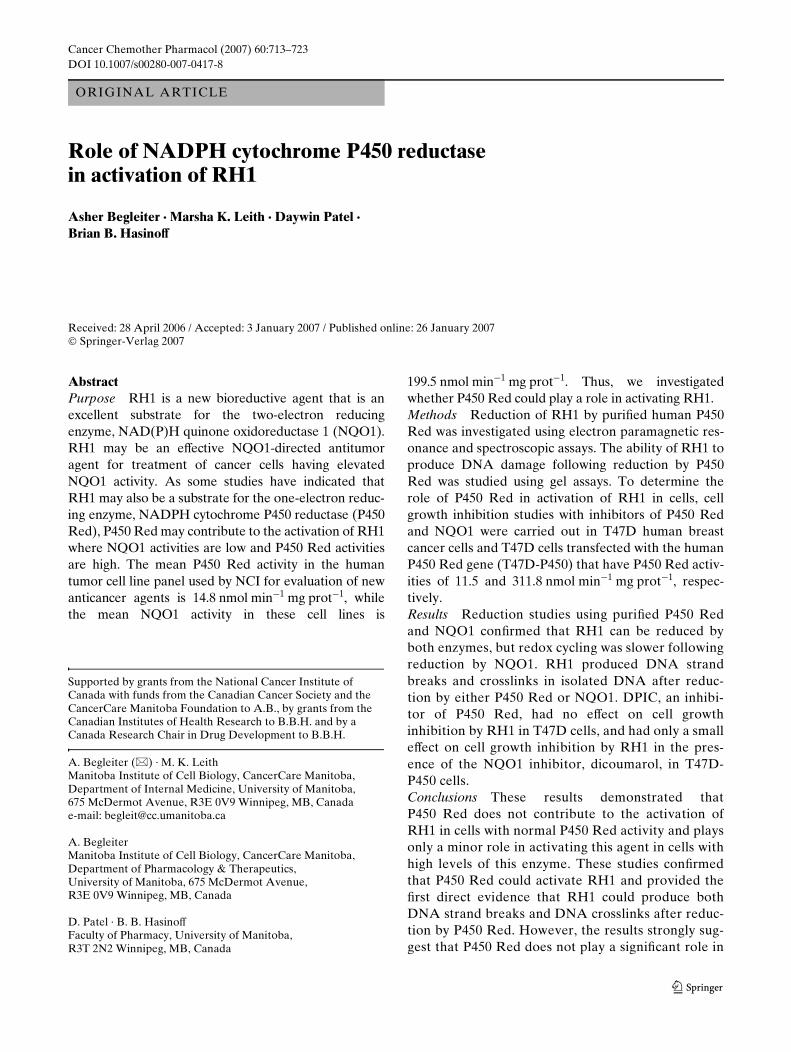
The bioreductive drug, 2,5-diaziridinyl-3-(hydroxym-ethyl)-6-methyl-1,4-benzoquinone (RH1) has demon-strated signiWcant antitumor activity in vitro [31, 37]and in vivo [7, 16]. Bioreductive agents are a class ofanticancer drugs that require activation by reductiveenzymes like the one-electron reducing enzyme,NADPH cytochrome P450 reductase (P450 Red) (EC1.6.2.4) [23, 28] or the two-electron reducing enzymeNAD(P)H quinone oxidoreductase 1 (NQO1; DT-diaphorase) (EC 1.6.99.2) [27, 29]. The relative con-tribution of these enzymes to the reductive activationof bioreductive agents is dependent on the drug,enzyme, oxygen level and pH [2, 13, 18, 27, 32]. RH1is a very eYcient substrate for NQO1 [37] and reduc-tion by NQO1 results in activation of the aziridinegroups and subsequent DNA alkylation with inter-strand cross-links formed preferentially at 5� GCC 3�
sequences [4, 7]. Because RH1 is a very good sub-strate for NQO1, this agent was considered ideal foruse in an enzyme-directed tumor targeting strategy totreat tumors, like non-small cell lung cancer, thathave high NQO1 activity [17]. RH1 is currently in aclinical trial [7].
Although RH1 is an excellent substrate for NQO1and this enzyme plays an important role in activatingthis agent [37, 38], Cenas [6, 20] showed that RH1could be a substrate for both NQO1 and P450 Red(Fig. 1). However, Kim [15] found no increase inRH1 activity in MDA-MB231 cells transfected withP450 Red compared with parent cells. MDA-MB231cells have no NQO1 activity due to an inactivating
NQO1 mutation. Tudor [36] studied the toxicity ofRH1 in the NCI’s 60 tumor cell line panel and foundthat although the sensitivity of RH1 was marked incell lines expressing NQO1, there was no correlationbetween RH1 cytotoxicity and NQO1 activity. Theyalso found a high sensitivity to RH1 in leukemia andlymphoma cell lines with low or absent NQO1expression. While studies suggest that NQO1 is themost important activating enzyme for RH1, there isevidence that P450 Red can activate this bioreduc-tive antitumor agent. Thus, it is possible that P450Red may contribute to the activation of RH1 in cir-cumstances where NQO1 activities are low and P450Red activities are high. P450 Red activities in thehuman tumor cell line panel used by NCI for evalua-tion of new anticancer agents range from approxi-mately 2.5–63 nmol min¡1 mg prot¡1 with a mean of14.8 nmol min¡1 mg prot¡1, while NQO1 activities inthese cell lines range from approximately 0–5,000nmol min¡1 mg prot¡1 with a mean of 199.5 nmolmin¡1mg prot¡1 [9]. Furthermore, DNA damage pro-duced by RH1 following reduction by P450 Red hasnot been studied in detail. In this study we investi-gated the reduction of RH1 by P450 Red and its rolein the DNA damaging activities and cell growthinhibition of RH1.
Materials and methods
Materials
RH1 was obtained from Professor David Ross (Uni-versity of Colorado Health Sciences Center, Denver,CO, USA). Streptonigin was obtained from Sigma (St.Louis, MO, USA) and tirapazamine was prepared asdescribed previously [30]. T47D human breast cancercells and T47D cells transfected with the human P450Red gene, (T47D-P450) were obtained from ProfessorIan Stratford (University of Manchester, Manchester,UK). Both cell lines were grown in 10% FBS in HamsF12:DMEM 1:1 media and the T47D-P450 cells weregrown in the presence of puromycin. PuriWed humanP450 Red was purchased from BD Biosciences (SanJose, CA, USA), pBR322 plasmid DNA was from NewEngland Biolabs (Pickering, ON, Canada) and humanNQO1 was provided by Dr. Sushu Pan (University ofPittsburgh, Pittsburgh, PA, USA).
Electron paramagnetic resonance (EPR) studies
A freshly prepared 15:l aliquot of the drug in thereaction mixture (10 mM RH1, 2 mM NADPH,
123

Cancer Chemother Pharmacol (2007) 60:713–723 715
16 �g prot ml¡1 P450 Red in 50 mM Tris buVer at pH7.4 containing 10% DMSO for P450 Red; or 1 mMRH1, 97:M FAD, 0.4 mM NADH, 0.0005% Tween 20,1.1 g prot ml¡1 NQO1 in 0.5 mM Tris buVer at pH 7.4containing 1% DMSO for NQO1) was injected into an8 cm length of gas-permeable TeXon tubing (ZeusIndustrial Products, Raritan, NJ, USA) which was thenfolded at both ends, inserted into a quartz EPR tubeopen at both ends and placed in the EPR cavity as pre-viously described [1, 12]. The EPR spectra wererecorded with a Bruker (Milton, Canada) EMX EPRspectrometer. Pre-puriWed grade thermostated (37°C)argon (400 l h¡1) or air as indicated was Xowed contin-uously over the sample while the spectra wererecorded. Recording of the Wrst-derivative EPR spec-tra was started approximately 2 min after the samplewas prepared. A total of 10 spectra (42 s/scan) wererecorded over 7 min and their signals were averaged.For recording of the spectra the instrument settingswere: microwave power 20 mW, modulation frequency100 kHz, microwave frequency 9.24 GHz, modulationamplitude 2.0 G, time constant 0.02 s, gain 20,000,1,024 data points/scan, magnetic Weld centered at3315 G, and a 50 G scan range.
Reduction studies
BuVers (0.05 M phosphate pH 7.8 for P450 Red or0.05 M Tris pH 7.4 for NQO1) were pre-incubated inrubber septum-sealed Starna cuvettes (Starna Cells,Atascadero, CA, USA) with 100% nitrogen or air bub-bled into the buVer via 2�� 20 gauge needles for 2 h.RH1 (50 �M Wnal concentration), NADPH (200 �MWnal concentration) and enzyme (1.2 �g prot ml¡1 Wnalconcentration for P450 Red or 0.22 �g prot ml¡1 Wnalconcentration for NQO1) were added via a gas-tightsyringe and the cuvettes were transferred to the spec-trophotometer. Reductions were monitored using thescanning kinetics module in a Varian Cary 1 (Mississa-uga, ON, Canada) spectrophotometer and kineticscontinuums at 370 nm were calculated [20].
DNA strand breaks
Reaction mixtures in buVers (0.05 M phosphate pH 7.8for P450 Red or 0.05 M Tris pH 7.4 for NQO1) wereRH1 (50 �M), NADPH (4 mM), pBR322 plasmidDNA and enzyme (4.8 �g prot ml¡1 for P450 Red or0.88 �g prot ml¡1 for NQO1). Following a 2 h incuba-tion in air, the reactions were terminated by addition of1 mM diphenyliodonium chloride (DPIC) (to inhibitP450 Red) or 10 �M dicoumarol (to inhibit NQO1).DNA strand breaks were determined using a modiWca-tion of a gel-based assay we have used previously [10].BrieXy, following isolation of the DNA by centrifuga-tion, the DNA pellets were dissolved in 15 �l loadingdye (30% sucrose in 10 mM Tris–HCl (pH 8)-1 mMEDTA) and were then run on a 1% agarose gel with noethidium bromide for 45 min at 75 V. DNA strandbreaks are presented as the amount of relaxed DNA asa percent of the total DNA. All values were correctedfor a background level of strand breaks in the plasmidDNA of approximately 15%. Control experimentscontaining RH1 but no P450 Red or NQO1 producedno DNA stand breaks above the background.
Similar experiments were carried out under hypoxicconditions in a hypoxia chamber (Forma ScientiWcAnaerobic System, Model 1025, Fisher ScientiWc, Win-nipeg, Canada) maintained under 95% nitrogen:5%carbon dioxide. Reaction buVers were incubated in thehypoxia chamber for 5 days prior to the initiation ofthe reaction. All other reagents were incubated in thehypoxia chamber for 0.5 h prior to initiation of thereaction. Following 2 h incubation in the hypoxiachamber, the reactions were terminated by addition of1 mM DPIC (to inhibit P450 Red) or 10 �M dicouma-rol (to inhibit NQO1). DNA strand break formationwas analyzed as described above.
Fig. 1 Structure and reduction pathways for RH1
O
O
N
N
CH3
OH
RH1
O
O
O .
O
1e- 1e-
O2 O2
2e-
OH
OH
NQO1
P450 Red P450 Red
O2. O2
.- -
-
123

716 Cancer Chemother Pharmacol (2007) 60:713–723
DNA crosslinking
Reaction mixtures in cell free buVers (0.05 M phosphatepH 7.8 for P450 Red or 0.05 M Tris pH 7.4 for NQO1)were RH1 (100 �M), NADPH (400 �M), linearized 32Pend-labeled pBR322 DNA and enzyme (1.2 �g prot ml¡1
for P450 Red or 0.22 �g prot ml¡1 for NQO1). BuVerswere gassed with 100% nitrogen for 1 h prior to additionof the other reaction mixture components. Following45 min incubation under hypoxic conditions, the reac-tions were terminated by addition of 1 mM DPIC (toinhibit P450 Red) or 10 �M dicoumarol (to inhibitNQO1). DNA crosslinks were determined using a modi-Wcation of a gel-based assay we have used previously [10].BrieXy, following isolation of the DNA by centrifugation,the DNA pellets were dissolved in 20 �l strand separa-tion loading dye (35% DMSO, 1 mM Na2EDTA pH 7,10 mM Tris pH 7, 0.05% bromophenol blue, 0.05%xylene cyanol). DNA strand separation consisted of incu-bation of the DNA in a 70°C water bath for 3 min, fol-lowed by immediate cooling in an ice-water bath for30 min. The DNA was then run on a 1% agarose gel withno ethidium bromide for 45 min at 75 V. DNA crosslinksare presented as the amount of double stranded DNA asa percent of total DNA. Control experiments containingRH1 but no P450 Red or NQO1 produced no DNAcrosslinks.
Enzymatic assays
P450 Red activities in cells were determined in cell soni-cates using a standard method [33] with the addition ofpotassium cyanide [25]. P450 Red activity is reported asnmol cytochrome c reduced per minute per milligram ofprotein. NQO1 activities in cells were determined in cellsonicates as previously described [3]. NQO1 activity isreported as nmol 2,6-dichlorophenolindophenolreduced per minute per milligram of protein.
Cell growth inhibition
Cells under aerobic conditions were treated withbuVer, 0.1 mM DPIC alone, 0.2 mM dicoumarol aloneor 0.1 mM DPIC and 0.2 mM dicoumarol for 1 h andthen with varying concentrations of RH1, streptonigrinor tirapazamine for an additional 1 h in the presence ofthe inhibitors. Cell growth inhibition was determinedby MTT assay [14] and is presented as the relativeabsorbance calculated from the ratio of the absorbancefrom drug treated cells to absorbance from untreatedcells. IC50 values were deWned as the concentration ofdrug that reduced the relative absorbance to 0.5 asdetermined from the linear regression lines of RH1
dose versus the logarithm of the relative absorbancecurves. The cell growth inhibition activities were com-pared statistically using a t test comparing the signiW-cance of the diVerence of the slopes of the dose versusthe logarithm of the relative absorbance curves.
Results
EPR studies
Formation of RH1 semiquinone free radical followingreduction by P450 Red or NQO1 was monitored byEPR. Reduction of RH1 by P450 Red under hypoxicconditions resulted in a semiquinone free radical EPRsignal at g » 2.0 due to the RH1 semiquinone (Fig. 2a),
Fig. 2 EPR spectra following reduction of RH1 by P450 Red orNQO1. A freshly prepared aliquot of RH1 in the reaction mixturecontaining P450 Red or NQO1 was injected into an 8 cm length ofgas-permeable TeXon which was then folded at both ends, insertedinto a quartz EPR tube open at both ends and placed in the EPRcavity. The EPR spectra were recorded with a Bruker EMX EPRspectrometer. Argon or air as indicated was Xowed continuouslyover the sample while the spectra were recorded. Recording of theWrst-derivative EPR spectra was started approximately 2 min afterthe sample was prepared. A total of 10 spectra (42 s/scan) were re-corded over 7 min and their signals were averaged
123

Cancer Chemother Pharmacol (2007) 60:713–723 717
which decreased to a very weak signal when air wasintroduced into the reaction tube (Fig. 2b). Reduction ofRH1 by NQO1 under hypoxic conditions produced asmall EPR signal characteristic of the RH1 semiquinonefree radical (Fig. 2d). As shown in Fig. 2e this weak sem-iquinone signal was decreased only slightly after theintroduction of air. In control experiments, no signiWcantEPR semiquinone signals were seen under hypoxia withRH1 in the absence of P450 Red or NQO1 (Fig. 2c, f).
Reduction of RH1 by P450 Red and NQO1
Reduction of RH1 by P450 Red or NQO1 under hyp-oxic and aerobic conditions was monitored by spectro-scopic scans at various times. RH1 has an absorbancemaximum at 326 nm while NADPH, which was used asthe electron donor for P450 Red and NQO1, has anabsorbance maximum at 340 nm. In all experiments 4equivalents of NADPH were used for each equivalentof RH1. The starting reaction mixture showed a singlepeak with a maximum at 331 nm resulting from absor-bance by both RH1 and NADPH. Reduction was mon-itored by following the loss of absorbance at 370 nm,where approximately 90% of the absorbance is due toNADPH (Fig. 3). Loss of NADPH was determinedfrom the loss of absorbance after correction for RH1and background absorbance.
For reduction by P450 Red under hypoxic condi-tions (Fig. 4a), there was a loss of approximately oneequivalent of NADPH in the Wrst 4 min with little fur-ther loss of NADPH after that time. In contrast, underaerobic conditions there was a loss of >90% of theNADPH by 20 min.
For reduction by NQO1 (Fig. 4b) under hypoxicconditions there was a loss of approximately one equiv-alent of NADPH in the Wrst 2 min with little furtherloss of NADPH after that time. In contrast, under aer-obic conditions there was a loss of approximately oneequivalent of NADPH in the Wrst 2 min, and this wasfollowed by a slower loss of NADPH to <10% of theoriginal level over an additional 40 min.
DNA strand break and DNA crosslink formation
To measure the formation of DNA strand breaks byRH1 following reduction by P450 Red or NQO1, RH1,
Fig. 3 UV/Visible spectra of RH1 and NADPH. Spectra of RH1(50 �M), NADPH (200 �M) or a mixture of RH1 (50 �M) andNADPH (200 �M) in buVer were obtained using a Varian Cary 1spectrophotometer
Fig. 4 Reduction of RH1 by P450 Red and NQO1. a For reduc-tion by P450 Red, 0.05 M phosphate buVer pH 7.8 was pre-incu-bated in rubber septum-sealed Starna cuvettes with 100%nitrogen or air bubbled into the buVer via 2�� 20 gauge needles for2 h. RH1 (50 �M), NADPH (200 �M) and P450 Red(1.2 �g prot ml¡1) were added via a gas-tight syringe and the cu-vettes were transferred to the spectrophotometer. b For reduc-tion by NQO1 0.05 M Tris buVer pH 7.4 was pre-incubated inrubber septum-sealed Starna cuvettes with 100% nitrogen or airbubbled into the buVer via 2�� 20 gauge needles for 2 h. RH1(50 �M), NADPH (200 �M) and NQO1 (0.22 �g prot ml¡1) wereadded via a gas-tight syringe and the cuvettes were transferred tothe spectrophotometer. Reductions were monitored using thescanning kinetics module in a Varian Cary 1 spectrophotometerand kinetics continuums at 370 nm were calculated
123

718 Cancer Chemother Pharmacol (2007) 60:713–723
NADPH and enzyme were incubated in air or underhypoxia in the presence of pBR322 plasmid DNA for2 h. DNA strand breaks were measured by a gel assay[10]. Reduction of RH1 by P450 Red in air resulted in52.8 § 9.2% of the DNA having strand breaks, andreduction by NQO1 in air resulted in 68.1 § 5.9% ofthe DNA having strand breaks (Table 1). RH1 did notproduce any DNA strand breaks in the absence ofP450 Red or NQO1. Under hypoxia, reduction of RH1by P450 Red resulted in a signiWcantly lower level ofDNA strand breaks compared with reduction by P450Red in air, 25.3 § 3.6% (P < 0.008), and reduction byNQO1 under hypoxia also resulted in a signiWcantlylower level of DNA strand breaks compared withreduction by NQO1 in air, 26.4 § 4.9% (P < 0.001)(Table 1).
To measure the formation of DNA crosslinks byRH1 following reduction by P450 Red or NQO1 RH1,NADPH and enzyme were incubated under hypoxia inthe presence of linearized pBR322 plasmid DNA for45 min. DNA crosslinks were measured by a gel assay[10]. Reduction of RH1 by P450 Red resulted in22.9 § 8.3% of the DNA having crosslinks, and reduc-tion by NQO1 resulted in 30.2 § 6.5% of the DNAhaving crosslinks (Table 1). RH1 did not produce anyDNA crosslinks in the absence of P450 Red or NQO1.
EVect of inhibitors on P450 Red and NQO1 activities in T47D and T47D-P450 cells
To determine the eVect of DPIC on P450 Red andNQO1 activity, T47D, human breast cancer cells, orT47D-P450 cells (T47D cells stably transfected withthe human P450 Red gene) were incubated without, orwith, 0.1 mM DPIC for 1 or 2 h and P450 Red andNQO1 activities were measured. The level of P450 Red
activity was 11.5 § 1.5 nmol min¡1 mg prot¡1 in T47Dcells and 311.8 § 8.7 nmol min¡1 mg prot¡1 in T47D-P450 cells (Fig. 5). Incubation with DPIC for 1 h sig-niWcantly decreased the levels of P450 Red activity to0.7 § 0.2 nmol min¡1 mg prot¡1 in T47D cells and19.8 § 3.1 nmol min¡1 mg prot¡1 in T47D-P450 cells,and these P450 Red activities were similar when thecells were incubated with DPIC for 2 h (Fig. 5). NQO1activities in T47D and T47D-P450 cells were80.1 § 29.4 and 66.8 § 13.0 nmol min¡1 mg prot¡1,respectively. DPIC did not signiWcantly inhibit NQO1activity in either cell line.
To determine the eVect of dicoumarol on P450 Redand NQO1 activity, T47D, human breast cancer cells
Table 1 DNA strand breaks and crosslinks produced by RH1 af-ter reduction by P450 Red or NQO1
P450 Red or NQO1, RH1, NADPH and enzyme were incubatedin air or under hypoxia in the presence of pBR322 plasmid DNAfor 2 h for measurement of DNA strand breaks. P450 Red orNQO1, RH1, NADPH and enzyme were incubated under hy-poxia in the presence of linearized pBR322 plasmid DNA for45 min for measurement of DNA crosslinks. DNA strand breaksand crosslinks were measured by gel assays [10]. The values rep-resent the mean § SE
N, number of determinationsa SigniWcantly diVerent from % DNA strand breaks after reduc-tion by P450 Red in air (P < 0.008)b SigniWcantly diVerent from % DNA strand breaks after reduc-tion by NQO1 in air (P < 0.001)
P450 Red NQO1
Air% DNA strand breaks (N) 52.8 § 9.2 (9) 68.1 § 5.9 (7)
Hypoxia% DNA strand breaks (N) 25.3 § 3.6 (11)a 26.4 § 4.9 (10)b
Hypoxia% DNA crosslinks (N) 22.9 § 8.4 (8) 30.2 § 6.5 (12)
Fig. 5 Inhibition of P450 Red activity by DPIC in T47D and T47D-P450 cells. T47D or T47D-P450 cells were incubated without DPIC, or with 0.1 mM DPIC for 1 or 2 h. P450 Red activity was measured [25, 33] and is re-ported as nmol cytochrome c reduced per min per milligram of protein. The bars represent the mean § SE of three or four determinations
123
Cancer Chemother Pharmacol (2007) 60:713–723 719
or T47D-P450 were incubated without, or with, 0.2 mMdicoumarol for 1 h and then with 1 mM or 100 �M tira-pazamine, respectively, or 30 or 15 nM streptonigrin,respectively, for an additional 1 h in the presence of theinhibitor. Cell growth inhibition was determined byMTT assay. The relative absorbance with 1 mM tira-pazamine in T47D cells was 0.73 § 0.05 in the absenceof dicoumarol and 0.65 § 0.02 in the presence of dic-oumarol and these values were not signiWcantly diVer-ent. The relative absorbance with 100 �M tirapazaminein T47D-P450 cells was 0.69 § 0.06 in the absence ofdicoumarol and 0.49 § 0.09 in the presence of dic-oumarol and these values were not signiWcantly diVer-ent. In contrast, the relative absorbance with 30 nMstreptonigrin in T47D cells was 0.44 § 0.047 in theabsence of dicoumarol and 0.96 § 0.03 in the presenceof dicoumarol and these values were signiWcantlydiVerent (P < 0.001). The relative absorbance with15 nM streptonigrin in T47D-P450 cells was 0.25 § 0.06in the absence of dicoumarol and 0.63 § 0.03 in thepresence of dicoumarol and these values were signiW-cantly diVerent (P < 0.001). These results represent themean § SE of 3–6 determinations.
Cell growth inhibition by RH1
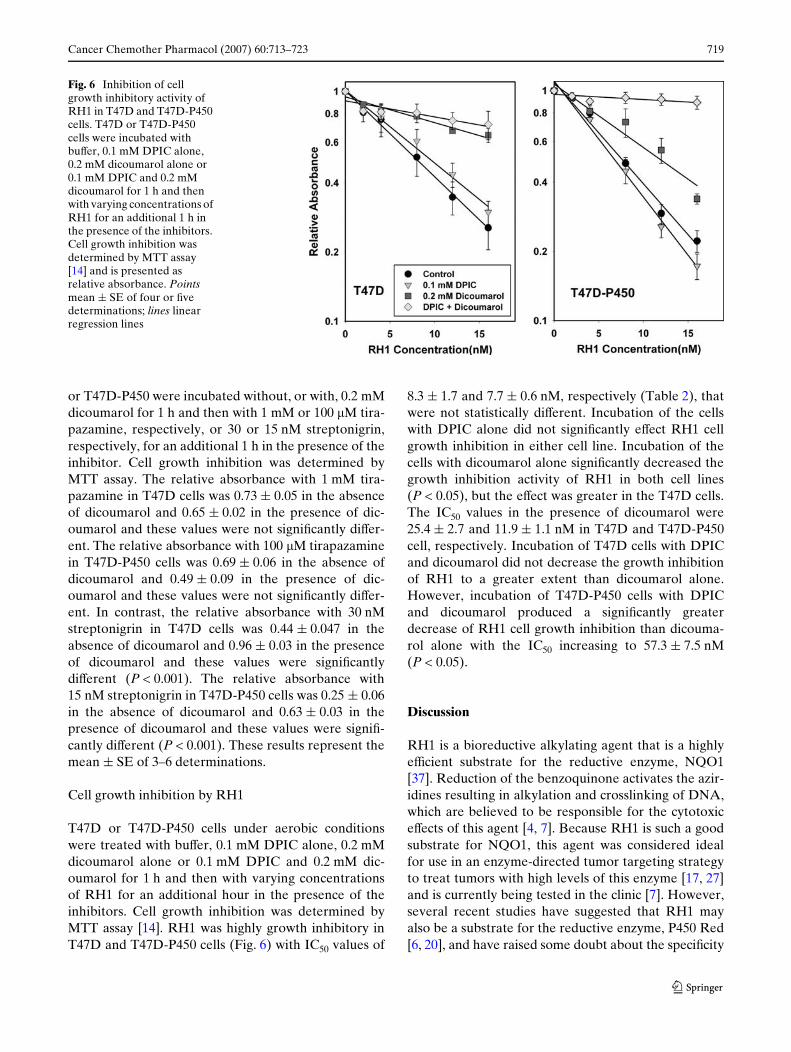
T47D or T47D-P450 cells under aerobic conditionswere treated with buVer, 0.1 mM DPIC alone, 0.2 mMdicoumarol alone or 0.1 mM DPIC and 0.2 mM dic-oumarol for 1 h and then with varying concentrationsof RH1 for an additional hour in the presence of theinhibitors. Cell growth inhibition was determined byMTT assay [14]. RH1 was highly growth inhibitory inT47D and T47D-P450 cells (Fig. 6) with IC50 values of
8.3 § 1.7 and 7.7 § 0.6 nM, respectively (Table 2), thatwere not statistically diVerent. Incubation of the cellswith DPIC alone did not signiWcantly eVect RH1 cellgrowth inhibition in either cell line. Incubation of thecells with dicoumarol alone signiWcantly decreased thegrowth inhibition activity of RH1 in both cell lines(P < 0.05), but the eVect was greater in the T47D cells.The IC50 values in the presence of dicoumarol were25.4 § 2.7 and 11.9 § 1.1 nM in T47D and T47D-P450cell, respectively. Incubation of T47D cells with DPICand dicoumarol did not decrease the growth inhibitionof RH1 to a greater extent than dicoumarol alone.However, incubation of T47D-P450 cells with DPICand dicoumarol produced a signiWcantly greaterdecrease of RH1 cell growth inhibition than dicouma-rol alone with the IC50 increasing to 57.3 § 7.5 nM(P < 0.05).
Discussion
RH1 is a bioreductive alkylating agent that is a highlyeYcient substrate for the reductive enzyme, NQO1[37]. Reduction of the benzoquinone activates the azir-idines resulting in alkylation and crosslinking of DNA,which are believed to be responsible for the cytotoxiceVects of this agent [4, 7]. Because RH1 is such a goodsubstrate for NQO1, this agent was considered idealfor use in an enzyme-directed tumor targeting strategyto treat tumors with high levels of this enzyme [17, 27]and is currently being tested in the clinic [7]. However,several recent studies have suggested that RH1 mayalso be a substrate for the reductive enzyme, P450 Red[6, 20], and have raised some doubt about the speciWcity
Fig. 6 Inhibition of cell growth inhibitory activity of RH1 in T47D and T47D-P450 cells. T47D or T47D-P450 cells were incubated with buVer, 0.1 mM DPIC alone, 0.2 mM dicoumarol alone or 0.1 mM DPIC and 0.2 mM dicoumarol for 1 h and then with varying concentrations of RH1 for an additional 1 h in the presence of the inhibitors. Cell growth inhibition was determined by MTT assay [14] and is presented as relative absorbance. Points mean § SE of four or Wve determinations; lines linear regression lines
123
720 Cancer Chemother Pharmacol (2007) 60:713–723
of RH1 activation by NQO1. Therefore, we examinedthe ability of P450 Red to reduce RH1 and the contri-bution of this enzyme to the activation of RH1 inhuman cancer cells.
To determine if RH1 is a substrate for P450 Red weused EPR studies to measure formation of an RH1semiquinone free radical following reduction by thisenzyme. Since P450 Red is a one-electron reducingenzyme, transfer of a single electron to RH1 shouldresult in the formation of a semiquinone free radical(Fig. 1). This has been demonstrated previously forother quinones [26]. Reduction of RH1 by P450 Redunder hypoxia produced an EPR signal within 10 min,due to the RH1 semiquinone free radical (Fig. 2a).When air was introduced into the reaction tube, thissignal rapidly decreased to about 10% of its hypoxiclevel likely as a result of re-oxidation of the semiqui-none (Fig. 2b). The formation of equilibrium concen-trations of semiquinones under aerobic conditionshave been reported [39]. This may be due to the qui-none undergoing a hydrolytic reduction to produce thehydroquinone (or its corresponding anion) or thathydroquinone is a contaminant [39]. The quinone andthe hydroquinone may then undergo an equilibriumdisproportionation reaction (Q + QH2 ô 2Q•- + 2H+)to yield low steady state levels of the semiquinone [22,35]. In the case of RH1 in the presence of P450 Redthere may also have been some formation of hydroqui-none by further reduction of the semiquinone by P450Red and subsequent disproportionation.
NQO1 is an obligate two-electron reducing enzymethat reduces quinones directly to hydroquinones
(Fig. 1). Thus, reduction of RH1 by NQO1 shouldresult in direct formation of a hydroquinone, withoutintermediate formation of a semiquinone. When RH1was reduced with NQO1 under hypoxia, a small EPRsignal characteristic of the RH1 semiquinone free radi-cal was observed (Fig. 2d), and this semiquinone signalwas decreased only slightly after the introduction of air(Fig. 2e). The semiquinone was likely produced byreduction of RH1 to the hydroquinone by NQO1 and asubsequent disproportionation reaction. In controlexperiments in the absence of P450 Red or NQO1, nosigniWcant EPR signals were observed.
In order to conWrm that RH1 was reduced by P450Red and to examine the rate of reduction of the qui-none and re-oxidation of the semiquinone and hydro-quinone, we studied reduction of this agent by P450Red and NQO1 using a spectroscopic assay to followloss of the electron donor, NADPH. NADPH canserve as an electron donor for both P450 Red andNQO1. Although there was an overlap of the absor-bance spectra of RH1 and NADPH, for these studieswe measured the consumption of NADPH by follow-ing the loss of absorbance at 370 nm, where approxi-mately 90% of the absorbance is due to NADPH [20].
For all the reduction studies a fourfold molar excessof NADPH was used so that the initial reduction ofRH1 and subsequent redox cycling under aerobic con-ditions could be followed. Reduction of RH1 by P450Red under hypoxia consumed approximately oneequivalent of NADPH in the Wrst 4 min with little fur-ther loss of NADPH after this time (Fig. 3), suggestingthat the RH1 was fully reduced to the hydroquinonewithin 4 min. Reduction by NQO1 resulted in loss ofapproximately one equivalent of NADPH in the Wrst2 min with little further loss of electron donor (Fig. 3).This result suggests that RH1 is reduced to the hydro-quinone by both enzymes. Under aerobic conditions,there was a loss of >90% of the NADPH by 20 minwith P450 Red, while >90% of the NADPH was goneby 40 min with NQO1. These results suggests thatredox cycling of RH1 is rapid following reduction byP450 Red, probably because the initially formed sem-iquinone is rapidly re-oxidized to the quinone in thepresence of oxygen. This Wnding is consistent with theEPR studies, which showed a rapid decrease of thesemiquinone free radical signal when air was intro-duced (Fig. 2a, b). In contrast, redox cycling of RH1was slower following reduction by NQO1 probablybecause re-oxidation of the initially formed hydroqui-none is slower than re-oxidation of the semiquinone[20]. This may explain the small EPR semiquinonesignal following reduction of RH1 by NQO1 andintroduction of air. If re-oxidation of the RH1
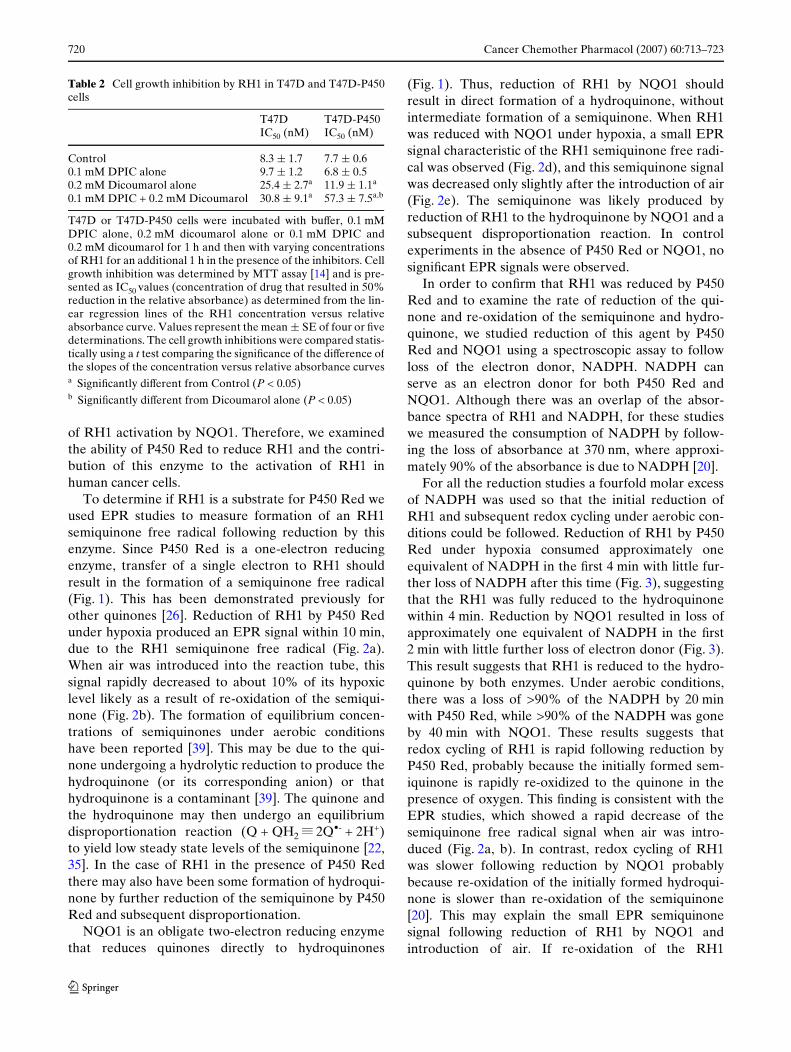
Table 2 Cell growth inhibition by RH1 in T47D and T47D-P450cells
T47D or T47D-P450 cells were incubated with buVer, 0.1 mMDPIC alone, 0.2 mM dicoumarol alone or 0.1 mM DPIC and0.2 mM dicoumarol for 1 h and then with varying concentrationsof RH1 for an additional 1 h in the presence of the inhibitors. Cellgrowth inhibition was determined by MTT assay [14] and is pre-sented as IC50 values (concentration of drug that resulted in 50%reduction in the relative absorbance) as determined from the lin-ear regression lines of the RH1 concentration versus relativeabsorbance curve. Values represent the mean § SE of four or Wvedeterminations. The cell growth inhibitions were compared statis-tically using a t test comparing the signiWcance of the diVerence ofthe slopes of the concentration versus relative absorbance curvesa SigniWcantly diVerent from Control (P < 0.05)b SigniWcantly diVerent from Dicoumarol alone (P < 0.05)
T47D IC50 (nM)
T47D-P450 IC50 (nM)
Control 8.3 § 1.7 7.7 § 0.60.1 mM DPIC alone 9.7 § 1.2 6.8 § 0.50.2 mM Dicoumarol alone 25.4 § 2.7a 11.9 § 1.1a
0.1 mM DPIC + 0.2 mM Dicoumarol 30.8 § 9.1a 57.3 § 7.5a,b
123

Cancer Chemother Pharmacol (2007) 60:713–723 721
hydroquinone to the semiquinone is slow compared tore-oxidation of the semiquinone to the quinone, therewould be little accumulation of the intermediate sem-iquinone after reduction by NQO1.
Reaction of semiquinones or hydroquinones withoxygen results in the formation of superoxide radicalanions, which can dismutate to produce H2O2 and sub-sequently hydroxyl radical by the iron-dependent Fen-ton reaction [11]. These reactive oxygen speciesproduce a variety of damage to cells, including DNAstrand breaks, that can lead to cell death [5, 11, 19, 21].Because our studies demonstrated that redox cyclingoccurred following reduction of RH1 by P450 Red orNQO1 under aerobic conditions, we examinedwhether RH1 produced DNA strand breaks afterreduction by these enzymes using a cell free assay.RH1 produced signiWcant levels of DNA strand breaksafter reduction by either P450 Red or NQO1 underaerobic conditions (Table 1). The production of signiW-cant levels of DNA strand breaks following reductionby NQO1 was somewhat unexpected since redoxcycling was slower following reduction of RH1 byNQO1 compared with P450 Red. However, in thesestudies there may have been more redox cyclingbecause a large excess of NADPH was used and theDNA was incubated with RH1 for 2 h. Thus, DNAstrand breaks can be produced following reduction byNQO1 or P450 Red, and this damage may contributeto the cytotoxic activity of RH1 in cells.
In a control experiment we carried out the DNAstrand break experiments in a hypoxia chamber under95% nitrogen:5% carbon dioxide. In the absence ofoxygen the reduced products of RH1 would not beexpected to undergo re-oxidation and we would notexpect to see the formation of DNA strand breaks. Asexpected, the level of DNA strand breaks producedafter reduction of RH1 by either P450 Red or NQO1under hypoxia was signiWcantly reduced. This providesevidence that the DNA strand breaks produced byRH1 in air resulted from the formation of reactive oxy-gen species. The low level of DNA strand breaks thatwe observed under hypoxia may have been due to theintroduction of small amounts of oxygen when thereagents for the assay were brought into the hypoxiachamber 0.5 h prior to the start of the reductions.Alternatively, some DNA strand breaks may haveresulted from the alkylation of DNA bases by RH1.
Although it had been shown previously that reduc-tion of RH1 by NQO1 results in activation of the aziri-dine groups and formation of DNA crosslinks [4, 7],there has been no previous data showing that reductionby P450 Red would produce DNA crosslinks. We foundthat RH1 did produce signiWcant DNA crosslinking
following reduction by P450 Red (Table 1). This result,along with the Wnding that RH1 can produce DNAstrand breaks after reduction by P450 Red, suggeststhat P450 Red could contribute to the activation ofRH1 and to the cytotoxic activity of this agent.
To determine if P450 Red does contribute to RH1 acti-vation in cells, we investigated the eVects of DPIC, aninhibitor of P450 Red, and dicoumarol, an inhibitor ofNQO1, on the cell growth inhibition activity of RH1 inT47D human breast carcinoma cells and T47D-P450 cells.P450 Red activity was approximately 30-fold higher inT47D-P450 cells compared with the parental T47D cellsand approximately Wve-fold higher than the highestactivity normally found in tumor cells. P450 Red activi-ties in the human tumor cell line panel used by NCI forevaluation of new anticancer agents ranged from approxi-mately 2.5–63 nmol min¡1 mg prot¡1 with a mean of14.8 nmol min¡1 mg prot¡1 [9]. Incubation of the cellswith 0.1 mM DPIC for 1 or 2 h decreased P450 Red activ-ity by 94% in both cell lines (Fig. 5). NQO1 activities inthe T47D and T47D-P450 cells were similar and were rel-atively low compared with cell lines in the NCI humantumor cell line panel that had NQO1 activities rangingfrom approximately 0–5,000 nmol min¡1 mg prot¡1 with amean of 199.5 nmol min¡1 mg prot¡1 [9]. DPIC did notsigniWcantly inhibit the activity of NQO1 in either cellline.
Dicoumarol acts as an excellent inhibitor of NQO1at low concentrations, but may also inhibit P450 Redactivity at higher concentrations. However, becausedicoumarol acts as a competitive inhibitor of bothenzymes, it is not possible to directly measure theextent of enzyme inhibition produced by this inhibitorin cells. Thus, these eVects have been measured indi-rectly by determining the eVect of dicoumarol on thecytotoxicity of drugs that are speciWcally activated byNQO1 or P450 Red. Previous studies have shown that0.1 or 0.2 mM dicoumarol was suYcient to fully inhibitthe cell growth inhibition of streptonigrin, a bioreduc-tive agent whose cytotoxicity correlates with cellularNQO1 activity, in cell lines with NQO1 activities Wve-fold to 22-fold higher than those in T47D and T47D-P450 cells [31, 34]. We showed in this study that0.2 mM dicoumarol completely inhibited the cellgrowth inhibition of streptonigrin in T47D cells andmost of the cell growth inhibition of this agent inT47D-P450 cells. This suggests that the concentrationof dicoumarol used in these studies was suYcient toinhibit all of the NQO1 in the T47D and T47D-P450cells. The small amount of cell growth inhibition bystreptonigrin remaining in the T47D-P450 cells in thepresence of dicoumarol may reXect a weak ability ofP450 Red to activate streptonigrin at high enzyme
123

722 Cancer Chemother Pharmacol (2007) 60:713–723
levels. In contrast, dicoumarol did not inhibit thegrowth inhibition activity of tirapazamine in T47D orT47D-P450 Red cells. Tirapazamine is an anticanceragent whose cell growth inhibition under aerobic con-ditions correlated with 450 Red activity [24]. Theseresults suggest that the concentration of dicoumarolused in these studies was suYcient to inhibit NQO1activity in the T47 D and T47D-P450 cells, but that thisconcentration of dicoumarol did not inhibit P450 Redin these cells.
RH1 was highly eVective in inhibiting cell growth inboth T47D and T47D-P450 cells with IC50 values of8.3 § 1.7 and 7.7 § 0.6 nM, respectively. Incubation ofthe cells with DPIC alone did not signiWcantly eVectRH1 cell growth inhibition in either T47D or T47D-P450 cells (Fig. 6; Table 2). This suggests that P450Red is not a major contributor to the activation of RH1in either cell line. In contrast, incubation of the cellswith dicoumarol signiWcantly inhibited the cell growthinhibition of RH1 in both cell lines (Fig. 6; Table 2),but this eVect was greater in the T47D cells where dic-oumarol inhibited nearly all of the RH1 activity. ThisWnding conWrms previous studies showing that NQO1was the major contributor to the activation of RH1 in avariety of human tumor cell lines [8, 37, 38]. However,incubation with dicoumarol did not completely inhibitRH1 cell growth inhibition in the T47D-P450 cells sug-gesting that another enzyme may be contributing toactivation of this agent in these cells. Incubation ofT47D cells with DPIC and dicoumarol did not signiW-cantly aVect RH1 cell growth inhibition to a greaterextent than dicoumarol alone (Fig. 6; Table 2). In con-trast, incubation of T47D-P450 cells with both inhibi-tors produced signiWcantly greater inhibition of cellgrowth by RH1 than dicoumarol alone (Fig. 6;Table 2), suggesting that in the absence of NQO1 activ-ity, very high levels of P450 Red activity may be able toactivate some of the RH1.
These studies conWrmed that RH1 was a substratefor P450 Red and demonstrated that this enzyme couldactivate RH1. The rate of redox cycling after reductionof RH1 by P450 Red was faster than redox cycling fol-lowing reduction by NQO1. This probably occurredbecause redox cycling following P450 Red reductioninvolves re-oxidation of the RH1 semiquinone, whileredox cycling following NQO1 reduction involves aslower initial re-oxidation of the RH1 hydroquinone tothe semiquinone followed by re-oxidation of the sem-iquinone. This study also provided the Wrst direct evi-dence that RH1 could produce both DNA strandbreaks and DNA crosslinks after reduction by P450Red. Despite these Wndings, P450 Red did not appearto contribute signiWcantly to the activation of RH1 in
T47D cells. This is likely due to the more eYcientreduction of RH1 to the hydroquinone by NQO1.Although P450 Red did appear to play a minor role inactivating RH1 in the T47D-P450 cells, this study sup-ports previous Wndings suggesting that this enzymedoes not play a signiWcant role in activation of RH1 incancer cells with normal levels of P450 Red activity.Furthermore it suggests that P450 Red is not responsi-ble for activation of RH1 in normal hematopoetic cellswhich generally have low NQO1 activity but normallevels of P450 Red activity.
The lack of correlation between NQO1 activity andsensitivity to RH1 reported previously [36] may be dueto the fact that only very low levels of NQO1 activityare required to activate the low concentrations of RH1used to treat cells. Thus, most tumor cell lines havemore than suYcient NQO1 to activate all of the RH1used in treatment and would be expected to show simi-lar sensitivities to this drug. Alternatively, unidentiWedenzymes, in addition to NQO1, may also contribute toactivation of RH1 in cells.
References
1. Barnabé N, Zastre J, Venkataram S, HasinoV BB (2002) Def-eriprone protects against doxorubicin-induced myocyte cyto-toxicity. Free Radic Biol Med 33:266–275
2. Begleiter A, Robotham E, Leith MK (1992) Role ofNAD(P)H:(quinone acceptor) oxidoreductase (DT-diapho-rase) in activation of mitomycin C under hypoxia. Mol Phar-macol 41:677–682
3. Benson AM, Hunkeler MJ, Talalay P (1980) Increase ofNAD(P)H:quinone reductase by dietary antioxidants: possi-ble role in protection against carcinogenesis and toxicity. ProcNatl Acad Sci USA 77:5216–5220
4. Berardini MD, Souhami RL, Lee CS, Gibson NW, Butler J,Hartley JA (1993) Two structurally related diaziridinylbenzo-quinones preferentially cross-link DNA at diVerent sitesupon reduction with DT-diaphorase. Biochemistry 32:3306–3312
5. Bolton JL, Trush MA, Penning TM, Dryhurst G, Monks TJ(2000) Role of quinones in toxicology. Chem Res Toxicol13:135–160
6. Cenas N, Anusevicius Z, Nivinskas H, Miseviciene L, Sarl-auskas J (2004) Structure-activity relationships in two-elec-tron reduction of quinones. Meth Enzymol 382:258–277
7. Cummings J, Ritchie A, Butler J, Ward TH, Langdon S(2003) Activity proWle of the novel aziridinylbenzoquinonesMeDZQ and RH1 in human tumor xenografts. AnticancerRes 23:3979–3984
8. Digby T, Leith MK, Thliveris JA, Begleiter A (2005) EVect ofNQO1 induction on the antitumor activity of RH1 in humantumors in vitro and in vivo. Cancer Chemother Pharmacol56:307–316
9. Fitzsimmons SA, Workman P, Grever M, Paull K, CamalierR, Lewis AD (1996) Reductase enzyme expression across theNational Cancer Institute Tumor cell line panel: correlationwith sensitivity to mitomycin C and EO9. J Natl Cancer Inst88:259–269
123

Cancer Chemother Pharmacol (2007) 60:713–723 723
10. Fourie J, Guziec Jr F, Guziec L, Monterrosa C, Fiterman DJ,Begleiter A (2004) Structure-activity study with bioreductivebenzoquinone alkylating agents: eVects on DT-diaphorase-mediated DNA crosslink and strand break formation in rela-tion to mechanism of cytotoxicity. Cancer Chemother Phar-macol 53:191–203
11. Halliwell B, Gutteridge JMC (1999) Free radicals in biologyand medicine. Clarendon, Oxford
12. HasinoV BB, Wu X, Begleiter A, Guziec L, Guziec F, Giorgi-anni A, Yang S, Jiang Y, Yalowich JC (2006) Structure-activ-ity study of the interaction of bioreductive benzoquinonealkylating agents with DNA topoisomerase II. Cancer Che-mother Pharmacol 57:221–233
13. Hoban PR, Walton MI, Robson CN, Godden J, Stratford IJ,Workman P, Harris AL, Hickson ID (1990) DecreasedNADPH:cytochrome P¡450 reductase activity and impaireddrug activation in a mammalian cell line resistant to mitomy-cin C under aerobic but not hypoxic conditions. Cancer Res50:4692–4697
14. Johnston JB, Verburg L, Shore T, Williams M, Israels LG,Begleiter A (1994) Combination therapy with nucleosideanalogs and alkylating agents. Leukemia 8(suppl):S140–S143
15. Kim JY, West CM, Valentine H, Ward TH, Patterson AV,Stratford IJ, Roberts SA, Hendry JH (2004) Cytotoxicity ofthe bioreductive agent RH1 and its lack of interaction withradiation. Radiother Oncol 70:311–317
16. Loadman PM, Phillips RM, Lim LE, Bibby MC (2000) Phar-macological properties of a new aziridinylbenzoquinone,RH1 (2,5-diaziridinyl-3-(hydroxymethyl)-6-methyl-1,4-ben-zoquinone), in mice. Biochem Pharmacol 59:831–837
17. Malkinson AM, Siegel D, Forrest GL, Gazdar AF, Oie HK,Chan DC, Bunn PA, Mabry M, Dykes DJ, Harrison SD Jr,Ross D (1992) Elevated DT-diaphorase activity and messen-ger RNA content in human non-small cell lung carcinoma:relationship to the response of lung tumor xenografts to mito-mycin C. Cancer Res 52:4752–4757
18. Marshall RS, Paterson MC, Rauth AM (1989) DeWcient acti-vation by a human cell strain leads to mitomycin resistanceunder aerobic but not hypoxic conditions. Br J Cancer59:341–346
19. Monks TJ, Jones DC (2002) The metabolism and toxicity ofquinones, quinonimines, quinone methides, and quinone-thi-oethers. Curr Drug Metab 3:425–438
20. Nemeikaite-Ceniene A, Sarlauskas J, Anusevicius Z, Nivins-kas H, Cenas N (2003) Cytotoxicity of RH1 and related azi-ridinylbenzoquinones: involvement of activation byNAD(P)H:quinone oxidoreductase (NQO1) and oxidativestress. Arch Biochem Biophys 416:110–118
21. O’Brien PJ (1991) Molecular mechanisms of quinone cyto-toxicity. Chem Biol Interact 80:1–41
22. Ollinger K, Brunmark A (1991) EVect of hydroxy substituentposition on 1,4-naphthoquinone toxicity to rat hepatocytes. JBiol Chem 266:21496–21503
23. Pan SS, Andrews PA, Blover CJ, Bachur NR (1984) Reduc-tive activation of mitomycin C and mitomycin C metabolitecatalyzed by NADPH-cytochrome P-450 reductase and xan-thine oxidase. J Biol Chem 259:959–966
24. Patterson AV, Saunders MP, Chinje EC, Talbot DC, HarrisAL, Stratford IJ (1997) Overexpression of humanNADPH:cytochrome c (P450) reductase confers enhancedsensitivity to both tirapazamine (SR 4233) and RSU 1069. BrJ Cancer 76:1338–1347
25. Phillips AH, Langdon RG (1962) Hepatic triphosphopyra-dine nucleotide-cytochrome c reductase: isolation, character-ization, and kinetic studies. J Biol Chem 237:2652–2660
26. Powis G (1989) Free radical formation by antitumor quinon-es. Free Radic Biol Med 6:63–101
27. Riley RJ, Workman P (1992) DT-diaphorase and cancer che-motherapy. Biochem Pharmacol 43:1657–1669
28. Rockwell S, Sartorelli AC, Tomasz M, Kennedy KA (1993)Cellular pharmacology of quinone bioreductive alkylatingagents. Cancer Metastasis Rev 12:165–176
29. Ross D, Siegel D, Beall H, Prakash AS, Mulcahy RT, GibsonNW (1993) DT-diaphorase in activation and detoxiWcation ofquinones. Cancer Metastasis Rev 12:83–101
30. Seng F, Ley K (1972) Simple synthesis of 3-amino-1,2,4-ben-zotriazine 1,4-dioxide. Angew Chem Int Ed Eng 11:1009–1010
31. Sharp SY, Kelland LR, Valenti MR, Brunton LA, Hobbs S,Workman P (2000) Establishment of an isogenic human co-lon tumor model for NQO1 gene expression: application toinvestigate the role of DT-diaphorase in bioreductive drugactivation in vitro and in vivo. Mol Pharmacol 58:1146–1155
32. Siegel D, Gibson NW, Preusch PC, Ross D (1990) Metabo-lism of mitomycin C by DT-diaphorase: role in mitomycin C-induced DNA damage and cytotoxicity in human colon carci-noma cells. Cancer Res 50:7483–7489
33. Strobel HW, Dignam JD (1978) PuriWcation and properties ofNADPH-cytochrome P-450 reductase. Meth Enzymol 52:89–96
34. Sun X, Ross D (1996) Quinone-induced apoptosis in humancolon adenocarcinoma cells via DT-diaphorase mediated bio-activation. Chem-Biol Interac 100:267–276
35. Swallow AJ (1982) Physical chemistry of semiquinones. In:Trumpower BL (ed) Function of quinones in energy conserv-ing systems. Academic, New York pp 59–72
36. Tudor G, Alley M, Nelson CM, Ruili, Covell DG, GutierrezP, Sausville EA (2005) Cytotoxicity of RH1: NAD(P)H:qui-none acceptor oxidoreductase (NQO1)-independent oxida-tive stress and apoptosis induction. Anti-Cancer Drugs16:381–391
37. Winski SL, Hargreaves RHJ, Butler J, Ross D (1998) A newscreening system for NAD(P)H:quinone oxidoreductase(NQO1)-directed antitumor quinones: IdentiWcation of a newaziridinylbenzoquinone, RH1, as a NQO1-directed antitu-mor agent. Clin Cancer Res 4:3083–3088
38. Winski SL, Swann E, Hargreaves RHJ, Dehn DL, Butler J,Moody CJ, Ross D (2001) Relationship betweenNAD(P)H:quinone oxidoreductase 1 (NQO1) levels in a se-ries of stably transfected cell lines and susceptibility to antitu-mor quinones. Biochem Pharmacol 61:1509–1516
39. Zhu BZ, Zhao HT, Kalyanaraman B, Frei B (2002) Metal-independent production of hydroxyl radicals by halogenatedquinones and hydrogen peroxide: an ESR spin trappingstudy. Free Radic Biol Med 32:465–473
123
Recommended