Governor’s Proposals for the 2013-14 State Budget and K-12 Education
© 2013 School Services of California, Inc.
Santa Monica-Malibu Unified
School District
Board Of Education
2013-14 Budget Update
January 17, 2013
Agenda Item D.01.
Themes for 2013 Governor’s Budget
For the first time in five years, education funding
goes up on a per-student basis – recovery starts now
The Governor’s proposed Weighted Student Formula
of 2012 is reprised as the Local Control Funding
Formula (LCFF) and redistributes funding gains
Passage of Proposition 30* provides opportunities
and options
© 2013 School Services of California, Inc.
* Schools and Local Public Safety Protection Act of 2012 (sponsored by Governor Jerry Brown)
Governor’s Proposals for the 2013-14 State Budget and K-12 Education
© 2013 School Services of California, Inc.
Education Receives More . . .
The revenue limit deficit continues to be more than 20%, but
for the first time since 2007-08 does not get larger
The Governor continues to deal with the “wall of debt,” but
does not dedicate all of the growth in Proposition 98 to this
single purpose
The Legislative Analyst’s Office (LAO) forecasts that the
Proposition 98 guarantee will grow at a 3.4% to 5.3% rate
over the next several years
© 2013 School Services of California, Inc.
The Distribution Method is Different
Along with slightly higher funding, the Governor proposes a
different method of distribution – the LCFF
Revenue limits and categorical programs are replaced by
base grants and supplemental grants over a phase-in
period
The stated goal is to focus more resources on California’s
most needy students
© 2013 School Services of California, Inc.

Governor’s Proposals for the 2013-14 State Budget and K-12 Education
© 2013 School Services of California, Inc.
Passage of Proposition 30 Provides
Opportunities and Options
The recent passage of Proposition 30 can be largely attributed to the
Governor’s leadership and the education community uniting for passage
It provides a narrow window during which further Budget cuts are avoided
and some hope of future gains is offered
But this window is a temporary solution; how we use this opportunity matters
Thus far, state and federal sources of funding have been used to buffer
those most negatively affected by the economic collapse
Now is the time to channel funding into those areas that truly make a
difference in the long term
Public education is a game changer
Now is the time for a shift in state policy toward preparation of our
children for what is sure to be a challenging future
© 2013 School Services of California, Inc.
Economics Still Rule
State policy is important, but the revenues that give the state options are
driven by economics
The economy is no longer shrinking, but it is not growing at a recovery rate
Employment numbers are still fragile
Both the state and federal governments face ongoing economic
challenges
The state has choices
Wait and hope for recovery?
Take actions that drive the recovery?
The Governor is trying to drive change
Many of the problems we see are international, structural, and long term
This economy is fragile and we need to treat it gently
© 2013 School Services of California, Inc.
Governor’s Proposals for the 2013-14 State Budget and K-12 Education
© 2013 School Services of California, Inc.
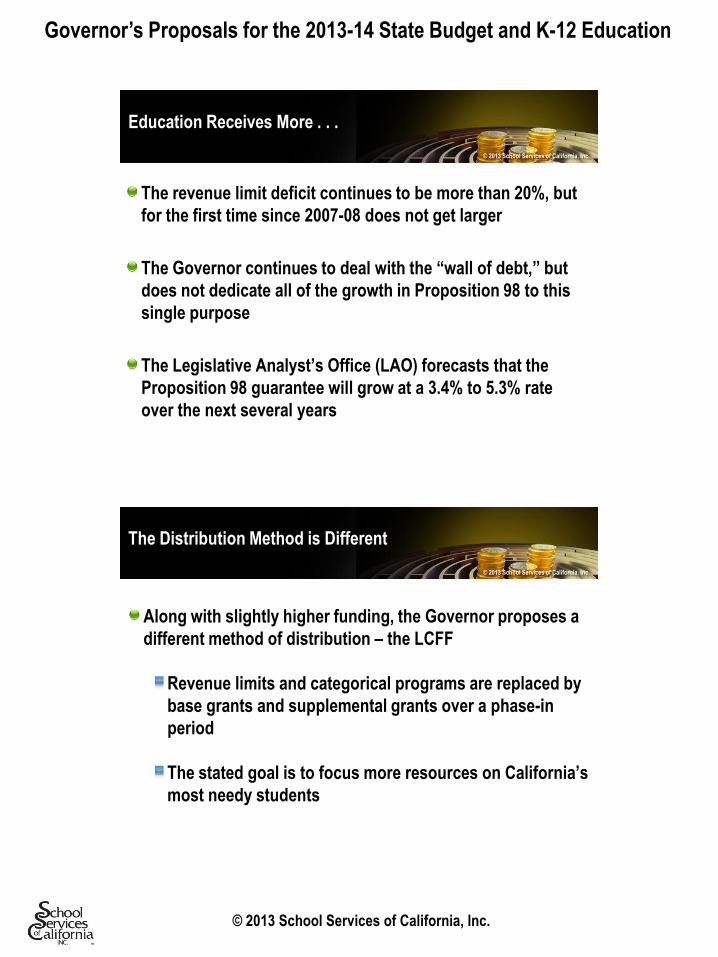
More Funding Leads to Higher Expectations
The first increase in per-student funding in five years creates higher
expectations
Funding is still about 10% less than the amount received in 2007-08
The deficit factor is still more than 20% because of past cuts and
unpaid cost-of-living adjustments (COLAs)
But pent-up demand for dollars will be strong
Under the LCFF, not all districts share equally in new dollars
As a result, it is unlikely that all expectations will be met
We are still at the beginning of a turnaround, not the end
© 2013 School Services of California, Inc.
U.S. Economic Outlook
The U.S. economy continues to be plagued by slow growth, even though the
recession was officially declared over in June 2009
The threat of falling off of the so-called “fiscal cliff” – $600 billion in higher
federal taxes and spending cuts – has been avoided in large part
The Congress and the President have agreed to avoid raising taxes on all
but the top income earners
However, the payroll tax cut was allowed to expire
Still unresolved, however, are the scheduled cuts to federal programs
Global trends pose new risks
The economies of Japan and European countries are in recession and
previously growing economies of China, Brazil, and India are slowing
This threatens U.S. exports
Domestic developments are mixed
Hurricane Sandy will depress near-term growth
Housing and employment continue to improve
© 2013 School Services of California, Inc.

Governor’s Proposals for the 2013-14 State Budget and K-12 Education
© 2013 School Services of California, Inc.
California Economic Outlook
California’s economy is recovering slowly like the U.S. economy
Housing is on the upswing, with the median home price up 24% to
$341,000 from the recession low of $275,000 in 2009
However, this is still below the 2007 peak of $560,000
The state has added about 564,000 jobs of the 1.4 million that were lost in
the recession
The state’s unemployment rate dropped to 9.8% in November 2012,
compared to 7.7% for the U.S.
On average, California added about 22,300 jobs per month over the
last 12 months
California’s economy is vulnerable to the global slowdown, especially
because of its significant export sector
© 2013 School Services of California, Inc.
California’s Education Spending
$9,524
$11,305
$18,660
K-12 Education Expenditures per Average Daily Attendance (ADA) 2010-11
*Average of the five states with the highest expenditures per ADA
Source: National Education Association
California
National
Average
Top
Five
States*
© 2013 School Services of California, Inc.
Governor’s Proposals for the 2013-14 State Budget and K-12 Education
© 2013 School Services of California, Inc.
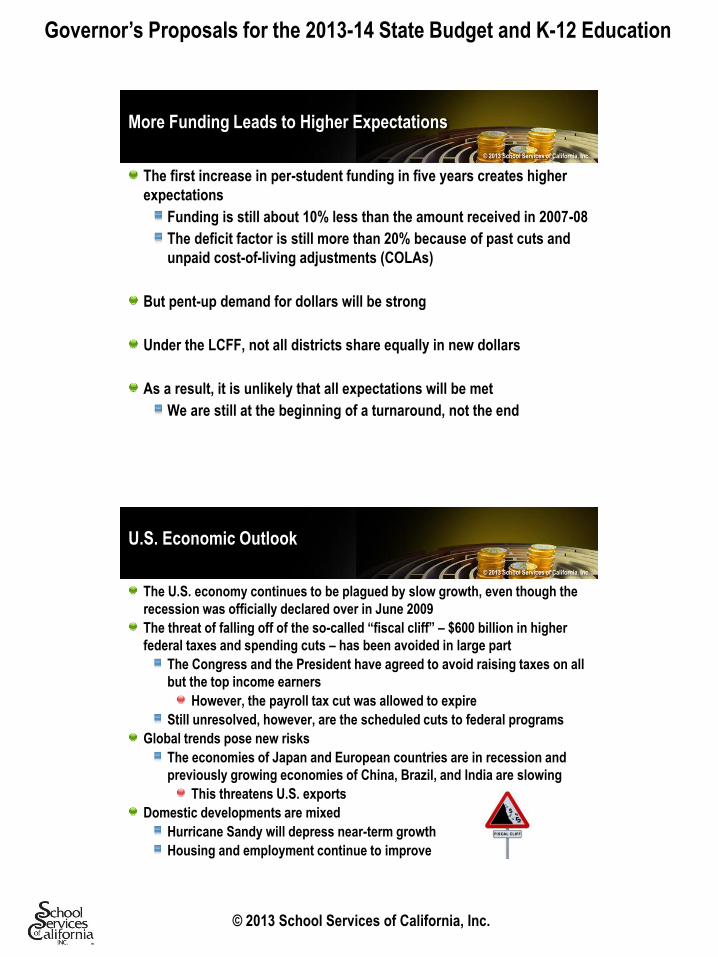
Per-ADA Revenue Volatility
0%
-15%
-10%
-5%
0%
5%
10%
15%
1999-00 2000-01 2001-02 2002-03 2003-04 2004-05 2005-06 2006-07 2007-08 2008-09 2009-10 2010-11 2011-12 2012-13 2013-14
Per-ADA Revenue Change
Average 1.5%
© 2013 School Services of California, Inc.
California Lags the Nation
California’s Schools Lag Behind Other States on a Number of Measures
California Rest
of U.S.
K-12 Spending Per Student (2010-11) $9,524 $11,305
Staffing
K-12 Students Enrolled Per Teacher (2010-11) 23.6 15.6
K-12 Students Per Administrator/Official (2009-10) 1,579 770
K-12 Students Per Guidance Counselor (2009-10) 810 459
K-12 Students Per Librarian (2009-10) 5,489 940
Note: Number of students per administrator, guidance counselor, and librarian are based on statewide enrollment
Source: NEA and National Center for Education Statistics
© 2013 School Services of California, Inc.
Governor’s Proposals for the 2013-14 State Budget and K-12 Education
© 2013 School Services of California, Inc.
Risks to the Budget Proposal
Increased funding for K-12 education is dependent upon a continued
improved economy in the state and the nation
State and national economic growth are far from certain
California tax revenues are heavily reliant (more than 60%) on personal
income taxes – making individual incomes very important to the State
Budget
Rising health care costs will continue to strain the State Budget
Outstanding budgetary borrowing totaling $35 billion will continue to limit the
amount of available resources
Other budgetary priorities could threaten resources designated for the
Governor’s Budget Proposal
© 2013 School Services of California, Inc.
One of three tests determines the level of the Proposition 98 minimum
guarantee
“Test 3” governs the guarantee in 2013-14
Test 3 increases the prior-year minimum guarantee based on percentage
changes in ADA and in state General Fund revenues
Minimum guarantee funding grows by $2.7 billion, to a total of $56.2 billion for
2013-14 – a 5% increase
$2.4 billion of Proposition 98 funding used in 2012-13 to “buy back”
interyear payment deferrals for K-12 schools and community colleges is
also available
© 2013 School Services of California, Inc.
Proposition 98 Minimum Funding Guarantee
Governor’s Proposals for the 2013-14 State Budget and K-12 Education
© 2013 School Services of California, Inc.
Revenue Limits and Local Control Funding Formula
The Governor proposes a sweeping reform of the state’s school finance
system with the LCFF
The Governor’s Budget makes no reference to current law and revenue limit
funding
There is no direct reference to the statutory COLA
However, the Budget acknowledges providing a 1.65% COLA for
selected categorical programs and sufficient funding to increase
support for LEAs by 4.5% under the LCFF
There is no reference to the current 22.272% deficit factor
Nevertheless, until state law is changed, revenue limits are the means by
which state apportionment aid is distributed to LEAs statewide
© 2013 School Services of California, Inc.
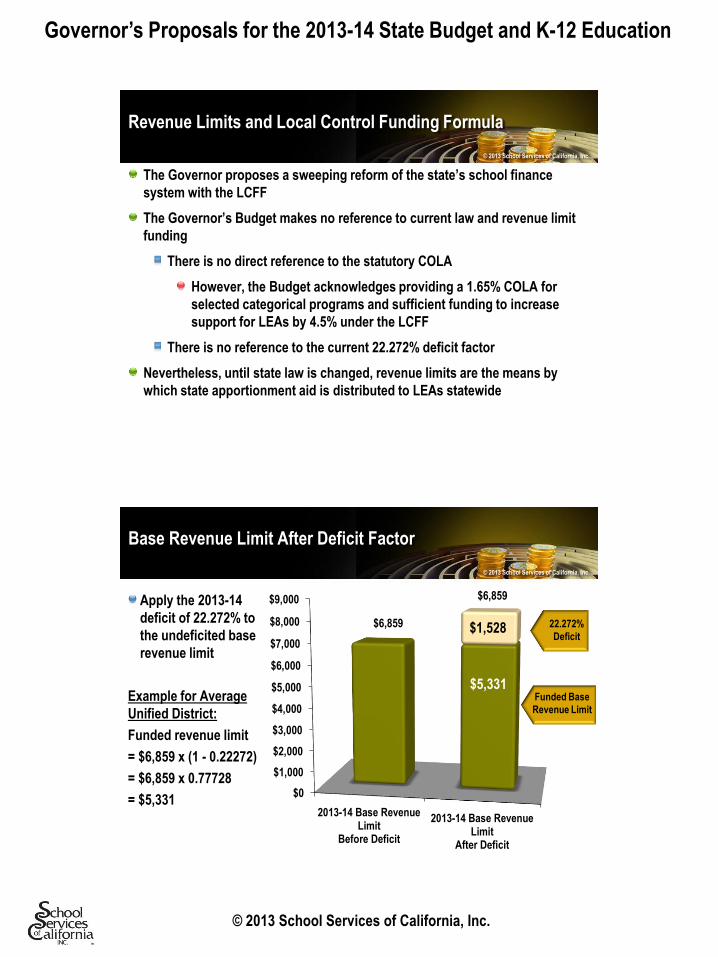
Base Revenue Limit After Deficit Factor
$0
$1,000
$2,000
$3,000
$4,000
$5,000
$6,000
$7,000
$8,000
$9,000
2013-14 Base RevenueLimit
Before Deficit
2013-14 Base RevenueLimit
After Deficit
$6,859
$6,859
$1,528
Funded Base
Revenue Limit
$5,331
Apply the 2013-14
deficit of 22.272% to
the undeficited base
revenue limit
Example for Average
Unified District:
Funded revenue limit
= $6,859 x (1 - 0.22272)
= $6,859 x 0.77728
= $5,331
22.272%
Deficit
© 2013 School Services of California, Inc.
Governor’s Proposals for the 2013-14 State Budget and K-12 Education
© 2013 School Services of California, Inc.
Major LCFF Elements
The LCFF would replace revenue limits and most categorical program funding
Funding allocated through the formula would generally be flexible and
could be used for any educational purpose
Elements of the proposed formula
A base grant target equal to the undeficited statewide average base
revenue limit per ADA – $6,816 (includes the 1.65% statutory COLA)
Differential adjustments for early primary, primary, middle, and high
school grade spans; added funding for K-3 Class-Size Reduction (CSR)
and 9-12 Career Technical Education (CTE)
Additional funding based on the demographics of the schools, including:
English Learner population
Pupils eligible for free and reduced-price meals
Foster youth
© 2013 School Services of California, Inc.
LCFF and Categorical Programs
Elements of the formula (continued):
Special Education, Child Nutrition, QEIA, After School Education
and Safety (ASES), and other federally mandated programs are not
included in the formula
Transportation and Targeted Instructional Improvement Grant (TIIG)
funding continue as add-ons to the formula for those school districts
that currently receive funding through these programs
And the funds can be used for any educational purpose
Timeline: Phased in over seven years – completed in 2020-21
© 2013 School Services of California, Inc.
Governor’s Proposals for the 2013-14 State Budget and K-12 Education
© 2013 School Services of California, Inc.
How Much Is Funded?
Fully funding the new formula in 2013-14 would cost more than $15
billion
Governor’s Proposal sets aside $1.6 billion
A 10% proration factor provides a reasonable estimate, but as more
details about the proposal emerges the estimates could change
Department of Finance staff expect to provide estimates of LEA
funding under the Governor’s Proposal within the next few weeks
Most categorical funds are kept in the base, but programs go away
© 2013 School Services of California, Inc.
Where Does the Proposal Stand Now?
There are currently insufficient details to allow a school
district to determine its funding under implementation of the
LCFF for 2013-14, or for any year thereafter
The Legislature must enact this measure as a change to
current school finance statutes
We will provide more information as the details of this
proposal are released
© 2013 School Services of California, Inc.

Governor’s Proposals for the 2013-14 State Budget and K-12 Education
© 2013 School Services of California, Inc.
Budget Contingency Plan
The Governor’s Budget assumes that his new LCFF is passed in the
Legislature
There is much to learn about the LCFF proposal, and it is uncertain what
would happen to the resources dedicated to the proposal if it does not pass
the Legislature
This leaves schools in a position of needing at least two plans
Governor Brown’s Proposal: Increased funding – 1.65% COLA plus
additional revenues associated with the factors in the LCFF
A budget for 2013-14 that includes the COLA, less the additional revenues
associated with the LCFF
Districts will need to plan for both eventualities until the details and the fate of
the LCFF becomes clear
© 2013 School Services of California, Inc.
Road to Adoption
As is true every year, the Governor’s Budget Proposals mark the
beginning – not the end – of the process
Both houses of the Legislature will consider the financial and
policy implications of the Governor’s plan
Over the next several months, we will hear reasons for both
support and resistance to the Proposal on either a financial or
policy basis
Governors, including this one, have modified or even dropped
proposals they strongly support in order to achieve a greater goal
The May Revision will surely be different than the economic picture
upon which the Budget is based – will it be better or worse?
© 2013 School Services of California, Inc.

Governor’s Proposals for the 2013-14 State Budget and K-12 Education
© 2013 School Services of California, Inc.
Questions?
Recommended