Satellite observation of atmospheric dust
Taichu Y. TanakaMeteorological Research Institute, Japan Meteorological Agency
11 April 2017, SDS‐WAS: Dust observation and modeling @WMO, Geneva

Dust observations by satelliteSatellite observations are powerful tools for monitoringand data assimilation of atmospheric dust.
Pros• Wide coverage of horizontal area Enable observations where human observer can go/maintain
• High temporal resolution (geostationary)
Cons• Cannot observe dust under clouds• Uncertainties in retrievals: quantitative observations are still difficult Especially over grounds with high reflectance (e.g., deserts!) requires validations with ground observations!
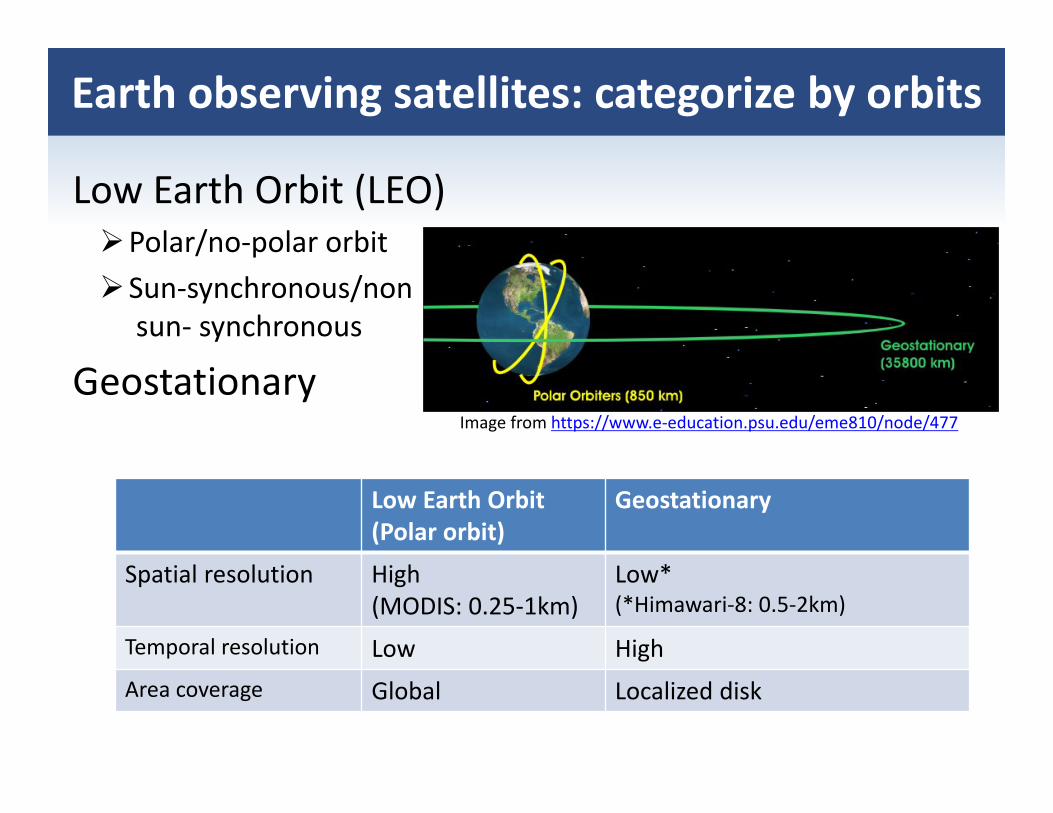
Earth observing satellites: categorize by orbits
Low Earth Orbit (LEO)Polar/no‐polar orbitSun‐synchronous/non
sun‐ synchronous
Geostationary
Low Earth Orbit(Polar orbit)
Geostationary
Spatial resolution High(MODIS: 0.25‐1km)
Low*(*Himawari‐8: 0.5‐2km)
Temporal resolution Low HighArea coverage Global Localized disk
Image from https://www.e‐education.psu.edu/eme810/node/477
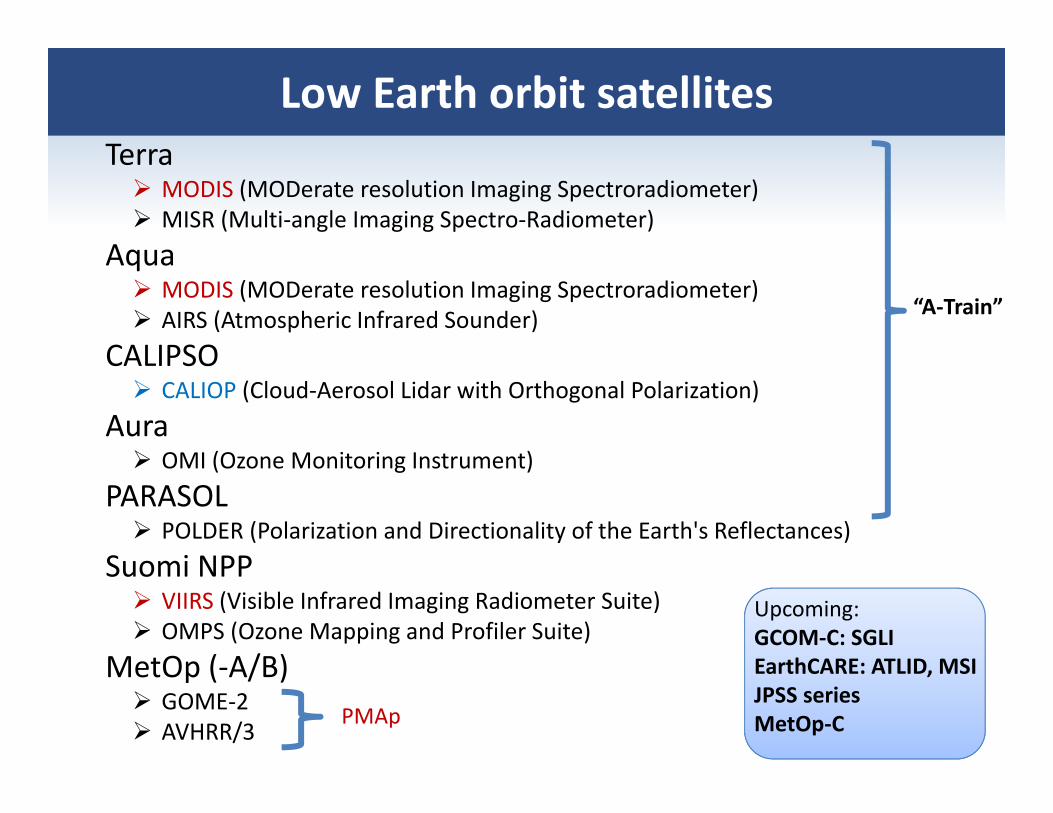
Low Earth orbit satellitesTerra MODIS (MODerate resolution Imaging Spectroradiometer) MISR (Multi‐angle Imaging Spectro‐Radiometer)
Aqua MODIS (MODerate resolution Imaging Spectroradiometer) AIRS (Atmospheric Infrared Sounder)
CALIPSO CALIOP (Cloud‐Aerosol Lidar with Orthogonal Polarization)
Aura OMI (Ozone Monitoring Instrument)
PARASOL POLDER (Polarization and Directionality of the Earth's Reflectances)
Suomi NPP VIIRS (Visible Infrared Imaging Radiometer Suite) OMPS (Ozone Mapping and Profiler Suite)
MetOp (‐A/B) GOME‐2 AVHRR/3
“A‐Train”
PMAp
Upcoming:GCOM‐C: SGLIEarthCARE: ATLID, MSIJPSS seriesMetOp‐C
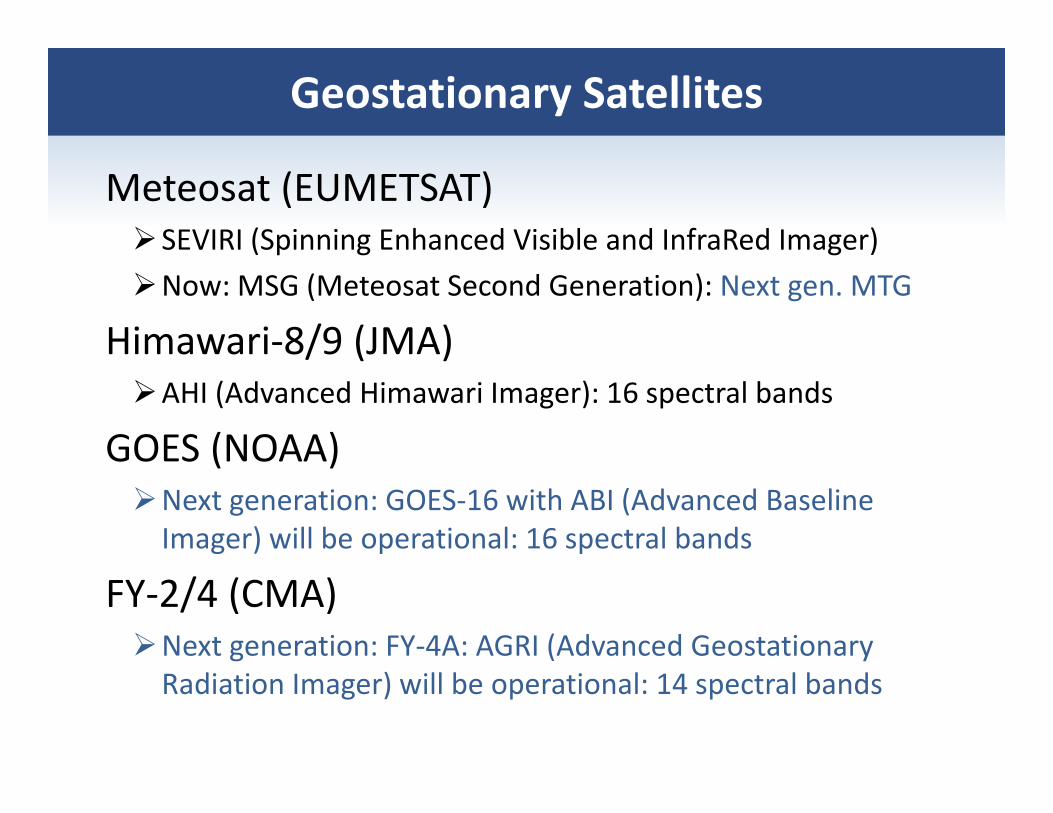
Geostationary Satellites
Meteosat (EUMETSAT)SEVIRI (Spinning Enhanced Visible and InfraRed Imager)Now: MSG (Meteosat Second Generation): Next gen. MTG
Himawari‐8/9 (JMA)AHI (Advanced Himawari Imager): 16 spectral bands
GOES (NOAA)Next generation: GOES‐16 with ABI (Advanced Baseline Imager) will be operational: 16 spectral bands
FY‐2/4 (CMA)Next generation: FY‐4A: AGRI (Advanced Geostationary Radiation Imager) will be operational: 14 spectral bands
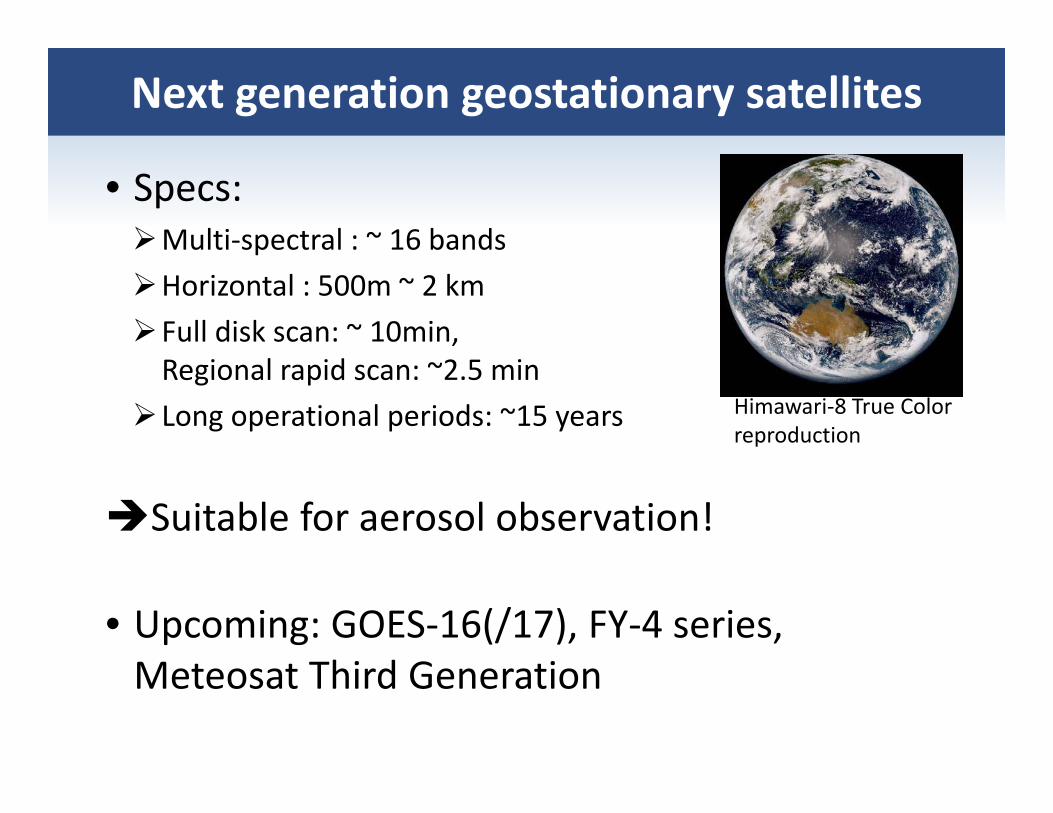
Next generation geostationary satellites
• Specs:Multi‐spectral : ~ 16 bandsHorizontal : 500m ~ 2 kmFull disk scan: ~ 10min, Regional rapid scan: ~2.5 min
Long operational periods: ~15 years
Suitable for aerosol observation!
• Upcoming: GOES‐16(/17), FY‐4 series, Meteosat Third Generation
Himawari‐8 True Colorreproduction
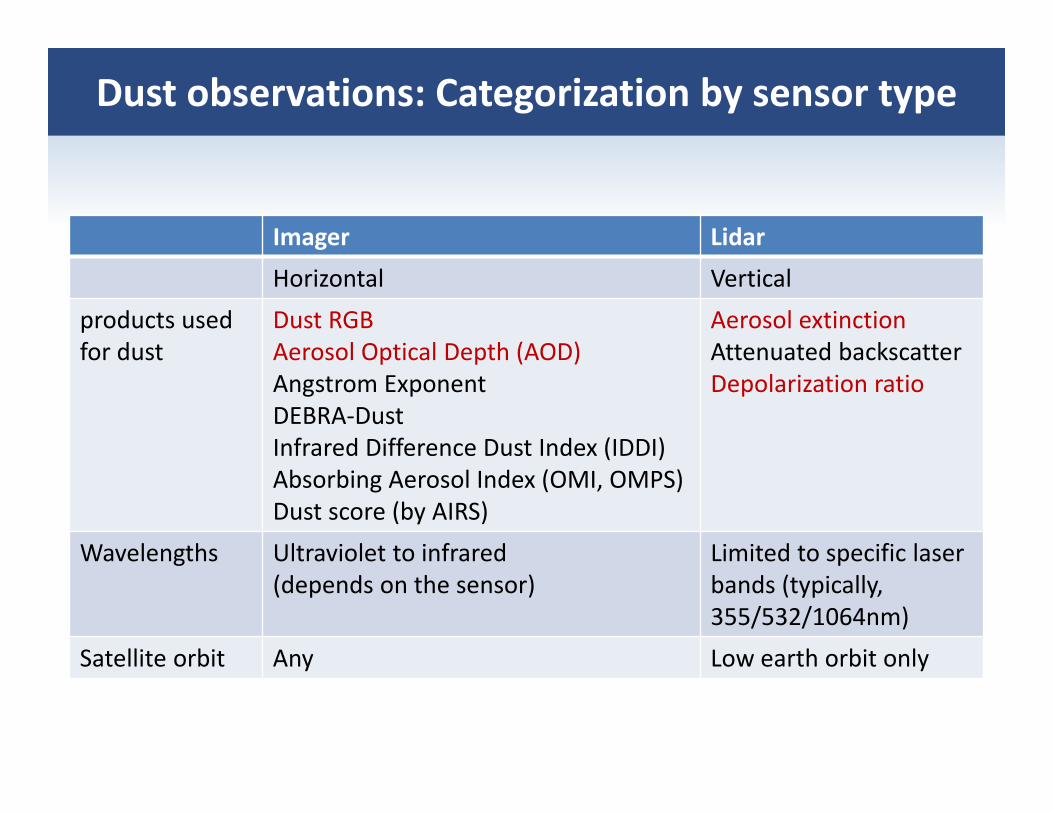
Dust observations: Categorization by sensor type
Imager LidarHorizontal Vertical
products used for dust
Dust RGBAerosol Optical Depth (AOD)Angstrom ExponentDEBRA‐DustInfrared Difference Dust Index (IDDI)Absorbing Aerosol Index (OMI, OMPS)Dust score (by AIRS)
Aerosol extinctionAttenuated backscatterDepolarization ratio
Wavelengths Ultraviolet to infrared(depends on the sensor)
Limited to specific laser bands (typically, 355/532/1064nm)
Satellite orbit Any Low earth orbit only
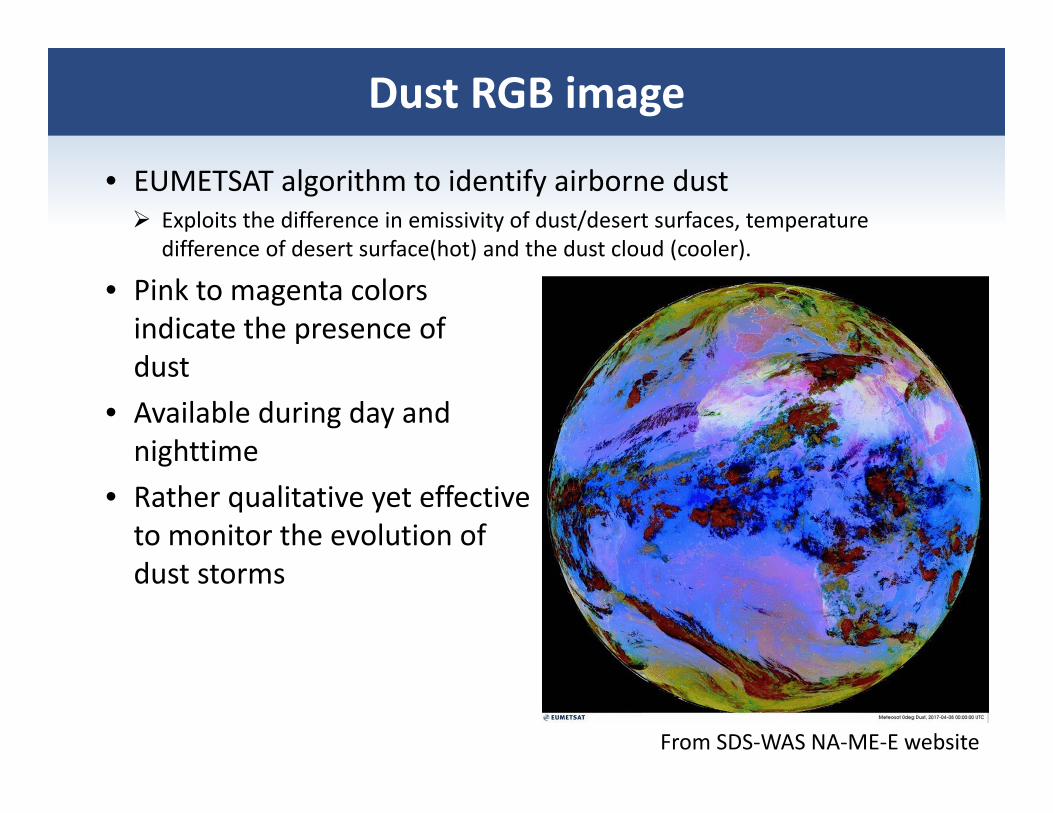
Dust RGB image
• EUMETSAT algorithm to identify airborne dust Exploits the difference in emissivity of dust/desert surfaces, temperature
difference of desert surface(hot) and the dust cloud (cooler).
• Pink to magenta colors indicate the presence of dust
• Available during day and nighttime
• Rather qualitative yet effectiveto monitor the evolution of dust storms
From SDS‐WAS NA‐ME‐E website
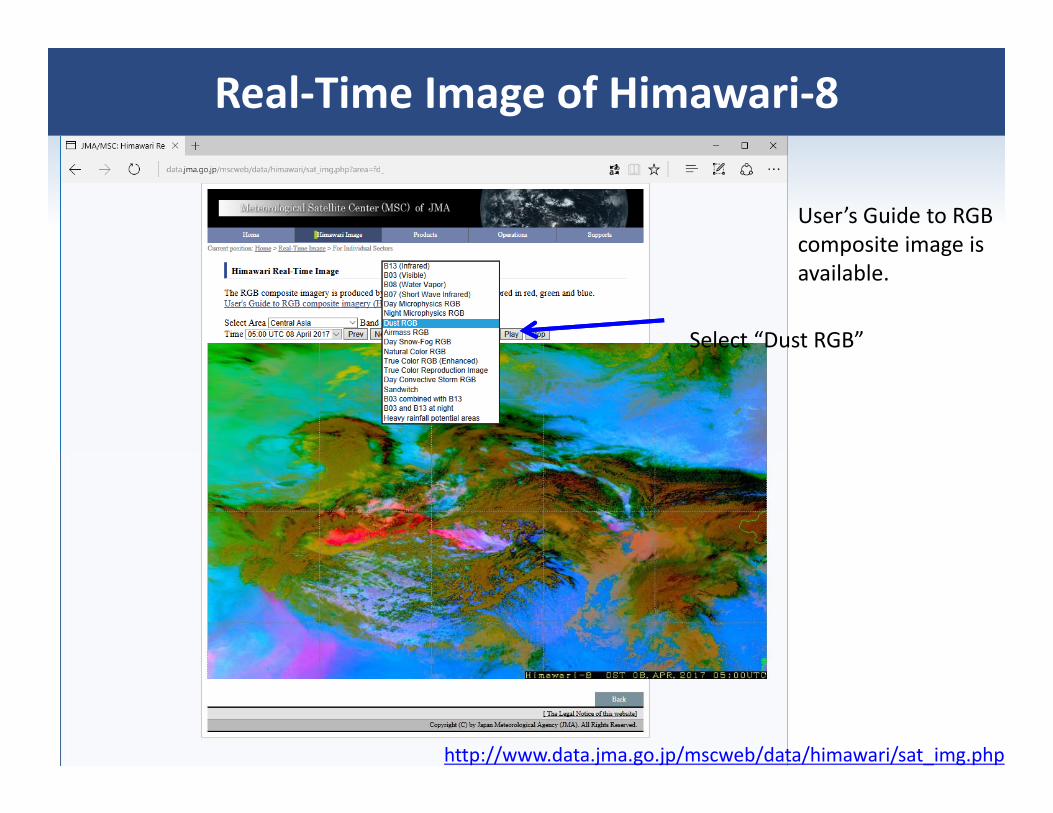
Real‐Time Image of Himawari‐8
User’s Guide to RGB composite image is available.
http://www.data.jma.go.jp/mscweb/data/himawari/sat_img.php
Select “Dust RGB”
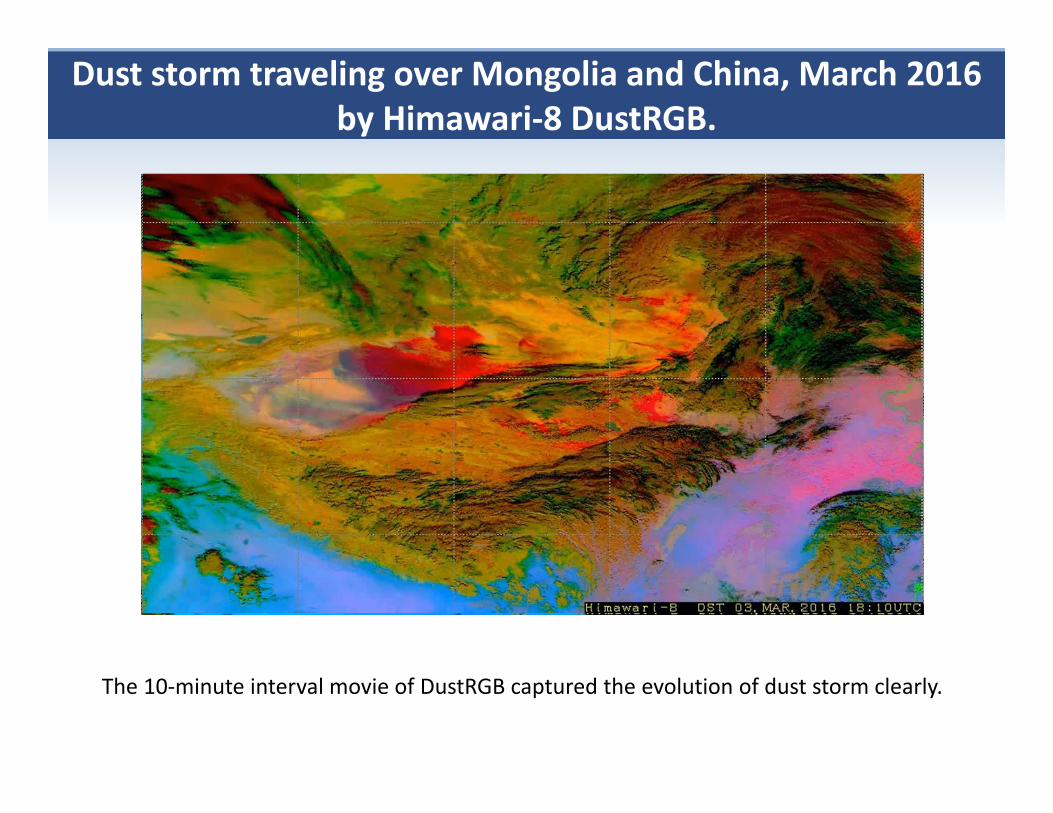
Dust storm traveling over Mongolia and China, March 2016 by Himawari‐8 DustRGB.
The 10‐minute interval movie of DustRGB captured the evolution of dust storm clearly.
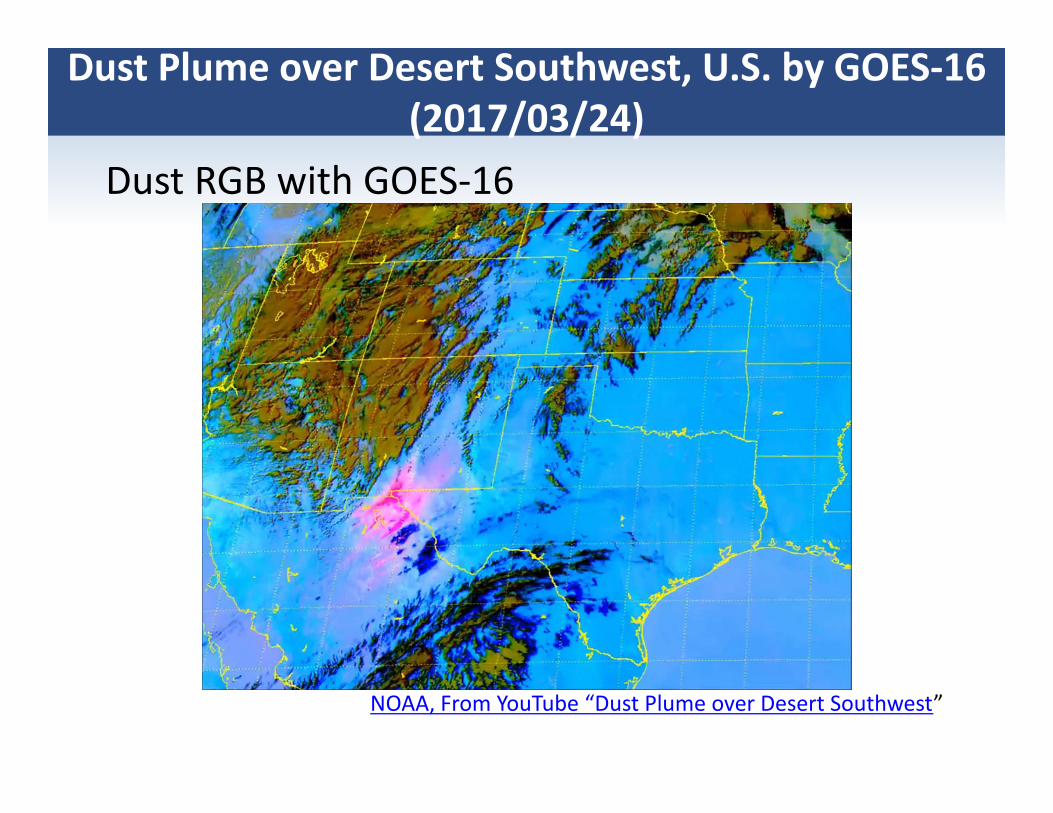
Dust Plume over Desert Southwest, U.S. by GOES‐16 (2017/03/24)
NOAA, From YouTube “Dust Plume over Desert Southwest”
Dust RGB with GOES‐16
Aerosol Optical Depth
• Quantitative value of the total aerosol (not only dust) in the atmospheric columnUsed for aerosol monitoring and data assimilationDust detection may be difficult (but can be guessed from fine and coarse mode AOD)
• Available during daytime only (most cases)
Currently available AOD products
• MODIS (Collection 6)Long period: 2002 ‐Most widely used for monitoring and data assimilation
• PMAp• VIIRS AOD• SEVIRI dust AOD (MSGAOD)• Himawari‐8 aerosol productComing next generation geostationary satellites (GOES‐16, FY‐4A, MTG) are expected to provide aerosol products
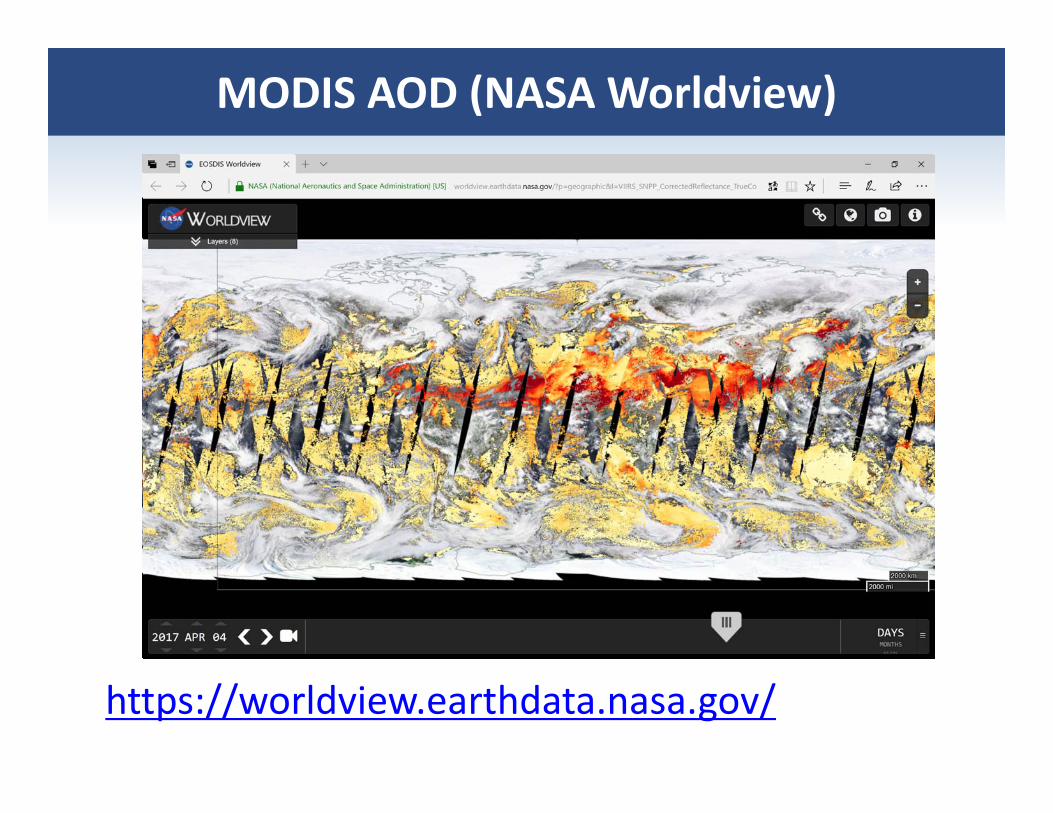
MODIS AOD (NASA Worldview)
https://worldview.earthdata.nasa.gov/
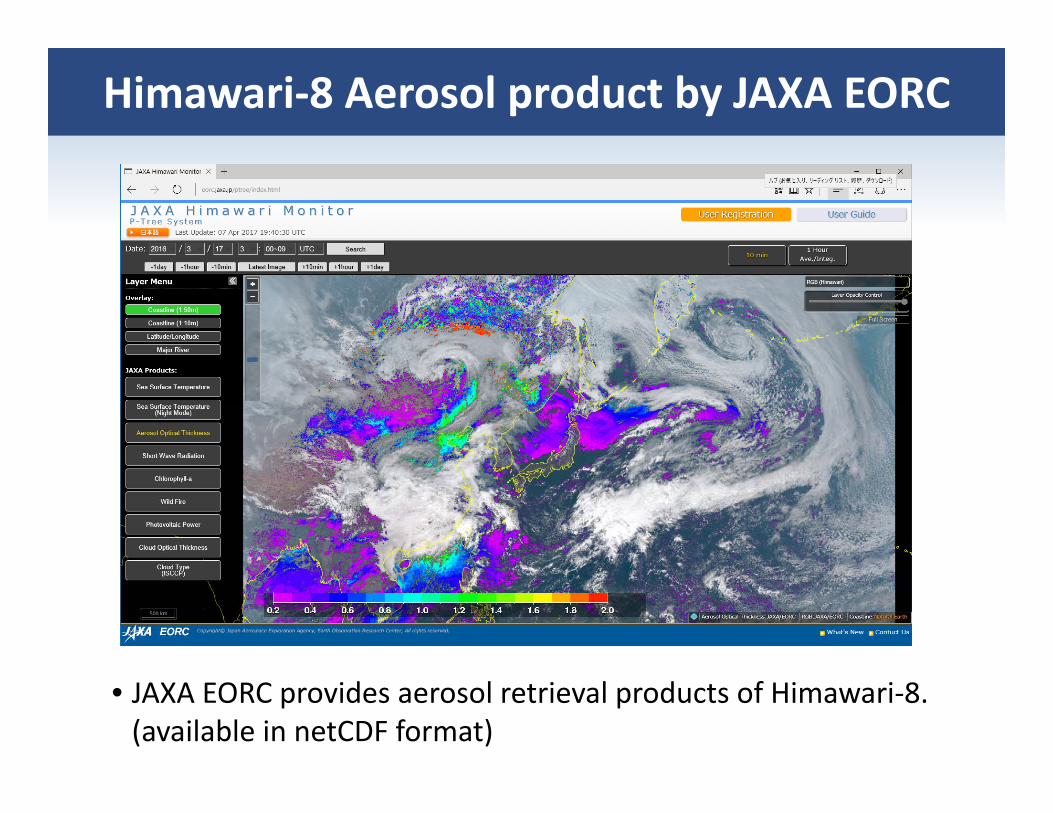
Himawari‐8 Aerosol product by JAXA EORC
• JAXA EORC provides aerosol retrieval products of Himawari‐8. (available in netCDF format)
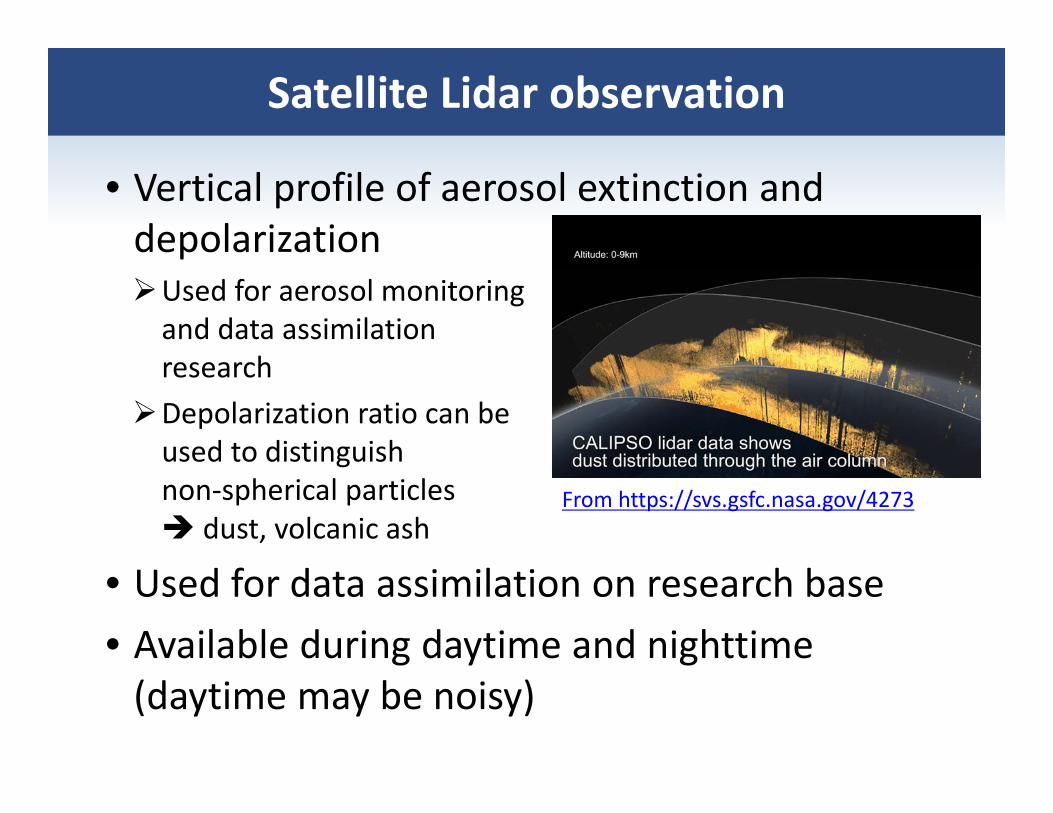
Satellite Lidar observation
• Vertical profile of aerosol extinction and depolarizationUsed for aerosol monitoring and data assimilation research
Depolarization ratio can be used to distinguish non‐spherical particles dust, volcanic ash
• Used for data assimilation on research base• Available during daytime and nighttime (daytime may be noisy)
From https://svs.gsfc.nasa.gov/4273
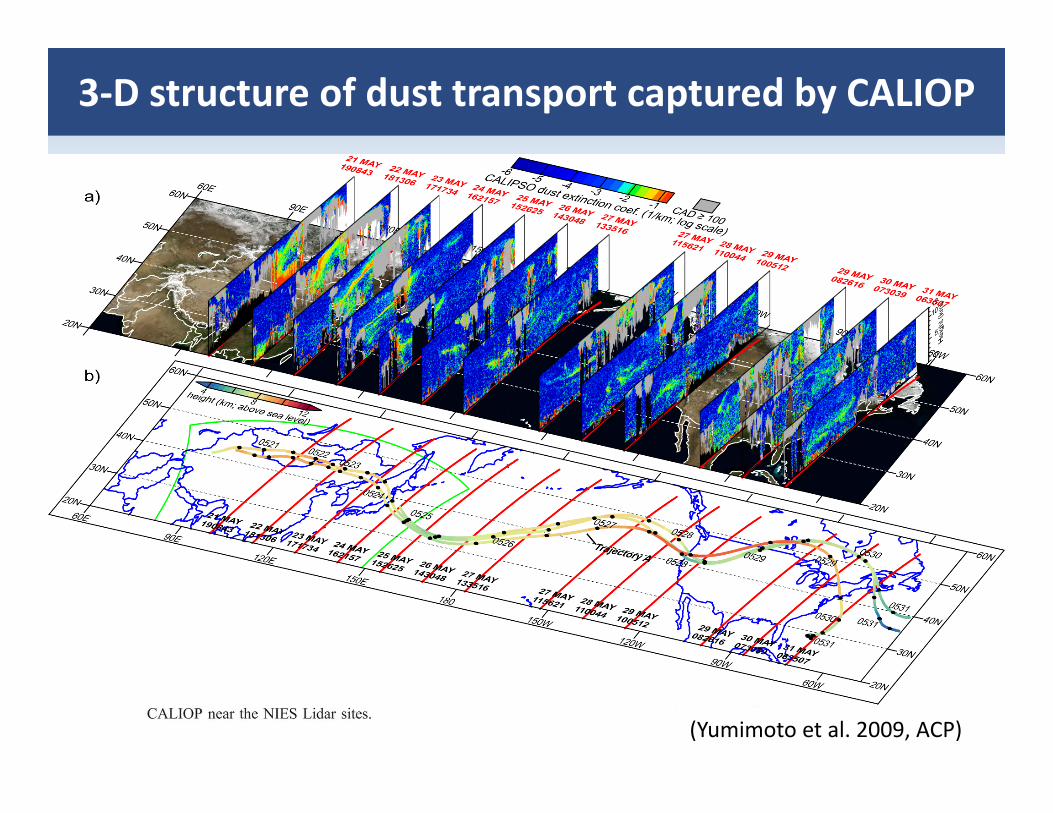
3‐D structure of dust transport captured by CALIOP
(Yumimoto et al. 2009, ACP)
Space lidar platform
Currently available• CALIOP on CALIPSO productEnd of lifetime is approaching
• CATS on International Space Station (ISS)
Future• ATLID on EarthCARE (late 2018?)
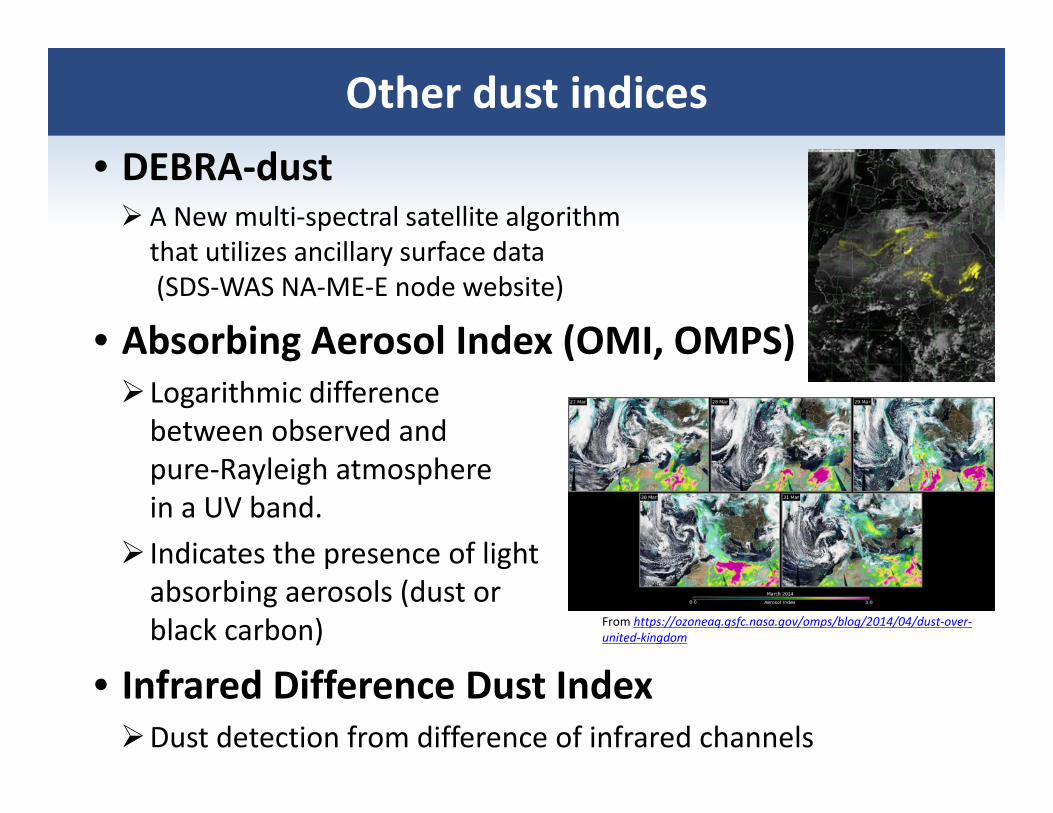
Other dust indices• DEBRA‐dust A New multi‐spectral satellite algorithm that utilizes ancillary surface data(SDS‐WAS NA‐ME‐E node website)
• Absorbing Aerosol Index (OMI, OMPS)Logarithmic difference between observed and pure‐Rayleigh atmosphere in a UV band.
Indicates the presence of light absorbing aerosols (dust or black carbon)
• Infrared Difference Dust IndexDust detection from difference of infrared channels
From https://ozoneaq.gsfc.nasa.gov/omps/blog/2014/04/dust‐over‐united‐kingdom
Useful resources of satellite observation of atmospheric dust
• SDS‐WAS NA‐ME‐E Regional Center http://sds‐was.aemet.es/forecast‐products/dust‐observations
• SDS‐WAS Asia Regional Center http://eng.nmc.cn/sds_was.asian_rc/
• NASA worldview https://worldview.earthdata.nasa.gov/
• Goddard Earth Sciences Data and Information Service Center (GES DISC) https://disc.gsfc.nasa.gov/
• JAXA Himawari Monitor: http://www.eorc.jaxa.jp/ptree/• Meteorological Satellite Center of JMA http://www.data.jma.go.jp/mscweb/data/himawari/sat_img.php
• The Regional and Mesoscale Meteorology Branch (RAMMB) of NOAA/NESDIS http://rammb.cira.colostate.edu/ramsdis/online/index.asp
• EUMETSAT http://www.eumetsat.int/website/home/index.html
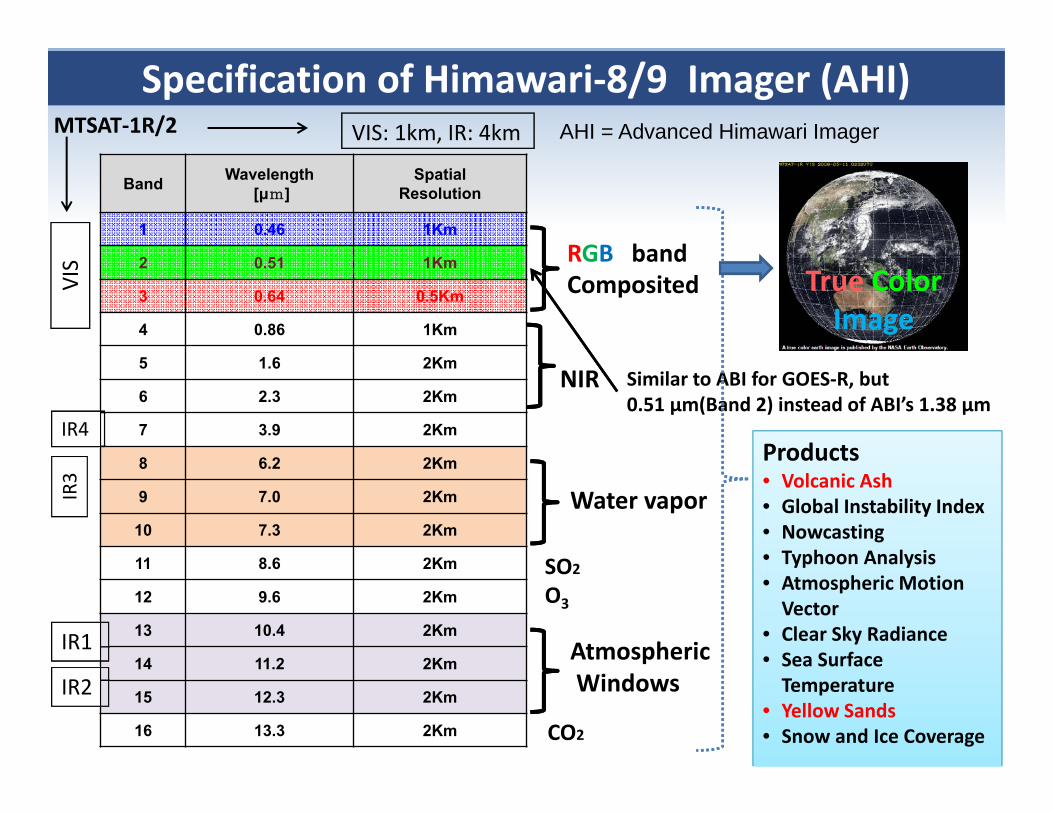
RGB bandComposited
Water vapor
AtmosphericWindows
SO2
O3
CO2
Similar to ABI for GOES‐R, but 0.51 μm(Band 2) instead of ABI’s 1.38 μm
True ColorImage
Products• Volcanic Ash• Global Instability Index• Nowcasting• Typhoon Analysis• Atmospheric Motion Vector
• Clear Sky Radiance • Sea Surface Temperature
• Yellow Sands• Snow and Ice Coverage
Band Wavelength[μm]
SpatialResolution
1 0.46 1Km
2 0.51 1Km
3 0.64 0.5Km
4 0.86 1Km
5 1.6 2Km
6 2.3 2Km
7 3.9 2Km
8 6.2 2Km
9 7.0 2Km
10 7.3 2Km
11 8.6 2Km
12 9.6 2Km
13 10.4 2Km
14 11.2 2Km
15 12.3 2Km
16 13.3 2Km
AHI = Advanced Himawari Imager
Specification of Himawari‐8/9 Imager (AHI)
NIR
VIS
IR1
IR2
IR3
IR4
MTSAT‐1R/2 VIS: 1km, IR: 4km
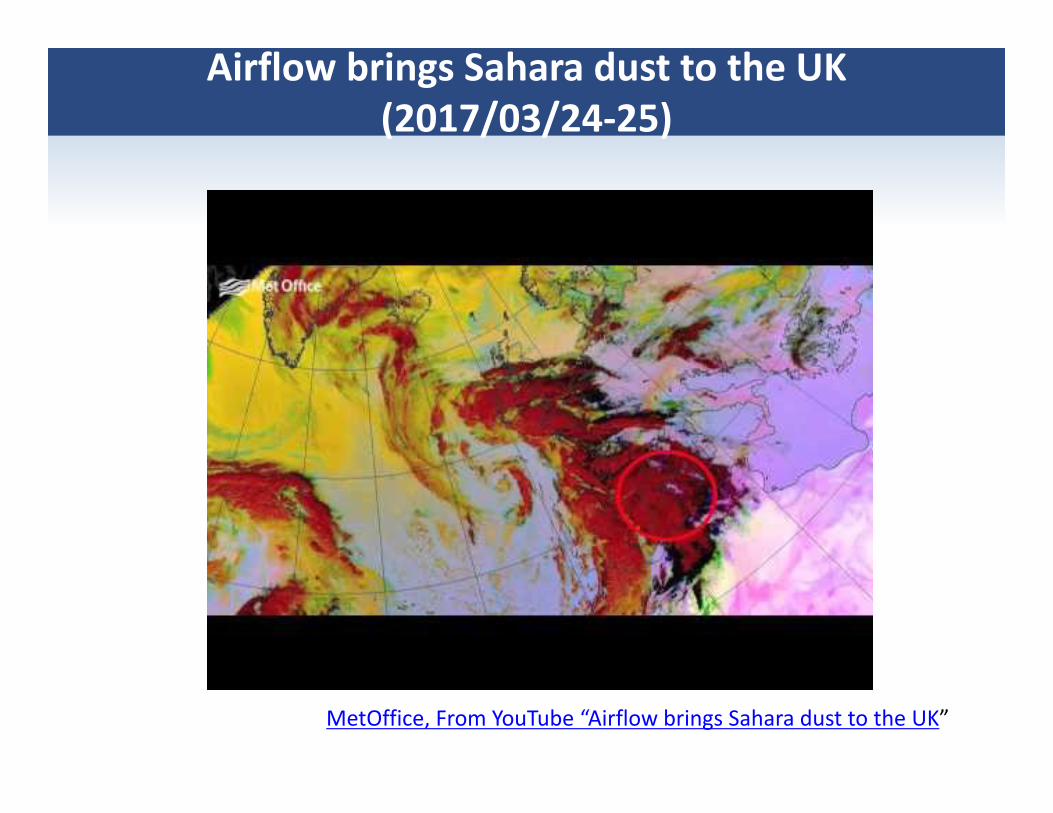
Airflow brings Sahara dust to the UK (2017/03/24‐25)
MetOffice, From YouTube “Airflow brings Sahara dust to the UK”
Recommended